Article

Chemical Composition of Various Nepeta cataria Plant Organs’ Methanol Extracts Associated with In Vivo Hepatoprotective and Antigenotoxic Features as well as Molecular Modeling Investigations

1
Department of Chemistry, Faculty of Science, University of Kragujevac, Radoja Domanovića 12, 34000 Kragujevac, Serbia
2
Kragujevac Center for Computational Biochemistry, Department of Chemistry, Faculty of Science, University of Kragujevac, Radoja Domanovića 12, 34000 Kragujevac, Serbia
3
Department of Science, Institute for Information Technologies Kragujevac, University of Kragujevac, Jovana Cvijića bb, 34000 Kragujevac, Serbia
4
Department of Biology and Ecology, Faculty of Science, University of Kragujevac, Radoja Domanovića 12, 34000 Kragujevac, Serbia
5
Rome Center for Molecular Design, Department of Drug Chemistry and Technology, Faculty of Pharmacy and Medicine, Sapienza University of Rome, Piazzale Aldo Moro 5, 00185 Rome, Italy
6
Faculty of Science and Mathematics, University of Montenegro, Džordža Vašingtona bb, 81000 Podgorica, Montenegro
7
Institute of Horticulture, Faculty of Horticulture and Landscape Engineering, Slovak University of Agriculture in Nitra, Tr. A. Hlinku 2, 94976 Nitra, Slovakia
8
Department of Bioenergy, Food Technology and Microbiology, Institute of Food Technology and Nutrition, University of Rzeszow, 4 Zelwerowicza St., 35601 Rzeszow, Poland
*
Author to whom correspondence should be addressed.
Plants 2022, 11(16), 2114; https://doi.org/10.3390/plants11162114
Submission received: 6 May 2022 / Revised: 27 July 2022 / Accepted: 11 August 2022 / Published: 14 August 2022
(This article belongs to the Special Issue Pharmacological and Toxicological Study of Medicinal Plants)

Abstract

:
This report summarizes the chemical composition analysis of Nepeta cataria L. flower, leaf, and stem methanol extracts (FME, LME, SME, respectively) as well as their hepatoprotective and antigenotoxic features in vivo and in silico. Herein, Wistar rat liver intoxication with CCl4 resulted in the generation of trichloromethyl and trichloromethylperoxy radicals, causing lipid peroxidation within the hepatocyte membranes (viz. hepatotoxicity), as well as the subsequent formation of aberrant rDNA adducts and consequent double-strand break (namely genotoxicity). Examined FME, LME, and SME administered orally to Wistar rats before the injection of CCl4 exerted the most notable pharmacological properties in the concentrations of 200, 100, and 50 mg/kg of body weight, respectively. Thus, the extracts’ hepatoprotective features were determined by monitoring the catalytic activities of enzymes and the concentrations of reactive oxidative species, modulating the liver redox status. Furthermore, the necrosis of hepatocytes was assessed by means of catalytic activities of liver toxicity markers. The extracts’ antigenotoxic features were quantified using the comet assay. Distinct pharmacological property features may be attributed to quercitrin (8406.31 μg/g), chlorogenic acid (1647.32 μg/g), and quinic acid (536.11 μg/g), found within the FME, rosmarinic acid (1056.14 μg/g), and chlorogenic acid (648.52 μg/g), occurring within the LME, and chlorogenic acid (1408.43 μg/g), the most abundant in SME. Hence, the plant’s secondary metabolites were individually administered similar to extracts, upon which their pharmacology in vivo was elucidated in silico by means of the structure-based studies within rat catalase, as a redox marker, and rat topoisomerase IIα, an enzyme catalyzing the rat DNA double-strand break. Conclusively, the examined N. cataria extracts in specified concentrations could be used in clinical therapy for the prevention of toxin-induced liver diseases.

Graphical Abstract

1. Introduction

Nepeta represents a large genus belonging to the Lamiaceae family, subfamily Nepetoideae, and tribe Mentheae [1]. This genus comprises about 300 species, the majority of which are aromatic plants [2,3]. Several species of this genus have been reported to possess medicinal properties such as diuretic, sedative diaphoretic, antispasmodic, antiasthmatic, expectorant, febrifuge, antitumor, antibacterial, antifungal, and emmenagogue [4,5,6,7]. Previous phytochemical analyses of Nepeta revealed the presence of several bioactive phytochemicals, such as polyphenols (phenolics and flavonoids), terpenoids [3,4,7,8], iridoid and iridoid glycosides [9,10,11]. Polyphenols, i.e., naturally occurring products of plants’ secondary metabolism, have shown a broad range of biological activities such as analgesic, anti-arthritis, antimicrobial, antipyretic, anti-inflammatory, hepatoprotective, and anti-thrombotic [12,13,14]. Owing to their potential therapeutic effects on health as well as their use in the human diet, these chemical entities have drawn significant attention within the scientific community [15,16,17]. More than twenty phenolic derivatives and thirty-five flavonoids and their derivatives have been isolated from diverse Nepeta species until now [3].
Nepeta cataria L. (catnip or catmint) has long been used in traditional medicine in France, England, and regions of North America, in the form of teas and infusions, for treating nervousness, anxiety, insomnia, and symptoms related to gastrointestinal upset, including dyspepsia, cramping, and meteorism. Moreover, it is associated with a diuretic effect preventing water retention, as well as for handling arthritis, coughs, hives, fevers, and viruses [18]. Due to these properties, the plant is widely used for its antispasmodic, expectorant, diuretic, antiseptic, and antiasthmatic effects [3,7,19]. An interesting application of N. cataria is its usage in pet toys [19], given that catnip alters behavior and produces pleasurable sensations in both wild and domestic cats, as well as in other mammals [20]. A study also associated dried leaves with pleasurable experiences of catnip in humans [21].
With the fact that many of the ingested or inhaled environmental toxicants, drugs, and nutrients suffer from the first-pass effect, the liver’s function can be altered by acute or chronic exposure to hazardous chemical entities [22,23]. The biological activities and therapeutic applications of plant extracts and purified secondary metabolites have attracted attention for decades [22,23]; nevertheless, toxicological, hepatoprotective, and DNA protective studies need to be further investigated. There is a growing interest in the hepatoprotective and antigenotoxic roles of either plant-derived extracts or their isolated substances [24]. Accordingly, within this report, the hepatoprotective and antigenotoxic effects of N. cataria plant methanolic extracts were evaluated on Wistar rats exposed to carbon tetrachloride (CCl4). To the best of the authors’ knowledge, such an investigation has never been reported. The N. cataria methanolic extracts were fully characterized and found to be associated with eighteen secondary metabolites: quinic acid, phenolic acids (or their derivatives), and flavonoid aglycones (or their glycosides), which were quantified by LC-ESI-MS/MS, and their effects were investigated in vivo and interpreted by means of in silico studies.

2. Results and Discussion

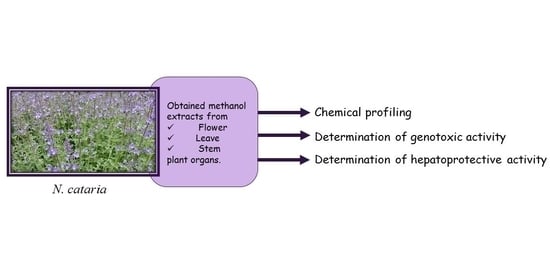
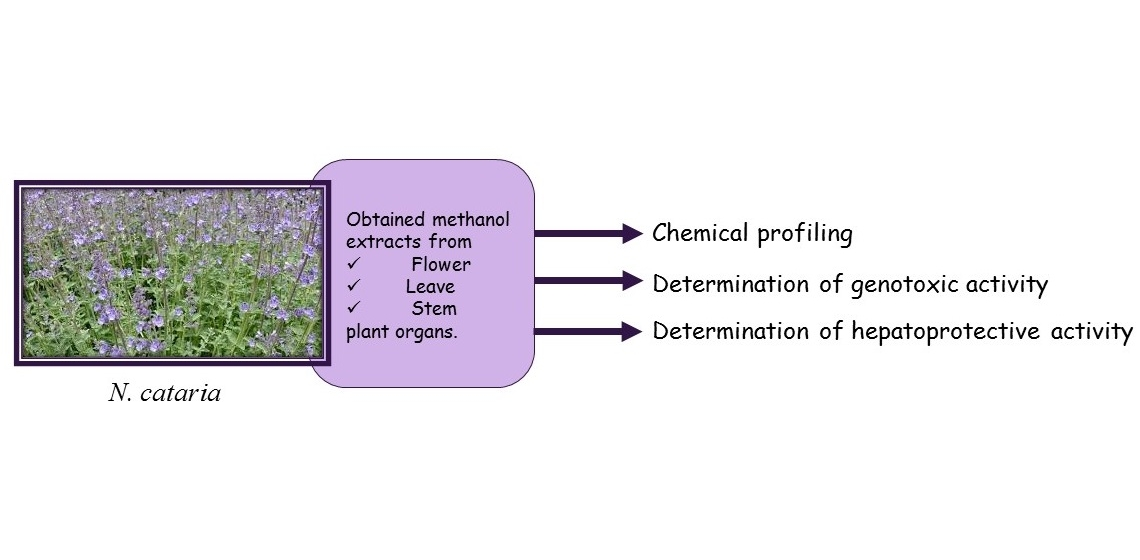
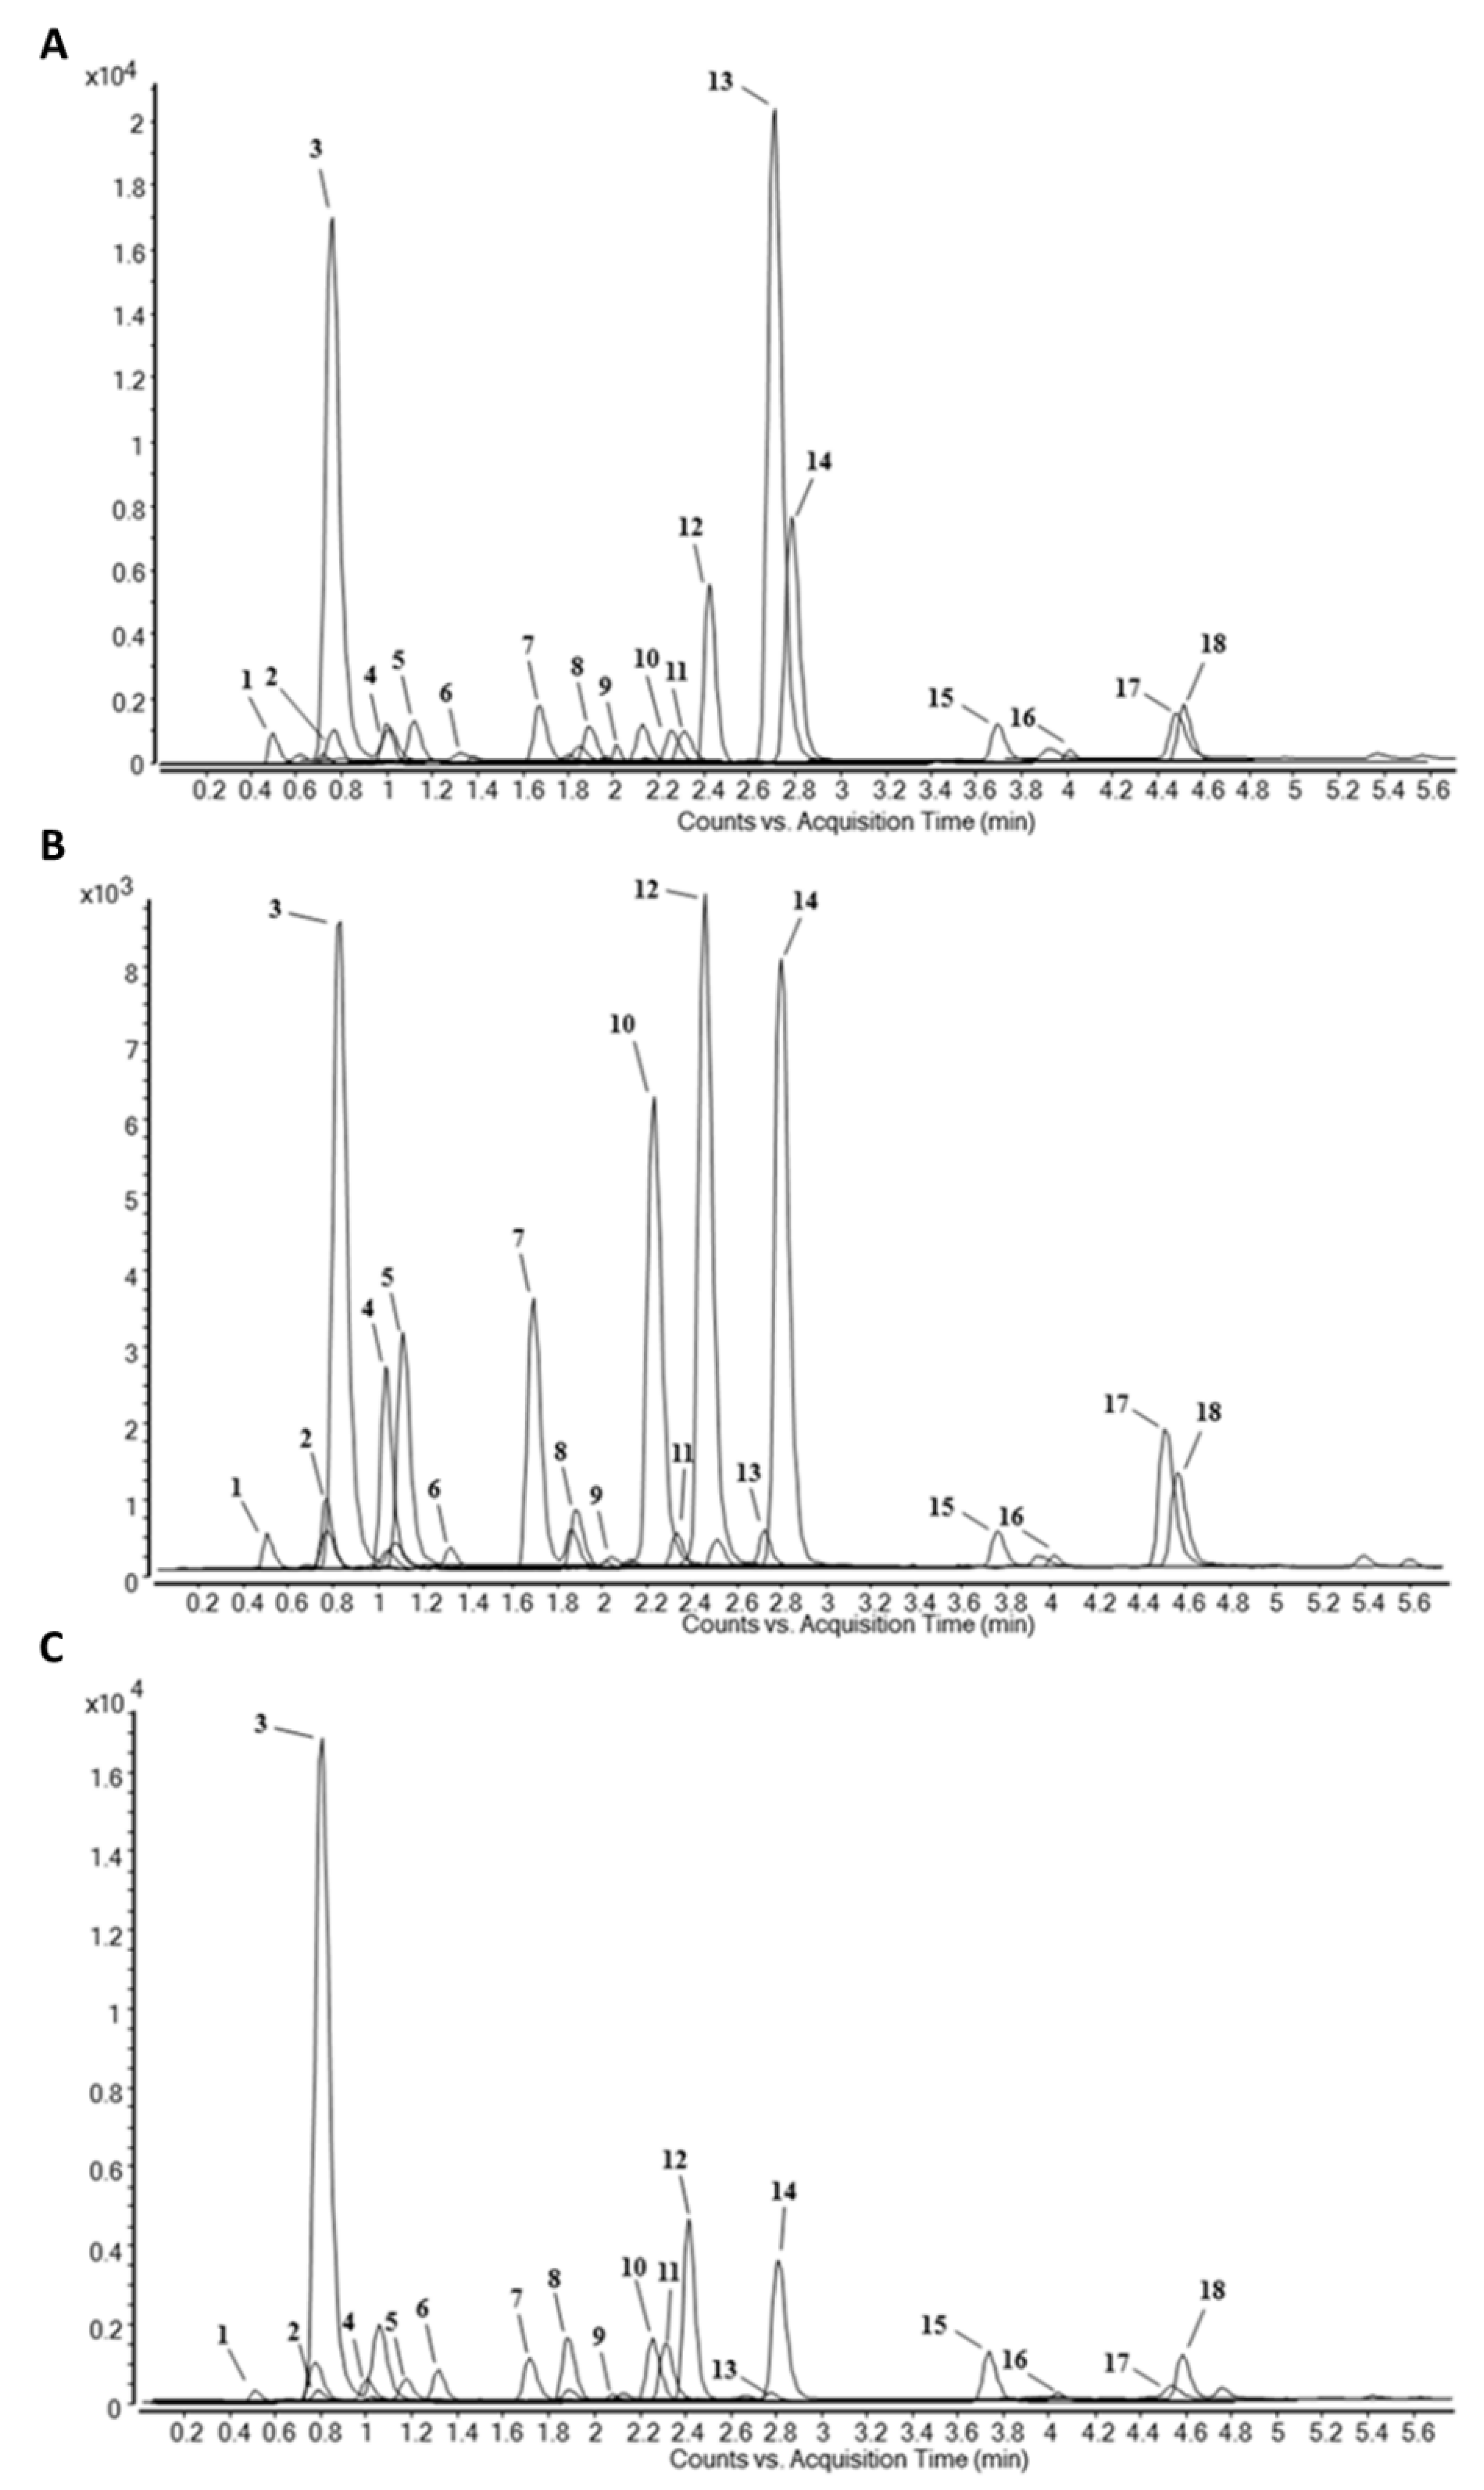
2.1. Chemical Composition of Methanol Extracts of N. cataria

In agreement with previously published qualitative composition of N. cataria aerial parts [25], seventeen phenolic compounds and the quinic acid (an intermediate in plant phenolics biosynthesis), were selected as standards (Table 1) for the quantitative investigation of flower (FME), leaf (LME), and stem (SME) methanol extracts (Figure 1A–C, respectively) by means of LC-ESI-MS/MS analysis. The compounds concentrations, expressed as μg of compound per g of extract, were determined from the standards’ calibrated curves, prepared by means of a double dilution method (50.00 to 0.00153 μg/mL). The results of the qualitative and quantitative analyses showed that all the used standards were found in the different aerial part plant extract samples, and no other unknown component was detected (Table 1 and Figure 1).

2.1.1. Flowers Methanol Extract (FME) of N. cataria

Within the flavonoids class, flavonol quercetin, alongside its three glycosides, quercitrin, quercetin-3-O-glucoside, and quercetin-3-O-rutinoside, were observed in the amounts of 88.97, 8406.31, 72.97, 86.55 mg/g, respectively. Notably, quercetin-3-O-rutinoside nearly reached the amount of its aglycone. Flavonols isorhamnetin and kaempferol were found in amounts of 107.53 and 90.03 mg/g, respectively, while kaempferol-3-O-glucoside was present in almost four-fold higher concentrations (409.21 mg/g) related to its aglycone. Flavone luteolin as well as its 7-O-glucoside were the minor constituents of the FME (6.12 and 7.64 mg/g, respectively). Among phenolic acids, chlorogenic acid and rosmarinic acid were identified in high concentrations (1647.32 and 326.15 mg/g, respectively). Other phenolic acids were present in the concentration range of 15.93 to 138.21 mg/g (Table 1, Figure 1A).

2.1.2. Leaves Methanol Extract (LME) of N. cataria

Within the LME, kaempferol-3-O-glucoside and quercetin-3-O-glucoside were observed as major flavonoids (374.13 and 354.33 mg/g, respectively). Among the quantified flavonol aglycones, isorhamnetin, kaempferol, and quercetin were present in notable concentrations (175.34, 82.87 and 78.33 mg/g, respectively), while flavones luteolin and luteolin-7-O-glucoside were found in low amounts (4.13 and 5.43 mg/g, respectively). Of the phenolic acids, rosmarinic and chlorogenic acids were identified as most abundant (1056.14 and 648.52 mg/g, respectively), while related to distinct phenolic acids, p-hydroxybenzoic and protocatechuic acids were observed in relatively lower amounts (363.32 and 261.42 mg/g, respectively, Table 1 and Figure 1B).

2.1.3. Stems Methanol Extract (SME) of N. cataria

Inside of the SME, kaempferol-3-O-glucoside was the most abundant flavonol (168.54 mg/g). In addition, quercetin, isorhamnetin, quercetin-3-O-rutinoside, and quercetin-3-O-glucoside were found in significant amounts (94.54, 117.24, 114.01 and 87.97 mg/g, respectively), while other flavonoids were identified ranging from 1.02 to 67.25 mg/g. Chlorogenic acid was identified in high concentrations (1408.43 mg/g). Other phenolic acids were found in the range of 30.32 to 250.54 mg/g. The results of quantitative analysis of phenolics present in stems showed that except for the case of accumulation of chlorogenic acid (as the main constituent), concentrations of other investigated compounds are lower than in flowers and leaves (Table 1, Figure 1C).

2.1.4. Implications of N. cataria Extracts Chemical Composition on the Plant’s Activity

Generally, it could be anticipated that the physiological properties of FME could be ascribed to the most abundant compounds: quercitrin, chlorogenic acid, and quinic acid (Table 1 and Figure 1A). Analogously, rosmarinic acid and chlorogenic acid could be the main actors in the LME (Table 1 and Figure 1B). Regarding SME, chlorogenic acid was the dominant compound and consequently could be assumed as the compound mainly responsible to be associated with its bioactivity (Table 1 and Figure 1C).
From a literature survey, it has been found that polyphenol-rich extracts showed antigenotoxic activity [26,27]. However, to reach the DNA, the medicinal plants’ active ingredients must pass the liver barrier for which the initial physiological response of an organ occurs in terms of hepatoprotective potential [28]. Hence, before any antigenotoxic activity, the hepatoprotective potential of a given extract should be evaluated by means of the antioxidant abilities of contained compounds (phenolic acids and flavonoids) either while counteracting the liver damage [29,30], interfering with the drug-metabolizing and repairing enzymes, or interacting with signaling molecules important for cell survival [31]. Ficus gnaphalocarpa with hepatoprotective in vitro activity, showed a strong effect of quercitrin in reducing the CCl4-induced disruption of human hepatoma HEPG2 cell lines through its ability in preventing liver cell death and leakage of lactate dehydrogenase into a medium [32]. Chlorogenic acid was observed in a high concentration in the sea cucumber extract and significantly reduced thioacetamide-induced liver injury in rats [33], while rosmarinic acid, as the major compound of Perrila frutescens, decreased tert-butyl hydroperoxide (t-BHP)-induced oxidative liver damage [34].
Therefore, further experiments were directed toward creating the physiological scenario of treating the adult Wistar rats (Rattus norvegicus, hereinafter labeled as r to be used as a prefix for all reported data) with CCl4, a hazardous chemical entity used to induce serious implications on both membrane and genome (Scheme 1) and to reveal the initial hepatotoxic/hepatoprotective features (Table 2, Table 3, Table 4 and Table 5) of extracts and the found chemical constituents (Table 1, Figure 1), as well as the associated genotoxic/antigenotoxic features (Table 6, Table 7 and Table 8). Within all the experiments, the control group comprised experimental animals treated i.p. with virgin olive oil (herein commercially available, 1 mL/kg bwt), due to the ability of such a mixture to decrease liver damage in rats caused by CCl4 [35].
Hence, for determining the above-defined extracts hepatotoxic (Table 2 and Table 4: groups III–V) and genotoxic features (Table 6: groups III-V), they were orally administered to adult Wistar rats, at 200 mg/kg bwt, in comparison with intraperitoneally (i.p.) applied CCl4 (Table 2 and Table 4: groups II) or olive oil (Table 2 and Table 4: groups I). The pure secondary metabolites (Table 1, Figure 1) and their features were also investigated in parallel (Table 3 and Table 5). Furthermore, for elucidating the hepatoprotective (Table 2 and Table 4: groups VI–XIV) and/or antigenotoxic (Table 7: groups VI-XIV) effect, different concentrations (50, 100, and 200 mg/kg bwt) of extracts and the pure metabolites were administered 5 days before the hazardous agent application (Table 2, Table 4 and Table 7: groups II and I; and Table 8).

2.2. Hepatotoxic and Hepatoprotective Features of N. cataria Flower (FME), Leaf (LME), and Stem (SME) Methanol Extracts

The liver intoxication with CCl4 through rCYP2E1 (a member of rCytochrome P-450 family) leads to hepatotoxic metabolite production and among them can be mainly listed the trichloromethyl (rCCl3●−) and trichloromethylperoxy (rCCl3OO●−) radicals (Scheme 1) [36], which can further induce the peroxidation of hepatocytes membrane polyunsaturated fatty acids (Table 2 and Table 4: group II, Table 3 and Table 5), likely contributing to hepatotoxicity [37]. Therefore, N. cataria extracts were initially investigated for their impact on lipid peroxidation upon CCL4 administration [36]. Hence, N. cataria extract behavior in the hepatocyte membrane oxidative stress scenario was indirectly assessed through the catalytic activity of superoxide dismutase (rSOD), the concentration of the thiobarbituric acid-reactive substance (rTBARS), the catalytic activity of catalase (rCAT), and the concentration of reduced glutathione (rGSH) (Scheme 1, Table 2). Furthermore, the radical-induced damage of the hepatocytes’ membrane was estimated through the catalytic activities of aspartate transaminase (rAST), alanine transaminase (rALT), alkaline phosphatase (rALP), and γ-glutamyltransferase (rγ-GT), whereas bile damage was assessed through the catalytic activity of rALP and rγ-GT (Table 4 and Table 5).

2.2.1. Hepatotoxic and Hepatoprotective Features of N. cataria Flower Methanol Extract (FME)

The Hepatocytes Redox Status

Within the liver, toxic radicals such as rCCl3 are likely oxidized by rCYP2E1-activated molecular oxygen to produce rCCl3OO radicals, leading to the formation of superoxide radicals (rO2●−) as well (Scheme 1) [38]. The rSOD catalyzes the dismutation of rO2●− into oxygen and hydrogen peroxide (Scheme 1), representing the in vivo redox defense mechanism, and any decrease in rSOD catalytic activity is associated with running oxidative stress [39]. The administration of CCl4 (Table 2: group II) caused a 2.19-fold decrease in rSOD catalytic activity compared to the olive oil (Table 2: group I), confirming the enzyme as a sensitive marker for CCl4-induced liver injury. Furthermore, the administration of N. cataria FME at 200 mg/kg (Table 2: group III) led to rSOD activation (to the 75.28% of the rSOD catalytic activity of the control, Table 2: group I), a result that could not be attributed to the hepatotoxicity (since the FME did not cause severe lipid peroxidation and other liver oxidative damages; see further discussion), but could be interpreted as a normal liver physiological response. External confirmation of a later postulate was received upon distinct extraction, which has notably less-pronounced cellular response related to CCl4 (i.e., caused a 1.65-fold increase in rSOD catalytic activity compared to Table 2: group I). Furthermore, the high increase in rSOD catalytic activity, in terms of FME’s administration before CCl4 in matching concentration (Table 2: group VIII), pushed in favor that the remedy acted in an apparent hepatoprotective fashion (60.60% of rSOD catalytic activity related to Table 2: group I, and 1.33-fold above Table 5: group II), exerting negligible higher hepatoprotective potential related to lower concentrations (see Table 2: groups VI and VII).
In the liver hepatocytes membrane, the rCCl3 and rCCl3OO radicals induce the formation of malondialdehyde (rMDA) (Scheme 1), a major product of lipid peroxidation [28]. Therefore, the additional level of N. cataria extract hepatoprotective ability was determined by complexing the rMDA with thiobarbituric acid, resulting in the formation of rTBARS (Scheme 1), whose increased concentration indicates membrane damage [40]. Immersed in the membrane and lowering the concentration of rTBARS in physiological conditions, the N. cataria FME individually expressed notable hepato-protectivity (Table 2: group III, only 57.53% of rTBARS concentration measured related to Table 2: group I), beyond comparison to the hepatotoxicity of CCl4 (Table 2: group II, 4.80-fold higher TBARS concentration related to Table 5: group I). Such intensive hepatoprotection was evident even against CCl4 (Table 2: group VIII, 69.41% of rTBARS concentration related to Table 2: group I, and 6.91-fold lower rTBARS concentration than within Table 5: group II).
When CCl4-based intoxication ends with hydrogen peroxide, rCAT degrades the product to water and molecular oxygen (Scheme 1), and the decrease in the catalytic activity of rCAT leads to oxidative stress in tissue [41]. Therefore, readily expected, CCl4 caused a moderate drop in the catalytic activity of rCAT related to olive oil (Table 2: group II vs. group I, 81.04% of the catalytic activity). It was anticipated that N. cataria FME could counteract the CCl4-based intoxication (Table 2: group III, 98.20% of the catalytic activity of rCAT related to Table 2: group I), which was confirmed by administering it directly against CCl4 (Table 2: group VIII vs. group II, 1.08-fold higher CAT catalytic activity).
Table 2. Total protein content (rTP), catalytic activities, and concentrations of liver antioxidant enzymes in rats exposed to different doses of N. cataria extracts and CCl4.
GroupsrTP (g/L)rSOD (U/mg)rTBARS (nmol/mg)rCAT (U/mg)rGSH (mg/g)
I1 28.39 ± 0.145.38 ± 0.032.19 ± 0.02131.33 ± 0.1516.04 ± 0.12
II27.07 ± 0.122.45 ± 0.05 *10.51 ± 0.14 *106.43 ± 0.3 *6.39 ± 0.16 *
III30.01 ± 0.174.05 ± 0.11 *1.26 ± 0.08 128.97 ± 0.08 13.22 ± 0.20 *
IV26.13 ± 0.234.29 ± 0.02 *2.39 ± 0.09 127.57 ± 0.10 13.52 ± 0.12 *
V25.90 ± 0.344.31 ± 0.06 *1.33 ± 0.08 *124.31 ± 0.15 *14.79 ± 0.13 *
VI27.61 ± 0.243.26 ± 0.06 *2.24 ± 0.02 113.07 ± 0.23 *10.63 ± 0.14 *
VII34.19 ± 0.173.26 ± 0.08 *1.88 ± 0.03 114.34 ± 0.22 *11.44 ± 0.02 *
VIII27.48 ± 0.413.28 ± 0.09 *1.52 ± 0.06 *120.93 ± 0.11 *12.01 ± 0.18 *
IX28.17 ± 0.283.41 ± 0.04 *2.81 ± 0.09 *113.65 ± 0.28 *12.18 ± 0.08 *
X25.23 ± 0.163.65 ± 0.02 *1.82 ± 0.07 126.40 ± 0.13 13.26 ± 0.06 *
XI28.88 ± 0.133.09 ± 0.07 *2.93 ± 0.05 *119.32 ± 0.19 *12.18 ± 0.03 *
XII27.78 ± 0.233.31 ± 0.08 *4.31 ± 0.07 *123.80 ± 0.16 *12.79 ± 0.21 *
XIII29.56 ± 0.163.11 ± 0.09 *5.08 ± 0.10 *115.25 ± 0.20 *11.61 ± 0.13 *
XIV27.70 ± 0.323.25 ± 0.01 *4.99 ± 0.05 *124.34 ± 0.14 *12.18 ± 0.09 *
I, Control group, animals treated orally for five days with distilled water and then intraperitoneally (i.p.) injected with 1 mL/kg body weight (bwt) in olive oil; II, CCl4 1 mL/kg i.p.; III, N.cataria FME 200 mg/kg; IV, N.cataria LME 200 mg/kg; V, N.cataria SME 200 mg/kg; VI, N. cataria FME 50 mg/kg+CCl4; VII, N. cataria FME 100 mg/kg+CCl4; VIII, N. cataria FME 200 mg/kg+CCl4; IX, N. cataria LME 50 mg/kg+CCl4; X, N. cataria LME 100 mg/kg+CCl4; XI, N. cataria LME 200 mg/kg+CCl4; XII, N. cataria SME 50 mg/kg+CCl4; XIII, N. cataria SME 100 mg/kg+CCl4; XIV, N. cataria SME 200 mg/kg+CCl4; 1 Values represent mean ± SEM from three independent experiments; n = 5 rats per group; * p < 0.05 when compared with the negative control group; p < 0.05 when compared with the CCl4 control group. Results are presented as equivalents of total protein concentration.
Further evidence that N. cataria FME was endowed with hepatoprotective activity was assessed by monitoring rGSH, a dual-mode antioxidant against reactive oxygen species emerging from CCl4 [38]. The production of rCCl3OO radicals and their interaction with membrane lipids may cause lipid radical formation and the production of rCCl3OOH, which is reduced to rCCl3OH by rGSH (Scheme 1) [38,42]. Furthermore, hydrogen peroxide excess may be neutralized by rGSH (Scheme 1) supporting the antioxidative features of rCAT [38]. Compared to CCl4 (Table 2: group II, 2.51-fold lower rGSH concentration related to Table 2: group I), the N. cataria FME did not exert hepatotoxicity (Table 2: group IV, 82.42% of the rGSH concentration measured in Table 2: group I). Similarly, while monitoring the rTBARS, the administration of N. cataria FME in the concentration of 200 mg/kg bwt before CCl4 (Table 2: groups VI, VII, and VIII) correlated with hepatoprotective effects (74.88% of rGSH concentration than within Table 2: group I and 1.88-fold higher rGSH concentration than within Table 2: group II were detected). The most abundant secondary metabolites of N. cataria FME (Table 1, Figure 1), quercitrin, chlorogenic acid, and quinic acid, showed to have an important role in the hepatoprotective activity against administered CCl4 (Table 3), supporting the previous discovery that hepatotoxicity of medicinal plants should be associated with other compounds, such as pyrrolizidine alkaloids [43].
Table 3. Total protein content (rTP), catalytic activities, and concentrations of liver antioxidant enzymes in rats exposed to different doses of compounds found in N. cataria extracts and CCl4.
Group/CompoundsConc.
(mg/kg bwt)
rTP
(g/L)
rSOD
(U/mg)
rTBARS (nmol/mg)rCAT
(U/mg)
rGSH
(mg/g)
Control group 1 27.43 ± 0.21 5.26 ± 0.14 2.15 ± 0.32 134.17 ± 0.15 17.32 ± 0.20
CCl41 mL/kg25.43 ± 0.53 *2.53 ± 0.21 *10.78 ± 0.32 *107.56 ± 0.30 *6.42 ± 0.41 *
quinic acid 5022.43 ± 0.06 *2.74 ± 0.12 *2.54 ± 0.21 108.34 ± 0.32 *8.04 ± 0.32 *
10031.45 ± 0.21 *2.81 ± 0.32 *2.10 ± 0.43 109.17 ± 0.51 *8.43 ± 0.27 *
20021.32 ± 0.45 *2.91 ± 0.26 *1.98 ± 0.32 *110.56 ± 0.32 *9.21 ± 0.32 *
protocatechuic acid 5032.79 ± 0.46 *2.66 ± 0.19 *2.95 ± 0.11 110.25 ± 0.36 *7.17 ± 0.63 *
10029.18 ± 0.95 *2.69 ± 0.48 *3.18 ± 0.17 *110.65 ± 0.91 *7.34 ± 0.64 *
20030.05 ± 0.09 *2.75 ± 0.14 *3.20 ± 0.47 *113.89 ± 0.56 *7.95 ± 0.46 *
chlorogenic acid 5028.33 ± 0.47 *2.88 ± 0.05 *2.43 ± 0.13 110.11 ± 0.55 *10.15 ± 0.28 *
10026.18 ± 0.19 *2.95 ± 0.18 *2.37 ± 0.53 112.28 ± 0.32 *11.92 ± 0.31 *
20025.48 ± 0.11 *2.98 ± 0.33 *2.25 ± 0.46 112.78 ± 0.28 *12.28 ± 0.25 *
p-hydroxybenzoic acid 5020.66 ± 0.16 *2.59 ± 0.22 *3.99 ± 0.47 *107.98 ± 0.79 *7.02 ± 0.17 *
10023.17 ± 0.96 *2.63 ± 0.24 *3.90 ± 0.79 *108.11 ± 0.36 *7.49 ± 0.87 *
20023.11 ± 0.36 *2.90 ± 0.33 *3.69 ± 0.09 *108.92 ± 0.46 *7.51 ± 0.42 *
caffeic acid 5029.83 ± 0.45 *2.64 ± 0.53 *4.18 ± 0.31 *108.49 ± 0.25 *6.81 ± 0.22 *
10027.55 ± 0.362.66 ± 0.34 *4.02 ± 0.07 *110.71 ± 0.69 *6.92 ± 0.13 *
20027.19 ± 0.162.72 ± 0.47 *3.97 ± 0.71 *111.31 ± 0.33 *7.14 ± 0.74 *
syringic acid5022.14 ± 0.32 *2.78 ± 0.77 *2.23 ± 0.14 115.28 ± 0.71 *11.98 ± 0.49 *
10028.18 ± 0.23 *3.18 ± 0.65 *2.20 ± 0.38 116.22 ± 0.24 *12.92 ± 0.28 *
20024.65 ± 0.45 *3.55 ± 0.39 *2.19 ± 0.24 118.39 ± 0.44 *13.45 ± 0.36 *
p-coumaric acid5024.78 ± 0.15 *2.74 ± 0.12 *2.72 ± 0.28 112.28 ± 0.35 *9.58 ± 0.27 *
10023.38 ± 0.30 *2.79 ± 0.18 *2.58 ± 0.16 112.99 ± 0.76 *10.81 ± 0.14 *
20025.47 ± 0.12 *2.92 ± 0.74 *2.49 ± 0.71 113.85 ± 0.29 *11.17 ± 0.47 *
ferulic acid5028.91 ± 0.16 *2.79 ± 0.61 *3.01 ± 0.19 *113.11 ± 0.13 *8.67 ± 0.37 *
10025.71 ± 0.63 *2.85 ± 0.37 *2.87 ± 0.22 114.26 ± 0.34 *8.99 ± 0.47 *
20023.33 ± 0.24 *2.91 ± 0.11 *2.64 ± 0.17 116.96 ± 0.26 *9.25 ± 0.66 *
luteolin-7-O-glucoside5021.74 ± 0.29 *2.85 ± 0.27 *2.98 ± 0.03 109.45 ± 0.62 *8.04 ± 0.72 *
10026.41 ± 0.39 *2.99 ± 0.39 *2.90 ± 0.15 110.21 ± 0.32 *8.19 ± 0.37 *
20025.77 ± 0.07 *3.10 ± 0.09 *2.61 ± 0.13 114.65 ± 0.16 *8.41 ± 0.11 *
quercetin-3-O-glucoside501 27.43 ± 0.215.26 ± 0.14 2.15 ± 0.32 134.17 ± 0.15 17.32 ± 0.20
10025.43 ± 0.53 *2.53 ± 0.21 *10.78 ± 0.32 *107.56 ± 0.30 *6.42 ± 0.41 *
20024.57 ± 0.34 *2.59 ± 0.13 *3.11 ± 0.16 *110.22 ± 0.28 *7.99 ± 0.24 *
quercetin-3-O-rutinoside5022.18 ± 0.14 *2.69 ± 0.08 *2.95 ± 0.39 112.74 ± 0.36 *8.10 ± 0.31 *
10025.96 ± 0.19 *2.74 ± 0.16 *2.78 ± 0.44 115.18 ± 0.58 *8.24 ± 0.77 *
20027.72 ± 0.11 2.71 ± 0.19 *3.14 ± 0.26 *116.78 ± 0.07 *8.01 ± 0.64 *
rosmarinic acid5024.79 ± 0.46 *2.75 ± 0.13 *3.08 ± 0.47 *117.96 ± 0.45 *8.09 ± 0.43 *
10025.11 ± 0.35 *2.98 ± 0.47 *2.97 ± 0.58 120.47 ± 0.67 *8.20 ± 0.27 *
20022.13 ± 0.45 *2.57 ± 0.03 *2.65 ± 0.18 109.52 ± 0.14 *10.25 ± 0.07 *
quercitrin5021.18 ± 0.33 *2.68 ± 0.09 *2.24 ± 0.08 110.33 ± 0.23 *11.78 ± 0.09 *
10024.79 ± 0.26 *2.99 ± 0.12 *2.22 ± 0.09 110.98 ± 0.32 *11.26 ± 0.36 *
20021.53 ± 0.53 *2.86 ± 0.54 *2.05 ± 0.74 112.56 ± 0.31 *12.43 ± 0.84 *
kaempferol-3-O-glucoside5028.43 ± 0.54 *2.94 ± 0.23 *1.95 ± 0.51 *114.52 ± 0.53 *13.11 ± 0.31 *
10025.54 ± 0.11 *3.72 ± 0.77 *1.64 ± 0.32 *117.32 ± 0.21 *13.32 ± 0.43 *
20021.54 ± 0.18 *2.96 ± 0.16 *3.01 ± 0.22 *111.27 ± 0.21 *11.98 ± 0.66 *
quercetin5021.98 ± 0.47 *3.14 ± 0.13 *2.78 ± 0.61 113.78 ± 0.36 *13.56 ± 0.19 *
10026.74 ± 0.07 *3.25 ± 0.34 *2.47 ± 0.07 119.14 ± 0.25 *14.76 ± 0.11 *
20022.74 ± 0.11 *2.97 ± 0.17 *2.01 ± 0.26 113.78 ± 0.51 *14.27 ± 0.09 *
luteolin5024.71 ± 0.24 *3.15 ± 0.66 *2.48 ± 0.41 115.63 ± 0.14 *14.98 ± 0.17 *
10025.98 ± 0.64 *3.67 ± 0.47 *2.22 ± 0.45 118.39 ± 0.33 *15.36 ± 0.33 *
20024.69 ± 0.37 *2.57 ± 0.57 *3.28 ± 0.49 *108.49 ± 0.34 *7.58 ± 0.31 *
kaempferol5023.15 ± 0.41 *2.59 ± 0.64 *2.97 ± 0.34 110.64 ± 0.97 *8.25 ± 0.16 *
10022.14 ± 0.12 *2.74 ± 0.08 *2.68 ± 0.09 111.93 ± 0.13 *10.92 ± 0.06 *
20028.14 ± 0.05 *2.78 ± 0.16 *3.15 ± 0.19 *115.97 ± 0.14 *10.44 ± 0.22 *
isorhamnetin5026.81 ± 0.31 *2.82 ± 0.64 *3.10 ± 0.24 *119.36 ± 0.37 *10.18 ± 0.20 *
10026.93 ± 0.12 *2.95 ± 0.47 *2.99 ± 0.11 120.55 ± 0.96 *12.93 ± 0.13 *
20025.49 ± 0.17 *2.99 ± 0.13 *3.01 ± 0.17 *122.68 ± 0.11 *9.16 ± 0.41 *
1 Values represent mean ± SEM from three independent experiments; n = 5 rats per group; * p < 0.05 when compared with the negative control group;  p < 0.05 when compared with the CCl4 control group.
Quercitrin at 200 mg/kg bwt increased the catalytic activity of rSOD, decreased the concentration of rTBARS, increased the catalytic activity of rCAT, and increased the concentration of rGSH to the values 1.47-fold higher, 6.57-fold lower, 1.09-fold higher, and 2.07-fold higher than in the control group, respectively, matching the hepatoprotective profile of the extract itself. Related to quercitrin, chlorogenic acid and quinic acid at the highest concentration exerted slightly less protection against CCl4 in terms of rSOD (1.25-fold lower and 1.28-fold lower) and rCAT (1.04-fold lower and 1.06-fold lower) catalytic activities, as well as in terms of rGSH concentration (1.08-fold lower and 1.45-fold lower), at the same time allowing a higher concentration of rTBARS to be formed (1.37-fold higher and 1.21-fold higher). Related to the olive oil, all the found secondary metabolites decreased the catalytic activity of rCAT as the concentration applied increased (Table 3); this led to speculation that somehow new amounts of rH2O2 could have been produced in situ.
This expected outcome could occur upon the initial rH2O2 decomposition, catalyzed by rCAT during the “catalactic” reaction (Scheme 2), and the formation of oxyferryl species with a porphyrin–radical cation, called the rat catalase compound I (rCATCmpd I), that may exist in either an oxoferryl porphyrin π-cation radical state (the Por·+-FeIV = O state, Scheme 2, step 3) or a Por-FeIV-OH state (Scheme 2, step 4) [44,45,46,47,48,49,50,51,52,53,54]. Here, the noted secondary metabolites (FlaOHs) were likely the precursors for the induction of a higher amount of hydrogen peroxide: while interacting with rCAT, they stabilized the rCATCmpd I and enhanced the formation of rCATCmpd II, at the same time transforming themselves to the corresponding semiquinone radical form, rFlaO•− (Scheme 2, step 12), that initiated a chain of reactions (Scheme 2, steps 13–15) to form new amounts of rH2O2 [55].
Recalling the pro-rH2O2 behavior of FlaOHs, to gather insights into the formation of new rH2O2 quantities at the molecular level, measured by the decrease in the catalytic activity of rCAT (Table 3), the secondary metabolites of N. cataria (Table 1, Figure 1) were subjected to a structure-based (SB) investigation within the rCATCmpd I (Figure 2, Supplementary Materials, Figures S1–S3) for elucidating the origin of rCATCmpd II. Hence, quercitrin at its putative bioactive conformation (Figure 2A) contributed by means of its A-ring’ C5-OH group, observed to be orthogonally related to the rCATCmpd I’s oxoferryl porphyrin π-cation radical (Figure 2A), in a position to establish a strong hydrogen bond (HB) (dHB = 2.825 Å) and donate a proton and stabilize the rCATCmpd I. The formed quercitrinyl radical could lead to the conversion of molecular oxygen into rH2O2 (Scheme 2, steps 13–15). This particular molecular alignment could be a consequence of an electrostatic attraction between A-rings’ C7-OH portion and rLys169, being that the A ring itself was stabilized by van der Waals interactions with rLeu165. Furthermore, both the C-ring’s C4-carbonyl group and the axially oriented L-rhamnose’s C2′-OH group established electrostatic interactions with rHis75, hence making the first-level barrier for preventing the rH2O2 to enter the active site and initiate another “catalatic” reaction (Scheme 2, step 1). The active site was “completely locked down” for rH2O2 upon the electrostatic interactions of L-rhamnose’s equatorial C3′-OH group with either rHis75 or rAsn148, while the L-rhamnose’s equatorial C4′-OH portion additionally sealed the cavity while interacting correspondingly with rAsn148. The L-rhamnose’s alignment was supported by the favorable steric interactions of C5′-CH3 with rPhe153. The overall quercitrin binding mode was significantly conditioned by B-rings’ C3′-OH and C4′-OH groups’ negative interactions with rAsp128 and rGln128, respectively.
Finally, the quinic acid alone (Figure 2C) adopted a binding conformation nearby the rCATCmpd I, providing its stabilization by means of weak hydrogen bonding (dHB = 3.313 Å) via C4-OH. The unsubstituted C5-OH portion electrostatically interacted with rHis75, while C4-OH interacted similarly with rAsn128. As for chlorogenic acid, the C1 carboxyl group made electrostatic interactions with rAsp128, as well as the additional ones with rGln128. The C1-OH portion provoked the induced dipole interactions with rVal128.

The Hepatocytes Cell Membrane Status

The catalytic activities of rAST, rALT, rALP, and rγ-GT may be considered sensitive indicators of acute liver damage, whereas the catalytic activities of rALP and rγ-GT alone are thought to be markers of bile duct damage (Table 4 and Table 5) [53]. Herein, as expected, the CCl4-induced formation of rMDA (Table 2: group II) resulted in a significant increase in rAST and rALT catalytic activities (Table 4: group II vs. group I, 22.51-fold and 3.06-fold increment, respectively), implying the hepatocyte’s membrane disruption and likely the hepatotoxicity [56]. Furthermore, the N. cataria FME as a stand-alone application reduced the catalytic activity of rAST referred to the control group level (Table 4: group III vs. group I) confirming that the extract has not induced any hepatotoxicity (Table 2). However, the slightly rALT increased catalytic activity (Table 4: group III vs. group I, 1.82-fold increase) could be a marker of mild hepatotoxicity [57]. The 22.16-fold and 1.66-fold higher catalytic activities of rAST and rALT associated with CCl4-treated samples also support the N. cataria FME lack of hepatotoxicity (Table 4: group II vs. group III).
Table 4. Catalytic activities of serum biochemical markers within the rats exposed to different doses of N. cataria extracts and CCl4.
GrouprAST (U/L)rALT (U/L)rALP (U/L)rγ-GT (U/L)
I1 3.16 ± 0.0220.50 ± 0.23266.27 ± 0.214.10 ± 0.03
II71.12 ± 0.08 *62.69 ± 0.30 *359.18 ± 0.18 *16.88 ± 0.15 *
III3.21 ± 0.02 37.75 ± 0.09 *269.44 ± 0.13 4.18 ± 0.14
IV10.64 ± 0.25 *36.49 ± 0.12 *221.26 ± 0.19 *7.37 ± 0.06 *
V9.81 ± 0.09 *30.71 ± 0.02 *356.29 ± 0.25 *8.44 ± 0.08 *
VI5.42 ± 0.01 *61.59 ± 0.23 *297.82 ± 0.27 *10.81 ± 0.08 *
VII4.83 ± 0.04 58.23 ± 0.18 *284.34 ± 0.12 *7.37 ± 0.31 *
VIII3.78 ± 0.09 39.04 ± 0.13 *271.89 ± 0.14 *5.02 ± 0.24
IX3.60 ± 0.04 69.52 ± 0.14 *349.44 ± 0.17 *11.55 ± 0.11 *
X3.92 ± 0.03 78.56 ± 0.28 *324.30 ± 0.13 *14.25 ± 0.05 *
XI11.13 ± 0.12 *39.98 ± 0.06 *246.85 ± 0.09 *28.00 ± 0.21 *
XII2.29 ± 0.01 22.86 ± 0.11 329.11 ± 0.31 *9.34 ± 0.09 *
XIII3.46 ± 0.03 28.13 ± 0.09 *351.91 ± 0.36 *29.48 ± 0.01 *
XIV11.87 ± 0.11 *46.95 ± 0.14 *456.12 ± 0.14 *17.20 ± 0.04 *
I, Control group, animals treated orally for five days with distilled water and then intraperitoneally (i.p.) injected with 1 mL/kg body weight (bwt) in olive oil; II, CCl4 1 mL/kg i.p.; III, N.cataria FME 200 mg/kg; IV, N.cataria LME 200 mg/kg; V, N.cataria SME 200 mg/kg; VI, N. cataria FME 50 mg/kg+CCl4; VII, N. cataria FME 100 mg/kg+CCl4; VIII, N. cataria FME 200 mg/kg+CCl4; IX, N. cataria LME 50 mg/kg+CCl4; X, N. cataria LME 100 mg/kg+CCl4; XI, N. cataria LME 200 mg/kg+CCl4; XII, N. cataria SME 50 mg/kg+CCl4; XIII, N. cataria SME 100 mg/kg+CCl4; XIV, N. cataria SME 200 mg/kg+CCl4; 1 Values represent mean ± SEM from three independent experiments; n = 5 rats per group; * p < 0.05 when compared with the negative control group;  p < 0.05 when compared with the CCl4 control group. Results are presented as equivalents of total protein concentration.
Moreover, while counteracting the CCl4 effects, the extract decreased the catalytic activities of rAST and rALT in a dose-dependent way (Table 4: groups VI–VIII), as the most concentrated application (200 mg/kg btw) almost re-established the full catalytic activity of rAST (Table 4: group VIII vs. group I), repairing the CCl4-caused damage (Table 4: group VIII vs. group II, 18.81-fold lower catalytic activity). As expected, the catalytic activity of rALT was 1.90-fold higher within the untreated sample (Table 4: group VIII vs. group I) and 1.61-fold lower in the presence of the hazardous compound (Table 4: group II vs. group VIII).
The catalytic activities of rALP and rγ-GT were also concentration-dependently downgraded [58]. Hence, being increased alongside rAST, the catalytic activity of rALP (Table 4: group II vs. group I, 1.35-fold increment) implied that the stand-alone administration of CCl4 could even cause hepatotoxicity [37], as validated by the increased catalytic activity of rγ-GT (Table 4: group II vs. group I, 4.12-fold, see further discussion). The N. cataria FME, however, proved to exert hepato-protective effects (Table 4: group III), as no hepatotoxicity was associated with the opposite performances of both rAST and rALP (Table 4: group III) [37], in agreement with the changes of rγ-GT catalytic activity (Table 4: group III). At the FME highest concentration (200 mg/kg bwt) the CCl4 toxic effect was antagonized (Table 4: group VIII vs. group II, 1.32-fold drop in rALP’s catalytic activity), and the inflammation calmed down through the re-establishment of bile activity (note the 3.36-fold lower catalytic activity of rγ-GT within Table 4: group VIII appertained to Table 4: group II).
Consistently, the pure metabolites of N. cataria FME (Table 1, Figure 1) unambiguously protected the hepatocytes’ membrane and the bile (Table 5). Thus, at the highest dosage, quercitrin completely suppressed the catalytic activity of rAST induced by CCl4 (Table 5: 16.99-fold lower catalytic activity) and calmed down rALT, rALP, and rγ-GT. Chlorogenic acid was slightly less efficient in protecting the liver from CCl4, leading to 1.04-fold higher, 1.04-fold lower, 1.02-fold higher, and 1.55-fold higher catalytic activities of rAST, rALT, ALP, and rγ-GT than quercitrin. Furthermore, in agreement with the results of redox markers, quinic acid showed to be the weakest hepato-protector, displaying the least reduction of rAST, rALT, rALP, and rγ-GT catalytic activities, being 1.21-fold higher, 1.14-fold higher, 1.02-fold higher, and 1.91-fold higher than that of quercitrin.

2.2.2. Hepatotoxic and Hepatoprotective Features of N. cataria Leaf Methanol Extract (LME)

The Hepatocytes Redox Status

The N. cataria LME caused the catalytic activity of rSOD, the catalytic activity of rCAT, and the concentration of rGSH to be at 79.9%, 97.14%, and 83.04% of the base levels, respectively (Table 2: group IV vs. group I), whereas the concentration of rTBARS was 1.09-fold higher, not enough to be considered a marker of hepatotoxicity if compared with CCl4 (1.26-fold higher value, 4.40-fold lower value, 1.20-fold higher value, and 2.12-fold higher value, respectively; see Table 2: group IV vs. group II). Nevertheless, in a hepatoprotective fashion, N. cataria LME exerted plausible features in the concentration of 100 mg/kg bwt (the catalytic activity of rSOD, the concentration of rTBARS, the catalytic activity of rCAT, and the concentration of rGSH were 67.84%, 83.10%, 96.25%, and 82.67% of the control group values, see Table 2: group X vs. group I, and 1.49-fold higher, 5.77-fold lower, 1.19-fold higher, and 2.07-fold above the control value; see Table 2: group X vs. group II, respectively). Whereas when comparing the 100 mg/kg bwt N. cataria LME with 200 mg/kg bwt N. cataria FME, the leaf extract showed a lower efficacy to take under control the rSOD catalytic activity and rTBARS concentration but showed a better profile in terms of rCAT catalytic activity and rGSH concentration (Table 2: compare group X vs. group VIII).
The N. cataria LME hepatoprotective effects could be mainly attributed to chlorogenic and rosmarinic acids (Table 3), which at 100 mg/kg bwt increased the rSOD catalytic activity concerning CCl4 (1.60-fold increase), partially neutralizing the damage in comparison to olive oil as a positive control (50.95% of the basal catalytic activity of rSOD restored). Regarding rTBARS, rosmarinic acid almost fully prevented their formation (only 1.04-fold higher concentration was measured related to the olive oil upon the compound’s administration against the hazardous chemical entity). However, rosmarinic acid alone was confirmed not as hepatoprotective by analyzing the catalytic activity of rCAT and the concentration of rGSH; the compound slightly increased the redox markers (1.03-fold and 1.83-fold, respectively), below basal values levels (82.23% and 68.01%, respectively), implying that further studies are required to determine whether the compounds could act in synergistic, antagonistic and/or additive ways.
Rosmarinic acid, being a caffeic acid analog, was found to adopt a binding mode similar to that of chlorogenic acid (Figure 2D) in which the C4-OH established a strong hydrogen bond (dHB = 2.820 Å) with rCATCmpd I, while the dihydroxyphenyl-lactic acid’s para and meta OH moieties established electrostatic interactions with rLys177 and rAsp128, respectively.

The Hepatocytes Cell Membrane Status

Besides the favorable impact on the redox status (Table 2), the potential therapeutic application of N. cataria LME has been questioned and at least remained elusive. Hence, being administered solely, among the three types of N. cataria extracts, LME caused the highest catalytic activity of rAST (3.31-fold higher than FME; compare groups IV and III within Table 4; and 1.08-fold higher than SME; compare groups IV and V within Table 4).
Furthermore, analyzing the catalytic activity of rALT, it seems that the liver tolerated better LME as xenobiotic than FME (1.03-fold lower value, compare groups IV and III within Table 4) but showed a more pronounced reaction than upon the administration of SME (1.19-fold higher value, compare groups IV and V within Table 4). Nevertheless, the catalytic activities of both enzymes were increased upon N. cataria LME administration, possibly indicating hepatotoxicity [57]. However, the LME forced the lowest catalytic activity of rALP (1.34-fold lower than caused by FME, compare groups IV and III within Table 4, and 1.61-fold lower than caused by SME; compare groups IV and V within Table 4), for which hepatotoxicity was excluded [37]. The opposite conclusion was made by analyzing the catalytic activity of rγ-GT (1.76-fold higher and 1.14-fold lower values against FME and SME, respectively), indicating the bile mild affection.
Regarding toxicity prevention, at 100 mg/kg bwt, LME seemed to neutralize the adverse effects of CCl4 associated through the re-established catalytic activities of rAST, rALP, and rγ-GT (1.24-fold higher, 1.22-fold higher, and 3.48-fold higher than the control group values; compare Table 4: group X vs. group I, and 18.14-fold lower, 1.11-fold lower, 1.18-fold lower than within the CCl4-treated group values; Table 4: compare group X vs. group II, respectively). However, the same formulation failed to fix the catalytic activity of rALT (the value 1.25-fold higher after CCl4 treatment; Table 4: compare group X vs. group II), revealing the CCl4-induced hepatotoxicity [57]. Further confirmation that N. cataria LME may not be an optimal phytotherapy preparation was obtained with the lack of consistency between the administered concentration and the impact on serum toxicity markers (Table 2 vs. Table 4). Hence, the concentration of 50 mg/kg bwt appeared to be more effective while restoring basal catalytic activities of rAST and rγ-GT, whereas the concentration of 200 mg/kg bwt was more beneficial while lowering the catalytic activities of rALT and rALP. Therefore, additional studies are likely required before claiming the N. cataria LME as safe as hepatoprotective supplements.
In this regard, a question was raised about the contribution of the rosmarinic acid (Table 5) in hepatocytes membrane protection, as well. The compound seemed to be protective against CCl4 in terms of rAST, rALP, and rγ-GT catalytic activities (1.08-fold higher, 1.03-fold higher, and 2.00-fold higher than after treatment with olive oil; Table 5: compare group X vs. group I; and 15.76-fold lower, 1.32-fold lower, and 2.81-fold lower than values within the control group; Table 5: compare group X vs. group I, respectively), but only moderately protective seen through the catalytic activity of rALT (1.64-fold higher and 1.84-fold lower than after treatment within olive oil or CCl4; compare Table 8: group X vs. group I, and Table 5: group X vs. group II, respectively), blending in the pattern expressed by the extract itself.

2.2.3. Hepatotoxic and Hepatoprotective Features of N. cataria Stems Methanol Extract (SME)

The Hepatocytes’ Redox Status

The administration of N. cataria SME at the highest concentration raised the catalytic activity of rSOD to the highest level compared to the corresponding extracts from other plant organs (Table 2: group V, 1.25-fold lower rSOD catalytic activity related to reference group, i.e., Table 2: group I), causing likely no hepatocyte injury in comparison with the CCl4 effects (Table 2: group V, 1.76-fold higher rSOD catalytic activity compared to Table 2: group II). No significant harm to the liver was also confirmed upon analyzing the concentration of rTBARS (7.90-fold lower and 1.65-fold lower concentration of rTBARS concerning either olive oil or CCl4; see Table 2: group V vs. group I and Table 2: group V vs. group II, respectively), the catalytic activity of rCAT (1.17-fold higher and 1.05-fold lower concerning either olive oil or CCl4; see Table 2: group V vs. group I and Table 2: group V vs. group II, respectively), and the concentration of rGSH (1.08-fold lower and 2.31-fold higher related to either olive oil or CCl4; see Table 2: group V vs. group I and Table 2: group V vs. group II, respectively).
Furthermore, it should be stressed that the SME at a concentration of 50 mg/kg bwt caused the lowest decrease in rSOD catalytic activity and hence the best hepatoprotection against the radical-causing agent (Table 2, group XII vs. group II: catalytic activity of rSOD was 1.35-fold higher compared with the value caused by CCl4). A similar trend was spotted while discussing the rTBARS (Table 2, group XII vs. group II: concentration of rTBARS was 2.44-fold lower compared with the value caused by CCl4) and rGSH concentrations (Table 2, group XII vs. group II: concentration of rGSH was 2.00-fold lower compared with the value caused by CCl4), but not while considering the catalytic activity of rCAT (where extract in the concentration of 200 mg/kg bwt performed the best in terms of protecting liver form CCl4-based intoxication), revealing the limitation of the distinct formulation.
The N. cataria SME hepatocytes’ protection against CCl4 is likely due to chlorogenic acid (Table 1, Figure 1), as it can influence the redox markers (Table 3). At the concentration of 50 mg/kg bwt, chlorogenic acid increased the rSOD and rCAT catalytic activities (1.14-fold higher value and 1.02-fold higher value), increased the rGSH concentration (1.58-fold higher), and at the same time decreased the concentration of rTBARS (4.44-fold lower value).

The Hepatocytes’ Cell Membrane Status

Notwithstanding the lack of N. cataria SME hepatotoxicity at the highest concentration, the extract caused some notable damage to the liver membrane and bile, as indicated by the catalytic activities of rAST, rALT, rALP, and rγ-GT (Table 4: group V vs. group I, 3.10-fold, 1.50-fold, 1.34-fold, and 2.06-fold higher values than within the control group, respectively); as for the catalytic activity of rALP, the damage was even similar as after the CCl4 treatment (compare group V and group II in Table 4, 1.01-fold in the favor of CCl4), indicating, alongside with the catalytic activity of rAST, an appearance of mild hepatotoxicity [37] (the catalytic activities of rAST, rALT, rγ-GT were 7.25-fold, 2.04-fold, and 2-fold lower within the group V of Table 4 than within the group II, respectively).
On the contrary, N. cataria SME applied antagonistically to CCl4 at a concentration of 50 mg/kg (Table 4: group XII) caused the highest hepatoprotection in agreement with the redox status analysis (Table 2). The catalytic activity of rAST was below the control group value (72.47% of the value within Table 4: group I) and was significantly lower than within the sample saturated with CCl4 (31.06-fold lower than within Table 4: group I), whereas the catalytic activity of rALT was comparable to the control group value (compare group XII and group I of Table 4) but 2.72-fold lower than caused by CCl4 (Table 4: group XII vs. group II): no hepatotoxicity was observed. SE was less efficient in restoring the catalytic activities of rALP and rγ-GT yet lowering them to the levels 1.09-fold and 1.81-fold below the ones caused by CCl4, respectively (see Table 4: group XII vs. group II), but no hepatotoxicity was observed, as well. Therefore, ad hoc formulated SE concentration could be safe for therapeutic administration.
Chlorogenic acid (Table 1, Figure 1) unambiguously neutralized the hepatocytes’ CCl4 harmfulness (Table 5), as it was not among the hepatotoxic compounds, causing the catalytic activities of rAST, rALT, rALP, and rγ-GT to be 1.04-fold higher, 1.04-fold lower, 1.02-fold higher, and 1.55-higher than CCl4, respectively.
Table 5. Catalytic activities of serum biochemical markers within the rats exposed to different doses of compounds found in N. cataria extracts and CCl4.
Group/CompoundsConc.
(mg/kg bwt)
rAST
(U/L)
rALT
(U/L)
rALP
(U/L)
rγ-GT
(U/L)
Control group 1 4.08 ± 0.12 21.37 ± 0.26 272.94 ± 0.83 4.01 ± 0.03
CCl41 mL/kg69.64 ± 0.41 *64.72 ± 0.38 *371.14 ± 0.46 *15.78 ± 0.08 *
quinic acid 505.58 ± 0.08 *51.04 ± 0.62 *289.59 ± 0.33 *11.41 ± 0.03 *
1005.12 ± 0.14 *45.94 ± 0.13 *285.17 ± 0.28 *9.23 ± 0.11 *
2004.96 ± 0.07 44.19 ± 0.27 *279.86 ± 0.19 8.40 ± 0.26 *
protocatechuic acid 509.11 ± 0.18 *59.67 ± 0.10 *323.16 ± 0.85 *12.53 ± 0.32 *
1007.56 ± 0.06 *54.46 ± 0.34 *300.54 ± 0.62 *11.70 ± 0.10 *
2007.01 ± 0.20 *51.74 ± 0.22 *298.44 ± 0.30 *9.29 ± 0.13 *
chlorogenic acid 507.34 ± 0.05 *50.11 ± 0.41 *302.51 ± 0.49 *10.21 ± 0.15 *
1006.03 ± 0.10 *42.67 ± 0.30 *284.53 ± 0.32 *9.28 ± 0.50 *
2004.28 ± 0.07 37.12 ± 0.28 *280.22 ± 0.41 *6.80 ± 0.77 *
p-hydroxybenzoic acid 5019.71 ± 0.08 *55.16 ± 0.52 *354.79 ± 0.97 *11.83 ± 0.65 *
10014.28 ± 0.26 *52.11 ± 0.40 *331.60 ± 0.54 *10.91 ± 0.38 *
20010.46 ± 0.37 *48.73 ± 0.13 *310.93 ± 0.19 *9.04 ± 0.50 *
caffeic acid 5027.53 ± 0.41 *63.61 ± 0.55 *360.38 ± 0.59 *13.91 ± 0.05 *
10020.14 ± 0.52 *62.11 ± 0.43 *322.62 ± 0.74 *10.16 ± 0.37 *
20019.97 ± 0.77 *48.23 ± 0.71 *307.08 ± 0.62 *9.10 ± 0.52 *
syringic acid5016.46 ± 0.06 *62.39 ± 0.30 *382.63 ± 0.95 *13.67 ± 0.08 *
10015.17 ± 0.17 *53.65 ± 0.44 *366.19 ± 0.48 *11.49 ± 0.23 *
20012.39 ± 0.53 *41.25 ± 0.31 *350.02 ± 0.36 *10.42 ± 0.64 *
p-coumaric acid5024.73 ± 0.46 *60.18 ± 0.68 *314.09 ± 0.43 *11.44 ± 0.13 *
10020.16 ± 0.38 *54.03 ± 0.34 *296.91 ± 0.84 *9.97 ± 0.08 *
20015.69 ± 0.18 *40.82 ± 0.08 *289.92 ± 0.38 *8.05 ± 0.61 *
ferulic acid508.28 ± 0.61 *52.10 ± 0.24 *312.14 ± 0.92 *11.77 ± 0.19 *
1007.39 ± 0.05 *47.22 ± 0.56 *297.96 ± 0.43 *9.26 ± 0.46 *
2005.94 ± 0.23 *41.69 ± 0.10 *288.71 ± 0.55 *8.10 ± 0.49 *
luteolin-7-O-glucoside5023.17 ± 0.46 *59.71 ± 0.26 *319.37 ± 0.53 *13.78 ± 0.10 *
10021.55 ± 0.83 *55.96 ± 0.09 *302.74 ± 0.33 *10.62 ± 0.41 *
20017.49 ± 0.09 *39.28 ± 0.17 *281.93 ± 0.42 *9.11 ± 0.72 *
quercetin-3-O-glucoside507.82 ± 0.36 *51.69 ± 0.44 *304.03 ± 0.20 *10.58 ± 0.04 *
1006.99 ± 0.42 *46.02 ± 0.13 *296.37 ± 0.17 *9.35 ± 0.50 *
2005.17 ± 0.07 *40.33 ± 0.76 *284.46 ± 0.66 *6.43 ± 0.21 *
quercetin-3-O-rutinoside509.26 ± 0.18 *53.10 ± 0.22 *300.23 ± 0.44 *12.77 ± 0.16 *
1007.33 ± 0.17 *48.47 ± 0.07 *294.16 ± 0.62 *9.16 ± 0.41 *
2005.70 ± 0.30 *43.64 ± 0.39 *280.15 ± 0.38 *7.73 ± 0.06 *
rosmarinic acid505.71 ± 0.18 *43.01 ± 0.30 *297.55 ± 0.14 *10.40 ± 0.31 *
1004.42 ± 0.20 35.12 ± 0.22 *281.96 ± 0.35 *8.04 ± 0.13 *
2004.13 ± 0.02 32.64 ± 0.40 *273.58 ± 0.31 5.61 ± 0.23 *
quercitrin504.72 ± 0.31 47.66 ± 0.38 *299.48 ± 0.21 *9.56 ± 0.29 *
1004.25 ± 0.10 40.19 ± 0.09 *293.13 ± 0.84 *6.28 ± 0.08 *
2004.10 ± 0.27 38.62 ± 0.67 *274.22 ± 0.34 4.40 ± 0.40
quercetin-3-O-glucoside507.82 ± 0.36 *51.69 ± 0.44 *304.03 ± 0.20 *10.58 ± 0.04 *
1006.99 ± 0.42 *46.02 ± 0.13 *296.37 ± 0.17 *9.35 ± 0.50 *
2005.17 ± 0.07 *40.33 ± 0.76 *284.46 ± 0.66 *6.43 ± 0.21 *
kaempferol-3-O-glucoside5015.82 ± 0.09 *61.22 ± 0.08 *313.08 ± 0.54 *11.60 ± 0.08 *
10013.95 ± 0.20 *53.18 ± 0.16 *302.60 ± 0.97 *10.35 ± 0.40 *
20010.61 ± 0.15 *50.29 ± 0.23 *290.53 ± 0.72 *9.94 ± 0.31 *
quercetin506.28 ± 0.17 *50.52 ± 0.24 *317.37 ± 0.55 *11.64 ± 0.30 *
1005.14 ± 0.62 *45.26 ± 0.61 *300.56 ± 0.31 *9.92 ± 0.07 *
2004.49 ± 0.43 41.40 ± 0.38 *291.74 ± 0.97 *7.50 ± 0.46 *
luteolin5025.18 ± 0.63 *62.83 ± 0.49 *325.74 ± 0.30 *12.75 ± 0.32 *
10022.79 ± 0.08 *57.01 ± 0.37 *299.41 ± 0.67 *10.06 ± 0.42 *
20018.95 ± 0.84 *49.46 ± 0.26 *292.16 ± 0.11 *9.14 ± 0.58 *
kaempferol5015.82 ± 0.09 *61.22 ± 0.08 *313.08 ± 0.54 *11.60 ± 0.08 *
10013.95 ± 0.20 *53.18 ± 0.16 *302.60 ± 0.97 *10.35 ± 0.40 *
20010.61 ± 0.15 *50.29 ± 0.23 *290.53 ± 0.72 *9.94 ± 0.31 *
isorhamnetin5014.74 ± 0.44 *59.25 ± 0.67 *294.30 ± 0.26 *12.01 ± 0.18 *
10011.62 ± 0.19 *52.11 ± 0.91 *291.62 ± 0.45 *9.93 ± 0.06 *
2007.30 ± 0.07 *44.08 ± 0.33 *282.06 ± 0.36 *8.01 ± 0.32 *
1 Values represent mean ± SEM from three independent experiments; n = 5 rats per group; * p < 0.05 when compared with the negative control group;  p < 0.05 when compared with the CCl4 control group.

2.3. N. cataria Extracts Impact the Genome In Vivo

Once produced, the rCCl3 to rCCl3OO radicals could reach the DNA and influence the rO2•− that could attack rDNA nucleic bases or deoxyribose residues (Scheme 1), producing damaged bases or strand disruption [29], cellular events that can be quantified by comet assay [58]. Nevertheless, a likely scenario is that rCCl3OO radical induces the formation of rMDA (Table 2, Table 3 and Table 4) that could interact with DNA to form adducts such as rM1G, rM1A, and rM1C (Scheme 1). Some of the adducts might induce base transversions and transitions and the consequent ring-opening to form rN2-oxopropenyl-dG, rN2-oxopropenyl-dA or rN2-oxopropenyl-dC adducts that could lead to rDNA–rDNA inter-strand cross-linking or rDNA–protein inter-strand crosslinks [28], cellular events that can be evaluated by comet assay. Moreover, as the interaction of secondary metabolites with rCAT (Table 3, Scheme 2, Figure 2) induced the formation of a new amount of hydrogen peroxide, the product’s degradation to a hydroxyl radical may endow in targeting the ribose within the rDNA strand with distinct reactive oxygen species, for which additional quantities of rMDA could emerge [28,59]. Therefore, based on rDNA rMDA-induced products, the effectiveness of FME, LME, and SME to either harm or protect rDNA after treatment with CCl4 can be evaluated, in which this aspect is herein discussed.

2.3.1. Genotoxic and Antigenotoxic Activities of N. cataria Flower Methanol Extract (FME)

The CCl4 administration caused severe hepatocellular injury associated with the above-described cellular events, i.e., it significantly increased (p < 0.05) the level of rDNA damage (Table 6 and Table 7: group II) compared to the control group (Table 6 and Table 7: group I): 11.47-fold higher rtail moment value, 3.51-increment in the % rDNA in tail, and 9.48-fold increase in rtail length. In comparison to the CCl4 induced damage, the administration of N. cataria FME at 200 mg/kg bwt concentration caused no genotoxicity, leading to 10.07-fold lowering of rtail moment value, 2.90-fold decrease in the % rDNA in tail, and 8.50-fold lessen in rtail length (Table 6: group II vs. group III). However, related to the control group, some raising in the rtail moment (1.14-fold higher value), % rDNA in the tail (1.21-fold higher value), and rtail length (1.12-fold higher value) were also observed (Table 6: group III vs. group I), although with no significant differences (p > 0.05), which could be attributed to in situ generated rH2O2 (Scheme 2) and the consequent formation of rMDA-mediated lesions.
Table 6. DNA damage effect of N. cataria extracts on liver cells of albino Wistar rats.
Groupsrtail Moment% rDNA in Tailrtail Length
I1.44 ± 0.32 a†3.08 ± 0.40 2.60 ± 0.73
II16.51 ± 1.23 *10.80 ± 1.50 *24.65 ± 1.03 *
III1.64 ± 0.63 3.72 ± 0.94 2.90 ± 0.86
IV2.99 ± 0.6 *4.22 ± 0.54 *3.17 ± 0.63
V4.72 ± 0.3 *7.62 ± 0.34 *5.6 ± 0.82 *
a Data are presented as the means ± SEM obtained from three independent experiments; n = 25 rats; 5 rats per group. I, Control group, animals treated orally for five days with distilled water and then intraperitoneally (i.p.) injected with 1 mL/kg body weight (bwt) in olive oil; II, CCl4 1 mL/kg i.p.; III, N. cataria FME 200 mg/kg;, IV, N. cataria LME 200 mg/kg; V, N. cataria SME 200 mg/kg; * p < 0.05 when compared with the negative control group;  p < 0.05 when compared with the positive control group.
However, physiological intoxication with rH2O2 seemed to be irrelevant to the FME antigenotoxic features (Table 7). Thus, while an increase in total score was detected in rats exposed only to CCl4 (4.93-fold increment, Table 7: group II vs. group I), the levels of liver rDNA damage analyzed from the groups treated with different concentrations of N. cataria FME were significantly reduced (Table 7, groups VI-XIV). The extract at the highest concentration (Table 7: group VIII) reduced the CCl4, which caused the highest rDNA (2.24-fold lower total score than the hazardous agent, Table 7: group II vs. group VIII, but 1.83-fold higher one than within the control group, Table 7: group VII vs. group I), with a percentage reduction level of 73.13% and the absence of comet classes 3 and 4. The finding that the N. cataria FME at the highest concentration was an efficient hepatoprotective supplement that caused no genotoxicity as well as supplementation raised an interesting question: “are the hepatoprotective extracts also antigenotoxic agents?”
Similar to the extract, the secondary metabolites listed in Table 1 were also investigated for their assessment for antigenotoxic features to correlate them with extracts’ corresponding effects (Table 8). Quercitrin, chlorogenic acid, and quinic acid as representants of FME were found to exert antigenotoxic activity, associated with the absence of comet classes 3 and 4. Compared to CCl4, quercitrin at 200 mg/kg bwt concentration severely reduced the CCl4, causing rDNA damage (causing a 2.35-fold lower total score than the hazardous agent, but 1.89-fold higher one than within the control group), with a percentage reduction of 74.08%. Furthermore, in the same concentration, chlorogenic acid reduced the total score in the damaged sample by 1.73-fold, still keeping it on a level 2.56-fold higher than within the undamaged one, and it was associated with a percentage reduction of 54.68%. Lastly, the quinic acid was efficient in protecting the liver from CCl4, with the percentage of reduction equal to 69.98, the 2.18-fold lower total score value than within the sample enriched CCl4 and 2.03-fold higher than within the untreated sample.
Table 7. DNA damage in livers of rats exposed to CCl4 and different doses of N. cataria extracts.
GroupsComet classTotal Score 1% R
01234
I73.90 ± 1.0226.10 ± 0.820.00 ± 0.000.00 ± 0.000.00 ± 0.0026.10 ± 0.82 /
II19.33 ± 0.3459.70 ± 1.0216.13 ± 0.304.84 ± 1.700.00 ± 0.00106.50 ± 1.04 */
VI38.60 ± 0.3359.10 ± 1.402.30 ± 0.730.00 ± 0.000.00 ± 0.0063.70 ± 0.34 *53.23
VII44.86 ± 0.2353.10 ± 0.202.04 ± 0.030.00 ± 0.000.00 ± 0.0057.20 ± 0.30 *61.32
VIII53.85 ± 0.4044.61 ± 0.321.54 ± 0.800.00 ± 0.000.00 ± 0.0047.70 ± 1.54 *73.13
IX48.00 ± 0.2346.00 ± 0.646.00 ± 0.500.00 ± 0.000.00 ± 0.0058.00 ± 1.70 *60.32
X49.95 ± 1.0245.70 ± 0.544.35 ± 1.600.00 ± 0.000.00 ± 0.0054.40 ± 1.02 *64.80
XI40.00 ± 0.8060.00 ± 0.300.00 ± 0.000.00 ± 0.000.00 ± 0.0060.00 ± 0.12 *57.80
XII62.20 ± 0.2032.40 ± 0.924.05 ± 0.901.35 ± 0.520.00 ± 0.0044.55 ± 0.54 *77.05
XIII43.80 ± 0.8247.90 ± 0.328.30 ± 0.540.00 ± 0.000.00 ± 0.0064.50 ± 0.81 *52.24
XIV47.90 ± 0.4137.50 ± 0.9012.50 ± 0.322.10 ± 0.300.00 ± 0.0068.80 ± 0.46 *46.90
I, Control group, animals treated orally for five days with distilled water and then intraperitoneally (i.p.) injected with 1 mL/kg body weight (bwt) in olive oil; II, CCl4 1 mL/kg i.p.; III, N.cataria FME 200 mg/kg; IV, N.cataria LME 200 mg/kg; V, N.cataria SME 200 mg/kg; VI, N. cataria FME 50 mg/kg+CCl4; VII, N. cataria FME 100 mg/kg+CCl4; VIII, N. cataria FME 200 mg/kg+CCl4; IX, N. cataria LME 50 mg/kg+CCl4; X, N. cataria LME 100 mg/kg+CCl4; XI, N. cataria LME 200 mg/kg+CCl4; XII, N. cataria SME 50 mg/kg+CCl4; XIII, N. cataria SME 100 mg/kg+CCl4; XIV, N. cataria SME 200 mg/kg+CCl4; 1 Values represent mean ± SEM from three independent experiments; n = 5 rats per group; * p < 0.05 when compared with the negative control group;  p < 0.05 when compared with the CCl4 control group. Results are presented as equivalents of total protein concentration.
Table 8. DNA damage in livers of rats exposed to CCl4 and different doses of compounds found in N. cataria extracts.
Group/CompoundsConc.
(mg/kg bwt)
Comet ClassTotal Score 1% R
01234
Control group 75.59 ± 1.3024.41 ± 0.520.00 ± 0.000.00 ± 0.000.00 ± 0.0024.41 ± 0.52 /
CCl41 mL/kg19.09 ± 0.5758.57 ± 0.4417.42 ± 0.294.92 ± 0.690.00 ± 0.00108.17 ± 0.31 */
quinic acid 5035.90 ± 0.6760.08 ± 1.034.02 ± 0.500.00 ± 0.000.00 ± 0.0068.12 ± 0.81 *47.82
10046.48 ± 0.9350.67 ± 0.822.85 ± 0.430.00 ± 0.000.00 ± 0.0056.37 ± 0.94 *61.84
20052.70 ± 0.0345.05 ± 0.142.25 ± 0.520.00 ± 0.000.00 ± 0.0049.55 ± 0.61 *69.99
protocatechuic acid 5026.95 ± 1.0158.36 ± 0.2911.14 ± 0.373.55 ± 0.180.00 ± 0.0091.29 ± 0.28 *20.15
10036.10 ± 0.5747.56 ± 0.6812.20 ± 0.664.14 ± 1.060.00 ± 0.0084.38 ± 1.09 *28.40
20042.30 ± 0.2238.70 ± 0.5415.27 ± 0.583.73 ± 0.270.00 ± 0.0080.43 ± 1.14 *33.12
chlorogenic acid 5046.10 ± 0.9148.65 ± 0.305.25 ± 0.370.00 ± 0.000.00 ± 0.0059.15 ± 0.84 *58.52
10045.67 ± 0.6948.20 ± 0.486.13 ± 0.790.00 ± 0.000.00 ± 0.0060.46 ± 0.37 *56.96
20048.25 ± 0.6341.13 ± 0.5410.62 ± 0.400.00 ± 0.000.00 ± 0.0062.37 ± 1.15 *54.68
p-hydroxybenzoic acid 5031.82 ± 0.5951.81 ± 0.3313.98 ± 0.522.39 ± 0.380.00 ± 0.0086.94 ± 0.33 *25.35
10033.48 ± 0.5055.00 ± 1.426.85 ± 0.024.67 ± 0.500.00 ± 0.0082.71 ± 0.84 *30.40
20029.09 ± 1.0664.23 ± 1.114.63 ± 0.832.05 ± 0.440.00 ± 0.0079.64 ± 1.25 *34.06
caffeic acid 5044.42 ± 0.9746.29 ± 0.249.29 ± 0.620.00 ± 0.000.00 ± 0.0064.87 ± 0.34 *51.70
10046.80 ± 0.3946.69 ± 0.526.51 ± 0.940.00 ± 0.000.00 ± 0.0059.71 ± 0.99 *57.86
20049.12 ± 0.9444.33 ± 0.565.49 ± 0.261.06 ± 0.310.00 ± 0.0058.49 ± 0.26 *59.31
syringic acid5039.40 ± 0.2343.76 ± 0.1712.88 ± 0.193.96 ± 0.000.00 ± 0.0081.40 ± 1.48 *31.96
10037.44 ± 0.3350.05 ± 0.5911.46 ± 0.271.05 ± 0.000.00 ± 0.0076.12 ± 1.02 *38.26
20033.18 ± 0.6159.61 ± 1.287.21 ± 0.030.00 ± 0.000.00 ± 0.0074.03 ± 0.95 *40.76
p-coumaric acid5031.49 ± 0.5261.47 ± 0.555.40 ± 0.681.64 ± 0.240.00 ± 0.0077.19 ± 0.54 *36.99
10039.57 ± 0.4951.01 ± 0.916.79 ± 0.322.63 ± 0.810.00 ± 0.0072.48 ± 0.29 *42.61
20029.62 ± 0.2269.10 ± 0.681.28 ± 0.080.00 ± 0.000.00 ± 0.0071.66 ± 0.33 *43.59
ferulic acid5030.65 ± 0.3459.23 ± 0.6710.12 ± 0.490.00 ± 0.000.00 ± 0.0079.47 ± 0.48 *34.26
10029.32 ± 0.5064.20 ± 1.236.48 ± 0.330.00 ± 0.000.00 ± 0.0077.16 ± 0.97 *37.02
20035.89 ± 1.0258.14 ± 1.405.97 ± 0.250.00 ± 0.000.00 ± 0.0070.08 ± 0.90 *45.48
luteolin-7-O-glucoside5029.96 ± 0.4663.83 ± 0.306.21 ± 0.960.00 ± 0.000.00 ± 0.0076.25 ± 0.82 *38.11
10032.59 ± 0.8160.43 ± 0.266.98 ± 0.200.00 ± 0.000.00 ± 0.0074.39 ± 0.39 *40.33
20031.62 ± 1.2263.61 ± 1.004.77 ± 0.190.00 ± 0.000.00 ± 0.0073.15 ± 0.08 *41.81
quercetin-3-O-glucoside5041.76 ± 0.1650.32 ± 0.907.92 ± 0.050.00 ± 0.000.00 ± 0.0066.16 ± 0.67 *50.16
10044.55 ± 1.0651.77 ± 0.383.68 ± 0.400.00 ± 0.000.00 ± 0.0059.13 ± 0.47 *58.55
20056.77 ± 1.3140.77 ± 1.232.46 ± 0.140.00 ± 0.000.00 ± 0.0045.69 ± 0.49 *74.59
quercetin-3-O-rutinoside5047.52 ± 0.9635.05 ± 1.1415.28 ± 1.312.15 ± 0.010.00 ± 0.0072.06 ± 0.16 *43.11
10043.51 ± 0.5944.64 ± 1.309.57 ± 0.662.28 ± 0.610.00 ± 0.0070.62 ± 0.56 *44.83
20054.61 ± 0.1632.64 ± 0.2711.69 ± 0.351.06 ± 0.090.00 ± 0.0059.20 ± 0.22 *58.46
rosmarinic acid5053.66 ± 1.1238.05 ± 0.938.29 ± 0.810.00 ± 0.000.00 ± 0.0054.63 ± 1.41 *63.92
10048.16 ± 0.8251.84 ± 0.550.00 ± 0.000.00 ± 0.000.00 ± 0.0051.84 ± 0.55 *67.25
20053.71 ± 0.3542.44 ± 0.193.85 ± 0.470.00 ± 0.000.00 ± 0.0050.14 ± 0.68 *69.28
quercitrin5039.30 ± 0.7058.56 ± 1.052.14 ± 0.640.00 ± 0.000.00 ± 0.0062.84 ± 0.46 *54.12
10045.25 ± 0.2450.76 ± 0.161.99 ± 0.110.00 ± 0.000.00 ± 0.0054.74 ± 0.07 *63.79
20055.00 ± 0.6143.88 ± 0.781.12 ± 0.450.00 ± 0.000.00 ± 0.0046.12 ± 0.98 *74.08
kaempferol-3-O-glucoside5039.77 ± 0.3350.75 ± 1.529.48 ± 0.220.00 ± 0.000.00 ± 0.0069.71 ± 0.62 *45.92
10039.52 ± 0.8457.27 ± 1.031.96 ± 0.401.25 ± 0.030.00 ± 0.0064.94 ± 1.25 *51.61
20056.90 ± 0.1935.15 ± 0.657.95 ± 0.160.00 ± 0.000.00 ± 0.0051.05 ± 0.51 *68.19
quercetin5051.28 ± 1.2035.47 ± 0.3710.62 ± 1.462.63 ± 0.160.00 ± 0.0064.60 ± 0.68 *52.02
10057.02 ± 0.6227.99 ± 0.6014.99 ± 0.240.00 ± 0.000.00 ± 0.0057.97 ± 0.66 *59.93
20063.54 ± 1.4825.47 ± 0.619.40 ± 0.331.59 ± 0.080.00 ± 0.0049.04 ± 0.42 *70.59
luteolin5036.39 ± 0.5355.09 ± 0.956.49 ± 0.372.03 ± 0.080.00 ± 0.0074.16 ± 0.60 *40.60
10052.45 ± 0.4237.14 ± 0.229.26 ± 0.141.15 ± 0.120.00 ± 0.0059.11 ± 0.93 *58.57
20058.75 ± 1.0530.54 ± 0.8010.71 ± 1.070.00 ± 0.000.00 ± 0.0051.96 ± 0.30 *67.11
kaempferol5039.43 ± 1.1555.12 ± 0.645.45 ± 0.160.00 ± 0.000.00 ± 0.0066.02 ± 0.92 *50.32
10050.67 ± 0.5039.23 ± 0.9910.10 ± 0.940.00 ± 0.000.00 ± 0.0059.43 ± 0.83 *58.19
20055.50 ± 0.7231.32 ± 0.8013.18 ± 0.370.00 ± 0.000.00 ± 0.0057.68 ± 0.29 *60.28
isorhamnetin5033.93 ± 0.3356.04 ± 1.2010.03 ± 0.930.00 ± 0.000.00 ± 0.0076.10 ± 0.31 *38.29
10055.12 ± 0.5925.52 ± 0.6016.28 ± 1.173.08 ± 0.130.00 ± 0.0067.32 ± 0.10 *48.77
20058.30 ± 0.2830.18 ± 0.5611.52 ± 1.090.00 ± 0.000.00 ± 0.0053.22 ± 0.87 *65.60
1 Values represent mean ± SEM from three independent experiments; n = 5 rats per group; * p < 0.05 when compared with the control group;  p < 0.05 when compared with the CCl4 group.
The antigenotoxic agents’ activity was further investigated through structure-based studies using R. norvegicus Topoisomerase IIα (rTopIIα), an enzyme that catalyzes in vivo the decatenation of damaged rDNA, a process quantified by the appearance of comets (Table 8) [60]. Hence, the N. cataria secondary metabolites bioactive conformations within the rDNA binding and cleavage domain of rTopIIα were compared against rMDA, in which the binding pose was calculated nearby four targetable nucleotides positioned within the sense strand, two consecutive guanines residues (rG41 and rG42) followed by a thymine (rT43) and an adenine (rA44), as well as in the proximity of two cytosine residues (rC11 and rC12) and one rG13 belonging to the complementary antisense strand (Figure 3, Supporting Information Figures S4–S6), creating a favorable environment for the generation of rdG, rdA, and rdC and for triggering the related cellular events.
Chlorogenic acid likewise protected all the nucleotides (Figure 3B), where the m-OH portion of the caffeic acid formed HB with the C6-carbonyl group of the rG13 (dHB = 3.124 Å), whereas the p-OH group established electrostatic interactions with the C6-carbonyl group of the corresponding rG13 and with the C4-primary amine/imine of the second of the rC11 and rC12. The aliphatic path was oriented toward the rC11 to establish induced dipole interactions with the corresponding C4-primary amine/imine portion. Furthermore, the chlorogenic acid’s (−)-quinic acid portion faced the sense strand where the C1-OH made the HB with the rT43′s C4-carbonyl portion (dHB = 2.803 Å), whereas the C3-OH moiety electrostatically interfered with rT43′s C4-carbonyl portion and rA44′s C5-NH2 portion. The (−)-quinic acid adopted a binding conformation (Figure 3D) in which the p-OH group established HB with the C6-carbonyl portion (dHB = 2.932 Å) of rG41, whereas one of the two meta hydroxyl groups (either C3-OH or C5-OH) established HB with the rG41′s position N7 (dHB = 3.221 Å). Finally, the C1-OH formed HB (dHB = 2.546 Å) with a C4-carbonyl moiety of rT43 within the sense strand.

2.3.2. Genotoxic and Antigenotoxic Activities of N. cataria Leaf Methanol Extract (LME)

LME, administered at 200 mg/kg btw concentration exerted no genotoxic features related to CCl4 (the hazardous agent caused 5.52-fold higher tail moment value, 2.56-increment in the % rDNA in tail, and 7.78-fold increase in rtail length; Table 6: group II vs. group IV), and likewise increased the values of the corresponding markers compared to the control group (Table 6: group IV vs. group I 2.08-fold, 1.37-fold, and 1.22-fold higher values, yet with no significant differences (p > 0.05)), compared to N. cataria FME, its administration still caused the 1.82-fold increase in the rtail moment, as well as 1.13-fold and 1.09-fold increases in % of rDNA in tail and tail length, respectively (Table 6, group IV vs. III).
Nevertheless, the administration of N. cataria LME at 100 mg/kg bwt concentration (Table 7: group X) efficiently prevented the CCl4-induced rDNA damage (causing 1.95-fold lower total score than the hazardous agent; Table 7: group II vs. group X; but 2.08-fold higher one than within the control group; Table 7: group X vs. group I), yet with the lower value of percentage of reduction of 64.80% and still allowing for the slightly higher frequency of comet class 2 related to FME (Table 7: group X vs. group III).
Similarly, rosmarinic acid could in part explain the LME activity, given that it likewise allowed no comets from class 2 to class 4. Rosmarinic acid at 100 mg/kg bwt concentration protected the rDNA from the CCl4-caused damage, as proved by the 2.09-fold lower total score than the hazardous agent, but 2.12-fold higher one than within the control group, as well as with the percentage reduction of 67.25% (Table 8). Rosmarinic acid adopted a rather unusual sandwich-like binding conformation in which the aromatic moieties of caffeic acid and dihydrophenillactic acid portions were orthogonally related to each other. In that sense, the caffeic acid para hydroxyl group established HB with the C4-amine/imine portion of the rC12 (dHB = 3.308 Å), whereas the m-OH was strongly H-bonded with the C6-carbonyl portion (dHB = 2.247 Å) of the rG41. The aliphatic portion of rosmarinic acid spanned over the rDNA double strain in the above-described sandwich-like arrangement, where the free carboxylic group partially faced the rG41′s C6-NH2 group. Finally, the dihydrophenillactic acid meta hydroxyl group electrostatically attracted the C6-carboxyl portion and position N7 of the rG42, whereas the p-OH portion similarly attracted the C6-carboxyl portion and N7-nitrogen of the rG41.

2.3.3. Genotoxic and Antigenotoxic Activities of N. cataria Stem Methanol Extract (SME)

The extent of liver rDNA damage was significantly lower (p > 0.05) in animals treated with the N. cataria SME at 200 mg/kg bwt concentration compared to those treated with the hazardous agent (which caused 3.50-fold higher tail moment value, 1.42-increment in the % rDNA in the tail, and 4.40-fold increase in rtail length; Table 6: group I vs. group V). Furthermore, the extract could be harmful to the liver rDNA when compared with the reference group (3.28-fold higher rtail moment value, 2.47-increment in the % rDNA in tail, and 2.15-fold increase in tail length; Table 6, group V vs. group I).
Regarding antigenotoxicity, the lower concentration of 50 mg/kg bwt, compared to CCl4, showed the highest %R value of 77.05 (2.39-fold lower total score than the hazardous agent; Table 7: group II vs. group XII, but 1.71-fold higher one than within the control group; Table 7: group XII vs. group I) candidating SME for future potential applications. Regarding the %R value, SME at the lowest concentration (Table 7, group XII) performed similarly to FME at the highest concentration (Table 7, group VIII). Unfortunately, the SME showed a high level of rDNA damage (Table 7: group XII, comet class 3). In conclusion, chlorogenic acid, as the most abundant SME, contained a compound that represents the one most related to the extract activity.

3. Materials and Methods

3.1. Chemicals and Reagents

LC gradient-grade methanol and formic acid were purchased from J. T. Baker (Deventer, The Netherlands). Methanol, carbon tetrachloride, and dimethyl sulfoxide were obtained from Sigma-Aldrich (Steinheim, Germany). Reference standards of the phenolic compounds were obtained from Sigma-Aldrich (Steinheim, Germany) and Extrasynthese (Genay, France). Hanks balanced salt solution (HBSS), low melting point agarose, normal melting point agarose, bovine serum albumin, phosphate-buffered saline (PBS), lysis buffer, sodium hydroxide (NaOH), ethylenediaminetetraacetic acid (EDTA), absolute alcohol, ethidium bromide and 1,1,3,3-tetraethoxypropane were purchased from Sigma-Aldrich (Steinheim, Germany).

3.2. Plant Material

N. cataria flowers, leaves, and stems were collected at the end of the flowering season (June 2014) from natural populations in Serbia, Miljevici village, (altitude 920 m, 43°22′07′′ N, 19°35′25′′ E). The voucher sample was identified, classified, and deposited at the Herbarium of the Department of Biology and Ecology, Faculty of Science, the University of Kragujevac (no. MB03/14).

3.3. Preparation of the Extracts

The air-dried (in darkness, at room temperature) aerial parts of flowers, leaves, and stems of N. cataria were separately extracted with methanol, using Soxhlet apparatus, at 60 °C for 12 h. Filtered extracts were evaporated to dryness under vacuum at 40 °C using a rotary evaporator and stored in darkness at 4 °C until used.

3.4. Liquid Chromatography-ESI-MS/MS Tandem Mass Spectrometry Analysis

Quantitative analysis was performed on Agilent Technologies 1200 HPLC coupled to Agilent Technologies Triple Quadrupole 6420 tandem mass spectrometer (Santa Clara, CA, USA) with ESI source operating in negative ionization mode. MassHunter ver. B.03.01. software (Agilent Technologies, Santa Clara, CA, USA) was used for control of instruments, data acquisition, and data processing. The extracts of flowers, leaves, and stems of N. cataria were prepared as methanol solutions (concentrations 0.2 mg/mL). To construct calibration curves, methanolic standard solutions of eighteen phenolic compounds were prepared in the concentration range from 0.00153 to 50.00 μg/mL. Chromatographic separation as well as operating conditions of the mass spectrometer were the same as previously described [61,62]. Briefly, injected volumes of 5 μL of all solutions (analyzed samples or mixtures of standard compounds) were separated on a Zorbax Eclipse XDB-C18 RR 4.6 mm × 50 mm × 1.8 μm (Agilent Technologies, Santa Clara, CA, USA) column (temperature 45 °C, flow rate 1 mL/min). The mobile phase was aqueous formic acid (99.95–0.05%) (A) and methanol (B). Elution program: 0–6 min (30–70% B), 6–9 min (70–100% B), and 9–11 min (100% B).
Operating conditions of ESI source were: drying gas (N2) temperature 350 °C with a flow rate 9 L/min, nebulizer gas (N2) 40 psi, and capillary voltage 4 kV. Acquisition of data by previously described parameters (specific fragmentor voltages-Vf; collision cell voltages-Vc, selected precursor, and product ions) was performed in dynamic multiple reaction monitoring mode [61,62]. After the construction of calibration curves (peak areas vs. different concentrations of standard compounds), concentrations of phenolic compounds were derived from equations for linear regression. Results were given as means ± SD of three measurements.

3.5. N. cataria Secondary Metabolites Retrieval

All the obtained N. cataria secondary metabolites were purchased from the PlantMetaChem database (http://www.plantmetachem.com; accessed on 15 March 2020) and used without purification.

3.6. Animals and Study Design

Seventy male albino Wistar rats weighing 220 ± 20 g used in this study were obtained from the Animal House of Military Medical Academy, Belgrade, Serbia and acclimatized for three days before the experiment. Maintenance was under a 12 h light–dark cycle, with food and water available ad libitum. All animal procedures were approved by the Ethical Committee of the Faculty of Science, the University of Kragujevac, Number of Ethical Approval 2-06/2022, which acts following the relevant Serbian guidelines, including the Guidelines for the Care and Use of Laboratory Animals and Law on Animal Welfare (“Official Gazette of Republic of Serbia”, no. 810 41/09) and the European Directive for the Welfare of Laboratory Animals Directive 2010/63/EU.
Male albino rats were equally divided into fourteen groups consisting of five animals in each group and treated orally for five days, as follows: group I (normal control) was daily given distilled water (500 mL per animal) and then intraperitoneally (i.p.) injected with 1 mL/kg body weight (bwt) of commercial olive oil (Monini Olio Extra Vergine di Oliva). Group II, positive control, was orally given distilled water for five days, and then i.p. injected with a single dose of 1 mL/kg body weight CCl4 (1:1 mixture in olive oil) [35]. For the hepatotoxicity and genotoxicity studies, the animals in groups III-V separately received orally a single dose of 200 mg/kg bwt of FME, LME, and SME, each dissolved in commercial olive oil, for five days. For the hepatoprotective and antigenotoxic studies, the animals in groups VI-VIII were administrated with FME of N. cataria at 50, 100, and 200 mg/kg bwt, dissolved in commercial olive oil; animals in groups IX-XI were treated with LME of N. cataria at 50, 100 and 200 mg/kg bwt, dissolved in commercial olive oil, respectively, whereas the animals in in groups XII-XIV were treated with LME of N. cataria at 50, 100 and 200 mg/kg bwt, dissolved in commercial olive oil. On the last day of the treatment, the animals of groups II-XI received i.p. a single dose of 1 mL/kg body weight CCl4 (1:1 mixture in olive oil). Twenty-four hours after CCl4 injection, all the animals were anesthetized with ethyl ether and afterward sacrificed, and their livers and blood (from the abdominal vein) were collected immediately in non-heparinized tubes.
The additional experiments were conducted using the quantified metabolites of N. cataria using a similar experimental setup as for hepatoprotective and antigenotoxic studies: each new group of the experimental animals (five animals per group) was treated per os with a single dose of the investigated compound, either 50, 100, and 200 mg/kg body weight, before the i.p. administration of CCl4 (1 mL/kg bwt).

3.7. Determination of Hepatoprotective Activity

3.7.1. Measurement of Serum Toxicity Markers

The serum for determination of biochemical parameters, aspartate transaminase (AST), alanine transaminase (ALT), alkaline phosphatase (ALP), and γ-glutamyltransferase (γ-GT) was prepared by the Quick method [63], immediately immersed in liquid nitrogen, and stored at −80 °C until use. The catalytic activities of AST and ALT at 340 nm, as well as that of ALP and γ-GT at 405 nm, were determined by UV–VIS kinetic methods according to recommendations of the Expert Panel of the IFCC (International Federation of Clinical Chemistry) [64,65,66,67]. Total protein concentrations were determined according to the Lowry method using bovine serum albumin as the standard [68]. All kinetic and colorimetric measurements were performed using a Dynamica HALO DB-20 UV-VIS spectrophotometer.

3.7.2. Measurement of Liver Homogenate Antioxidant Markers

Rat liver samples were homogenized in phosphate buffer (5 mM, pH 7.4) to yield a 10% (w/v) homogenate and then centrifuged at 4000 rpm for 15 min at 4 °C. The supernatants were used to estimate the catalytic activity of superoxide dismutase (SOD) [39], the level of TBARS [40], the catalytic activity of catalase (CAT) [41], and the concentration of reduced glutathione (GSH) [41] by the colorimetric method. Total protein concentrations were determined according to the Lowry method [68]. All colorimetric measurements were performed using a Dynamica HALO DB-20 UV-VIS spectrophotometer.

3.8. Determination of Genotoxic Activity

3.8.1. Detection of DNA Damage

The alkaline single cell gel electrophoresis assay was performed as described in the literature [58]. The liver samples were excised, and small fragments of livers were transferred on ice. The fragments were washed, minced and suspended into 1 mL ice-cold Hank’s balanced salt solution (HBSS; 0.14 g/L CaCl2, 0.4 g/L KCl, 0.06 g/L KH2PO4, 0.1 g/L MgCl2 × 6H2O, 0.1 g/L MgSO4 × 7H2O, 8.0 g/L NaCl, 0.35 g/L NaHCO3, 0.09 g/L Na2HPO4 × 7H2O, 1.0 g/L D-glucose, 20 mM EDTA and 10% DMSO). A fresh mincing solution was added, and the liver samples were minced again into finer pieces. From the liver cell suspension, 10 μL was mixed with 75 μL of 1% low melting point agarose (in Ca+2 and Mg+2 free PBS, pH 7.4). From the final cell–agarose suspension, 85 μL was spread over the microscope slide pre-coated with 1.5% normal melting point agarose in PBS buffer and covered with cover-glass. The gel was allowed to set at 4°C, and cells were lysed for a period of at least 2 h in cold lysis buffer (2.5 M NaCl, 100 mM EDTA, 10 mM Tris, 1% Triton X-100, 10% DMSO, pH 10.0). After lysis, the slides were then alkaline-unwound, and then, electrophoresis was carried out using the electrophoresis buffer (300 mM NaOH and 1 mM EDTA, pH > 13) at 4 °C for 30 min at 25 V with the current adjusted to 300 mA. After electrophoresis, the slides were then neutralized with neutralization buffer (0.4 M Tris-HCL, pH 7.4), three times for 5 min and fixed for 5 min in absolute alcohol, air-dried, and stored at room temperature. Immediately before analysis, the slides were stained with 75 μL ethidium bromide (20 μg/mL) and covered with a cover slip.

3.8.2. Data Scoring and Photomicrographs

Comets were visualized and captured with 400× objective lens of fluorescence microscope Nikon (Ti-Eclipse) attached to CCD camera. One hundred comet images per slide were randomly captured and analyzed. Comets without heads and with almost all the DNA in the tail or with a wide tail were excluded from the analysis since they could represent dead cells. Cells that did not overlap and had a clear margin surrounding them were scored [69].
Three parameters were selected as indicators of DNA damage: tail moment, tail length, and % DNA in comet tail [70]. According to Collins, comets were classified into five categories defined as types 0, 1, 2, 3 and 4 (no or low damage, low, medium and long DNA migration, and the highest level of degradation, respectively) [70]. The total comet score and the percentage reduction (%R) in the total comet score was calculated using Formula (1):
% R = mean   total score in A mean   total score in B mean   total   score in A mean   total score in C × 100
where A is the mean of total score in positive control, B mean of total score in pretreatment with the extracts prior to CCl4, and C is the mean of total score in negative control [71,72].

3.9. Statistical Analysis

Data were analyzed using SPSS statistical software package (version 13.0). One-way analysis of variance (ANOVA) followed by T3 Dunnett test or with Bonferroni test for post hoc comparison between controls and treated groups was used. The results were considered to be statistically significant at p < 0.05.

3.10. Structure-Based Studies

3.10.1. Ligands Modeling

The naturally occurring compound structures were collected from the PlantMetaChem database. Each of the compounds was retrieved in Structure Data File (SDF) format, added of hydrogens and charges (the Gasteiger model) at the physiological pH, by means of the OpenBabel toolkit [73] and energy minimized by virtue of OpenBabel’s obconformer module: the lowest energy conformer was selected from 100 conformations after 100 geometry optimization steps using a Monte Carlo search. Optimized compounds were stored in mol2 format for further manipulation.
MDA was drawn and modeled using the Chemaxon’s msketsh module [74] by means of molecular mechanics optimization upon which the correct protonation at pH 7.4 was assigned.

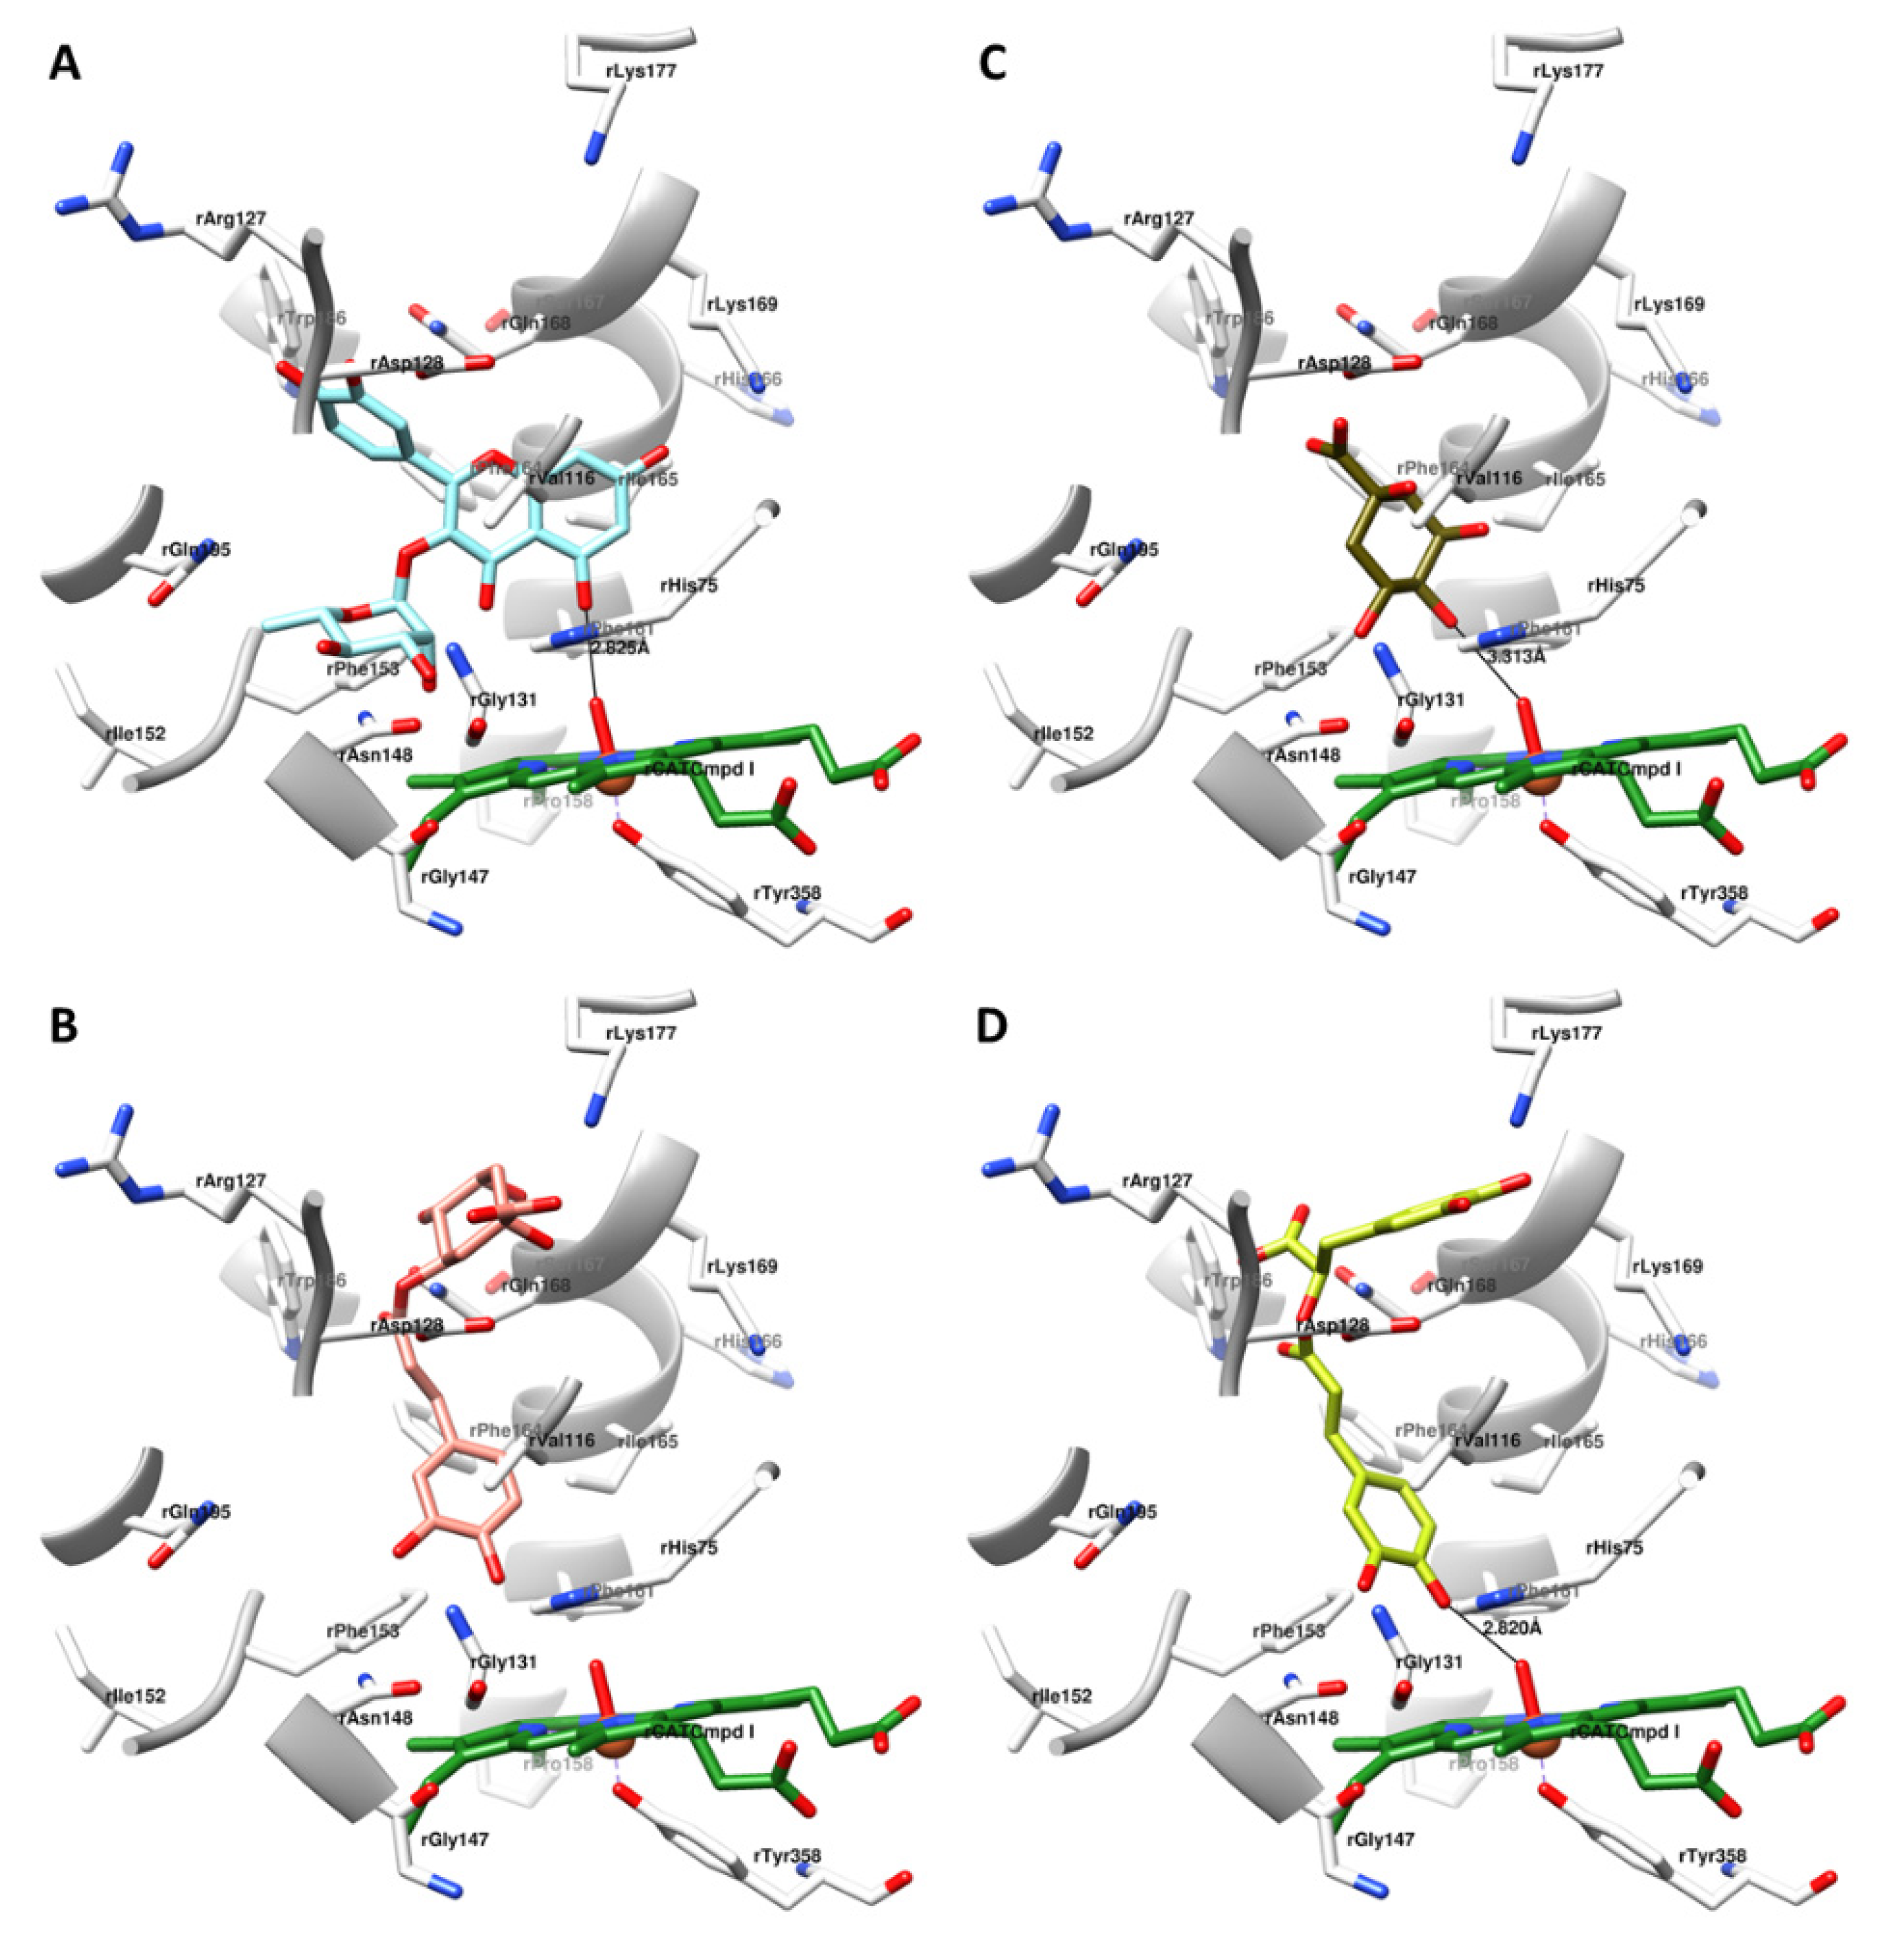
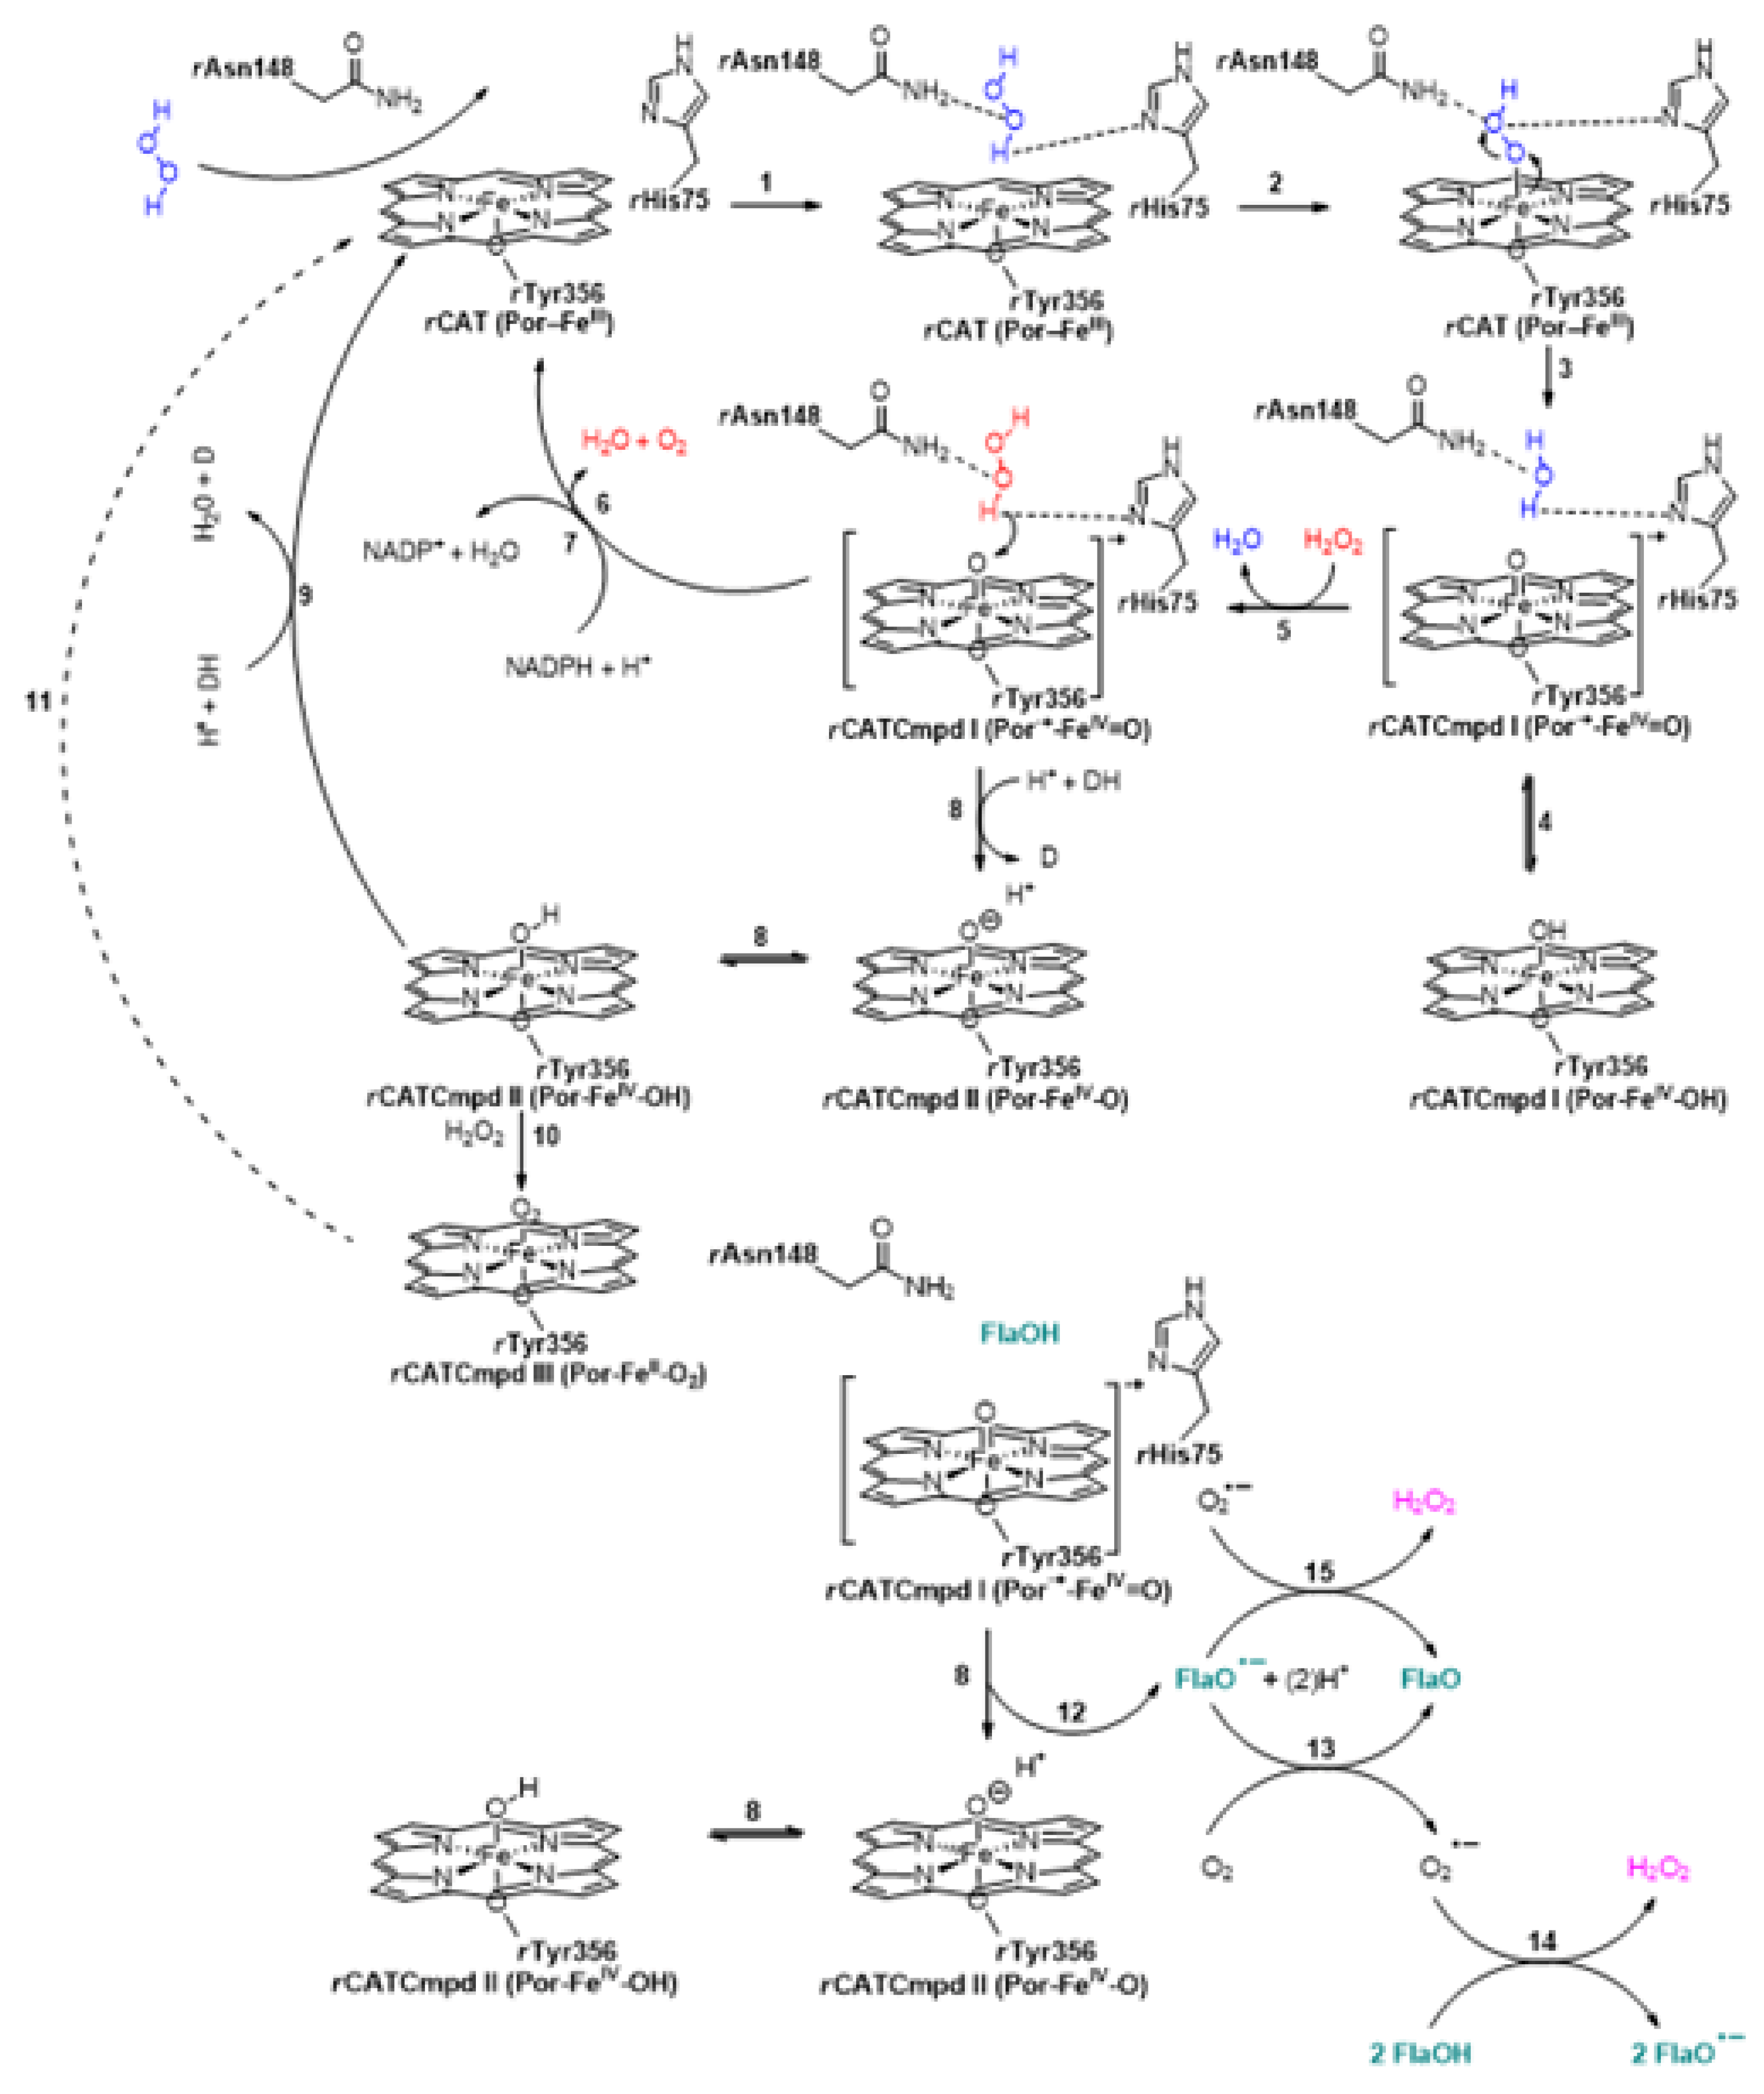
3.10.2. N. cataria Secondary Metabolites Bioactive Conformations Determination within the rCATCmpd I

The R. norvegicus catalase compound I was prepared from the three-dimensional structure of rat erythrocyte catalase retrieved from AlphaFold database (ID: P04762 (CATA_RAT)) (https://alphafold.ebi.ac.uk; accessed on 15 March 2020) [75,76]. The structure was loaded into UCSF Chimera [76] and visually inspected. The protein was further improved by adding hydrogen atoms using the embedded leap module of Amber 12 suite [77] upon which the correct hydrogen atoms, appropriate for pH 7.4, were assigned to each amino acid residue. Protein was then energy minimized as follows: through the leap module, they were solvated with water molecules (TIP3P model, SOLVATEOCT Chimera command) in a box extending 10 Å in all directions, neutralized with either Na+ or Cl ions, and refined by a single point minimization using the Sander module of Amber suite with maximum 1000 steps of the steepest-descent energy minimization and maximum 4000 steps of conjugate-gradient energy minimization, with a non-bonded cutoff of 5 Å. From the properly prepared complex, the human catalase compound I was created by means of the Chimera Tools, invoking the Build Structure module and Modify Structure functions, by changing the appropriate hybridization of iron and oxygen within the oxoferryl porphyrin π-cation radical state. The newly formed structure was then energy-minimized following the exact procedure as described above, and afterward used for molecular docking.
The modeled enzyme was further manipulated by removing the nonpolar hydrogen atoms, while Gasteiger charges and solvent parameters were added. Afterward, the obtained N. cataria secondary metabolites were docked using the following experimental setup. The rigid root and rotatable bonds were defined using AutoDockTools [77]. The docking was performed with AutoDock 4.2 [77]. Before actual docking, the grid spacing had been determined by means of the modified hem ring within the rat catalase compound I: the XYZ coordinates (in Ångströms) of the cuboid grid box used for the computation were Xmin/Xmax = 3.329/29.969, Ymin/Ymax = 28.466/52.199, Zmin/Zmax = 44.984/67.222 to embrace the space spanning 10 Å in all three dimensions. The Lamarckian Genetic Algorithm was used to generate the bioactive conformations within the active site. The global optimization started with a population of 200 randomly positioned individuals, a maximum of 1.0 × 10⁶ energy evaluations, and a maximum of 27,000 generations. In total, 100 runs were performed with RMS Cluster Tolerance of 0.5 Å.

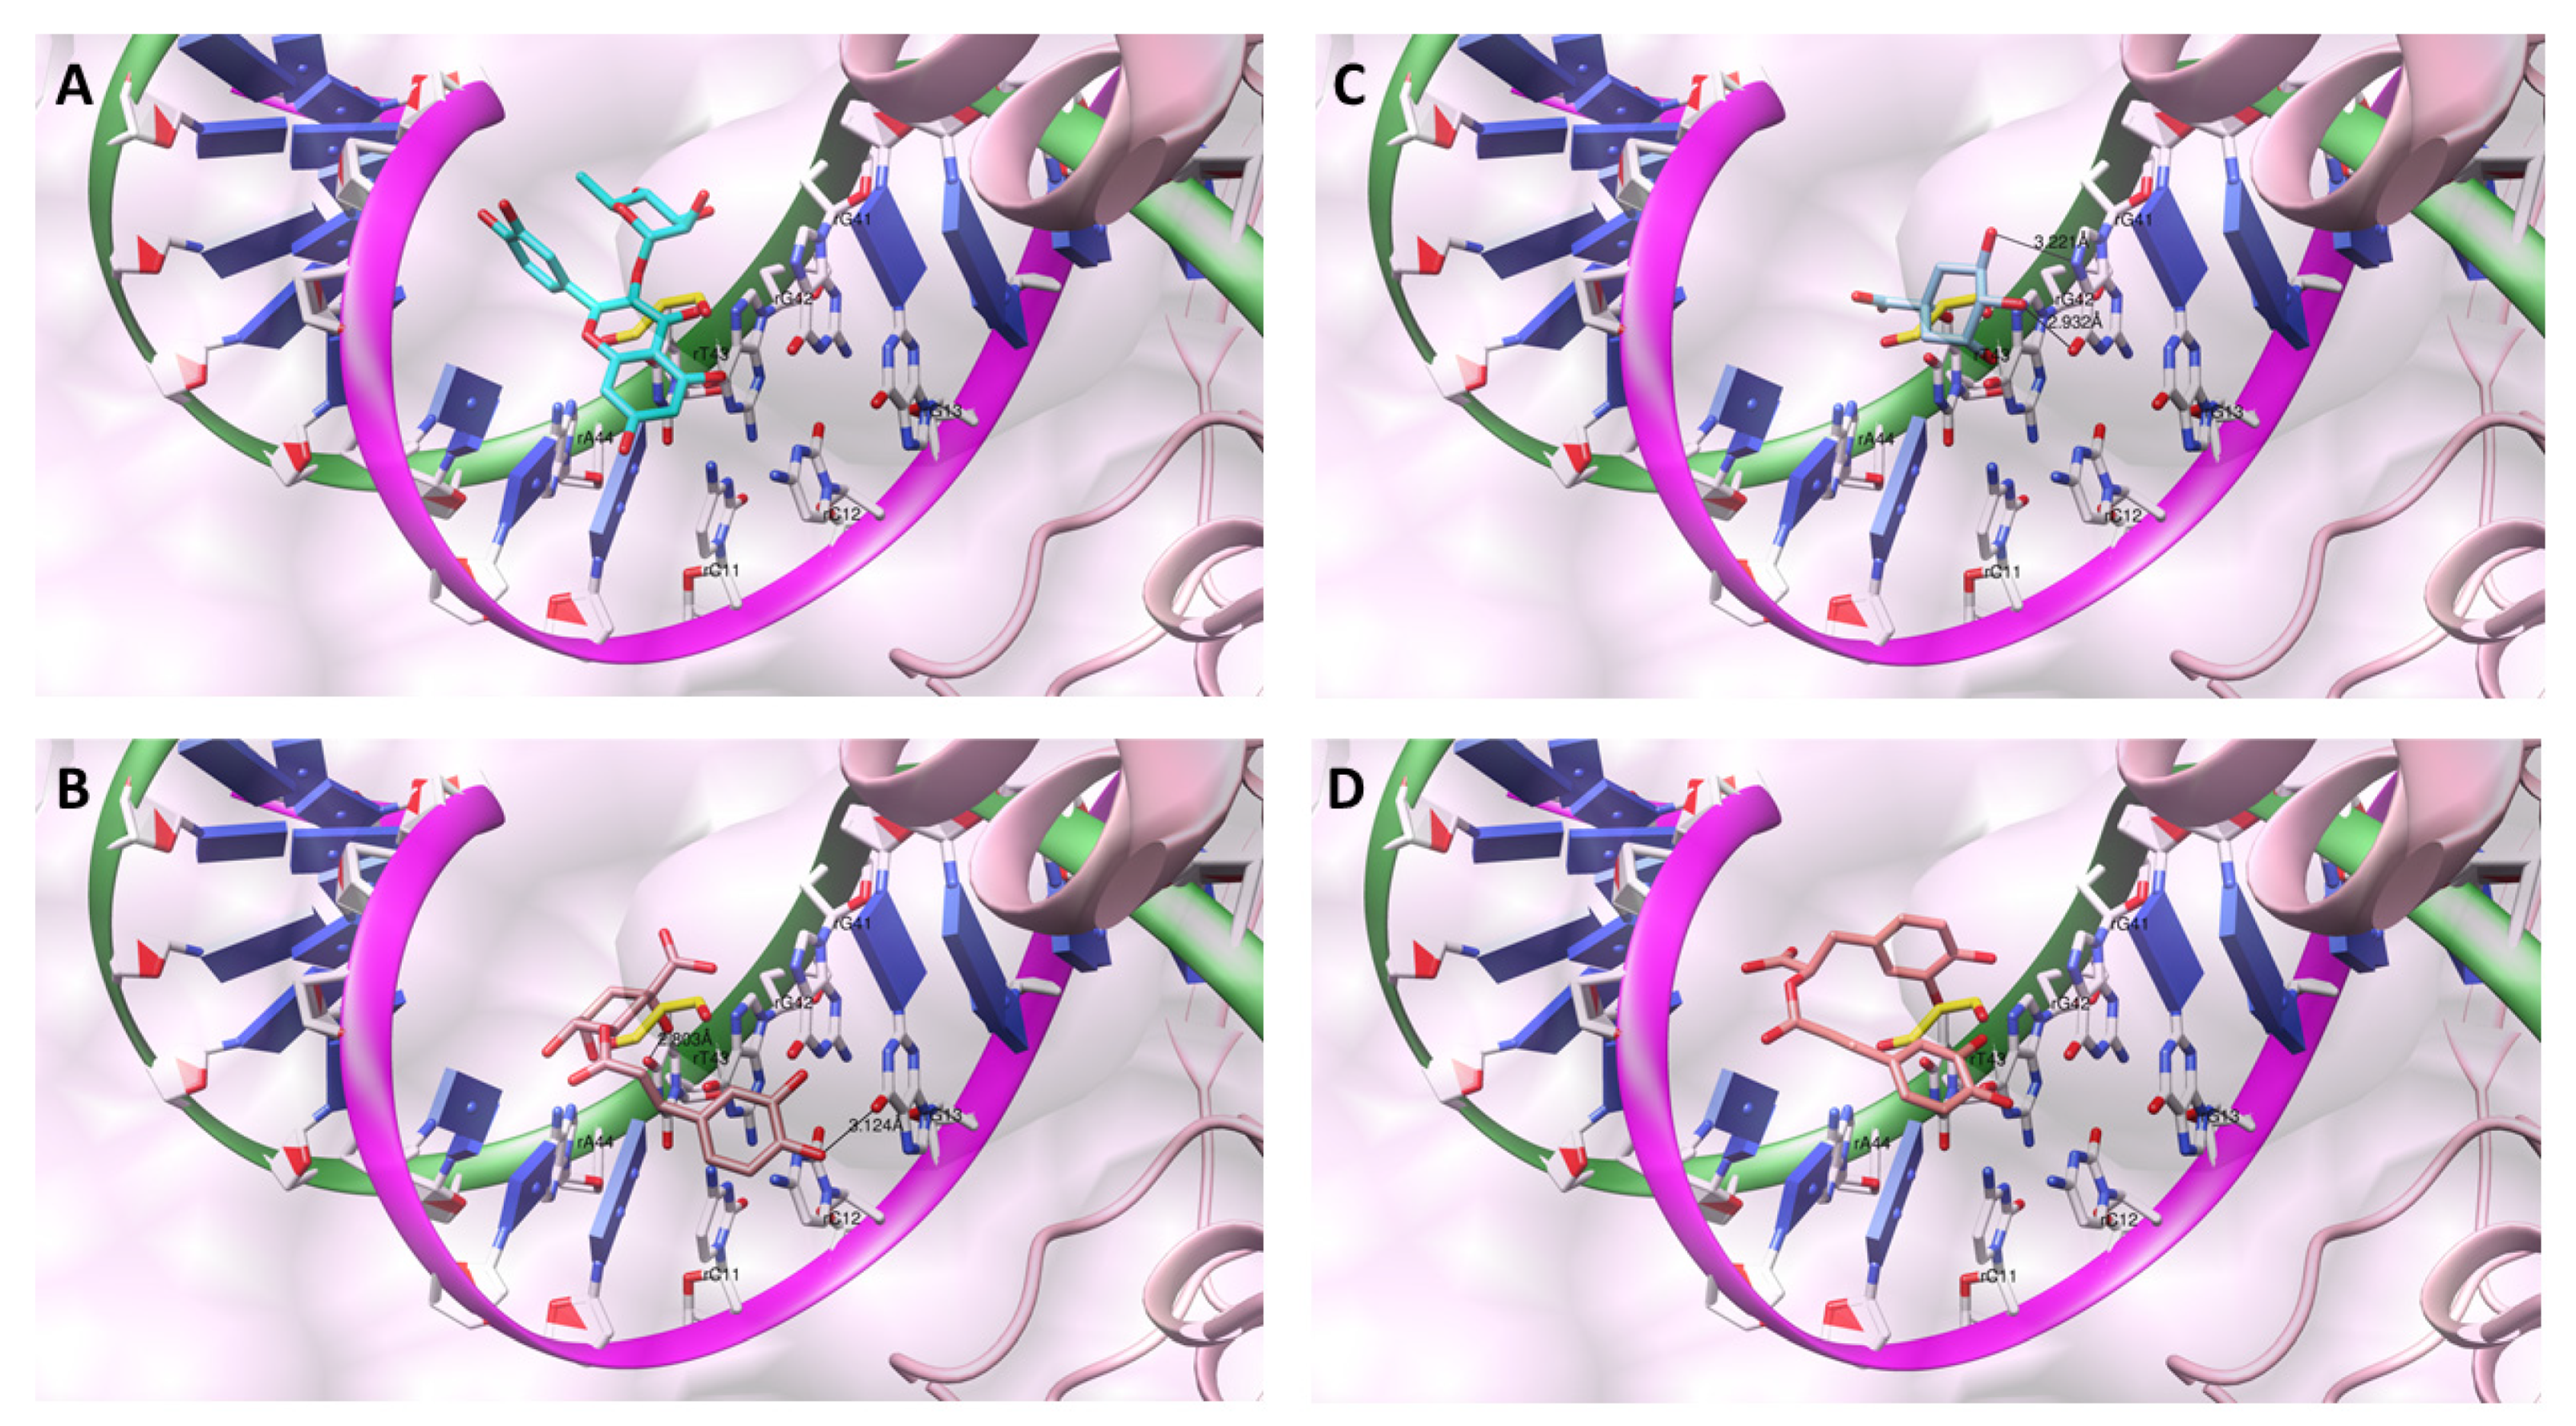
3.10.3. N. cataria Secondary Metabolites Bioactive Conformations Determination within the rTopIIα

Considerations of genotoxic and antigenotoxic mechanistic studies require a profound knowledge of R. norvegicus TopIIα structure. As mentioned before, rTopIIα is a homodimer consisting of three independent but merged-in-action subregions called rN-terminal, rDNA-binding and cleavage, and rC-terminal domains [60]. The structure of each rN-terminal bears the rATPase domain with the function to accept and hydrolyze an rATP molecule prior and upon the rDNA ligation and religation, respectively. The interaction of the rATPase with rATP induces domain dimerization or separation, resulting in the closing and opening of the rN-gate, respectively [60]. The rDNA-binding and cleavage region is formed by the rTOPRIM (TOpoisomerase/PRImase) domain, which contains rMg2+ involved in the rDNA cleavage mechanism, and rWHD (winged-helix domain) area, bearing the active site tyrosine. In the end, the rC-terminus itself acts as C-gate [60].
Therefore, the structure-based studies within rTopIIα’s DNA-binding and cleavage region were performed on a homology-modeled enzyme, using the identical experimental setup as described elsewhere [60] by means of AutoDock Vina [78]. The enzyme was prepared upon and was loaded into UCSF Chimera software [79] and improved by adding hydrogen atoms using the leap module of Amber 12 suite [80], upon which the correct protonation at pH = 7.4 was assigned to each amino acid and nucleic acid residue by means of the Antechamber module of Amber 12 suite. The complex was then solvated (SOLVATEOCT command) in a box entering 10 Å with water molecules (TIP3 model), neutralized with Na+ and Cl ions, and refined by a single point minimization using the Sander module of AMBER suite in 1000 steps of the steepest-descent energy minimization followed by 4000 steps of conjugate-gradient energy minimization, with a non-bonded cutoff of 5 Å.
For Vina, the XYZ coordinates (in Ångströms) of the cuboid grid box used for the computation were Xmin/Xmax = 4.543/26.767, Ymin/Ymax = 31.324/57.443, Zmin/Zmax = 41.324/75.656 to embrace the space spanning 10 Å in all three dimensions. The docking simulations were carried out with an energy range of 10 kcal/mol and exhaustiveness of 100 with RMS Cluster Tolerance of 0.5 Å. The output comprised 20 different conformations for every receptor considered.

4. Conclusions

The enclosed report presents for the first time the LC-ESI-MS/MS analysis of phenolic compounds, as well as hepatoprotective and antigenotoxic activities of the methanol extracts of various N. cataria plant organs. The FME was characterized by high concentrations of quercitrin, chlorogenic acids, and quinic acid, while the most abundant compounds in the LME and SME were rosmarinic and chlorogenic acid, respectively.
Extracts were assayed in vivo with Wistar rats to investigate liver intoxication with CCl4, which through metabolic activation has generated hepatotoxic metabolites, namely trichloromethyl (rCCl3) and trichloromethylperoxy (rCCl3OO) radicals. While entering the hepatocytes, the radicals induced the malondialdehyde (rMDA)-based peroxidation of polyunsaturated fatty acids in the membrane of the hepatocyte. The examined extracts protected the membrane of the hepatocyte from disruption, as evaluated by the status of liver antioxidant (rSOD, rTBARS, rCAT, and rGSH) and toxicity markers (rAST, rALT, rALP, and rγ-GT), where the N. cataria FME, LME, and SME at 200, 100, and 50 mg/kg bwt concentrations, respectively, could be considered as potential candidates as supplements for hepatoprotection. Special attention was also given to the secondary metabolites present in the extracts that were investigated similarly to the extracts. All the tested pure compounds exerted a profile related to that of extracts leading to assess the most abundant compounds as bearers of extract properties, although with some synergistics still to be investigated. A computational procedure supported the experimental data and indicated that all secondary metabolites can decrease the catalytic activity of R. norvegicus rCAT, based on SB investigation in terms of their interaction with the enzyme’s a porphyrin–radical cation, called R. norvegicus catalase compound I (rCATCmpd I), resulting in the appearance of rCATCmpd II, at the same time transforming themselves to the corresponding semiquinone radicals forcing the formation of new amounts of rH2O2.
At the rDNA level, the rCCl3˙ and rCCl3OO˙ radicals may participate in the generation of rMDA that could interfere with the liver rDNA and form rdG, rdA, and rdC adducts, subsequently oxidized to rM1G, rM1A, and rM1C with a fate to endue as rN2-oxopropenyl-dG, rN2-oxopropenyl-dA, and rN2-oxopropenyl-dC adducts causing the R. norvegicus TopIIα-catalyzed rDNA-DNA inter-strand cross-links or rDNA-protein inter-strand crosslinks. In that sense, the results of antigenotoxic activity by means of comet assay provided evidence that all tested extracts cause a decrease in the level of rDNA damage induced by the CCl4, lowering the total score and percentage of reduction of rDNA and forbidding the appearance of comet classes associated with the severe damage. Within the extracts, the found secondary metabolites exerted antigenotoxicity upon occupying the rDNA binding and cleavage domain of R. norvegicus TopIIα, for which they denied the rMDA to form the aberrant adducts.
With the fact that N. cataria is extensively used in pet toys, together with its significant role in traditional medicine, the above-mentioned results for the first time confirm the plant’s safety from the point of absence of hepatotoxicity and genotoxicity and its possible use as a hepatoprotective and antigenotoxic agent.

Supplementary Materials

The following supporting information (Figures S1–S6) can be downloaded at: https://www.mdpi.com/article/10.3390/plants11162114/s1.

Author Contributions

Conceptualization, N.L.V., M.M., N.T., S.M. and M.K.; methodology, N.L.V., M.M., N.T., S.M., S.S. and R.R.; software, M.D.V., N.T., S.M. and M.M.; validation, M.D.V., N.T. and S.M.; formal analysis, S.S.; investigation, M.D.V., N.L.V., M.M., N.T., S.M., S.S., F.S., R.R. and M.B.; resources, N.L.V., M.M. and S.M.; data curation, N.T. and S.M.; writing—original draft preparation, N.L.V., N.T. and S.M.; writing—review and editing, M.D.V., N.L.V., M.M., N.T., S.M., S.S., R.R. and M.B.; visualization, M.D.V., M.M. and M.K.; supervision, S.S. and M.K.; project administration, N.L.V., S.M. and M.K.; funding acquisition, N.L.V., S.M. and M.K. All authors have read and agreed to the published version of the manuscript.

Funding

This work was supported by the grant APVV SK-BY-RD-19-0014 “The formulation of novel compositions and properties study of the polysaccharides based edible films and coatings with antimicrobial and antioxidant plant additives.”

Institutional Review Board Statement

All animal procedures were approved by the Ethical Committee of the Faculty of Science, the University of Kragujevac (number of ethical approval 2-06/2022), which acts by following the relevant Serbian guidelines, including the Guidelines for the Care and Use of Laboratory Animals and Law on Animal Welfare (“Official Gazette of Republic of Serbia”, no. 810 41/09) and the European Directive for the Welfare of Laboratory Animals Directive 2010/63/EU.

Informed Consent Statement

Not applicable.

Data Availability Statement

Not applicable.

Acknowledgments

This research was supported by the Serbian Ministry of Education, Science and Technological Development (agreement no. 451-03-68/2022-14/200122 and agreement no. 451-03-68/2022-14/200378), by two grants from Progetti di Ricerca di Università 2015, Sapienza Università di Roma (C26A15RT82 and C26A15J3BB).

Conflicts of Interest

The authors declare no conflict of interest.

References

  1. Jamzad, Z.; Grayer, R.J.; Kite, G.C.; Simmonds, M.S.J.; Ingrouille, M.; Jalili, A. Leaf surface flavonoids in Iranian species of Nepeta (Lamiaceae) and some related genera. Biochem. Syst. Ecol. 2003, 31, 587–600. [Google Scholar] [CrossRef]
  2. Bourrel, C.; Perineau, F.; Michel, G.; Bessiere, J.M. Catnip (Nepeta cataria L.) essential oil: Analysis of chemical constituents, bacteriostatic and fungistatic properties. J. Essent. Oil Res. 1993, 5, 159–167. [Google Scholar] [CrossRef]
  3. Sharma, A.; Cooper, R.; Bhardwaj, G.; Cannoo, D.S. The genus Nepeta: Traditional uses, phytochemicals and pharmacological properties. J. Ethnopharmacol. 2021, 268, 113679. [Google Scholar] [CrossRef] [PubMed]
  4. Formisano, C.; Rigano, D.; Senatore, F. Chemical constituents and biological activities of Nepeta species. Chem. Biodivers. 2011, 8, 1783–1818. [Google Scholar] [CrossRef]
  5. Salehi, P.; Sonboli, A.; Allahyari, L. Antibacterial and antioxidant properties of the essential oil and various extracts of Nepeta ispahanica from Iran. J. Essent. Oil Bear. Plants 2007, 10, 324–331. [Google Scholar] [CrossRef]
  6. Zomorodian, K.; Saharkhiz, M.J.; Shariati, S.; Pakshir, K.; Rahimi, M.J.; Khashei, R. Chemical composition and antimicrobial activities of essential oils from Nepeta cataria L. against common causes of food-borne infections. ISRN Pharm. 2012, 2012, 591953. [Google Scholar] [CrossRef]
  7. Suntar, I.; Nabavi, S.M.; Barreca, D.; Fischer, N.; Efferth, T. Pharmacological and chemical features of Nepeta L. genus: Its importance as a therapeutic agent. Phytother. Res. 2017, 32, 185–198. [Google Scholar] [CrossRef]
  8. Mišić, D.; Šiler, B.; Gašić, U.; Avramov, S.; ŽivkoviĆ, S.; Živković, J.N.; Milutinović, M.; Tešić, Ž. Simultaneous UHPLC/DAD/(+/-)HESI-MS/MS Analysis of phenolic acids and nepetalactones in methanol extracts of Nepeta species: A possible application in chemotaxonomic studies. Phytochem. Anal. 2015, 26, 72–85. [Google Scholar] [CrossRef]
  9. Lichman, B.R.; Godden, G.T.; Hamilton, J.P.; Palmer, L.; Kamileen, M.O.; Zhao, D.; Vaillancourt, B.; Wood, J.C.; Sun, M.; Kinser, T.J.; et al. The evolutionary origins of the cat attractant nepetalactone in catnip. Sci. Adv. 2020, 6, eaba0721. [Google Scholar] [CrossRef]
  10. Tagawa, M.; Murai, F. A new iridoid glucoside, nepetolglucosylester from Nepeta cataria. Planta Med. 1980, 39, 144–147. [Google Scholar] [CrossRef]
  11. Xie, S.; Uesato, S.; Inouye, H.; Fujita, T.; Murai, F.; Tagawa, M.; Shingu, T. Absolute structure of nepetaside, a new iridoid glucoside from Nepeta cataria. Phytochemistry 1988, 27, 469–472. [Google Scholar] [CrossRef]
  12. Tungmunnithum, D.; Thongboonyou, A.; Pholboon, A.; Yangsabai, A. Flavonoids and other phenolic compounds from medicinal plants for pharmaceutical and medical aspects: An overview. Medicines 2018, 5, 93. [Google Scholar] [CrossRef] [PubMed]
  13. Eid, H.H.; Labib, R.M.; Hamid, N.S.A.; Hamed, M.A.; Ross, S.A. Hepatoprotective and antioxidant polyphenols from a standardized methanolic extract of the leaves of Liquidambar styraciflua L. Bull. Fac. Pharm. Cairo Univ. 2015, 53, 117–127. [Google Scholar] [CrossRef]
  14. Bojić, M.; Maleš, Ž.; Antolić, A.; Babić, I.; Tomičić, M. Antithrombotic activity of flavonoids and polyphenols rich plant species. Acta Pharm. 2019, 69, 483–495. [Google Scholar] [CrossRef] [PubMed]
  15. de Araujo, F.F.; de Paulo Farias, D.; Neri-Numa, I.A.; Pastore, G.M. Polyphenols and their applications: An approach in food chemistry and innovation potential. Food Chem. 2021, 338, 127535. [Google Scholar] [CrossRef] [PubMed]
  16. Di Lorenzo, C.; Colombo, F.; Biella, S.; Stockley, C.; Restani, P. Polyphenols and human health: The role of bioavailability. Nutrients 2021, 13, 273. [Google Scholar] [CrossRef]
  17. Kumar, N.; Goel, N. Phenolic acids: Natural versatile molecules with promising therapeutic applications. Biotechnol. Rep. 2019, 24, e00370. [Google Scholar] [CrossRef]
  18. Sharma, A.; Nayik, G.A.; Cannoo, D.S. Pharmacology and Toxicology of Nepeta cataria (Catmint) Species of Genus Nepeta: A Review. In Plant and Human Health; Ozturk, M., Hakeem, K., Eds.; Springer: Cham, Switzerland, 2018; Volume 3. [Google Scholar] [CrossRef]
  19. Smitherman, L.C.; Janisse, J.; Mathur, A. The use of folk remedies among children in an urban black community: Remedies for fever, colic, and teething. Pediatrics 2005, 115, e297–e304. [Google Scholar] [CrossRef]
  20. Hatch, R.C. Effect of drugs on catnip (Nepeta cataria)-induced pleasure behavior in cats. Am. J. Vet. Res. 1972, 33, 143–155. [Google Scholar]
  21. Jackson, B.; Reed, A. Catnip and the alteration of consciousness. J. Am. Med. Assoc. 1969, 207, 1349–1350. [Google Scholar] [CrossRef]
  22. Barcelos, G.R.M.; Grotto, D.; Angeli, J.P.F.; Serpeloni, J.M.; Rocha, B.A.; Bastos, J.K.; Barbosa, F. Evaluation of antigenotoxic effects of plant flavonoids quercetin and rutin on HepG2 cells. Phytother. Res. 2011, 25, 1381–1388. [Google Scholar] [CrossRef]
  23. Lee, S.; Lee, J.; Lee, H.; Sung, J. Relative protective activities of quercetin, quercetin-3-glucoside, and rutin in alcohol-induced liver injury. J. Food Biochem. 2019, 43, e13002. [Google Scholar] [CrossRef] [PubMed]
  24. Sarkar, D.; Sharma, A.; Talukder, G. Plant extracts as modulators of genotoxic effects. Bot. Rev. 1996, 62, 275–300. [Google Scholar] [CrossRef]
  25. Modnicki, D.; Tokar, M.; Klimek, B. Flavonoids and phenolic acids of Nepeta cataria L. var. citriodora (Becker) BALB. (Lamiaceae). Acta Pol. Pharm. 2007, 64, 247–252. [Google Scholar] [PubMed]
  26. Del Carmen García-Rodríguez, M.; Carvente-Juarez, M.M.; Altamirano-Lozano, M.A. Antigenotoxic and apoptotic activity of green tea polyphenol extracts on hexavalent chromium-induced DNA damage in peripheral blood of CD-1 mice: Analysis with differential acridine orange/ethidium bromide staining. Oxid. Med. Cell. Longev. 2013, 2013, 486419. [Google Scholar] [CrossRef]
  27. Kaur, P.; Walia, A.; Kumar, S.; Kaur, S. Antigenotoxic activity of polyphenolic rich extracts from Aegle marmelos (L.) Correa in human blood lymphocytes and E. coli PQ 37. Rec. Nat. Prod. 2009, 3, 68–75. [Google Scholar]
  28. Marnett, L.J. Oxyradicals and DNA damage. Carcinogenesis 2000, 21, 361–370. [Google Scholar] [CrossRef]
  29. Higuchi, H.; Gores, G.J. Mechanisms of liver injury: An overview. Curr. Mol. Med. 2003, 3, 483–490. [Google Scholar] [CrossRef]
  30. Hensley, K.; Robinson, K.; Gabbita, S.P.; Salsman, S.; Floyd, R.A. Reactive oxygen species, cell signaling, and cell injury. Free Radic. Biol. Med. 2000, 28, 1456–1462. [Google Scholar] [CrossRef]
  31. Nandita, S.; Vasudeva, K.; Narasimhamurthy, K.; Rajini, P.S. Protective effect of potato peel extracts against carbon tetrachloride-induced liver injury in rats. Environ. Toxicol. Pharmacol. 2008, 26, 241–246. [Google Scholar] [CrossRef]
  32. Hubert, D.J.; Dawe, A.; Florence, N.T.; Gilbert, K.D.; Angele, T.N.; Buonocore, D.; Finzi, P.V.; Vidari, G.; Bonaventure, N.T.; Marzatico, F.; et al. In vitro hepatoprotective and antioxidant activities of crude extract and isolated compounds from Ficus gnaphalocarpa. Inflammopharmacol. 2011, 19, 35–43. [Google Scholar] [CrossRef] [PubMed]
  33. Esmat, A.Y.; Said, M.M.; Soliman, A.A.; El-Masry, K.S.; Badiea, E.A. Bioactive compounds, antioxidant potential, and hepatoprotective activity of sea cucumber (Holothuria atra) against thioacetamide intoxication in rats. Nutrition 2013, 29, 258–267. [Google Scholar] [CrossRef] [PubMed]
  34. Yang, S.Y.; Hong, C.O.; Lee, G.P.; Kim, C.T.; Lee, K.W. The hepatoprotection of caffeic acid and rosmarinic acid, major compounds of Perilla frutescens, against t-BHP-induced oxidative liver damage. Food Chem. Toxicol. 2013, 55, 92–99. [Google Scholar] [CrossRef] [PubMed]
  35. Szende, B.; Timár, F.; Hargitai, B. Olive oil decreases liver damage in rats caused by carbon tetrachloride (CCl4). Exp. Toxicol. Pathol. 1994, 46, 355–359. [Google Scholar] [CrossRef]
  36. Abdel-Wahhab, K.G.E.D.; El-Shamy, K.A.; El-Beih, N.A.E.Z.; Morcy, F.A.; Mannaa, F.A.E. Protective effect of a natural herb (Rosmarinus officinalis) against hepatotoxicity in male albino rats. Comun. Sci. 2011, 2, 9–17. [Google Scholar] [CrossRef]
  37. Carini, R.; Chiarpotto, E.; Biasi, F.; Leonarduzzi, G.; Comoglio, A.; Carpi, C.; Poli, G. Relation between liver necrosis and intrahepatic cholestasis in rats poisoned with CCl4. Boll. Soc. Ital. Biol. Sper. 1987, 63, 273–280. [Google Scholar]
  38. Milani, L.; Galindo, C.M.; de Oliveira, N.M.T.; Corso, C.R.; Adami, E.R.; Stipp, M.C.; Beltrame, O.C.; Acco, A. The GLP-1 analog liraglutide attenuates acute liver injury in mice. Ann. Hepatol. 2019, 18, 918–928. [Google Scholar] [CrossRef]
  39. Misra, H.P.; Fridovich, I. The role of superoxide anion in the auto-oxidation of epinephrine and simple assay for superoxide dismutase. J. Biol. Chem. 1972, 247, 3170–3175. [Google Scholar] [CrossRef]
  40. Ohkawa, H.; Ohishi, N.; Yagi, K. Assay for lipid peroxides in animal tissues by thiobarbituric acid reaction. Anal. Biochem. 1979, 95, 351–358. [Google Scholar] [CrossRef]
  41. Goth, L.A. A simple method for determination of serum catalase activity and revision of reference range. Clin. Chim. Acta 1991, 196, 143–152. [Google Scholar] [CrossRef]
  42. Ellman, G.L. Tissue sulfhydryl groups. Arch. Biochem. Biophys. 1959, 82, 70–77. [Google Scholar] [CrossRef]
  43. Stickel, F.; Seitz, H.K.; Hahn, E.G.; Schuppan, D. Liver toxicity of drugs of plant origin. Z. Gastroenterol. 2001, 39, 225–232, 234–237. [Google Scholar] [CrossRef] [PubMed]
  44. Putnam, C.D.; Arvai, A.S.; Bourne, Y.; Tainer, J.A. Active and inhibited human catalase structures: Ligand and NADPH binding and catalytic mechanism. J. Mol. Biol. 2000, 296, 295–309. [Google Scholar] [CrossRef] [PubMed]
  45. Kirkman, H.N.; Rolfo, M.; Ferraris, A.M.; Gaetani, G.F. Mechanisms of protection of catalase by NADPH. Kinetics and stoichiometry. J. Biol. Chem. 1999, 274, 13908–13914. [Google Scholar] [CrossRef] [PubMed]
  46. Switala, J.; Loewen, P.C. Diversity of properties among catalases. Arch. Biochem. Biophys. 2002, 401, 145–154. [Google Scholar] [CrossRef]
  47. Berg, J.M.; Tymoczko, J.L.; Stryer, L. Biochemistry, 6th ed.; W.H. freeman: New York, NY, USA, 2007. [Google Scholar]
  48. Alfonso-Prieto, M.; Vidossich, P.; Rovira, C. The reaction mechanisms of heme catalases: An atomistic view by ab initio molecular dynamics. Arch. Biochem. Biophys. 2012, 525, 121–130. [Google Scholar] [CrossRef]
  49. Diaz, A.; Loewen, P.C.; Fita, I.; Carpena, X. Thirty years of heme catalases structural biology. Arch. Biochem. Biophys. 2012, 525, 102–110. [Google Scholar] [CrossRef]
  50. Nicholls, P. Classical catalase: Ancient and modern. Arch. Biochem. Biophys. 2012, 525, 95–101. [Google Scholar] [CrossRef]
  51. Zamocky, M.; Koller, F. Understanding the structure and function of catalases: Clues from molecular evolution and in vitro mutagenesis. Prog. Biophys. Mol. Biol. 1999, 72, 19–66. [Google Scholar] [CrossRef]
  52. Alfonso-Prieto, M.; Vidossich, P.; Rodríguez-Fortea, A.; Carpena, X.; Fita, I.; Loewen, P.C.; Rovira, C. Electronic state of the molecular oxygen released by catalase. J. Phys. Chem. A 2008, 112, 12842–12848. [Google Scholar] [CrossRef]
  53. Rovira, C. Structure, protonation state and dynamics of catalase compound II. ChemPhysChem. 2005, 6, 1820–1826. [Google Scholar] [CrossRef] [PubMed]
  54. Vidossich, P.; Alfonso-Prieto, M.; Carpena, X.; Loewen, P.C.; Fita, I.; Rovira, C. Versatility of the electronic structure of compound I in catalase-peroxidases. J. Am. Chem. Soc. 2007, 129, 13436–13446. [Google Scholar] [CrossRef]
  55. Krych, J.; Gebicki, J.L.; Gebicka, L. Flavonoid-induced conversion of catalase to its inactive form—Compound II. Free Radic. Res. 2014, 48, 1334–1341. [Google Scholar] [CrossRef] [PubMed]
  56. Lala, V.; Goyal, A.; Bansal, P.; Minter, D.A. StatPearls [Internet]. Treasure Island (FL): StatPearls Publishing. Available online: https://www.ncbi.nlm.nih.gov/books/NBK482489/ (accessed on 30 June 2021).
  57. Giannini, E.G.; Testa, R.; Savarino, V. Liver enzyme alteration: A guide for clinicians. CMAJ 2005, 172, 367–379. [Google Scholar] [CrossRef] [PubMed]
  58. Singh, N.P.; Mc Coy, M.T.; Tice, R.R.; Schneider, E.L. A simple technique for quantitation of low levels of DNA damage in individual cells. Exp. Cell Res. 1998, 175, 184–191. [Google Scholar] [CrossRef]
  59. Cadet, J.; Delatour, T.; Douki, T.; Gasparutto, D.; Pouget, J.-P.; Ravanat, J.-L.; Sauvaigo, S. Hydroxyl radicals and DNA base damage. Mut. Res. 1999, 424, 9–21. [Google Scholar] [CrossRef]
  60. Mladenović, M.; Stanković, N.; Matić, S.; Stanić, S.; Mihailović, M.; Mihailović, V.; Katanić, J.; Boroja, T.; Vuković, N. Newly discovered chroman-2,4-diones neutralize the in vivo DNA damage induced by alkylation through the inhibition of Topoisomerase Iiα: A story behind the molecular modeling approach. Biochem. Pharmacol. 2015, 98, 243–266. [Google Scholar] [CrossRef] [PubMed]
  61. Orcic, D.; Franciskovic, M.; Bekvalac, K.; Svircev, E.; Beara, I.; Lesjak, M.; Mimica-Dukic, N. Quantitative determination of plant phenolics in Urtica dioica extracts by high-performance liquid chromatography coupled with tandem mass spectrometric detection. Food Chem. 2014, 143, 48–53. [Google Scholar] [CrossRef] [PubMed]
  62. Vukić, M.D.; Vuković, N.L.; Djelić, G.T.; Obradović, A.; Kacaniova, M.M.; Marković, S.; Popović, S.; Baskić, D. Phytochemical analysis, antioxidant, antibacterial and cytotoxic activity of different plant organs of Eryngium serbicum L. Ind. Crops Prod. 2018, 115, 88–97. [Google Scholar] [CrossRef]
  63. Quick, A.J.; Stanley-Brown, M.; Bancroft, F.W. A study of the coagulation defect in hemophilia and in jaundice. Am. J. Med. Sci. 1935, 190, 501–511. [Google Scholar] [CrossRef]
  64. Bergmeyer, H.U.; Bowers, G.N.; Horder, M.; Moss, D.W. Provisional recommendations on IFCC Methods for the measurement of catalytic concentrations of enzymes. Part 2. IFCC method for aspartat aminotransferase. Clin. Chim. Acta 1976, 70, 19–42. [Google Scholar] [CrossRef]
  65. Bergmeyer, H.U.; Horder, M. IFCC methods for measurement of catalytic concentrations of enzymes. Part 3. IFCC. Method for alanine aminotransferase (l-alanine 2 -oxoglutarate aminotransferase, ec 2.6.1.2). Clin. Chim. Acta 1980, 105, F145–F172. [Google Scholar]
  66. Walters, M.I.; Gerarde, H.W. An ultramicromethod for the determination of conjugated and total bilirubin in serum or plasma. Microchem. J. 1970, 15, 231–243. [Google Scholar] [CrossRef]
  67. Schumann, G.; Bonora, R.; Ceriotti, F.; Ferard, G.; Ferrero, C.A.; Franck, P.F.; Gella, F.J.; Hoelzel, W.; Jorgensen, P.J.; Kanno, T.; et al. IFCC Primary reference procedures for the measurement of catalytic activity concentrations of enzymes at 37 °C. Part 6. Reference procedure for the measurement of catalytic concentration of γ-glutamyltransferase. Clin. Chem. Lab. Med. 2005, 40, 734–738. [Google Scholar] [CrossRef]
  68. Lowry, O.H.; Rosebrough, N.J.; Farr, A.L.; Randall, R.J. Protein measurement with the Folin phenol reagent. J. Biol. Chem. 1951, 193, 265–275. [Google Scholar] [CrossRef]
  69. Hartmann, A.; Speit, G. The contribution of cytotoxicity to DNA effects in the single cell gel test (Comet assay). Toxicol. Lett. 1997, 90, 183–188. [Google Scholar] [CrossRef]
  70. Collins, A.R.; Oscoz, A.A.; Brunborg, G.; Gaivao, I.; Giovannelli, L.; Kruszewski, M.; Smith, C.C.; Stetina, R. The comet assay: Topical issues. Mutagenesis 2008, 23, 143–151. [Google Scholar] [CrossRef] [PubMed]
  71. Manoharan, K.; Banerjee, M.R. β-Carotene reduces sister chromatid exchange induce chemical carcinogens in mouse mammary cells in organ culture. Cell Biol. Int. Rep. 1985, 9, 783–789. [Google Scholar] [CrossRef]
  72. Waters, M.D.; Brady, A.L.; Stack, H.F.; Brockman, H.E. Antimutagenicity profiles for some models compounds. Mutat. Res. 1990, 238, 57–85. [Google Scholar] [CrossRef]
  73. O’Boyle, N.M.; Banck, M.; James, C.A.; Morley, C.; Vandermeersch, T.; Hutchison, G.R. Open Babel: An open chemical toolbox. J. Cheminform. 2011, 3, 33. [Google Scholar] [CrossRef]
  74. Marvin Beans; 15.4.27.0; ChemAxon: Budapest, Hungary, 2015.
  75. Jumper, J.; Evans, R.; Pritzel, A.; Green, T.; Figurnov, M.; Ronneberger, O.; Tunyasuvunakool, K.; Bates, R.; Žídek, A.; Potapenko, A.; et al. Highly accurate protein structure prediction with AlphaFold. Nature 2021, 596, 583–589. [Google Scholar] [CrossRef] [PubMed]
  76. Varadi, M.; Anyango, S.; Deshpande, M.; Nair, S.; Natassia, C.; Yordanova, G.; Yuan, D.; Stroe, O.; Wood, G.; Laydon, A.; et al. AlphaFold Protein Structure Database: Massively expanding the structural coverage of protein-sequence space with high-accuracy models. Nucleic Acids Res. 2022, 50, D439–D444. [Google Scholar] [CrossRef] [PubMed]
  77. Morris, G.M.; Huey, R.; Lindstrom, W.; Sanner, M.F.; Belew, R.K.; Goodsell, D.S.; Olson, A.J. AutoDock4 and AutoDockTools4: Automated Docking with Selective Receptor Flexibility. J. Comput. Chem. 2009, 30, 2785–2791. [Google Scholar] [CrossRef] [PubMed]
  78. Trott, O.A.; Olson, J. AutoDock Vina: Improving the speed and accuracy of docking with a new scoring function, efficient optimization and multithreading. J. Comput. Chem. 2010, 31, 455–461. [Google Scholar] [CrossRef]
  79. Pettersen, E.F.; Goddard, T.D.; Huang, C.C.; Couch, G.S.; Greenblatt, D.M.; Meng, E.C.; Ferrin, T.E. UCSF Chimera--a visualization system for exploratory research and analysis. J. Comput. Chem. 2004, 25, 1605–1612. [Google Scholar] [CrossRef]
  80. Case, D.A.; Darden, T.A.; Cheatham III, T.E.; Simmerling, C.L.; Wang, J.; Duke, R.E.; Luo, R.; Walker, R.C.; Zhang, W.; Merz, K.M.; et al. AMBER 12; University of California: San Francisco, CA, USA, 2012. [Google Scholar]
Figure 1. Chromatograms obtained by LC-ESI-MS/MS analysis of methanol extracts of flowers (A), leaves (B), and stems (C) of N. cataria. Found peak labels: 1: quinic acid, 2: protocatechuic acid, 3: chlorogenic acid, 4: p-hydroxybenzoic acid, 5: caffeic acid, 6: syringic acid, 7: p-coumaric acid, 8: ferulic acid, 9: luteolin-7-O-glucoside, 10: quercetin-3-O-glucoside, 11: quercetin-3-O-rutinoside, 12: rosmarinic acid, 13: quercitrin, 14: kaempferol-3-O-glucoside, 15: quercetin, 16: luteolin, 17: kaempferol, 18: isorhamnetin.
Plants 11 02114 g001
Scheme 1. The implications of CCl4 administration to cell membrane and genome.
Plants 11 02114 sch001
Scheme 2. The mechanisms of rCAT interconversion into the rCATCmpd I and rCATCmpd II; the first rH2O2 entering the cascade is colored in blue, and the second one is depicted in red. The flavonoids (FlaOHs, labeled in dark green) induce a higher amount of rH2O2 in liver cells; the new concentrations of rH2O2 are depicted in pink.
Plants 11 02114 sch002
Figure 2. The bioactive conformations of quercitrin (A), chlorogenic acid (B), quinic acid (C), and rosmarinic acid (D) within the rCATCmpd I. Amino acid residues are depicted in white, and hem containing the oxoferryl porphyrin π-cation radical is colored green. For the clarity of presentation, only polar hydrogen atoms are presented within the naturally occurring compounds.
Plants 11 02114 g002
Figure 3. The bioactive conformations of quercitrin (A), chlorogenic acid (B), quinic acid (C), and rosmarinic acid (D) within the rDNA binding and cleavage domain of rTopIIα. All of the obtained bioactive conformations were superimposed to MDA illustrated in yellow. The sense strand is depicted in green, and the antisense strand is colored purple. The nucleotides of interest are depicted in white, whereas the remaining ones are displayed by blue nucleotides objects. For the clarity of presentation, the C-terminal domain of rTopIIα, nesting the targeted compounds, is illustrated by a pink sphere, whereas the non-targeted C-terminal domain is denoted by pink ribbons.
Plants 11 02114 g003
Table 1. The content (μg/g) of eighteen bioactive compounds in the FME, LME, and SME of N. cataria.
Concentration (μg/g) 1
NoCompoundstR 2FME 3LME 4SME 5
1quinic acid 0.49536.11 ± 6.12 6196.33 ± 2.11113.16 ± 2.03
2protocatechuic acid 0.79100.51 ± 0.35261.42 ± 0.3871.64 ± 0.34
3chlorogenic acid 0.801647.32 ± 8.12648.52 ± 6.151408.43 ± 8.01
4p-hydroxybenzoic acid 1.08138.21 ± 2.15363.32 ± 5.3242.24 ± 2.99
5caffeic acid 1.1880.13 ± 2.13137.03 ± 2.6942.01 ± 2.01
6syringic acid1.3115.93 ± 0.8736.34 ± 1.2930.32 ± 1.19
7p-coumaric acid1.6972.84 ± 2.45138.22 ± 2.8738.64 ± 1.99
8ferulic acid1.90129.23 ± 1.54155.64 ± 1.5655.84 ± 1.12
9luteolin-7-O-glucoside2.137.64 ± 0.365.43 ± 0.345.96 ± 0.34
10quercetin-3-O-glucoside2.2572.97 ± 4.23354.33 ± 6.5987.97 ± 4.55
11quercetin-3-O-rutinoside2.3386.55 ± 1.9998.71 ± 2.11114.01 ± 2.16
12rosmarinic acid2.42326.15 ± 1.191056.14 ± 2.69250.54 ± 1.18
13quercitrin2.758406.31 ± 12.5926.21 ± 0.451.02 ± 0.03
14kaempferol-3-O-glucoside2.80409.21 ± 15.33374.13 ± 15.11168.54 ± 9.23
15quercetin3.7488.97 ± 3.2578.33 ± 3.1994.54 ± 3.26
16luteolin4.036.12 ± 0.454.13 ± 0.363.96 ± 0.39
17kaempferol4.5590.03 ± 1.5982.87 ± 1.5467.25 ± 1.49
18isorhamnetin4.59107.53 ± 1.11175.34 ± 1.14117.24 ± 1.12
1 Concentration of a particular compound in μg within 1 g of extract. 2 Retention time in mins. 3 Flower methanol extract. 4 Leaf methanol extract. 5 Stem methanol extract. 6 Values are presented as the means ± SD obtained from three measurements.
Publisher’s Note: MDPI stays neutral with regard to jurisdictional claims in published maps and institutional affiliations.

