Article

Investigation of Morinda citrifolia Activities through Pinoresinol and α-EG Related Gene Expression

by
Runglawan Sudmoon
1,
Sanit Kaewdaungdee
2,
Unchaleeporn Ameamsri
2,
Tawatchai Tanee
3,
Pornnarong Siripiyasing
4,
Warin Wonok
2 and
Arunrat Chaveerach
2,*
1
Faculty of Law, Khon Kaen University, Khon Kaen 40002, Thailand
2
Department of Biology, Faculty of Science, Khon Kaen University, Khon Kaen 40002, Thailand
3
Faculty of Environment and Resource Studies, Mahasarakham University, Maha Sarakham 44150, Thailand
4
Faculty of Science and Technology, Rajabhat Mahasarakham University, Maha Sarakham 44150, Thailand
*
Author to whom correspondence should be addressed.
Plants 2022, 11(15), 1985; https://doi.org/10.3390/plants11151985
Submission received: 8 July 2022 / Revised: 22 July 2022 / Accepted: 26 July 2022 / Published: 30 July 2022
(This article belongs to the Topic Biological Activity of Plant Extracts)

Abstract

:
α-EG is a unique substance that was first found in the leaves and fruits of Morinda citrifolia (Mc) growing in Thailand using GC-MS at 52.33% and 54.12%. It was then concentrated and its abundance quantified, along with that of pinoresinol, via GC, compared to the standards in leaves, ufp, rfp, rawfs, and seeds. α-EG and pinoresinol, which have collagen stimulating, skin whitening, and an inhibitory effect on wrinkle formation, were found in different concentrations and amounts. Three different concentrations of the five Mc part extracts were tested on NHDF for gene expression related to the aforementioned activities, COL1A1, COL1A2, and COL3A1, FGF1 and FGF7 by qRT-PCR. The results showed various expression levels, both stimulatory and inhibitory, with different concentrations of plant parts and genes. Similar results were revealed when the experiments were performed with Morus alba (Ma), which was found to contain 20.48 g protein p/100 g leaves at concentrations of 3.11 mg/mL. The studied Mc parts seem to have advantages based on the stated objectives, gene type and level of activity of each plant part. Rawfs and leaves supplemented with Ma samples were selected for toxicity tests with PBMCs. The lack of both cell and DNA toxicity from the rawfs indicated that they can be used safely.

1. Introduction

Plants benefit humanity in many ways. For example, Morinda citrifolia (Mc) is a useful pantropical species supporting human life as an edible fruit; it is also used to create drinks, supplements, etc., and has medicinal value. There are many publications on it in the literature. Various aspects of the species have been studied, including its chemical and medicinal properties, and new reports and reviews are being published all the time. Some important Mc studies have indicated the the plant’s fruit has anti-inflammatory, anti-cancer, and antioxidant properties. Additionally, a 50% ethanolic noni seed extract showed more potent in vitro inhibition of elastase and tyrosinase, 1,1-diphenyl-2-picrylhydrazyl (DPPH) radical scavenging activity than leaf extract [1]. Xeronine, a small alkaloid which is one of the bioactive compounds of noni fruit, is believed to be capable of modifying the molecular structure of specific inactive proteins, thereby regulating the folding of active enzymes [2]. It has also been reported that the plant has anti-inflammatory effects which may be useful in the treatment of inflammatory bowel disease [3]. Furthermore, the consumption of noni fruit juice does not cause any significant disturbances to the liver or kidney outside of immune modulation [4]. The main alkaloids present in noni are xeronine, scopolenin, dammacanthol; it also contains vitamins A and C, Mg, K, Fe, alizarin, and ursolic acids, and therefore, may be able to slow the growth of cancer. Additionally, it may be a viable therapeutic resource for the treatment of obesity and obesity-related metabolic problems or indigestion [5]. Drinking 40 mL per day of noni wine was shown to effectively prevent high-fat diet-induced oxidative stress and obesity in mice [6]. Noni fruit water extract and noni fruit polysaccharide were shown to alleviate oxidative stress and inflammation in mice on a high-fat diet, and the noni fruit polysaccharide at 100 mg per kg bodyweight had a better effect than noni fruit water extract with a similar polysaccharide dosage, illustrating that noni fruit polysaccharide may be an important component in the water extract [7]. M. citrifolia fruit juice contains large groups of secondary metabolites including polyphenols, reducing compounds, mucilage and terpenoids. The antimicrobial activity of these compounds was found to inhibit the growth of Staphylococcus aureus, Pseudomonas aeruginosa, Proteus mirabilis, S. epidermidis, Proteus vulgaris, Streptococcus oralis, Enterococcus faecalis and Escherichia coli [8]. Additionally, four publications reported important data about the species. Noni seeds contain 3,3’-bisdemethylpinoresinol and americanin A, which have been found to inhibit tyrosinase activity. Inhibited α-melanocyte activity stimulates melanogenesis, resulting in a skin whitening effect, wrinkle inhibition and enhanced blood fluidity, platelet aggregation and fibrinolytic activity [9]. Several phytochemical constituents which contain the most valuable compounds for industrial and pharmacological activities have been described [10]. Additionally, the phenolic acids, lignans, flavonoids, flavones, flavans-3-ol, anthocyanins, phytosterols, alkaloids, vitamins and minerals present in the noni plant have been shown to affect obesity and obesity-associated metabolic dysfunction by various mechanisms [11]. In [12], the traditional uses, phytochemicals, phytotherapic properties, toxicological properties and recent advances in the processing and standardization of products derived from noni fruit were reported. The advantages of this species seem to be attributable to the abundance of chemicals that give rise to its therapeutic properties. One other plant species with high nutritional value, i.e., mulberry, Morus alba (Ma), is a well-known plant food for animals such as silkworm. Its leaves and fruits are also widely consumed by humans and have reported medicinal properties. The authors of [13] studied the safety of consuming the leaves and proposed a pharmacological dosage of a leaf extract, which might be a valuable drug [13]. Currently, mulberry leaves are authorized as a food resource with high protein, carbohydrate, vitamin, microelements and dietary fiber contents. They are also rich in phenolic acids, flavonoids, alkaloids, and γ-aminobutyric acid [14]. As such, their use has been proposed as a food supplement.
Another area of ongoing research is how different environments may produce different substances and properties in M. citrifolia, since the plant grows all over the tropics and has a myriad of uses. As such, researchers need to undertake further study on the substances, activities and genes that determine these characteristics in the leaves, raw and ripe fruit, and seeds to confirm and augment the data that have already been published. In this research, the protein matter in Ma will be studied to clarify whether it supports gene expression.

2. Results

2.1. Macronutritional Components

According to a proximate analysis, 100 g plant leaf powder of Ma leaves comprised 16.91 g ash, 316.46 Kcal energy, 11.10 g moisture, 20.48 g protein, 45.81 g total carbohydrate and 5.70 g total fat.

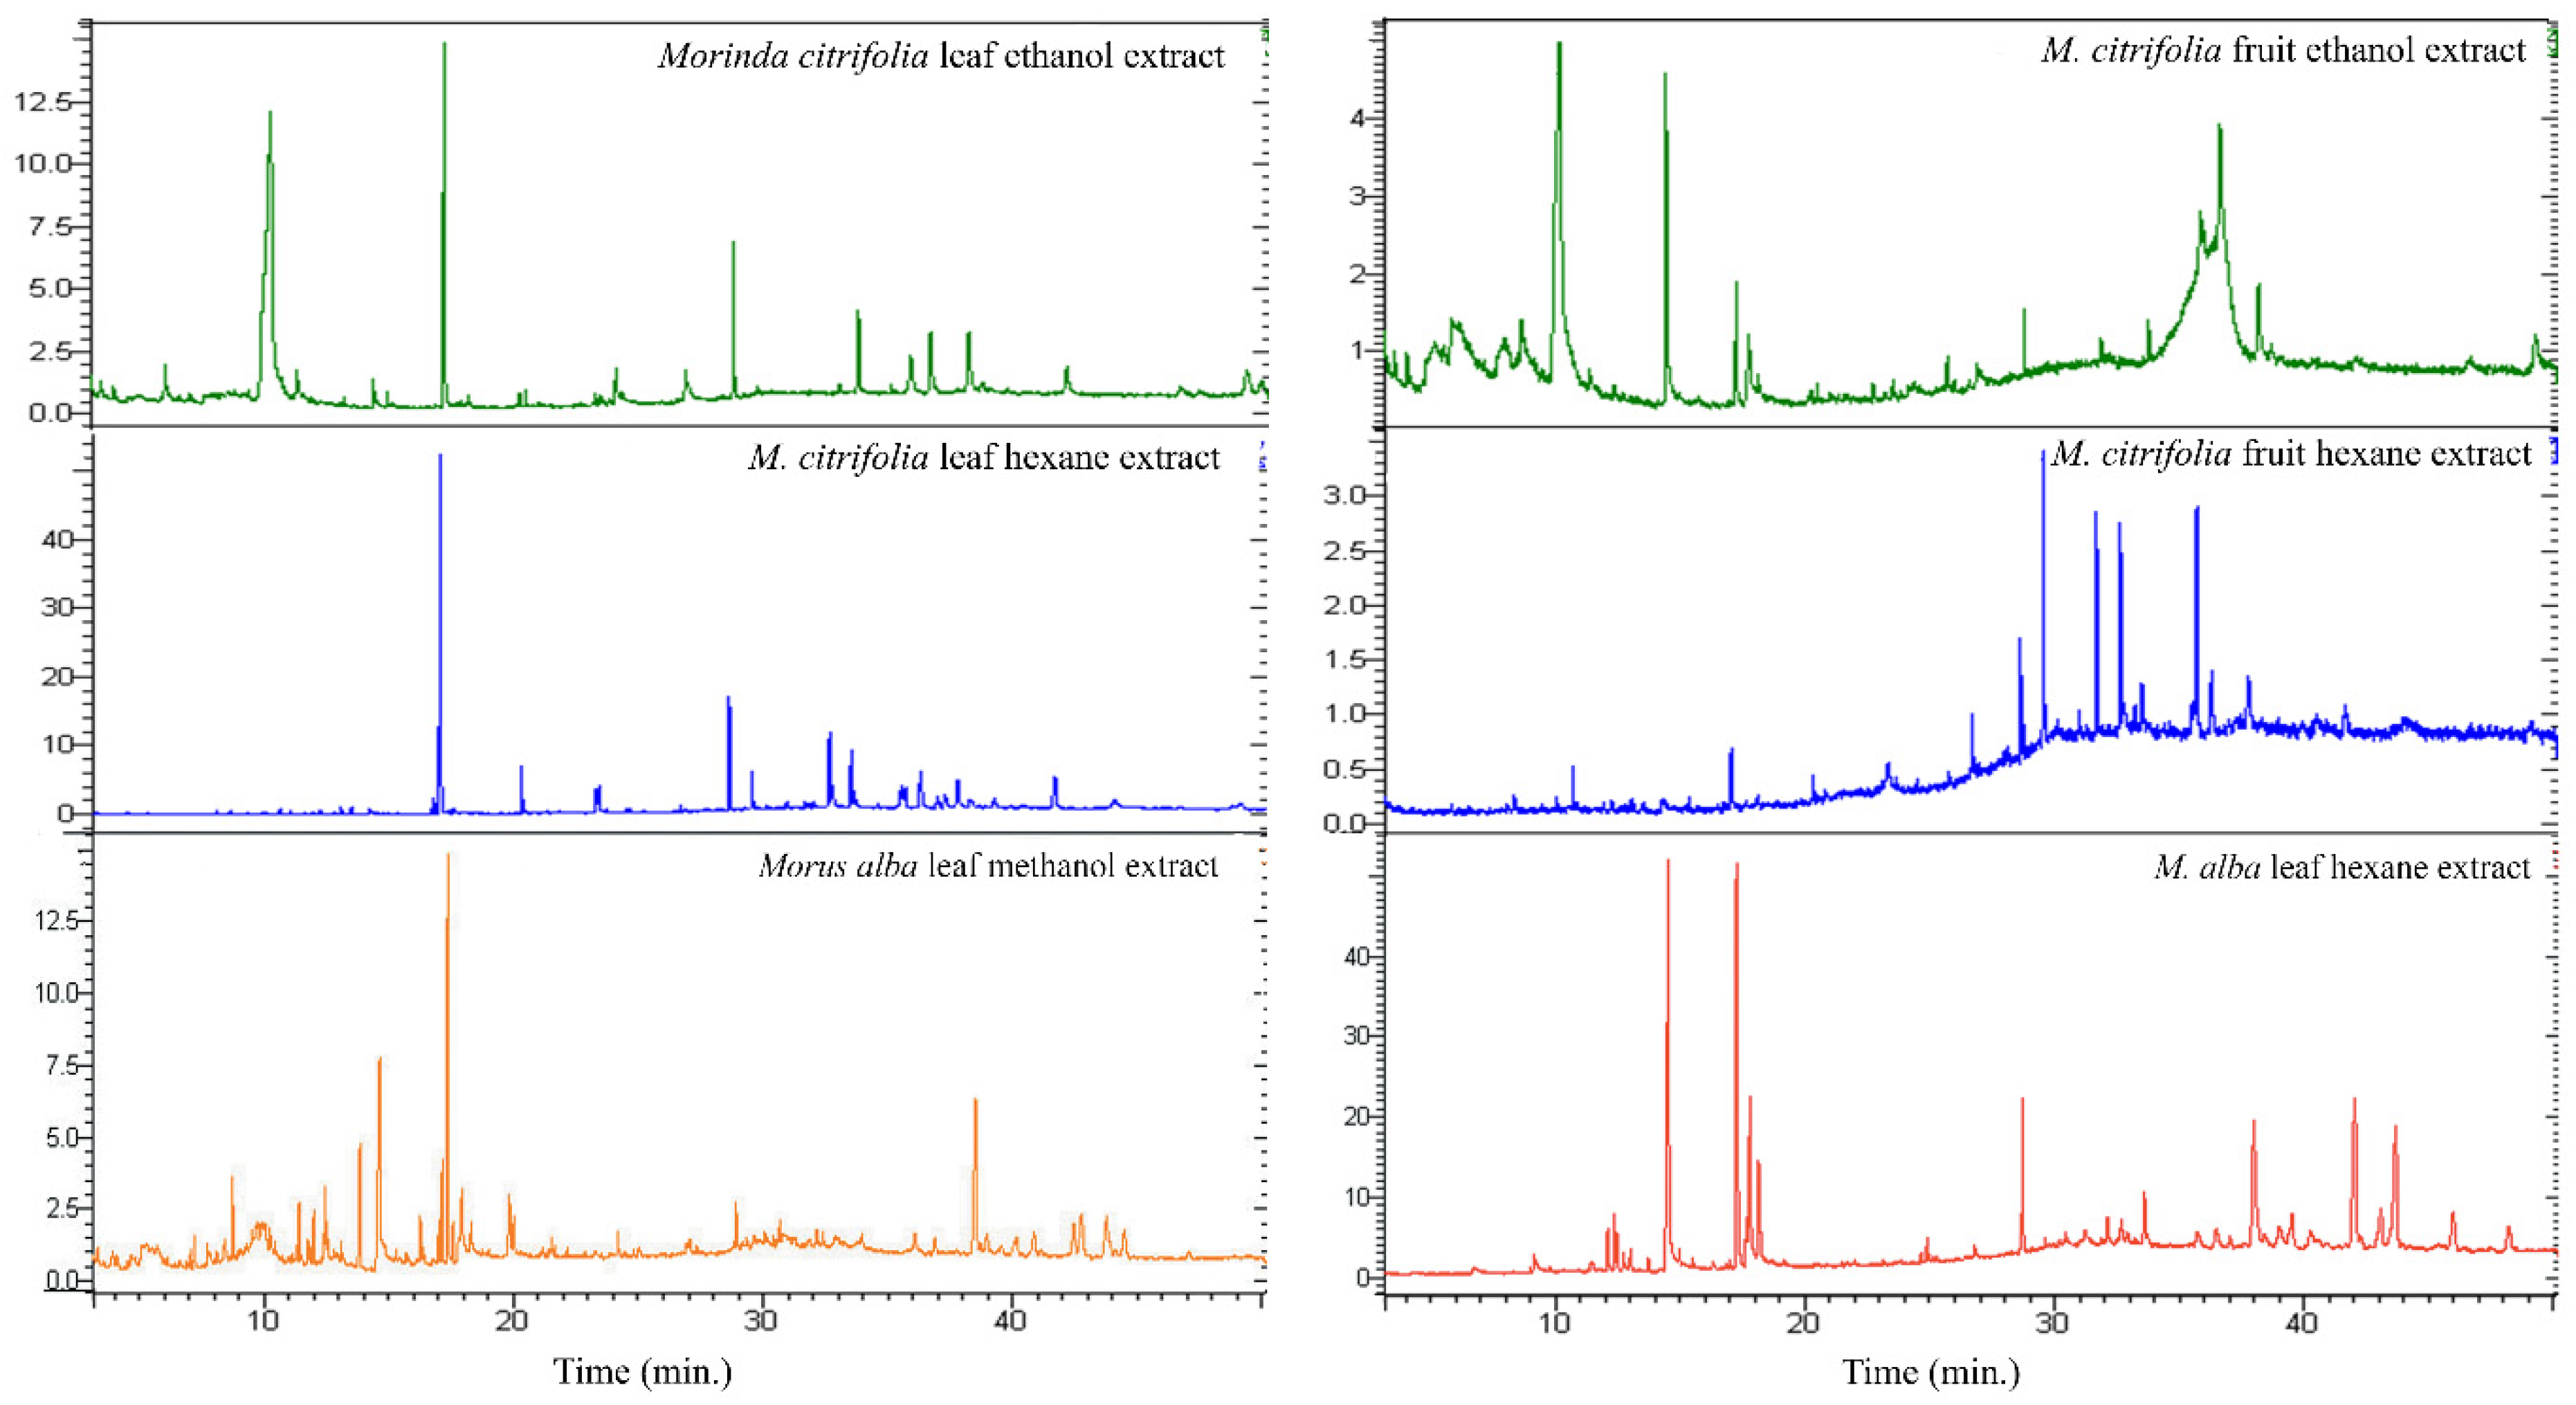
2.2. Phytochemical Constituent Evaluation by Gas Chromatography-Mass Spectrometry

Mature Ma leaves and the leaves and fruits of Mc were analyzed. The various types and quantities of detected phytochemicals are listed in Table 1, and chromatograms showing retention time and peak areas are shown in Figure 1. The major chemical in Mc parts is ethyl-α-d-glucopyranoside or α-EG, which made up 54.12% and 52.33% of the ethanol extracts of leaves and fruits, respectively. This compound was not found in the Ma leaf extract.

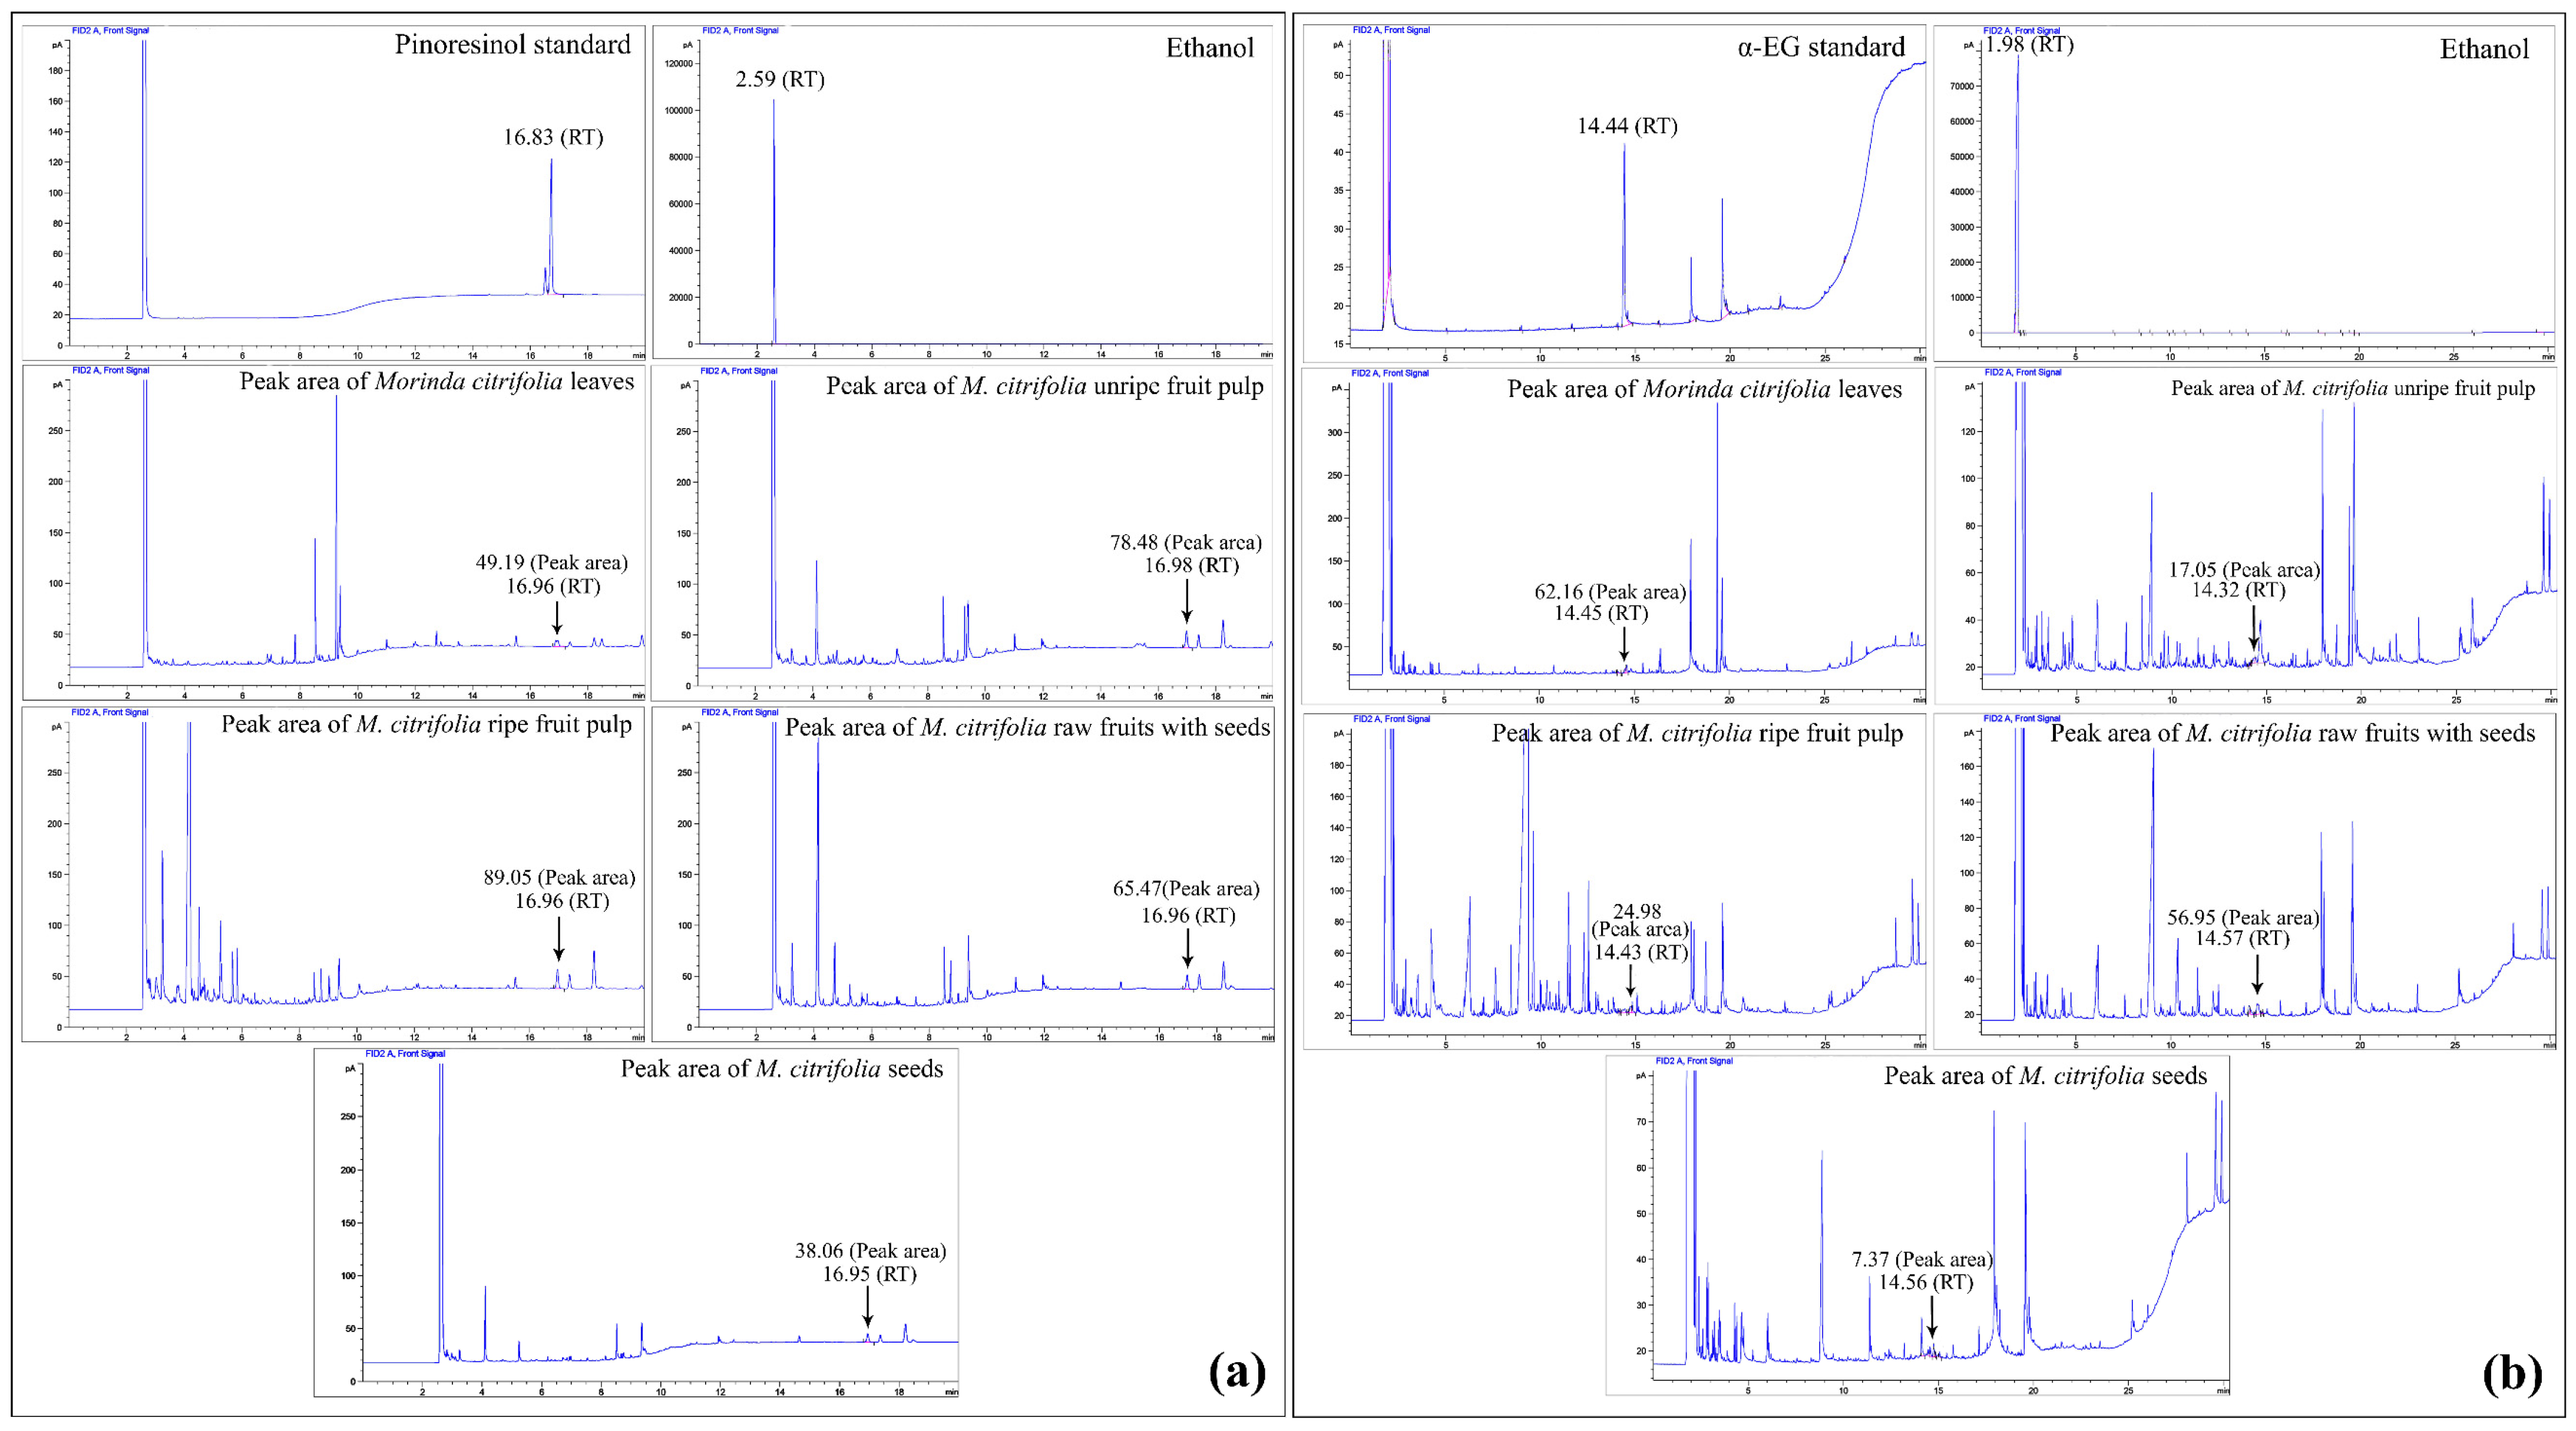
2.3. Gas Chromatography (GC) Compared to the Pinoresinol and α-EG Standards

The abundances of 3,3′-bisdemethylpinoresinol (pinoresinol) and ethyl-α-d-glucoside (α-EG) were measured in five Mc parts, i.e., the leaves, ufp, rfp, rawfs, and seeds. Pinoresinol was found in all studied plant parts, with the highest abundances in both concentrations of rfp being 0.14 mg/mL and 0.38 mg/g (Table 2), based on a peak area in the extract chromatograms (Figure 2). The plotted graph of the peak areas and the pinoresinol standard concentration created a linear equation, i.e., y = 749.07x − 18.13, and a correlation coefficient (R2) of 0.9991. α-EG was also found in all studied plant parts, with the highest concentration in leaves, i.e., 0.30 mg/mL, and in rawfs, i.e., 3.77 mg/g plant sample (Table 2, Figure 2). The plotted graph of the peak areas and the α-EG standard concentration created a linear equation, i.e., y = 239.75x − 10.004, and the correlation coefficient (R2) was 0.9965.

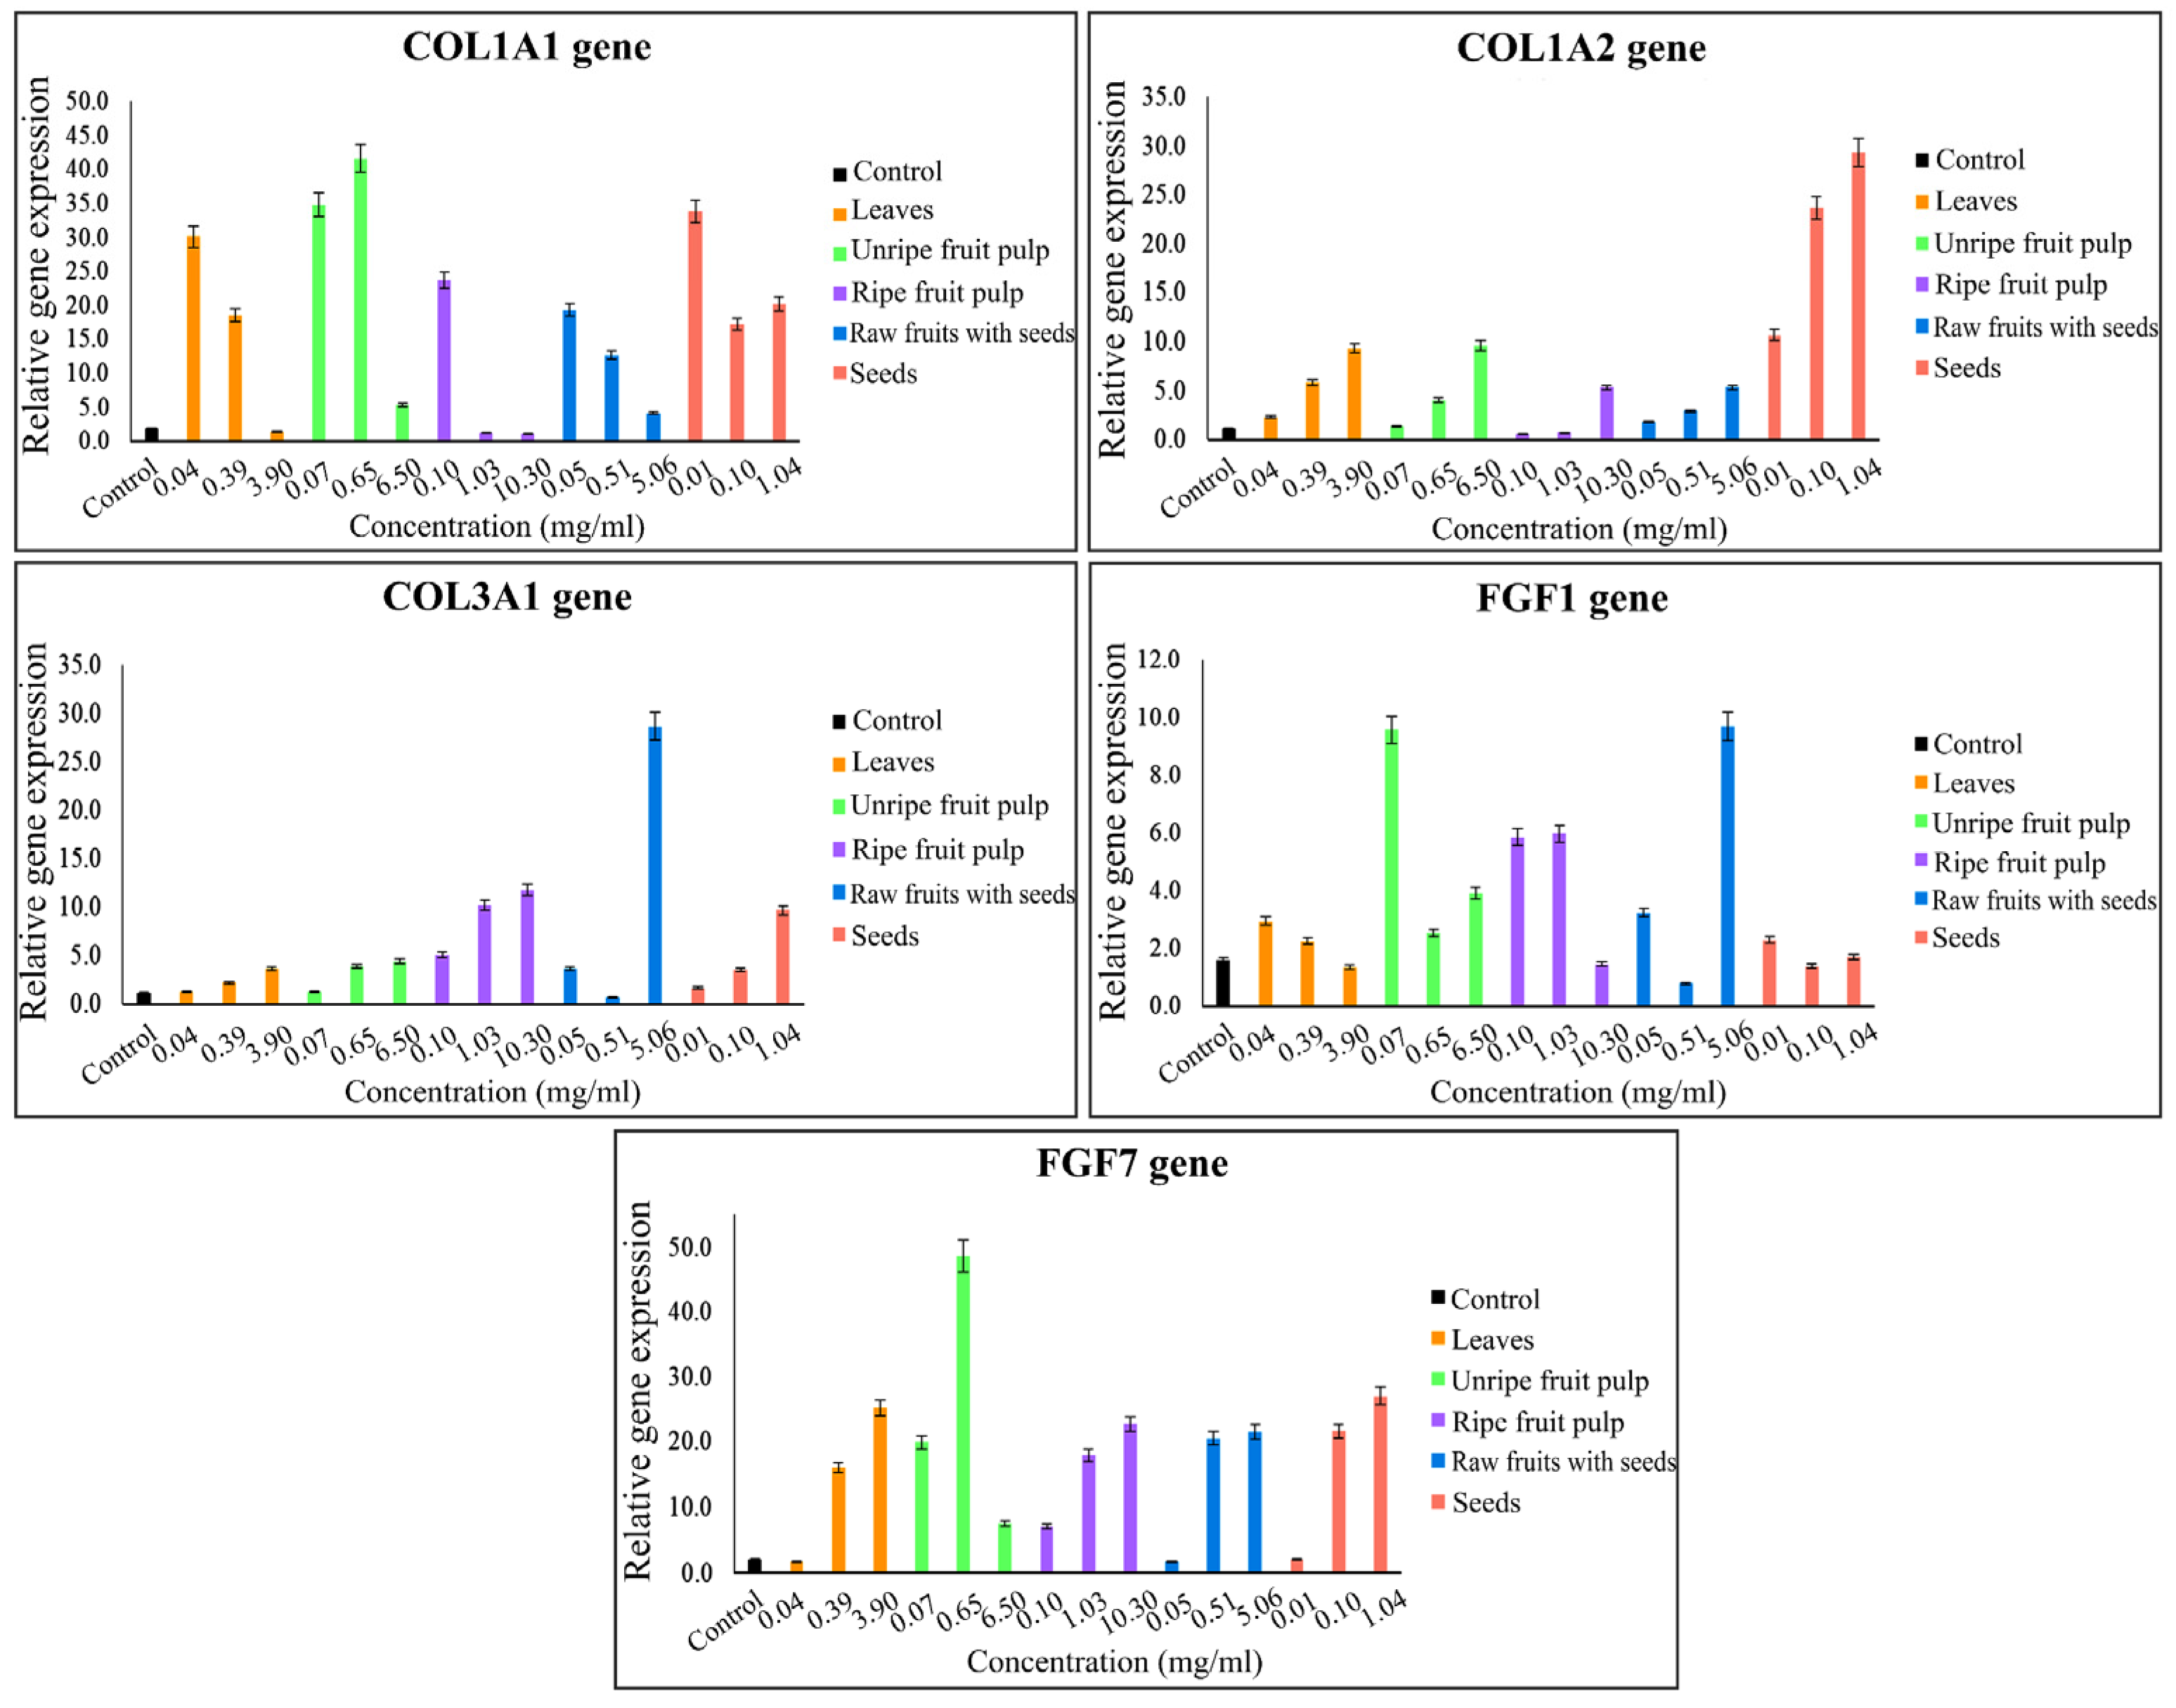
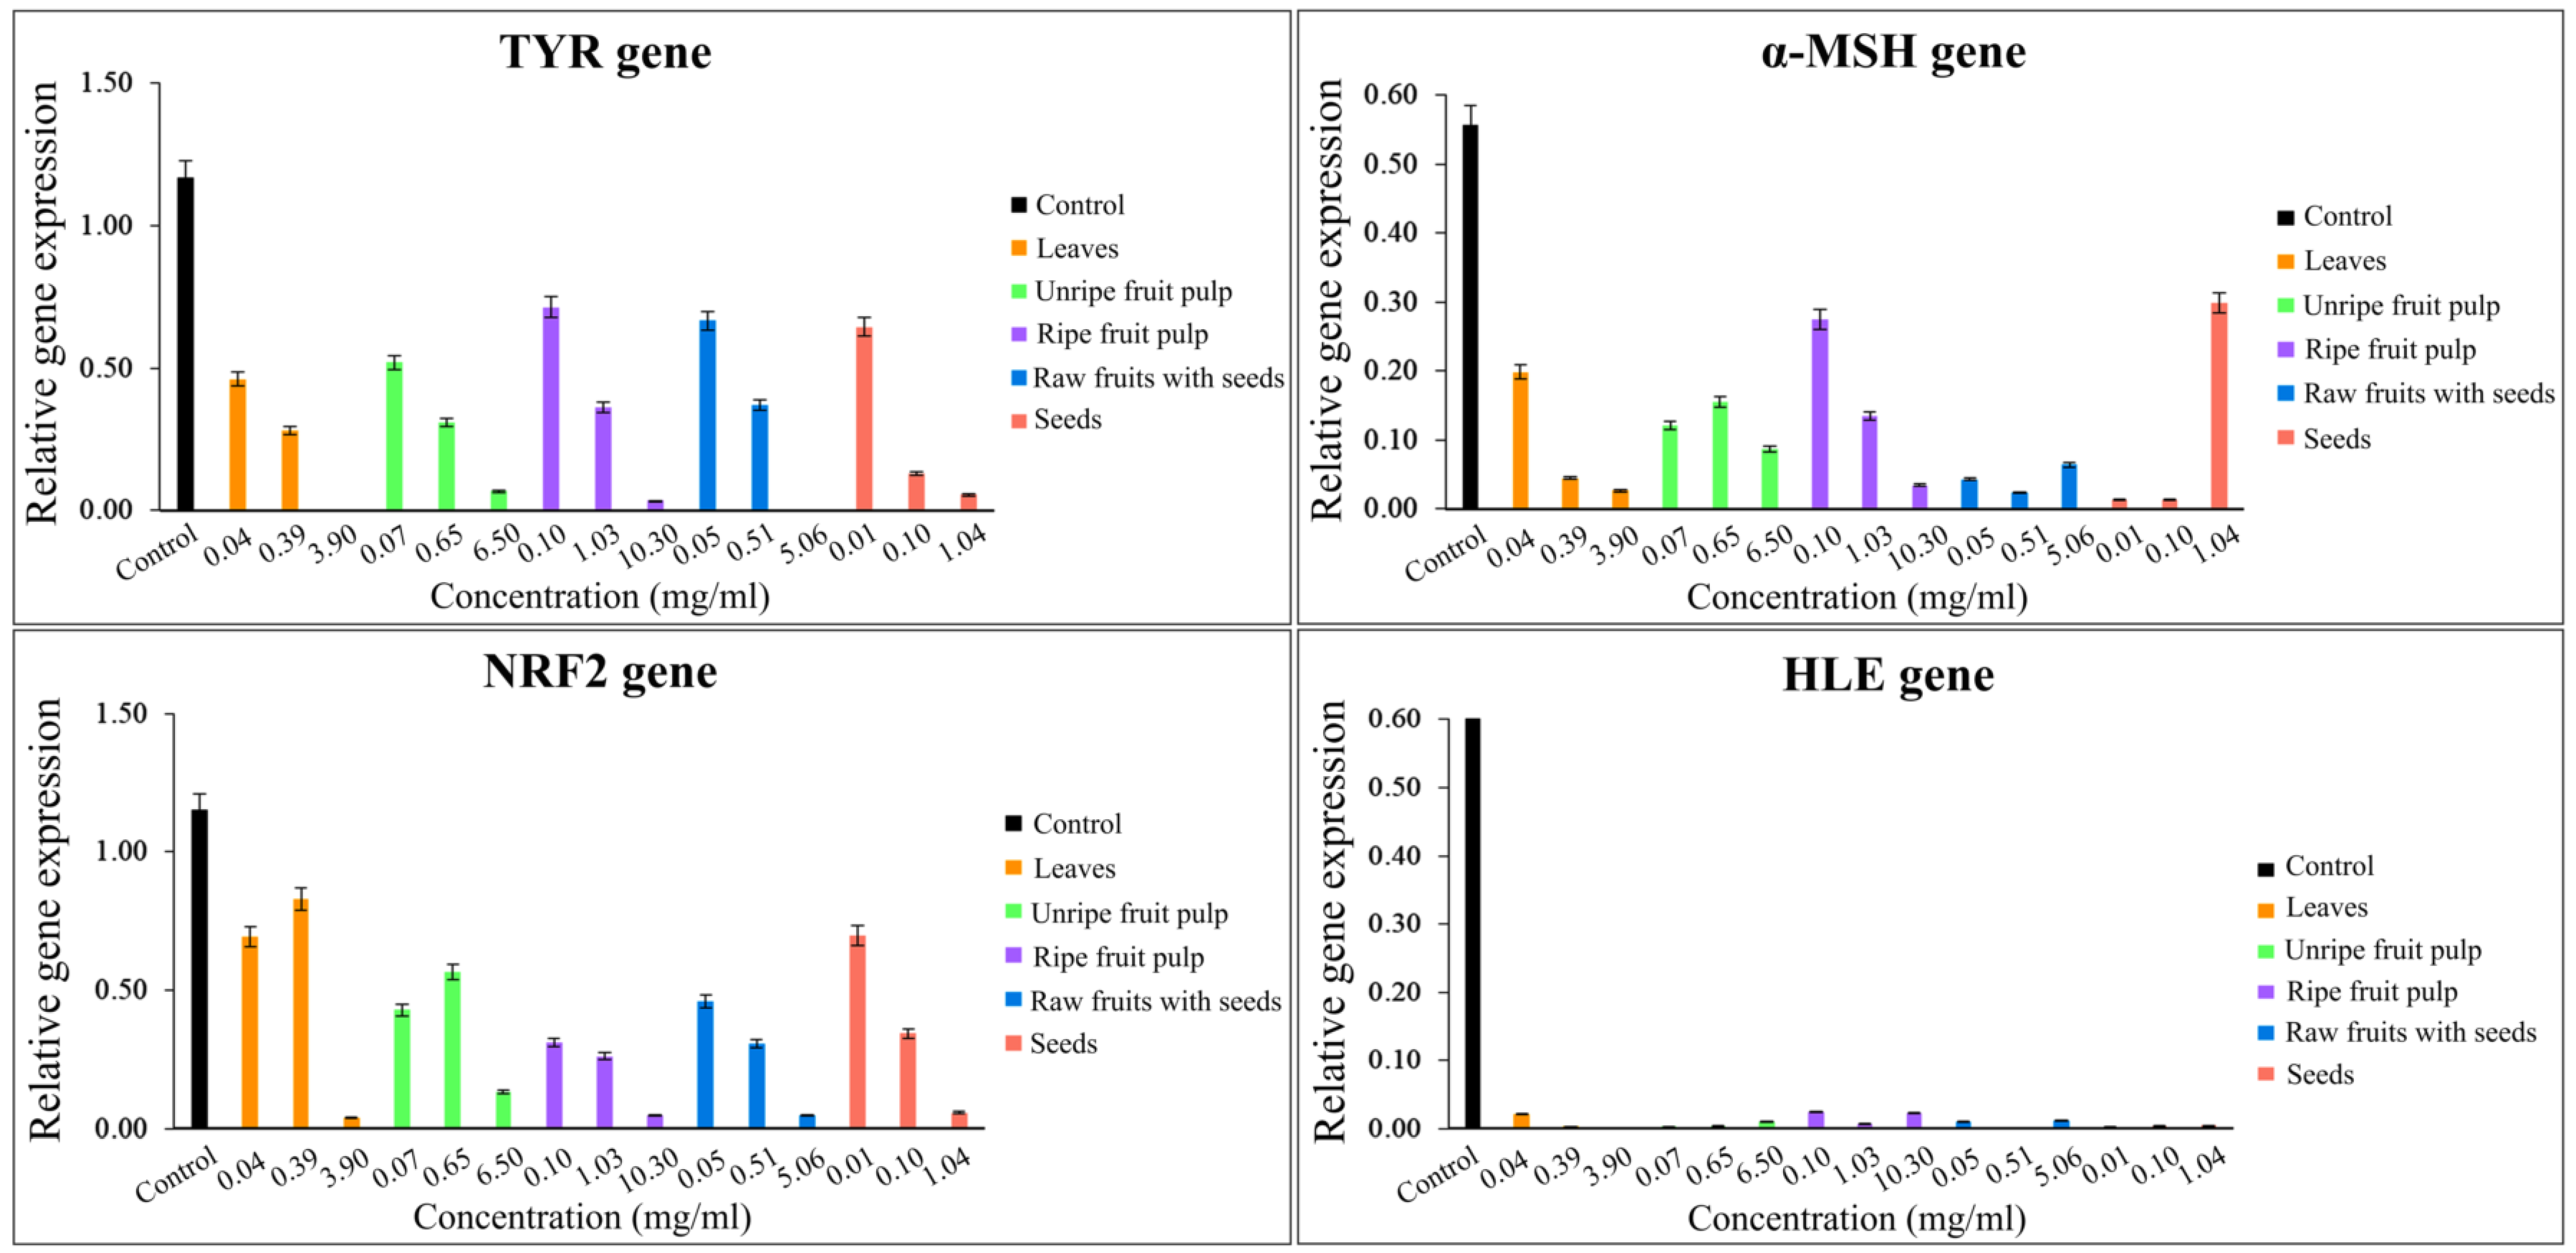
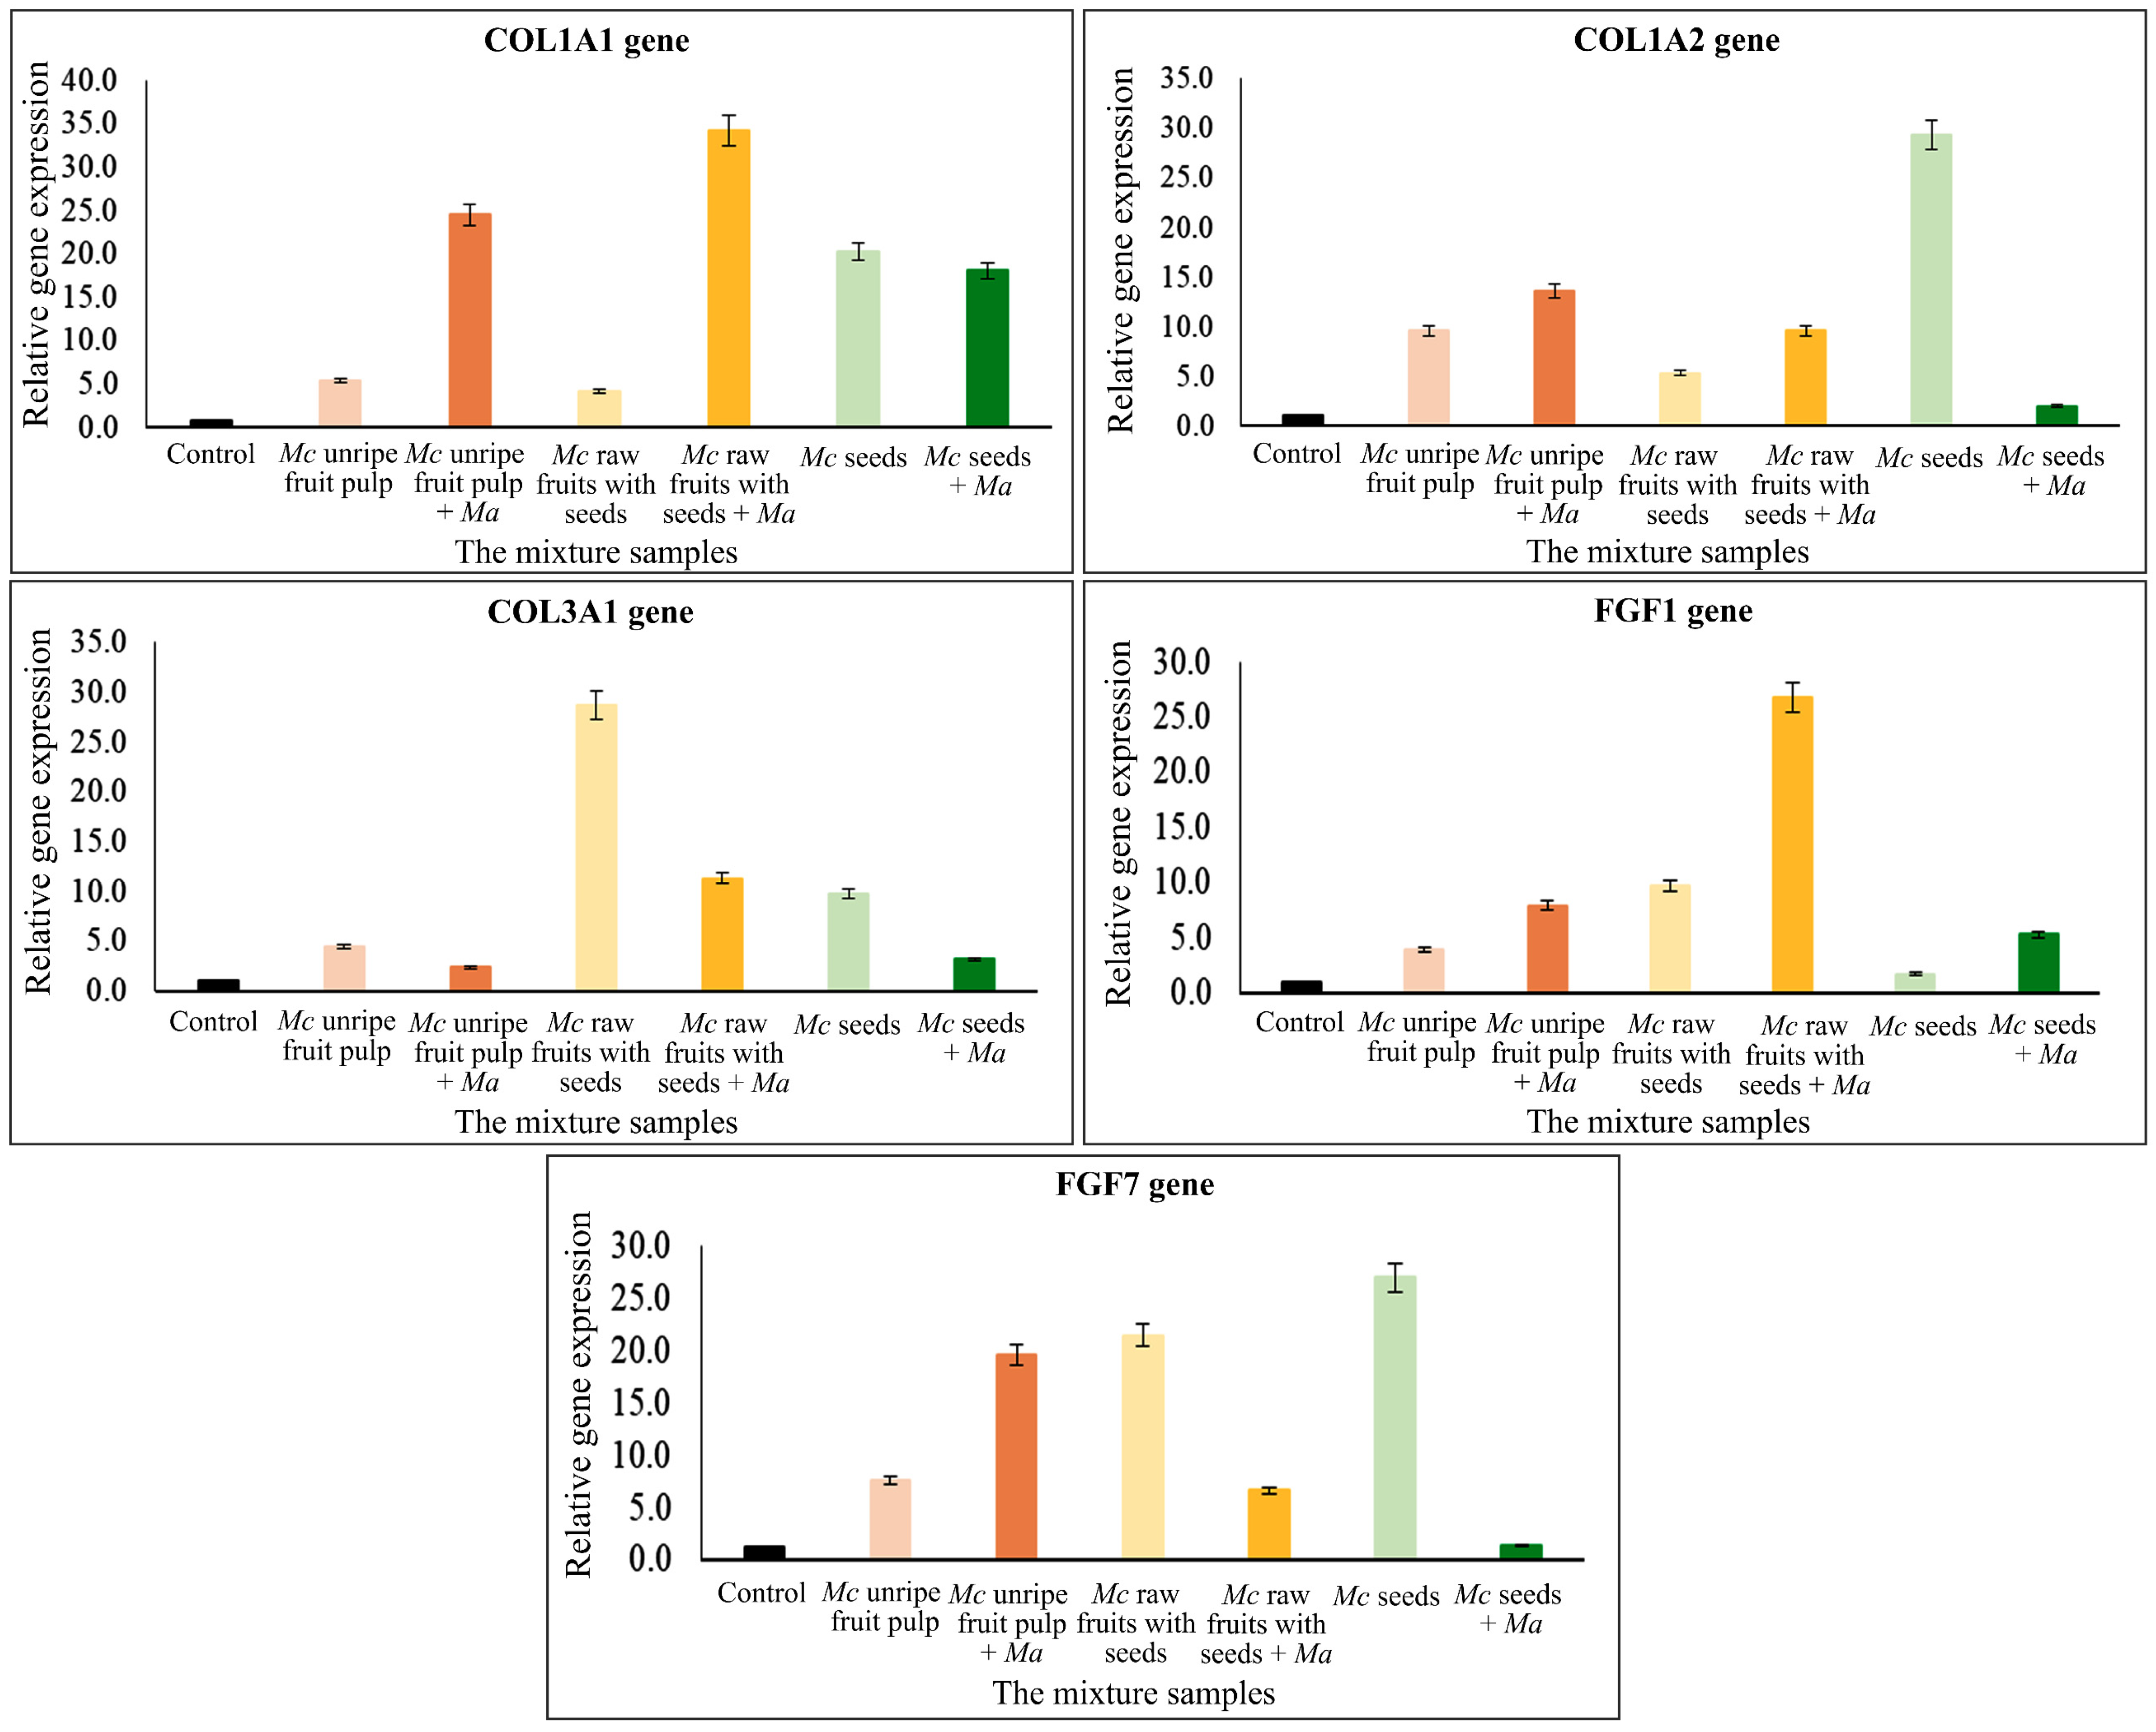
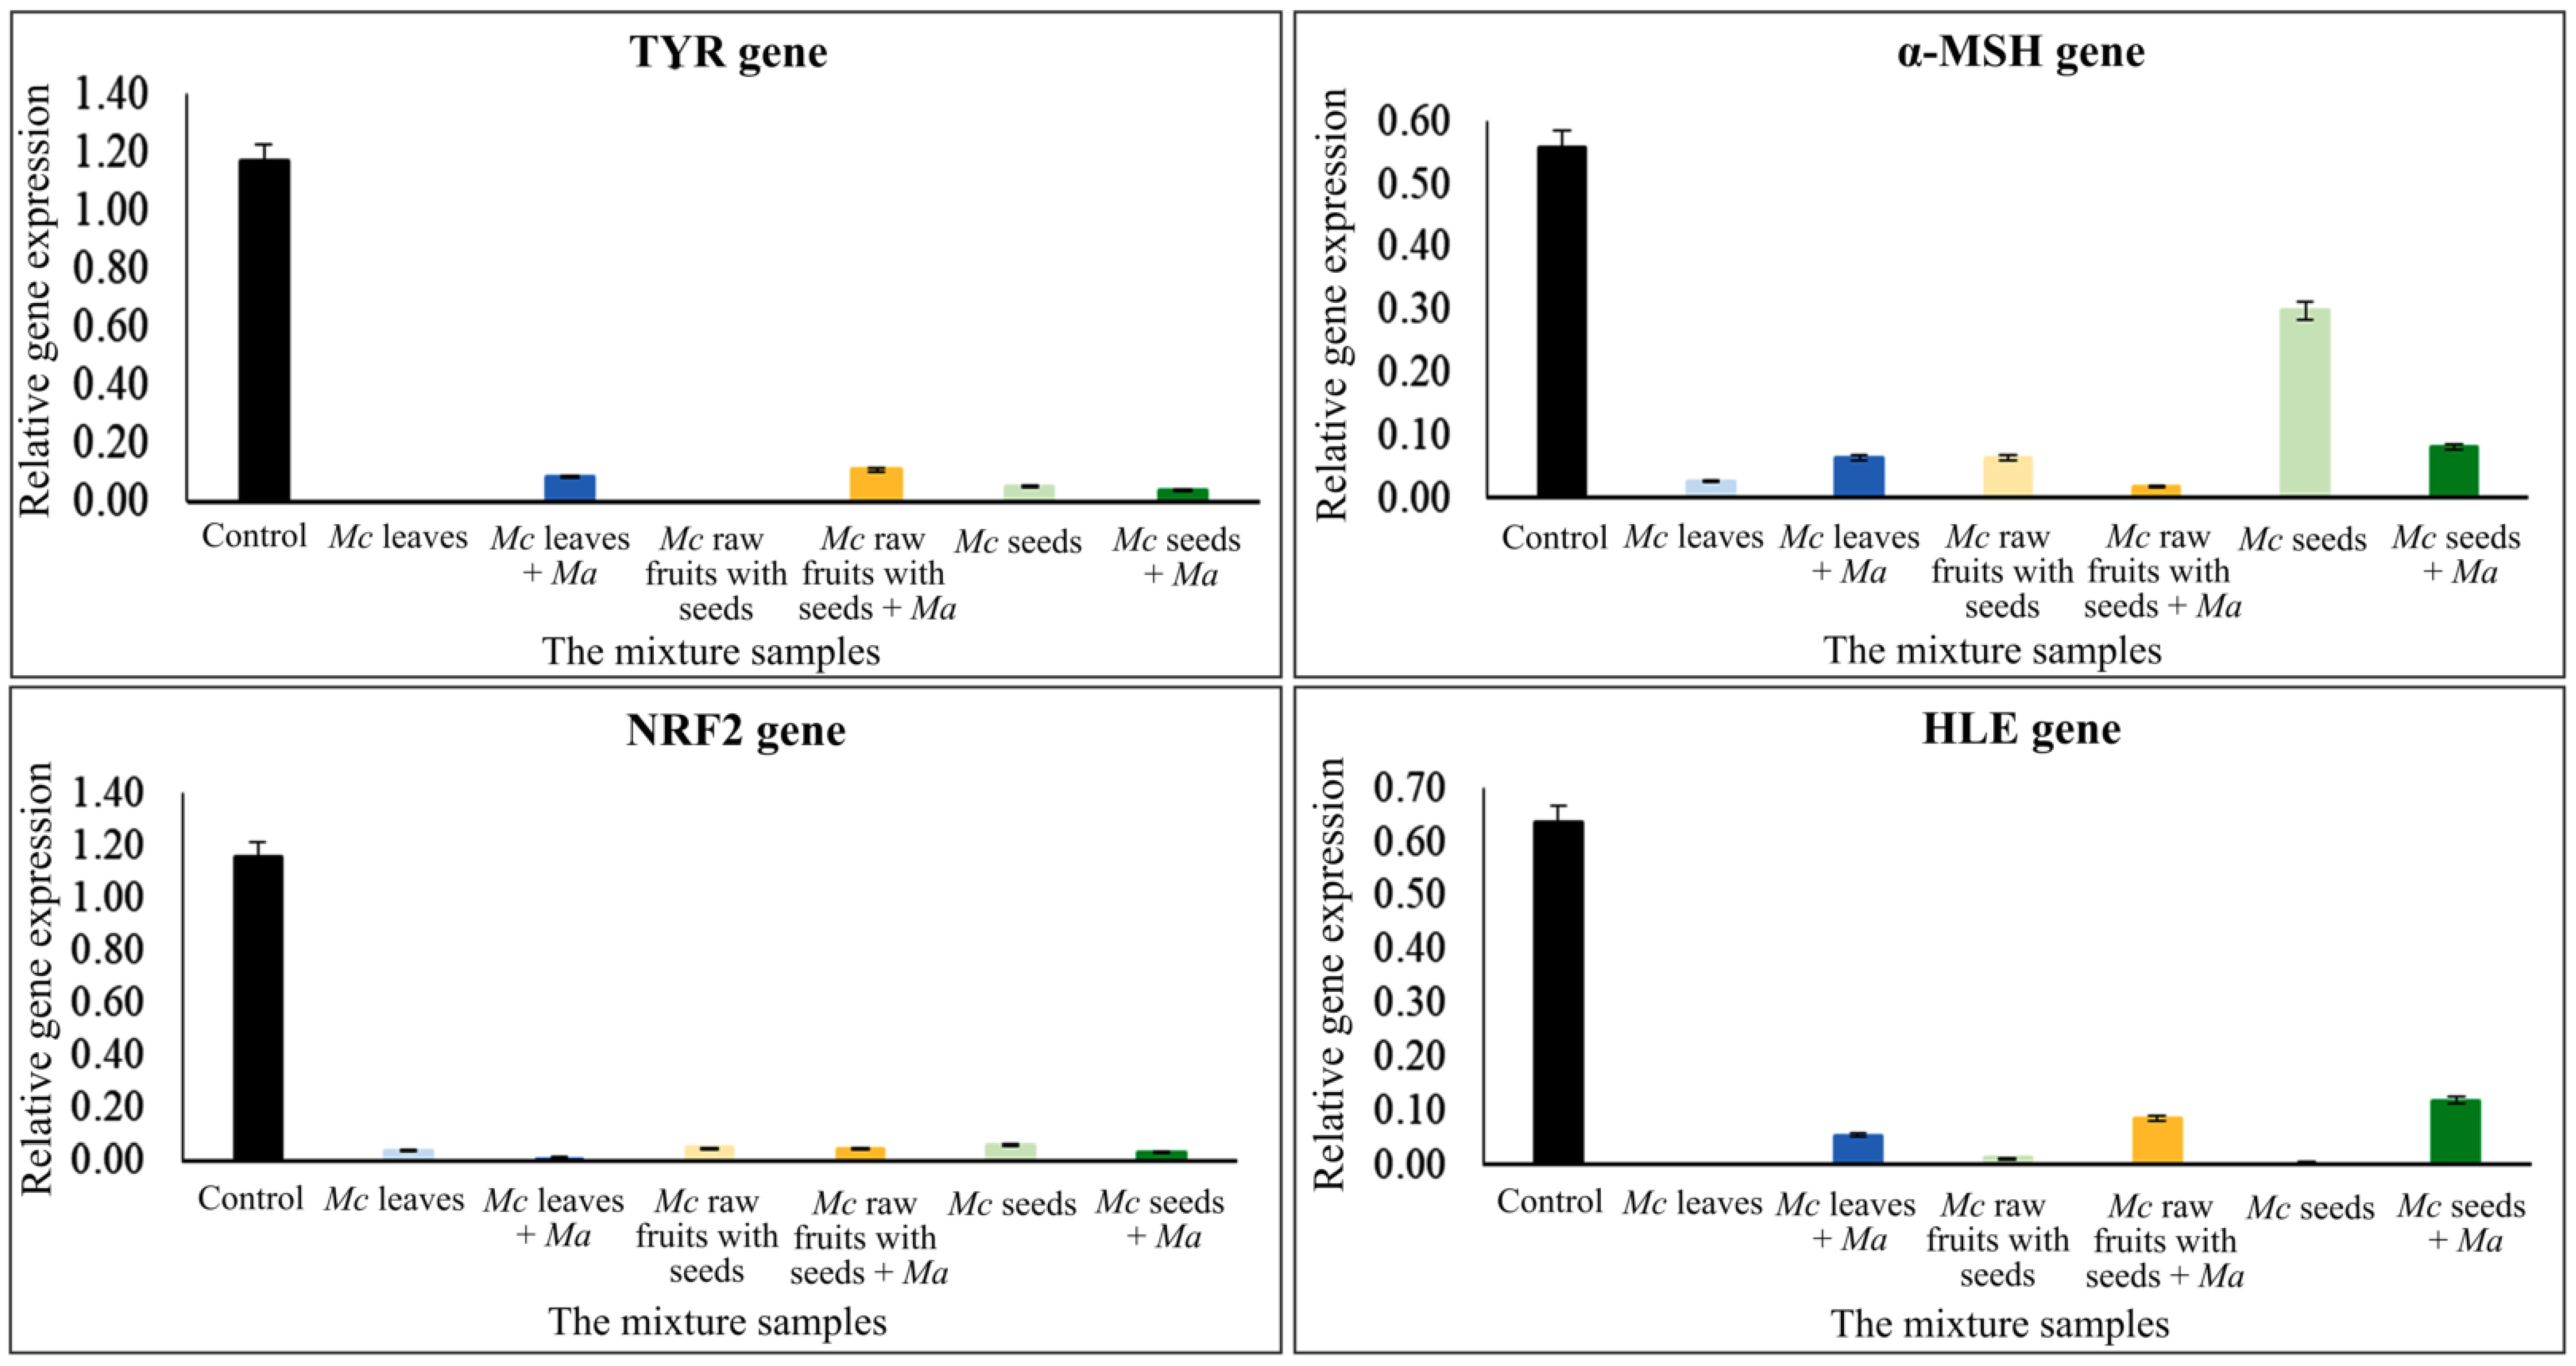
2.4. Gene Expression Quantification

The results of the gene expression research are divided into two parts. The first part presents the results regarding genes which should be expressed in high percentages in plants and which are effective at stimulating type I collagen, COL1A1 and COL1A2, type III collagen and COL3A1, as well as angiogenesis-stimulating and fibroblast proliferation genes FGF1 and FGF7, which were quantified by quantitative reverse transcription-polymerase chain reaction (qRT-PCR). Three concentration levels of the samples were tested. The results indicated that all studied plant parts and their extract concentrations affected all studied genes expressed in various high percentages compared to a control (without the plant extracts). Graphs of various relative gene expression and the studied plant parts with various concentrations are shown in Figure 3. The observed increases in expression percentages were as follows: FGF1 and FGF7 genes increased by 970% from 5.06 mg/mL rawfs, followed by 960% from 0.07 mg/mL ufp, 4870% from 0.65 mg/mL ufp and 2700% from 1.04 mg/mL seeds. The expression percentages of collagen stimulation genes were 4160% and 3480% from 0.65 mg/mL and 0.07 mg/mL ufp, respectively, and 3380% from 0.01 mg/mL seeds for COL1A1 collagen type I; 2930%, 2370%, and 1070% from 1.04, 0.10, and 0.01 mg/mL seeds, respectively, and 960% from 6.50 mg/mL ufp for COL1A2 collagen type I; finally, 2870% from 5.06 mg/mL rawfs and 1180% from 10.30 mg/mL rfp for COL3A1 collagen type III.
The second part contains the results regarding genes which should be expressed in low percentages but with high inhibitory efficacies, as follows: TYR, an essential enzyme in melanin synthesis; α-MSH, an α-melanocyte-stimulating hormone gene which stimulates melanogenesis; and NRF2, a transcription factor for stress response. These factors cause dull skin and aging, and therefore, should not be highly expressed. The results indicated that all studied plant parts and concentrations affected all of these genes compared to a control (without the plant extracts). Graphs of various relative gene expression levels and the studied plant parts with various concentrations are shown in Figure 4. The lowest and second lowest percentage expression which showed high efficiency were 0.10% from 5.06 mg/mL rawfs, followed by 0.20% from 3.90 mg/mL leaves for the TYR gene; 1.29% from 0.01 mg/mL and 1.33% from 0.10 mg/mL seeds, followed by 2.33% from 0.51 mg/mL rawfs for the α-MSH gene; 3.84% from 3.90 mg/mL leaves, followed by 4.70% from 10.30 mg/mL rfp for the NRF2 gene; 0.20% from 0.51 mg/mL rawfs, and 3.90 mg/mL leaves, followed by 0.30% from 0.01 mg/mL seeds, 0.065 mg/mL ufp and 0.39 mg/mL leaves for the HLE gene.
The gene expression levels of the mixed extracts, comparing the three Mc parts, i.e., ufp, rawfs and seeds (containing α-EG and pinoresinol), and Morus alba (Ma) leaves containing protein were tested. The result showed that there were various levels of expression depending on the kind and concentration of Mc parts and genes. Additionally, both higher and lower expression were observed when Ma was added; for example, percentage expressions were 3200% and 2450% from 5.06 mg/mL rawfs and 6.50 mg/mL ufp for the COL1A1 gene, i.e., higher than without Ma. However, with1.04 mg/mL seeds, higher expression, i.e., 2930%, was observed without Ma for the COL1A2 gene. All results are shown in Table 3 and Figure 5. The results for the inhibitory genes showed that all studied mixtures, i.e., Mc leaves, rawfs and seeds with and without Ma, affected expression to a lower extent than with and without Ma, as shown in Table 4 and Figure 6. Rawfs at a concentration of 5.06 mg/mL and leaves at a concentration of 3.90 mg/mL without Ma showed lower activity, i.e., 0.10% and 0.20% for TYR and HLE, respectively, but showed higher activity, i.e., 0.19% and 1.40%, at a concentration of 5.06 mg/mL rawfs and 3.90 mg/mL leaves with added Ma for α-MSH, NRF2. With various activity found from the Mc parts, leaves and rawfs, the mixtures of Mc leaves and Ma leaves and rawfs were further tested for toxicity at a working concentration, as described in Table 5, Figure 7.

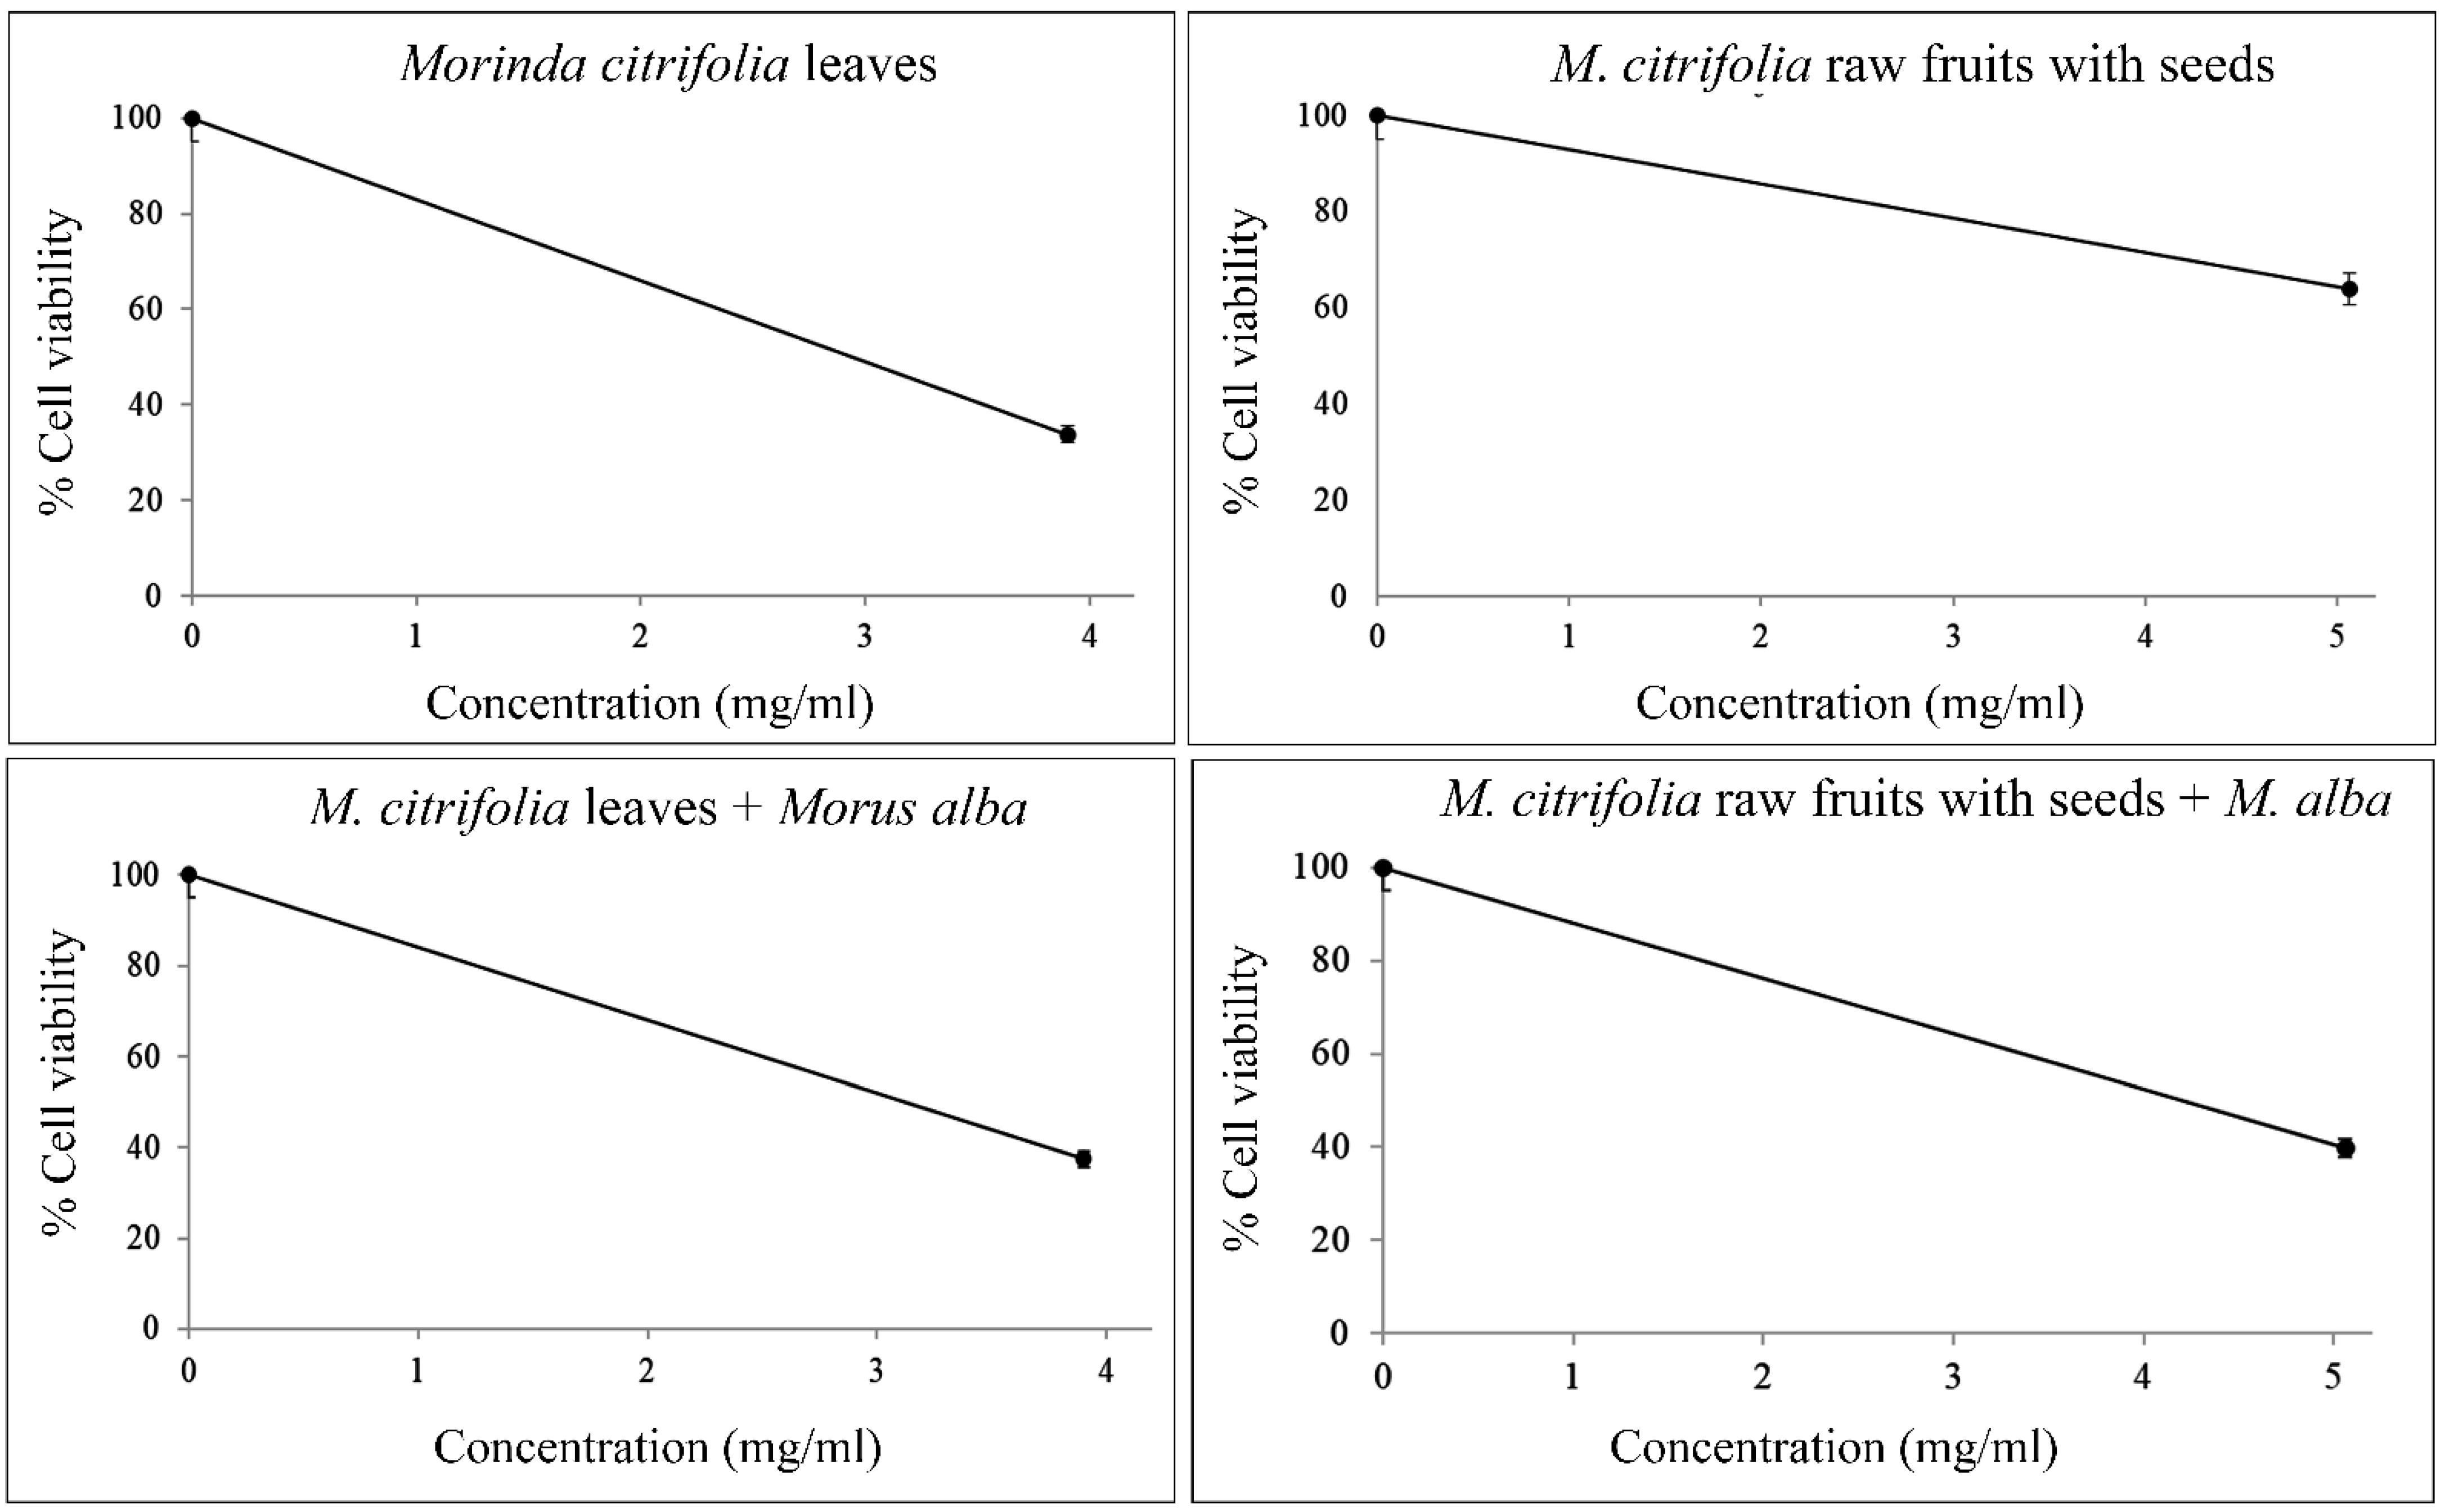
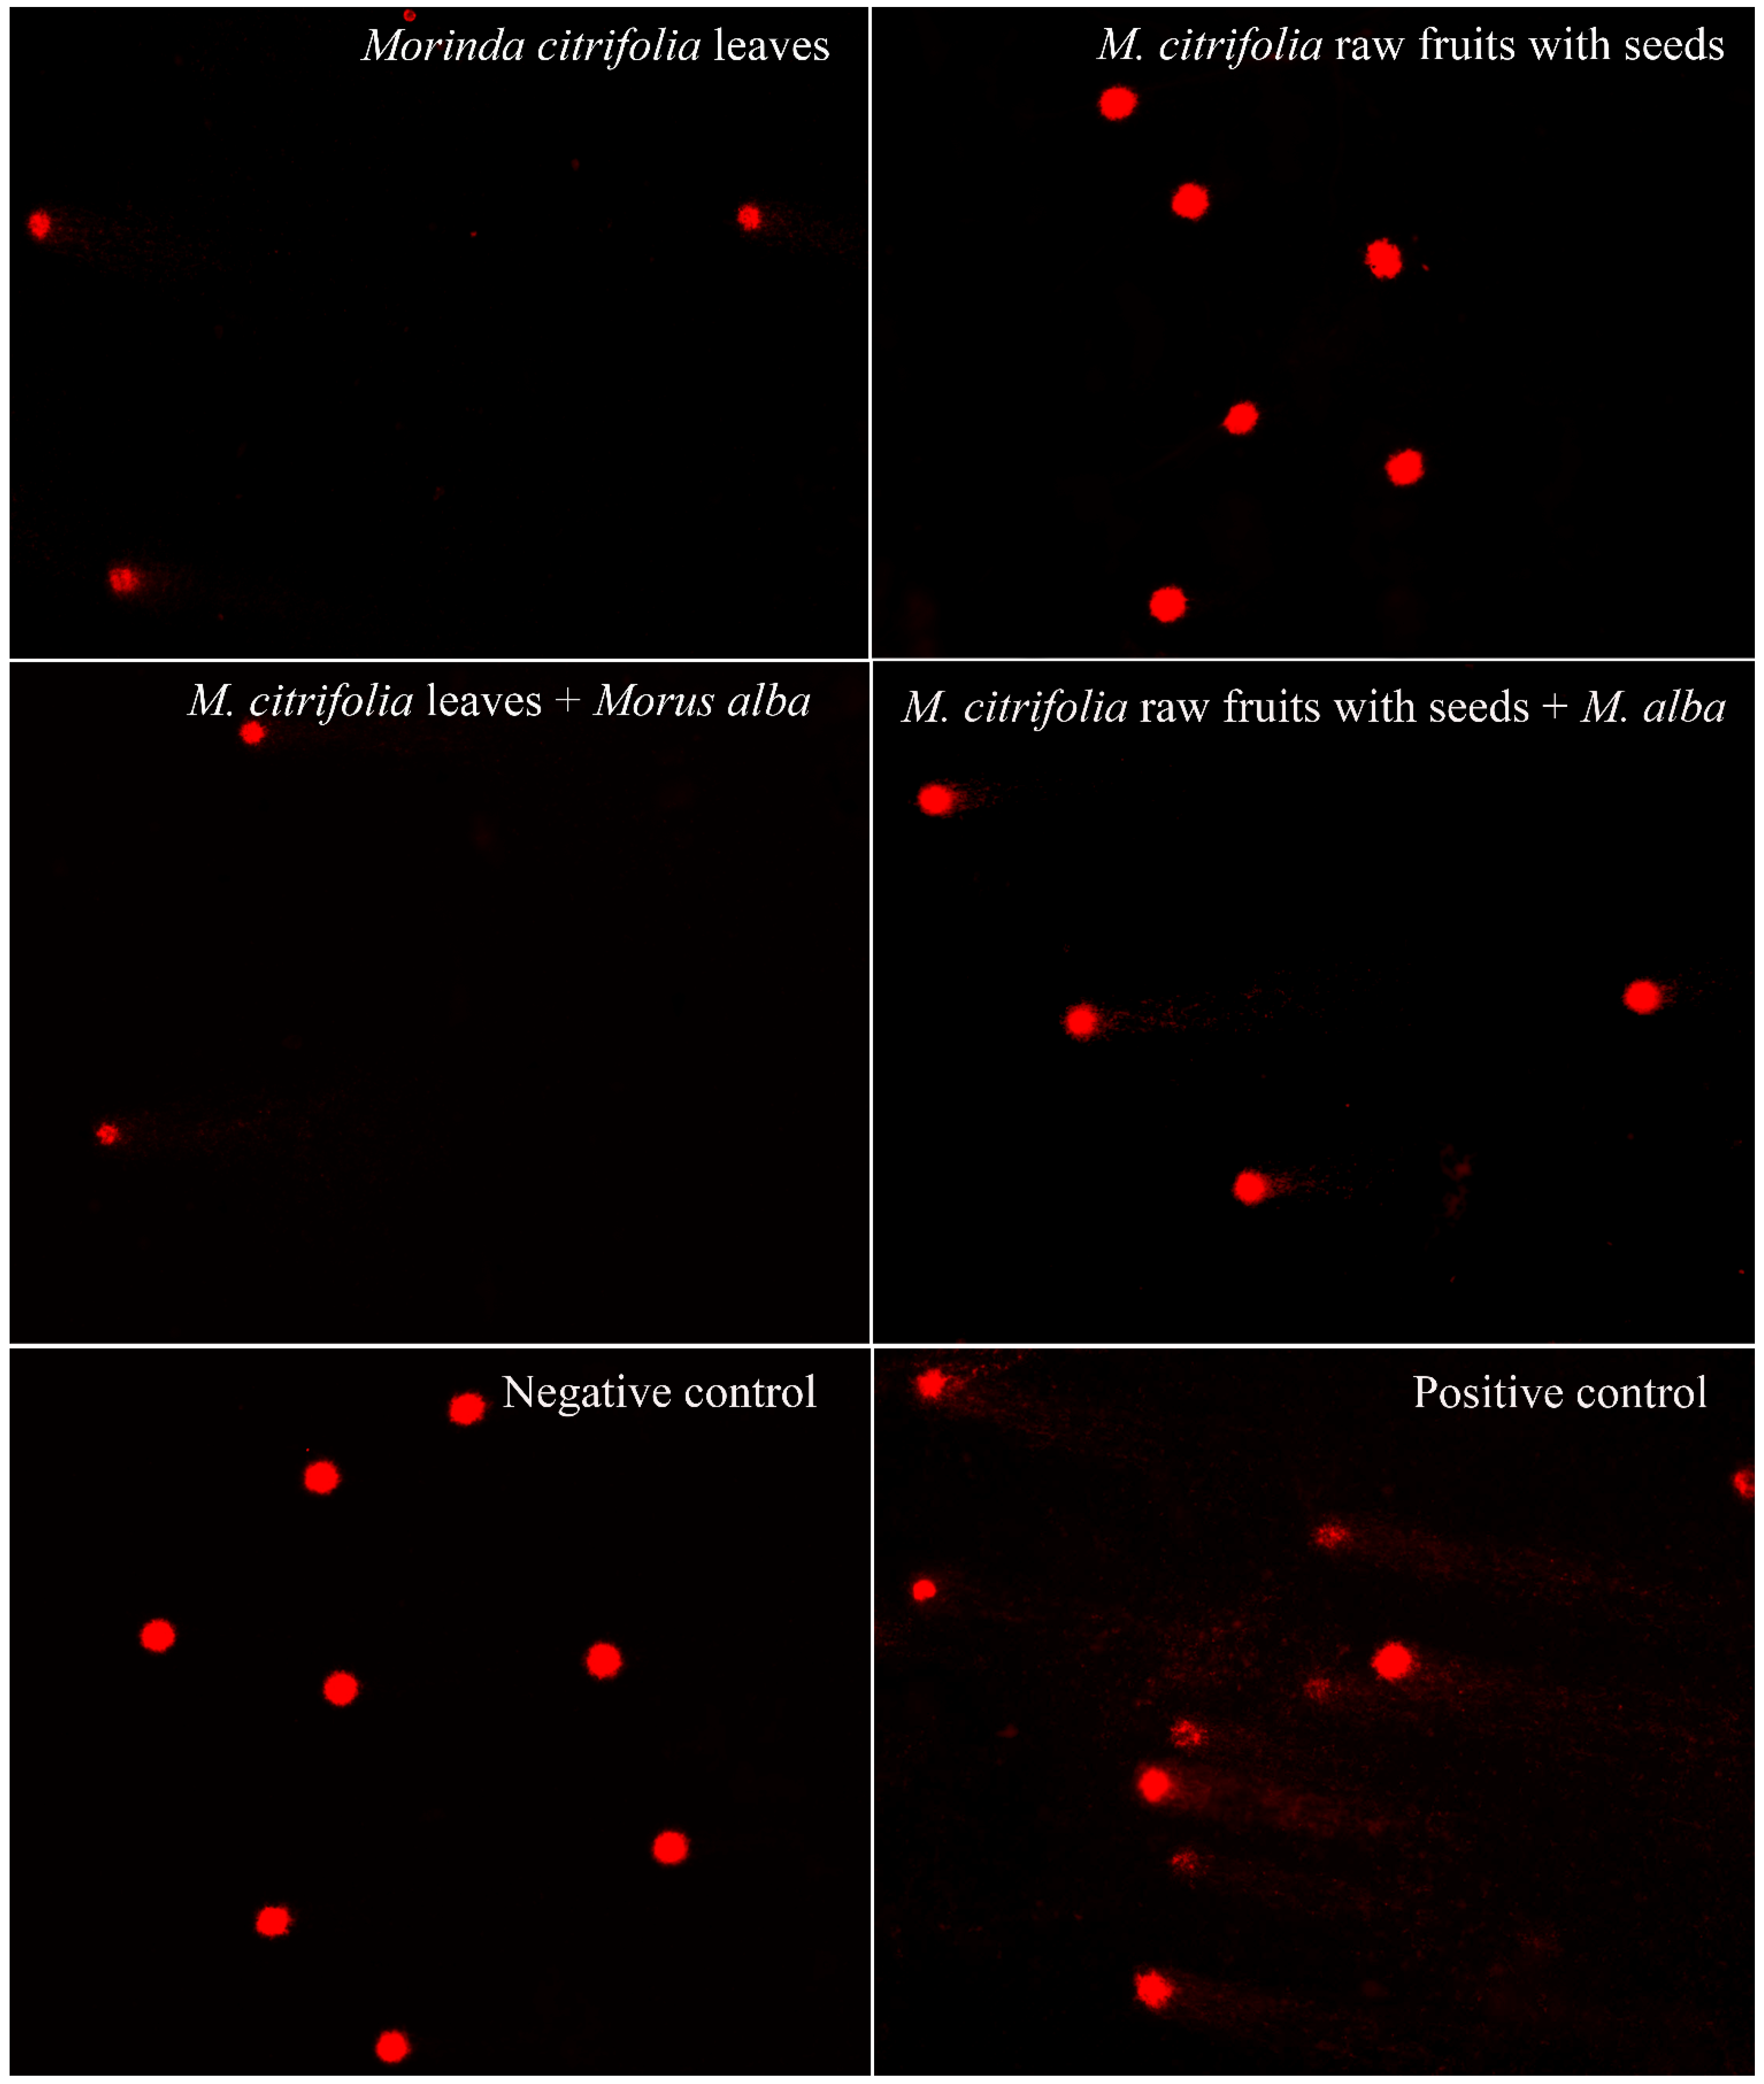
2.5. Cytotoxicity and Genotoxicity Testing via MTT and Comet Assays

The results of a MTT assay (3-(4,5-dimethylthiazol-2-yl)-2,5-diphenyltetrazolium bromide assay) showed IC50 values at 3.00 mg/mL, 2.90 mg/mL and 3.60 mg/mL in Mc parts and leaves, and in the mixture of Mc and Ma leaves. Following depth toxicity testing on the DNA level by comet assay, the samples showed significant DNA damage (Table 5, Figure 8). With the LD50 value calculated using IC50 values, the toxicity was revealed as Class II, i.e., slightly hazardous, corresponding to over 2000 mg/kg body weight for rats by oral or dermal application.

3. Discussion

When analyzing substances using the GC-MS method, α-EG was not found in Ma. Therefore, the quantity and concentration of this substance were not further studied.
The first finding regarding α-EG in Mc (grown in Thailand) leaves ufp, rfp, rawfs, and seeds provided very important information following the discovery of pinoresinol [9]. The research results can be applied for the creation of natural products including traditional forms, modified forms like supplements, nutraceuticals, functional foods, and cosmetics. α-EG acts to stimulate collagen production; collagen is an extracellular matrix protein, i.e., the major component of the extracellular matrix of the dermis. It accounts for 90% of the fiber component. Thus, change in dermal collagen content greatly affects dermal homeostasis [15]. Collagen produced by the body is synthesized mainly by fibroblasts, i.e., the main structural protein found in skin, tendon and bone. Additionally, collagen has been found to have many pharmaceutical, medicinal, nutritional and cosmetic applications [16,17]. Pinoresinol, which is present in Mc fruit, has several functions. It was tested and shown to have tyrosinase inhibitory activity in melanogenesis, an inhibitory effect on matrix metalloproteinase-1 (MMP-1) secretion (MMP-1 is a major collagenolytic enzyme which is responsible for collagen damage) and an inhibitory effect on wrinkle formation by HLE creation, which degrades collagen I and elastic fiber in human skin. Thus, HLE inhibition may be useful for the prevention of wrinkle formation [9].
On this basis, human normal fibroblast was selected in this study for experiments to show the expression of angiogenesis and fibroblast proliferation genes FGF1 and FGF7, type I collagen genes COL1A1 and COL1A2, and type III collagen gene COL3A1. Fibroblasts produce substances that constitute the basic structure of skin; a decrease in their proliferation and activity causes the deterioration of the skin structure [18]. The activities of inhibiting α-MSH-stimulated melanogenesis and an inhibitory effect on MMP-1 secretion (HLE activates MMP-1) mean that it is expected that these activities and the two substances, α-EG and pinoresinol, will be useful for the prevention of photoaging and wrinkle formation, as well as collagen creation and skin whitening. However, the amount and concentrations in each studied Mc part should be clarified. From the studied parts, leaves ufp, rfp, rawfs and seeds, and differences (concentrations in mg/mL and amounts in mg/g sample) contained 0.30/1.51, 0.11/1.75, 0.15/2.48, 0.28/3.77, and 0.07/0.94 α-EG and 0.09/0.20, 0.13/0.34, 0.14/0.38, 0.11/0.28 and 0.08/0.20 pinoresinol. These values do not reveal, however, whether the concentrations and quantities are sufficient to stimulate and inhibit the effects of the aforementioned genes. Therefore, mRNA gene expression was measured by qRT-PCR from the total RNA extracted from extracts treated with NHDF. The result showed strong effects compared to the control, with expression stimulation levels of up to 3480–4160%, 2930% and 2870% from ufp and seeds for type I and III collagen COL1A1, COL1A2, COL3A1, and 2700–4870% from seeds and ufp for angiogenesis and fibroblast proliferation genes FGF1 and FGF7 (Table 4). The inhibitory expression showed low levels but high efficacy in rawfs at 0.10% for the TYR gene, seeds at 1.29% α-MSH, and rawfs and seeds at 0.20–0.30% HLE. Additionally, leaves also showed low percentages but high efficacy for inhibition of TRY, i.e., 0.20%, and of NRF2, i.e., 3.80%. The NRF2 gene regulates oxidative stress and toxicity [19]. In line with expectations, if the protein substrate from Ma leaves was added, gene expression in the stimulatory (COL1A1, COL1A2, COL3A1, FGF1 and FGF7) and inhibitory groups showed various higher or lower expressed values for different genes. Similarly, with and without Ma leaves, TYR and HLE showed higher or lower expression. This indicated that leaves and ufp, as well as rawfs, have the potential to stimulate and inhibit the expression of all of the studied genes. However, the other studied Mc parts seemed to have advantages, depending on the objective, gene type and plant part used. Given this, the applications of Mc parts including leaves, rawfs and these two parts combined with Ma leaves at a ratio 6:4 passed toxicity tests, both in cell and DNA by MTT and comet assays. The overall results showed no toxicity in rawfs.
As such, the raw fruit with seeds can be safely applied in natural products, i.e., both foods and cosmetics. However, IC50 values indicated that these three parts should be used within limits, because of the observed Class II toxicity [20].

4. Materials and Methods

4.1. Plant Materials and Extract Preparation

The plant species were collected from a field in Muangkhonkaen District, Khon Kaen Province, Thailand and were identified by a proficient botanist, prof. Arunrat Chaveerach, Ph.D. Permission was not required to collect the Morus alba and M. citrifolia materials used in this study, because they are common species which grow widely in gardens, fields and forests for domestic consumption, i.e., eating the leaves and fruits by drinking and cooking. Specimen numbers will be granted 2 years after the deposition. Mature leaves of Morus alba and mature leaves and fruits of M. citrifolia were collected, washed and air-dried, and then ground into a powder. The powder was combined with hexane or ethanol, separately at a rate of 1:5, and soaked for 72 h. Each solution was filtered through a Whatman no.1 filter paper. The filtrates were kept at −20 °C until used in experiments, including phytochemical component analysis by GC-MS and for GC comparisons.

4.2. Proximate Analysis of Nutritional Content

The air-dried Morus alba leaf samples were ground to a fine powder. The powder was employed for proximate analyses at the Central Laboratory (Thailand) Co., Ltd., Muangkhonkaen, Thailand following the standard protocols of the Association of Analytical Chemists (AOAC) [21].

4.3. Gas Chromatography-Mass Spectrometry (GC-MS)

Phytochemical analyses of M. alba and M. citrifolia were performed using an Agilent Technologies GC 6890 N/5973 (Santa Clara, CA, USA) inert mass spectrometer fused with a capillary column (30.0 m × 250 μm × 0.25 μm). Helium was used as the carrier at a constant flow rate of 1 mL/min. The injection and mass-transferred line temperature was set at 280 °C. The oven temperature was programmed to increase from 70 °C to 120 °C at 3 °C/min. It was then maintained isothermally for 2 min, and subsequently raised to 270 °C at 5 °C/min. A 1 μL aliquot of the extract was injected in split mode. The relative percentages of the extract constituents were expressed as percentages using peak area normalization. Components were identified by comparing the obtained mass spectra with reference compounds in the Wiley 7N.1 library.2.4.

4.4. Ethyl-α-d-Glucoside (α-EG) and 3,3′-Bisdemethylpinoresinol (Pinoresinol) Detection by GC Compared to the Standard

Ten-gram samples of M. citrifolia including leaves, ufp, rfp, rawfs and seeds were soaked in 50 mL ethanol (at a ratio of 1 g:5 mL), and the solution was kept in a dark room for 3 days. The mixture was filtered through Whatman no.1 filter paper (125 mm diameter) and fractioned by adding a mixture of ethyl acetate and dichloromethane (at a ratio of 1:2). The separated clear mixture was precipitated by adding a solution mixture of petroleum ether:diethyl ether (ratio 2:1) for 400 µL per 1 µL sample, until the solution precipitated. The clear solution was filtered by syringe filter, with pore sizes of 0.45 µm, and each final extract was used for α-EG and pinoresinol detection.
The chromatographic conditions for pinoresinol detection were as follows: the GC was an Agilent Technologies GC7890B (Santa Clara, CA, USA) equipped with a flame ionization detector (FID) and HP-5 capillary column (30.0 m × 320 μm i.d. × 0.25 μm film thickness) (Agilent, Santa Clara, CA, USA). Helium was used as the carrier gas at a flow rate of 1 mL/min. The injector and detector temperatures were 260 °C and 320 °C, respectively. The oven temperature was programed at an initial temperature of 120 °C and a ramp rate of 10 °C/min for a final temperature at 300 °C, which was maintained for 10 min. Then, 1 μL of each sample was injected into a column.
The chromatographic conditions for α-EG detection were almost identical, but with the following differences: the injector and detector temperatures were 250 °C and 300 °C, respectively; the oven temperature was programed at an initial temperature of 50 °C, a ramp rate of 10 °C /min and a final temperature at 250 °C, which was maintained for 10 min. Subsequently 1 μL of each sample was injected into a column.
Standard preparations of pinoresinol and α-EG. First, 1 mg of pinoresinol and α-EG each were diluted with 1 mL methanol. The working solution was prepared by serial two-fold dilutions yielding six concentrations. These various concentrations were applied to plot the calibration curve. The linear equation and correlation coefficient were calculated using Microsoft Excel.

4.5. Gene Expression Analysis by qRT-PCR

4.5.1. Extract Preparation

The five plant parts were washed, air-dried for 2–3 days and then ground into powder. A 20-g sample powder each was extracted using 100 mL of 70% ethanol (at a rate of 1 g:5 mL). The mixture was filtered with Whatman no. 1 filter paper, and the filtrate was evaporated by rotary evaporator (Rotavapor R-210, Buchi, Flawi, Switzerland) at 800–1000 mbar, 15 °C, and 600 rpm for 2 h before being re-dissolved with 10% dimethyl sulfoxide (DMSO). The solution was 10-fold diluted with distilled water to obtain three working concentrations.

4.5.2. Gene Expression Quantification

  • Cell activation
NHDF (ATCC, Manassas, VA, USA) was cultured in 24-well plates at a primary concentration of 1.7 × 10⁵ cells/well in modified low glucose Dulbecco’s Modified Eagle Medium (DMEM) medium supplemented with 10% FBS and 1% antibiotic (streptomycin and penicillin). It was then incubated at 37 °C and 5% CO2 for 24 h.
2.
Gene stimulation and inhibition
After removing the medium, DMEM containing 1% FBS was added. The cultured cells were added to the sample extract at 200 µL/well and incubated at 37 °C and 5% CO2 for 48 h. The medium was removed, the cells were washed with PBS, and the cells were total RNA extracted using a GF-1 RNA extraction kit (Vivantis, Shah Alam, Malaysia). The RNA quality and quantity were checked using a nanodrop spectrophotometer (MaestroGen, Hsinchu, Taiwan) at 260/280 nm. The RNA quantity for all samples was normalized and 10 µg of the RNA samples was used. Reverse transcription for the first strand cDNA was performed using a Viva 2-steps RT-PCR kit with M-MuV RT (Vivantis, Shah Alam, Malaysia) by reverse transcriptase and oligo (dT)18 primers (Vivantis, Shah Alam, Malaysia). The reaction mixture was incubated at 65 °C for 5 min, and the reaction was terminated by heating 85 °C for 5 min. cDNA was kept at −20°C until further gene expression measurements were taken.
The cDNA was the template for the amplification reaction of expression detection by qRT-PCR (Roche, Mannheim, Germany) using gene-specific primers. The primer sequences were (5′→3′) COL1A1 F-AGCCTCTCCATCTTTGCCAGCA and R-GATTCCCTGGACCTAAAGGTGC [22], COL1A2 F-CCTGGTGCTAAAGGAGAAAGAGG and R-ATCACCACGACTTCCAGCAGGA [22], COL3A1 F-TGGTCTGGAAGGAATGCCTGGA and R-TCTTCCCTGGGACACCATCAG [22], FGF1 F-ATGGCACAGGTGGATGGGACAAG and R-TAAAAGCCCGTCGGTGTCCATG [22], FGF7 F-CTGTCGAACACAGTGGTACCTG and R-CCAACTGCCACTGTCCTGATTTC [22], GAPDH F-GTCTCCTCTGACTTCAACAGCG and R-ACCACCCTGTTGTGTAGCCAA [22], TYR F-CCATGACAAATCCAGAACCC and R-GGACTAGCAAATCCTTCCAG [23], α-MSH F-GTCCTCAGAAAGCTTCCTTTCCGC and R-CGTTGCCTGGAAACCGCGGCGTCTC [24], NRF2 F-TTCTGTTGCTCAGGTAGCCCC and R-TCAGTTTGGCTTCTGGACTTGG [25], HLE F-GCTGGAGCCCTCAGTTGTGGG and R-TGTTGGGTAGAATGGTGCCGG [26]. The 20 µL mixture reaction contained 5 µL 4× CAPITAL qPCR green mix LRox (Biotech rabbit, Berlin, Germany), 0.5 µL forward primer and 0.5 µL reverse primer (10 µM), 12 µL PCR grade water and 2 µL cDNA. The thermal cycles were programed following pre-denaturation at 95 °C for 3–5 min, followed by 45 cycles at 95 °C for 15 s at 60–62 °C for 30 s and 72 °C for 30 s, followed by cooling at 40 °C for 30 s. The melting temperature curve was analyzed for specific- and non-specific PCR product separation. When the reaction was complete, the crossing point for gene expression evaluation was found by the 2−∆∆Ct method [27].
List of primers for gene stimulation and inhibition detection by qRT-PCR technique including stimulation genes: COL1A1, COL1A2 are type I collagen genes; COL3A1 is type III collagen gene; FGF1 and FGF7 stimulate angiogenesis and fibroblast proliferation; the inhibition gene Tyrosinase (TYR) is an essential enzyme in melanin synthesis; α-MSH is α-melanocyte-stimulating hormone gene, stimulating melanogenesis; finally, NRF2 is a transcription factor for stress response. The genes were determined relative to GAPDH.
3.
Protein plant extracts affect gene expression
M. citrifolia parts were selected for the experiment (including concentrations of the plant parts of 6.50 mg/mL ufp, 5.06 mg/mL rawfs, and 1.04 mg/mL seeds by gene expression for stimulation, and 3.90 mg/mL leaves, 5.06 mg/mL rawfs and 1.04 mg/mL seeds for inhibition) with a protein extract of Morus alba at a concentration of 3.11 mg/mL (derived from the first extract concentration in 100% DMSO diluted to the working concentration, 10% DMSO) with a substrate expected to promote gene functions, i.e., stimulating the mechanism of collagen creation by COL1A1, COL1A2 and COL3A1; and angiogenesis and fibroblast proliferation by FGF1, FGF7. The Morus alba leaf protein extract contained 20.48 g total protein per 100 g, in accordance with the standard protocols of the Association of Analytical Chemists [28]. The three studied powders were mixed with Morus alba leaf powder at a ratio of 60:40. Then, the mixed powder was passed through the extract preparation and gene expression was quantified as described. Gene expression analyses were performed by qRT-PCR (Roche, Mannheim, Germany).

4.6. Cytotoxicity and Genotoxicity Testing via MTT and Comet Assays

The plant sample parts which had high expressions of collagen genes and inhibited tyrosinase gene expressions according to the aforementioned primers were selected for toxicity testing, i.e., both cytotoxicity (3-(4,5-dimethylthiazol-2-yl)-2,5-diphenyltetrazolium bromide, MTT assay) and genotoxicity (comet assay), to make sure that the plant parts were safe for human use. This was done as follows:
  • Stock extract preparation. A powder sample was mixed with ethanol at a ratio of 1 g:5 mL and soaked for 72 h. Each solution was filtered through Whatman No.1 filter paper. The solvent of the filtrate was removed with a rotary evaporator (Rotavapor R-210, Buchi, Flawil, Switzerland) at 800–1000 mbar, 15 °C and 600 rpm for 2 h. Then, DMSO was added to the extracts until completely dissolved and maintained as stock extracts at −20 °C until the MTT and comet experiments were conducted.
  • Human peripheral blood mononuclear cell (PBMCs) preparation. PBMCs were isolated from sodium heparin anticoagulated venous blood from a blood bank using FicollPaque Plus (GE Healthcare, Chicago, IL, USA). Freshly isolated PBMCs with viabilities of at least 98% were used for the toxicity testing. The cells were suspended at a concentration of 106 cells/mL for MTT assay and 4–6 × 10⁵ cells/mL for comet assay in modified RPMI-1640 medium supplemented with 10% FBS and 1% antibiotic (streptomycin and penicillin).
  • MTT assay. The stock extract was serially 10-fold diluted with water for five working concentrations. The prepared cells were seeded in 96-well plates with 125 µL per well. Then, 12.5 µL of the extract working concentrations were added to the corresponding wells and incubated for 24 h in a humidified CO2 incubator (Esco lifescience, Changi, Singapore) at 37 °C and 5% CO2. Corresponding DMSO concentrations were similarly prepared as vehicle controls. Untreated cells and UV-treated cells were the negative and positive controls, respectively. After this, the plates were centrifuged at 1500 rpm for 10 min and the medium was removed. MTT (Sigma, St. Louis, MO, USA) was added to a final concentration of 0.5 mg/mL and the plates were wrapped with aluminum foil and incubated for 4 h at 37 °C. Formazan crystals were solubilized by adding 100 µL DMSO to each well. The plates were kept in the dark for 2–4 h. The absorbance was read at 570 nm with a microtiter plate spectrophotometer (Multifunction microplate reader; Molecular devices, San Jose, CA, USA). Wells containing medium and MTT without cells were used as blanks. Each concentration treatment was performed in triplicate. All values were expressed as the mean ± SD. The cellular reduction of MTT formed violet crystal formazan through mitochondrial succinate dehydrogenase activity of the viable cells. The violet crystal formazan was quantified following the methods of Freshney et al. [29]. Percentages of cell viability were calculated using the equation cell viability (%) = average viable treated cells/average viable negative control cells × 100 to reveal the cytotoxicity of the plant extracts. Doses inducing 50% inhibition of cell viability (IC50 value) were determined by plotting a graph of the extract concentration against the cell viability. The IC50 value was used for the LD50 calculation [30] to infer hazardous levels, according to the World Health Organization guidelines [20].
  • Comet assay. The concentration at IC50 value or the maximum-treated concentration in the case of no IC50 value was used in the comet assay to assess the genotoxicity of plant extracts, following the method described by Singh et al. [31]. Briefly, 500 µL cells in media were added with 50 µL extracts in a 1.5 mL microtube and incubated for 24 h in a humidified CO2 incubator at 37 °C and 5% CO2. Then, the DNA was checked by electrophoresis. The electrophoresis buffer consisted of 0.3 M NaOH and 1 mM EDTA (pH = 10). Power was supplied at a constant of 3.4 v/cm, with an adjustment to 300 mA, for 25 min. To quantify the level of DNA damage, the extent of DNA migration was defined using the Olive Tail Moment (OTM), which is the relative amount of DNA in the tail of the comet multiplied by the median migration distance. The comets were observed at 200× magnifications and images were obtained using an image analysis system (Zeiss, Jena, Germany) attached to a fluorescence microscope (Nikon, Minato-ku, Japan), equipped with a 560 nm excitation filter, 590 nm barrier filter, and a CCD video camera PCO (Kelheim, Germany). At least 150 cells (50 cells for each of the triplicate slides) were examined for each experiment. The CASP software version 1.2.3 (CASPlab, Wroclaw, Poland) was used to analyze the OTM. The negative and positive controls were untreated cells and UV-treated cells, respectively. All experiments were performed in triplicate. The cultures were scored for the experiment. All values were expressed as the median ± S.D. The nonparametric Mann-Whitney U test was used for statistical analyses of the comet assay results; statistical significance was set at p < 0.05.

5. Conclusions

Mc rawfs contain a new substance, identified as α-EG, along with pinoresinol, which was previously found in sufficient concentrations and quantities to stimulate collagen growth and promote whitening and minimize dull skin, photoaging and wrinkle formation. These two substances are useful for natural product creation in natural and modified forms. They were found to be without toxicity at both cellular and DNA levels. Additionally, the leaves of the plant can be consumed but in limited amounts, i.e., not more than 2000 mg/kg body weight.

Author Contributions

R.S. acquired funding, performed the experiments, analyzed data and wrote the original manuscript draft. S.K. partially performed the experiments. U.A. partially performed the experiments. T.T. partially supervised and performed experiments. P.S. provided plant materials and performed data validation. W.W. partially performed the experiments. A.C. conceptualized and administered the project, acquired funding, supervised, wrote the manuscript, reviewed and edited. All authors have read and agreed to the published version of the manuscript.

Funding

This research was supported by the Fundamental Fund of Khon Kaen University, the National Science, Research and Innovation Fund (NSRF); and Research and Graduate Studies, Khon Kaen University.

Institutional Review Board Statement

Not applicable.

Informed Consent Statement

Not applicable.

Data Availability Statement

Not applicable.

Acknowledgments

The research team appreciates the Fundamental Fund of Khon Kaen University, the National Science, Research and Innovation Fund (NSRF); and Research and Graduate Studies, Khon Kaen University for financial support.

Conflicts of Interest

The authors declare no conflict of interest.

Abbreviations

McMorinda citrifolia
α-EGethyl-α-d-glucoside
Pinoresinol3,3′-bisdemethylpinoresinol
ufpunripe fruit pulp
rfpripe fruit pulp
rawfsraw fruits with seeds
NHDFnormal human dermal fibroblast
qRT-PCRquantitative reverse transcription-polymerase chain reaction
MaMorus alba
PBMCshuman peripheral blood mononuclear cells

References

  1. Masuda, M.; Murata, K.; Fukuhama, A.; Naruto, S.; Fujita, T.; Uwaya, A.; Isami, F.; Matsuda, H. Inhibitory effects of constituents of Morinda citrifolia seeds on elastase and tyrosinase. J. Nat. Med. 2009, 63, 267–273. [Google Scholar] [CrossRef] [PubMed]
  2. Sanni, D.M.; Fatoki, T.H.; Kolawole, A.O.; Akinmoladun, A.C. Xeronine structure and function: Computational comparative mastery of its mystery. In Silico Pharmacol. 2017, 5, 8. [Google Scholar] [CrossRef] [PubMed] [Green Version]
  3. Sousa, B.C.; Miguel, C.B.; Rodrigues, W.F.; Machado, J.R.; Silva, M.V.; Costa, T.A.; Lazo-Chica, J.M.; Degasperi, T.P.; Sales-Campos, H.; Bucek, E.U.; et al. Effects of short-term consumption of Morinda citrifolia (Noni) fruit juice on mice intestine, liver and kidney immune modulation. Food Agri. Immunol. 2017, 28, 528–542. [Google Scholar] [CrossRef] [Green Version]
  4. Sousa, B.C.; Machado, J.R.; Silva, M.V.; Costa, T.A.; Lazo-Chica, J.E.; Degasperi, T.P.; Junior, V.R.; Sales-Campos, H.; Bucek, E.U.; Oliveira, C.J.F. Morinda citrifolia (Noni) Fruit Juice Reduces Inflammatory Cytokines Expression and Contributes to the Maintenance of Intestinal Mucosal Integrity in DSS Experimental Colitis. Mediat. Inflam. 2017, 2017, 6567432. [Google Scholar]
  5. Soni, N.R. Novel Treatment of Cancer and its Potential in Obesity: “Xeronine” Found in Morinda Citrifolia (Noni Fruit). J. Nutr. Disord. Ther. 2018, 8, 1. [Google Scholar] [CrossRef]
  6. Zhang, K.; Meng, J.; Li, X.; Tang, X.; Ma, S.; Lv, Y.; Yang, S. Noni (Morinda citrifolia L.) wine prevents the oxidative stress and obesity in mice induced by high-fat diet. J. Food Biochem. 2020, 44, e13460. [Google Scholar] [CrossRef]
  7. Yang, X.; Lin, C.; Cai, S.; Li, W.; Tang, J.; Wu, X. Therapeutic effects of noni fruit water extract and polysaccharide on oxidative stress and inflammation in mice under high-fat diet. Food Funct. 2020, 11, 1133–1145. [Google Scholar] [CrossRef]
  8. Sina, H.; Dramane, G.; Tchekounou, P.; Assogba, M.F.; Chabi-Sika, K.; Boya, B.; Socohou, K.; Adjanohoun, A.; Baba-Moussa, L. Phytochemical composition and in vitro biological activities of Morinda citrifolia fruit juice. Saudi J. Biol. Sci. 2020, 28, 1331–1335. [Google Scholar] [CrossRef] [PubMed]
  9. Matsuda, H.; Masuda, M.; Murata, K.; Abe, Y.; Uwaya., A. Study of the Anti-hotoaging effect of Noni (Morinda citrifolia). In Melanoma—From Early Detection to Treatment, 1st ed.; Duc, T.H., Ed.; IntechOpen: London, UK, 2013; pp. 629–648. [Google Scholar]
  10. Assi, R.A.; Darwis, Y.; Abdulbaqi, I.M.; Khan, A.A.; Vuanghao, L.; Laghari, M.H. Morinda citrifolia (Noni): A comprehensive review on its industrial uses, pharmacological activities, and clinical trials. Arab. J. Chem. 2017, 10, 691–707. [Google Scholar] [CrossRef]
  11. Inada, A.C.; Figueiredo, P.S.; Santos-Eichler, R.A.; Freitas, K.C.; Hiane, P.A.; Castro, A.P.; Guimarães, R.C.A. Morinda citrifolia Linn. (Noni) and Its Potential in Obesity-Related Metabolic Dysfunction. Nutrients 2017, 9, 540. [Google Scholar] [CrossRef] [PubMed] [Green Version]
  12. Almeida, E.S.; Oliveira, D.; Hotza, D. Properties and Applications of Morinda citrifolia (Noni). Compr. Rev. Food Sci. Food Saf. 2019, 8, 883–909. [Google Scholar] [CrossRef] [Green Version]
  13. Sabsung, A.; Phornchirasilp, S.; Luanratana, O.; Sirikulchayanonta, V.; Tiengda, C. A toxicity study of Morus alba L. leaf extract. Thai J. Pharmacol. 2004, 26, 7. [Google Scholar]
  14. Polumackanycz, M.; Wesolowski, M.; Viapiana, A. Morus alba L. and Morus nigra L. leaves as a promising food source of phenolic compounds with antioxidant activity. Plant Food. Hum. Nutr. 2021, 76, 458–465. [Google Scholar] [CrossRef]
  15. Tominaga, N.; Nishiyama, T.; Hayashi, T. Collagens in skin. Sen-I Gakkaishi 1986, 42, 237–242. [Google Scholar] [CrossRef] [Green Version]
  16. Drąg-Zalesińska, M.; Rembiałkowska, N.; Borska, S.; Saczko, J.; Drąg, M.; Poręba, M.; Kulbacka, J. A New Betulin Derivative Stimulates the Synthesis of Collagen in Human Fibroblasts Stronger than its Precursor. In Vivo 2019, 33, 1087–1093. [Google Scholar] [CrossRef] [Green Version]
  17. Wang, H. A Review of the Effects of Collagen Treatment in Clinical Studies. Polymers 2021, 13, 3868. [Google Scholar] [CrossRef] [PubMed]
  18. Varani, J.; Dame, M.K.; Rittie, L.; Suzanne, E.G.; Fligiel, K.S.; Gary, J.; Fisher Voorhees, J.J. Decreased collagen production in chronologically aged skin: Roles of aged-dependent alteration in fibroblast function and defective mechanical stimulation. Am. J. Pathol. 2006, 168, 1861–1868. [Google Scholar] [CrossRef] [Green Version]
  19. Ma, Q. Role of Nrf2 in oxidative stress and toxicity. Annu. Rev. Pharmacol. Toxicol. 2013, 23, 401–426. [Google Scholar] [CrossRef] [PubMed] [Green Version]
  20. World Health Organization. The WHO Recommended Classification of Pesticides by Hazard and Guidelines to Classification. 2009. Available online: https://apps.who.int/iris/handle/10665/44271 (accessed on 21 September 2018).
  21. Horwitz, W. Official Methods of Analysis of AOAC International, 17th ed.; Association of Official Analytical Chemists (AOAC): Gaithersburg, MD, USA, 2000. [Google Scholar]
  22. Yuan, J.S.; Reed, A.; Feng Chen, F.; Stewart, N.C. Statistical analysis of real-time PCR data. BMC Bioinform. 2006, 7, 85. [Google Scholar] [CrossRef] [PubMed] [Green Version]
  23. Bogaki, T.; Mitani, K.; Oura, Y.; Ozeki, K. Effects of ethyl-α-d-glucoside on human dermal fibroblasts. Biosci. Biotechnol. Biochem. 2017, 81, 1706–1711. [Google Scholar] [CrossRef] [PubMed] [Green Version]
  24. Praetorius, C.; Grill, C.; Stacey, S.N.; Metcalf, A.M.; Gorkin, D.U.; Robinson, K.C.; Van, O.E.; Kim, R.S.; Bergsteinsdottir, K.; Ogmundsdottir, M.H.; et al. A polymorphism in IRF4 affects human pigmentation through a tyrosinase-dependent MITF/TFAP2A pathway. Cell 2013, 155, 1022–1033. [Google Scholar] [CrossRef] [PubMed] [Green Version]
  25. Eerola, K.; Virtanen, S.; Vähätalo, L.; Ailanen, L.; Cai, M.; Hruby, V.; Savontaus, M.; Savontaus, E. Hypothalamic γ-melanocyte stimulating hormone gene delivery reduces fat mass in male mice. J. Endocrinol. 2018, 239, 19–31. [Google Scholar] [CrossRef]
  26. Kokot, A.; Metze, D.; Mouchet, N.; Galibert, M.D.; Schiller, M.; Luger, T.A.; Böhm, M. Alpha-melanocyte-stimulating hormone counteracts the suppressive effect of UVB on Nrf2 and Nrf-dependent gene expression in human skin. Endocrinology 2009, 150, 3197–3206. [Google Scholar] [CrossRef] [PubMed] [Green Version]
  27. Livak, K.J.; Schmittgen, T.D. Analysis of relative gene expression data using real-time quantitative PCR and the 2(-Delta Delta C(T)) method. Methods 2001, 25, 402–408. [Google Scholar] [CrossRef] [PubMed]
  28. Talas, U.; Dunlop, J.; Khalaf, S.; Leigh, I.M.; Kelsell, D.P. Human elastase 1: Evidence for expression in the skin and the identification of a frequent frameshift polymorphism. J. Investig. Dermatol. 2000, 114, 165–170. [Google Scholar] [CrossRef] [Green Version]
  29. Freshney, R.I. Culture of Animal Cells: A Manual of Basic Technique and Specialized Applications, 6th ed.; John Wiley & Sons: Hoboken, NJ, USA, 2010; pp. 1–796. [Google Scholar]
  30. Walum, E. Acute oral toxicity. Environ. Health Perspect. 1998, 106, 497–503. [Google Scholar]
  31. Singh, N.P.; McCoy, M.T.; Tice, R.R.; Schneider, E.L. A simple technique for quantitation of low levels of DNA damage in individual cells. Exp. Cell Res. 1988, 175, 184–191. [Google Scholar] [CrossRef] [Green Version]
Figure 1. Gas chromatography-mass spectrometry chromatograms of the hexane and ethanol leaf extract of Morus alba (Ma) and leaf and fruit extracts of Morinda citrifolia (Mc), showing retention time and peak areas.
Plants 11 01985 g001
Figure 2. GC chromatograms of the pinoresinol (a) and α-EG standards (b), ethanol solvent and pinoresinol and α-EG peak areas from Morida citrifolia (Mc) plant parts.
Plants 11 01985 g002
Figure 3. Graphs plotting the stimulatory gene expression value and the studied plant parts with various concentrations, showing the stimulatory effect of Morinda citrifolia (Mc) parts/extracts containing α-EG and pinoresinol.
Plants 11 01985 g003
Figure 4. Graphs plotting the inhibitory gene expression value and the studied plant parts with various concentrations, showing the inhibitory effect of Morinda citrifolia (Mc) parts/extracts containing α-EG and pinoresinol.
Plants 11 01985 g004
Figure 5. Stimulation gene expression values and the mixture of plant parts with various concentrations of Morinda citrifolia (Mc) containing α-EG and pinoresinol, and Morus alba (Ma) leaves containing 20.48 g total protein per 100 g at a concentration of 3.11 mg/mL.
Plants 11 01985 g005
Figure 6. Inhibition gene expression values and the mixture of plant parts with various concentrations of Morinda citrifolia (Mc) containing α-EG and pinoresinol, and Morus alba (Ma) leaves containing 20.48 g total protein per 100 g at a concentration of 3.11 mg/mL.
Plants 11 01985 g006
Figure 7. Cytotoxicity showing viability percentages of PBMCs treated with ethanol extracts of Morinda citrifolia leaves, M. citrifolia rawfs, M. citrifolia leaves plus Morus alba and M. citrifolia rawfs plus M. alba extracts.
Plants 11 01985 g007
Figure 8. Comet images (200×) of PBMCs treated with ethanol extract of Morinda citrifolia leaves, M. citrifolia rawfs, M. citrifolia leaves plus Morus alba, M. citrifolia rawfs plus M. alba extracts; negative and positive controls.
Plants 11 01985 g008
Table 1. A summary of chemical constituents sorted by relative content percentages, analyzed by GC-MS in hexane and ethanol Morus alba (Ma) and Morinda citrifolia (Mc) extracts. For Mc, whole fruits (raw with seeds) were used.
Compound NameINCI
Name
CAS
Number
Chemical
Formula
Relative Content (%)
Morinda citrifoliaMorus alba
FruitsLeavesLeaves
EthanolHexaneEthanolHexaneMethanolHexane
3-Hydroxy-2,3-dihydromaltol--C6H8O40.89-0.51---
Ethyl-α-d-glucopyranoside--C8H16O654.12-52.33---
Palmitic acidPalmitic acid57-10-3C16H32O211.82-1.33-14.2219.32
PhytolPhytol150-86-7/7541-49-3C20H40O4.393.3013.1933.2614.9316.04
Lanosteryl acetate-2671-68-3C32H52O2-----11.52
Lupeol acetate-1617-68-1C32H52O2-----10.30
dl-α-TocopherolTocopherol1406-66-2C29H50O21.872.614.30---
Methyl oleanonate--C31H48O33.95-2.27---
2-Methoxy-5-Vinylphenol--C9H10O2--1.56---
Ethyl palmitateEthyl palmitate628-97-7C18H36O2--0.43---
Chloropyrilene--C14H18ClN3S--0.43---
Glycerol 1,3-dipalmitate--C35H68O5--0.52---
2-Palmitoylglycerol--C19H38O4--1.43---
Glycerol 2-monooleate--C21H40O4--1.92---
SqualeneSqualene111-02-04C30H50--4.97---
Campesterol--C28H48O--2.904.02-1.41
γ-SitosterolSitosterol83-46-5C29H50O--4.226.2413.8010.32
Methyl linolenate-112-63-0C19H32O2----4.32-
Linolenic acidLinolenic acid60-33-3C18H30O2----3.45-
Vitamin ETocopherol1406-66-2C29H50O2--1.80-2.83-
Methyl arjunolate--C31H50O5--0.86---
α-Tocopherolquinone--C29H50O3---1.91--
Stigmasterol--C29H48O---5.97-1.39
Benzyl beta-d-glucoside-4304-12-5C13H16O7----4.18-
Aurantiamide-58115-31-4C25H26N2O3----4.08-
Octadecanoic acid-57-11-4C18H36O2----1.352.95
Lupenone-1617-70-5C30H48O-----2.84
Simiarenol-1615-94-7C30H50O-----2.83
ethyl 4-ethoxybenzoate-23676-09-7C11H14O3----2.050.98
Lanosterol-79-63-0C30H50O-----1.87
Loliolide-5989-02-6C11H16O3----1.79-
Vomifoliol-23526-45-6C13H20O3----1.68-
Phytol acetate-10236-16-5C22H42O2-----1.48
6,10,14-Trimethylpentadecan-2-one-502-69-2C18H36O----1.42-
Dodecanoic acidLauric Acid143-07-7C12H24O2-----1.33
Glycerol-beta-palmitate-23470-00-0C19H38O4----1.11-
Dotriacontane-544-85-4C32H66-----0.94
γ-Tocopherol-54-28-4C28H48O2----0.560.88
2-Pentadecanone, 6,10,14-trimethyl-Hexahydrofarnesyl acetone502-69-2C18H36O-----0.82
delta-Tocopherol-119-13-1C27H46O2----0.75-
(2,3-Diphenylcyclopropyl)methyl phenyl sulfoxide, trans--131758-71-9 C22H20OS-----0.63
Unknown---22.9694.095.0348.6027.4812.15
Table 2. Pinoresinol and α-EG measurements by GC compared to pinoresinol and α-EG standards from Morinda citrifolia (Mc) plant parts.
Plant SamplesFiltrate Volume
(mL)
Peak Area
(pA × s)
Concentration
(mg/mL)
Amounts
(mg/g Sample)
Pinoresinolα-EGPinoresinolα-EGPinoresinolα-EGPinoresinolα-EG
Leaves4.5010.0049.190862.16470.090.300.201.51
Unripe fruit pulp5.2031.0078.483217.05160.130.110.341.75
Ripe fruit pulp5.3034.0089.046624.97890.140.150.382.48
Raw fruit with seeds5.0027.0065.472256.94940.110.280.283.77
Seeds5.2026.0038.06317.36990.080.070.200.94
Table 3. Comparative values of stimulatory expression with and without Morus alba (Ma) protein extracts added to Morinda citrifolia (Mc) parts contains α-EG and pinoresinol; these mixtures were expected to yield higher expression values.
Treatment and
Control
Conc.
(mg/mL)
Human Dermal Fibroblast Cells
Ct Value of
GADPH
Gene Expression Value (%)
COL1A1COL1A2COL3A1FGF1FGF7
+Ma+Ma+Ma+Ma+Ma
Control-18.701907011010012010016090210110
Mc unripe fruit pulp 6.50, 3.1134.45540245096013604402403907907501960
Mc raw fruits with seeds 5.06, 3.1137.1941032005309602870113097026702150660
Mc seeds 1.04, 3.1134.882030181029302009703201705302700140
Table 4. Comparative values of inhibition expression with and without Morus alba (Ma) protein extract added to Morinda citrifolia (Mc) parts containing α-EG and pinoresinol.
The Mixture Samples
at a Ratio 6:4
Conc.
(mg/mL)
Human Dermal Fibroblast Cells
Ct Value of
GADPH
Gene Expression Value (%)
TYRα-MSHNRF2HLE
+Ma+Ma+Ma+Ma
Control-21.20116.9053.2055.70106.20115.40109.4010.5066.00
Mc leaves + Ma leaves3.90, 3.1136.900.208.702.606.403.801.400.205.30
Mc raw fruits with seeds + Ma leaves5.06, 3.1137.200.1011.006.401.904.904.801.208.40
Mc seeds + Ma leaves1.04, 3.1135.705.403.9029.808.205.803.400.5011.80
Table 5. Comparative values of inhibition expression with and without Morus alba (Ma) protein extract added to Morinda citrifolia (Mc) parts containing α-EG and pinoresinol.
Plant SamplesWorking
Conc. (mg/mL)
IC50 (mg/mL)LD50 (mg/kg rat)% Cell Viability
(Mean ± S.D.)
Olive Tail Moment
(Median ± S.D.)
p-Values
Negative control----0.0972 ± 0.0897-
Mc leaves3.903.002077.2533.82 ± 0.049.9719 ± 0.6977<0.0001
Mc raw fruits with seeds5.06--62.17 ± 0.040.1093 ± 0.08910.1652
Mc leaves + Ma leaves3.90, 3.113.102102.7437.44 ± 0.087.1208 ± 0.5955<0.0001
Mc raw fruits with seeds + Ma leaves5.06, 3.114.202354.2339.74 ± 0.043.2936 ± 0.1640<0.0001
Publisher’s Note: MDPI stays neutral with regard to jurisdictional claims in published maps and institutional affiliations.

