
Seasonality and Phosphate Fertilization in Carbohydrates Storage: Carapa guianensis Aubl. Seedlings Responses

 ,
,
Abstract
:1. Introduction
2. Results
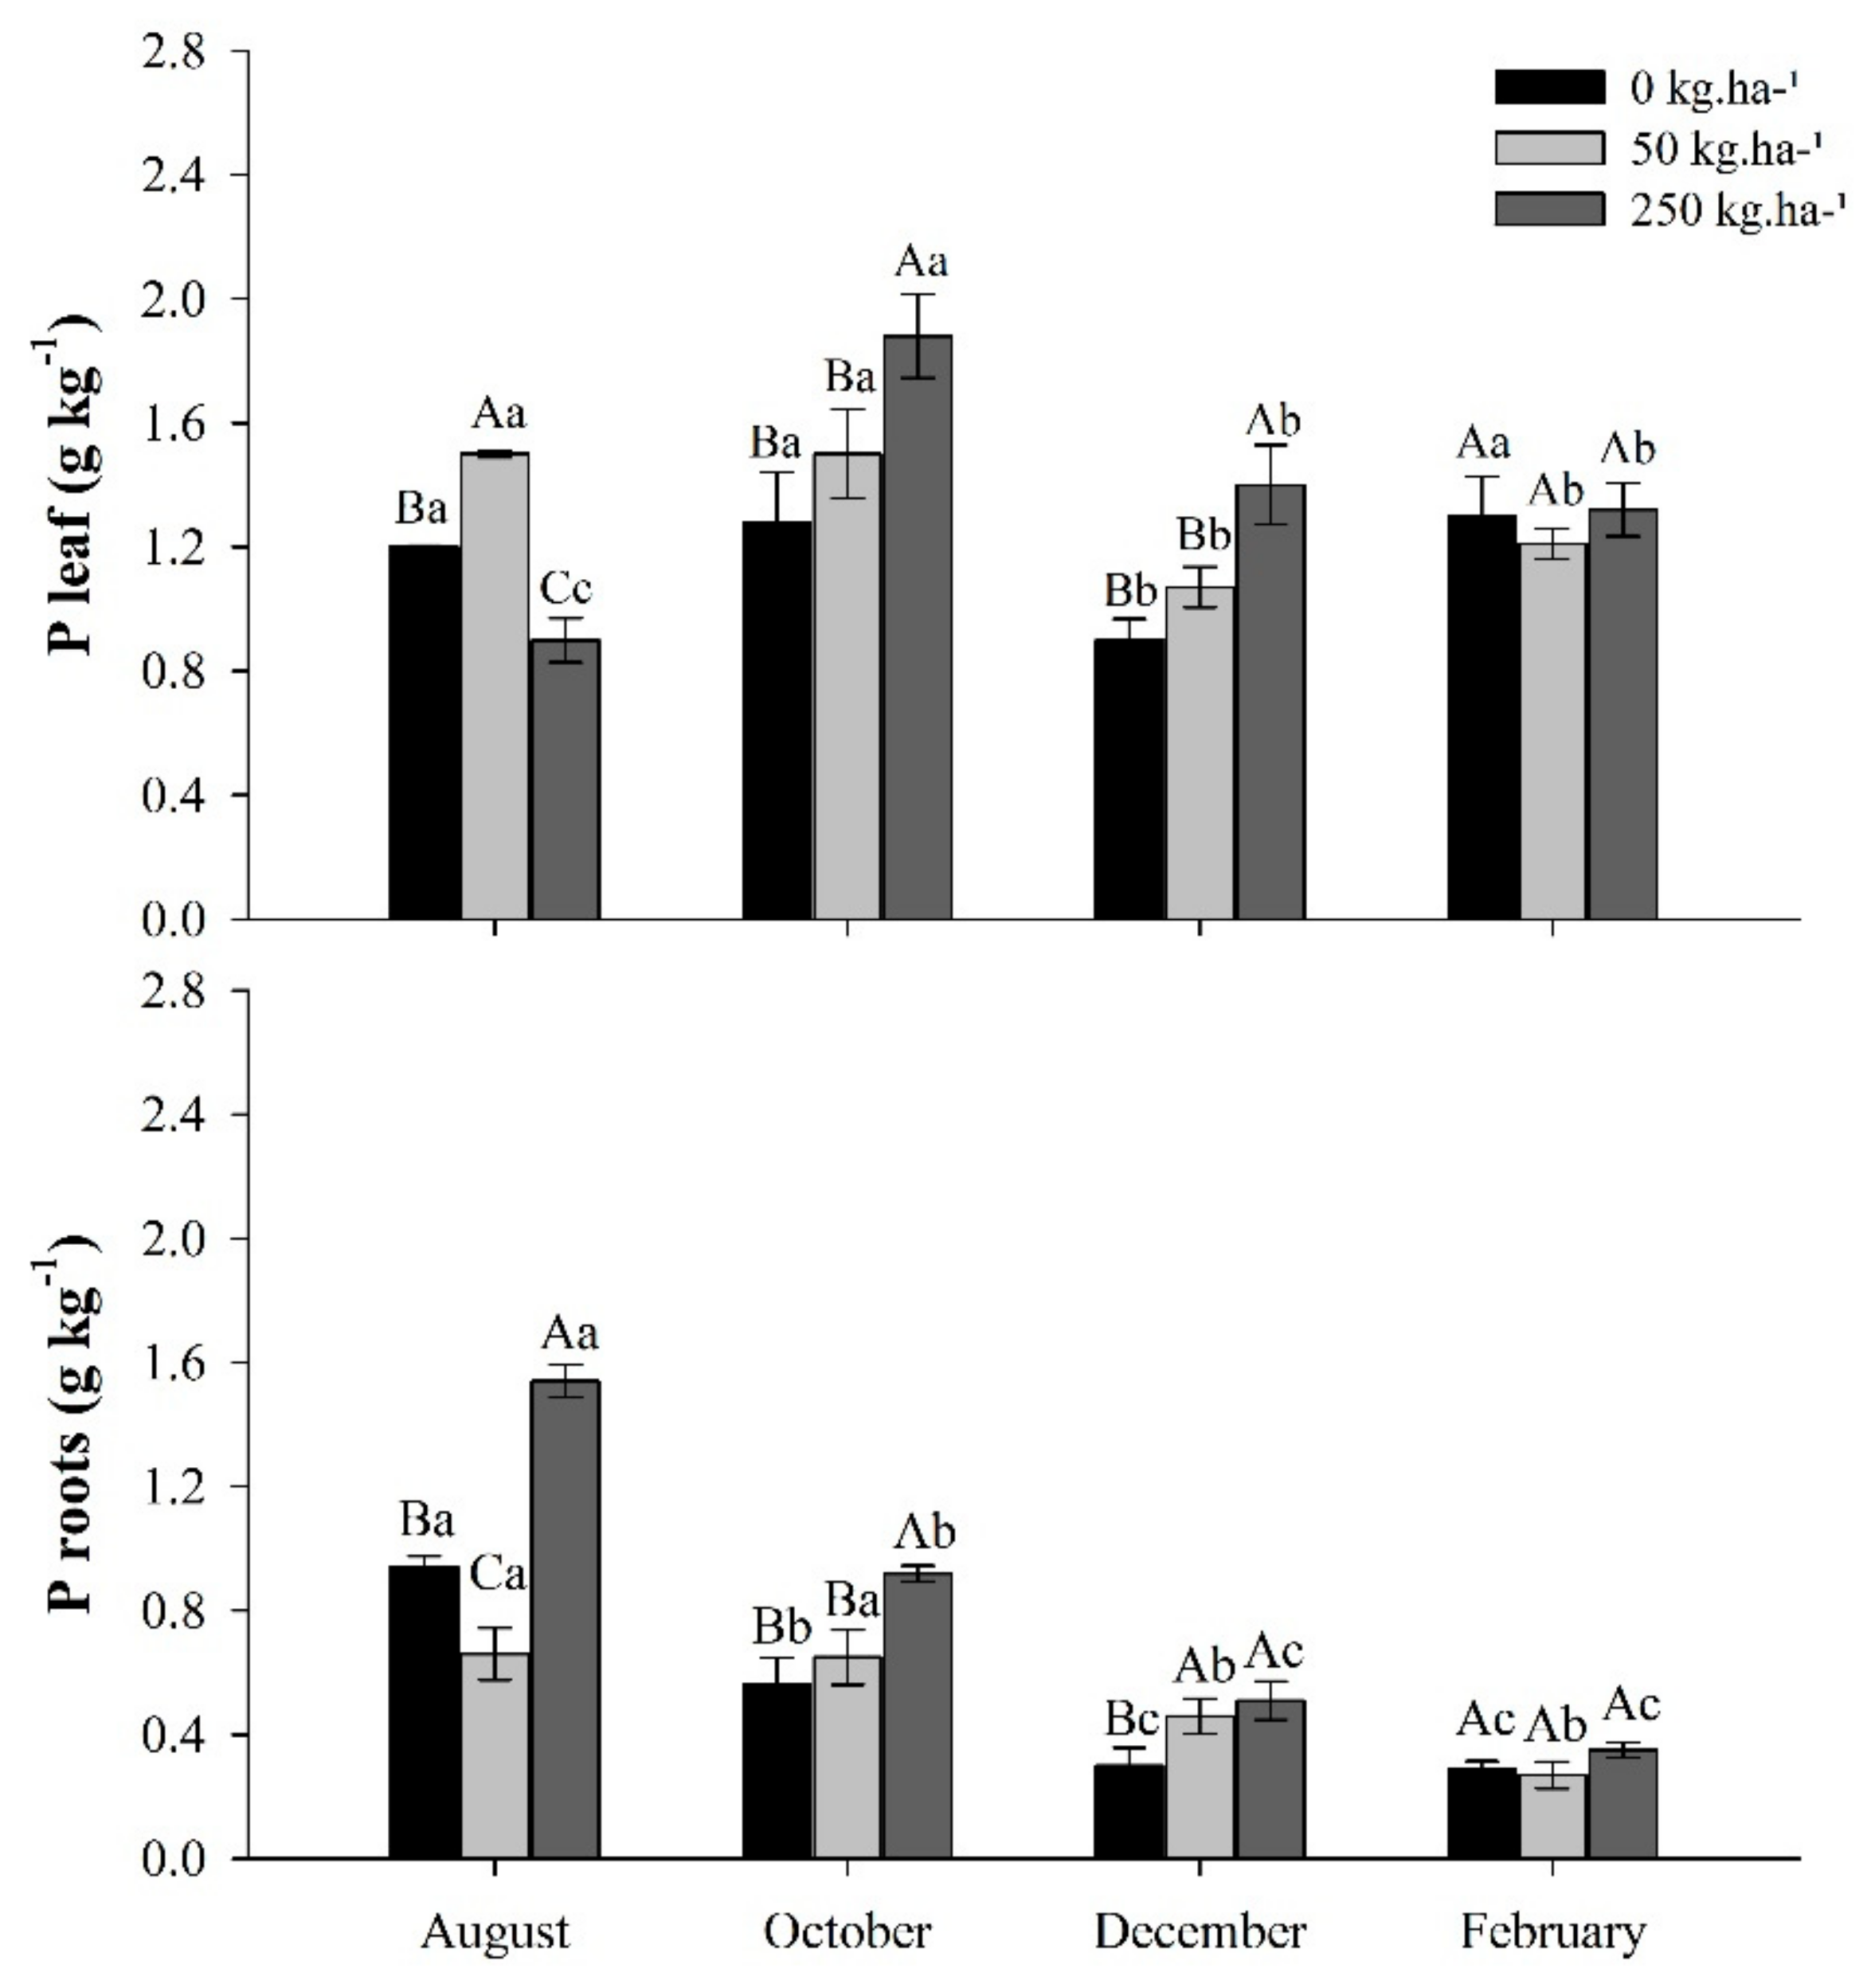
2.1. Phosphorus Content
2.2. Dry Matter
2.3. Carbohydrate Distribution
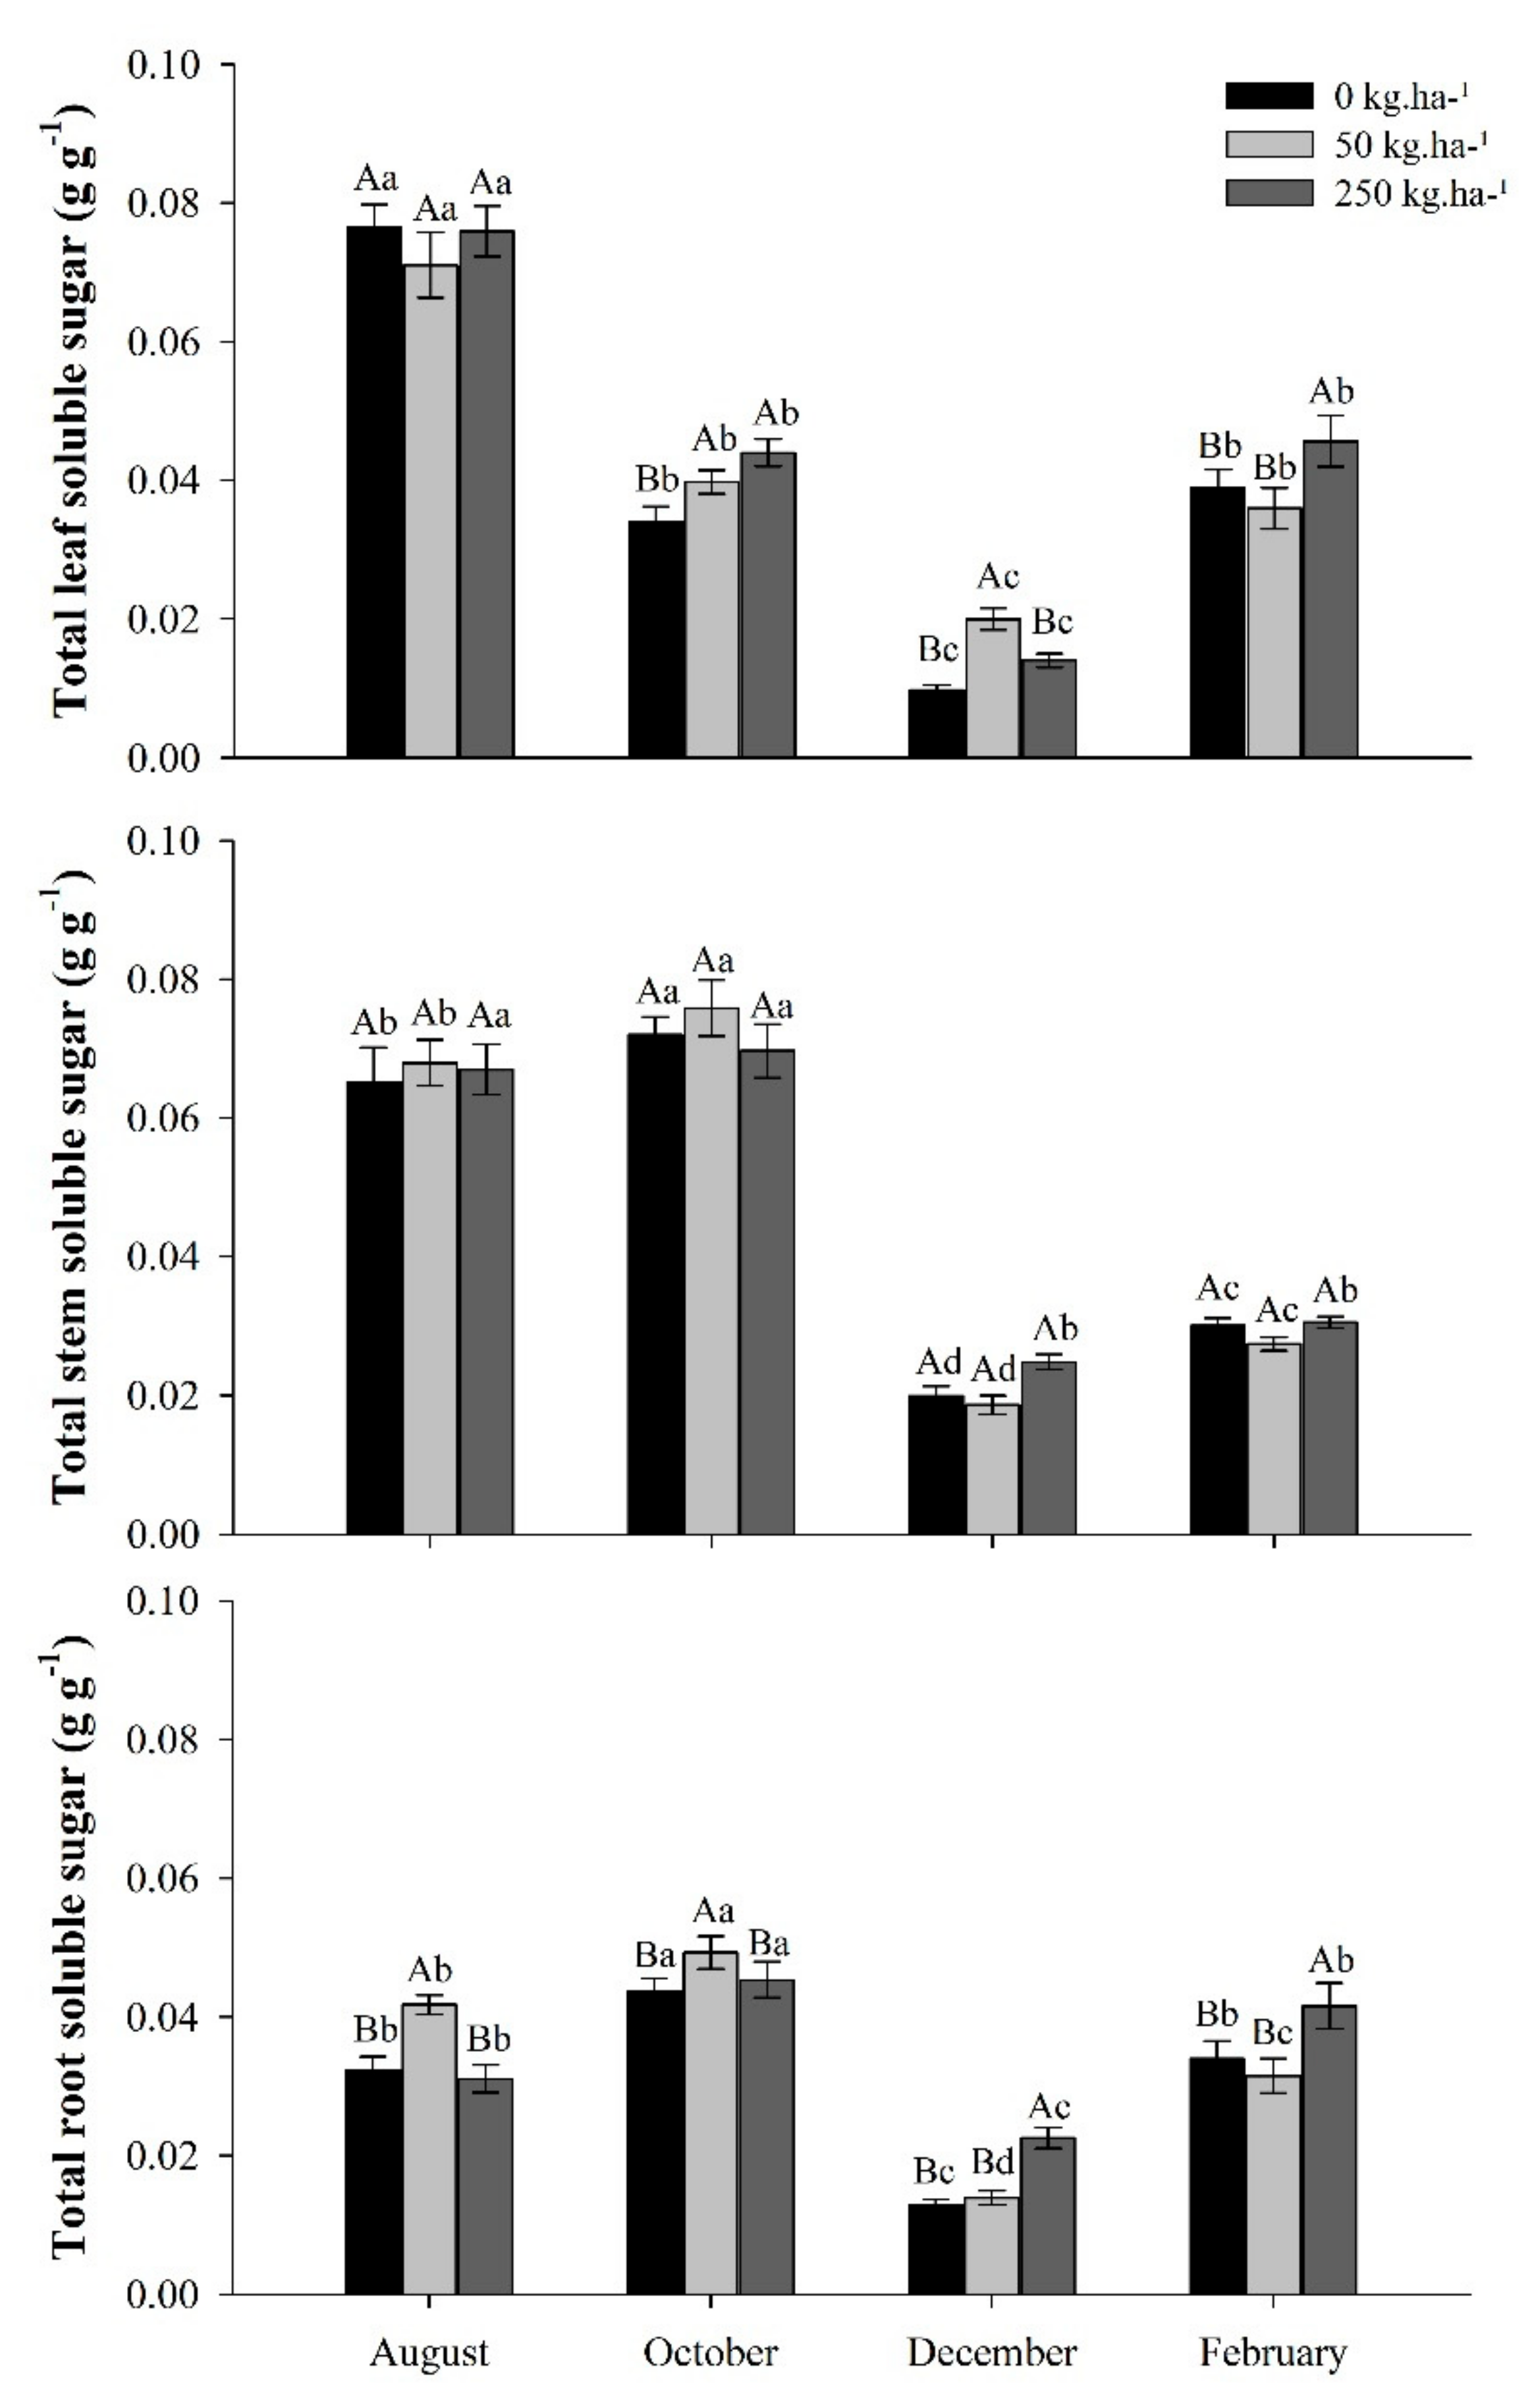
2.3.1. Total Soluble Sugars (TSS)
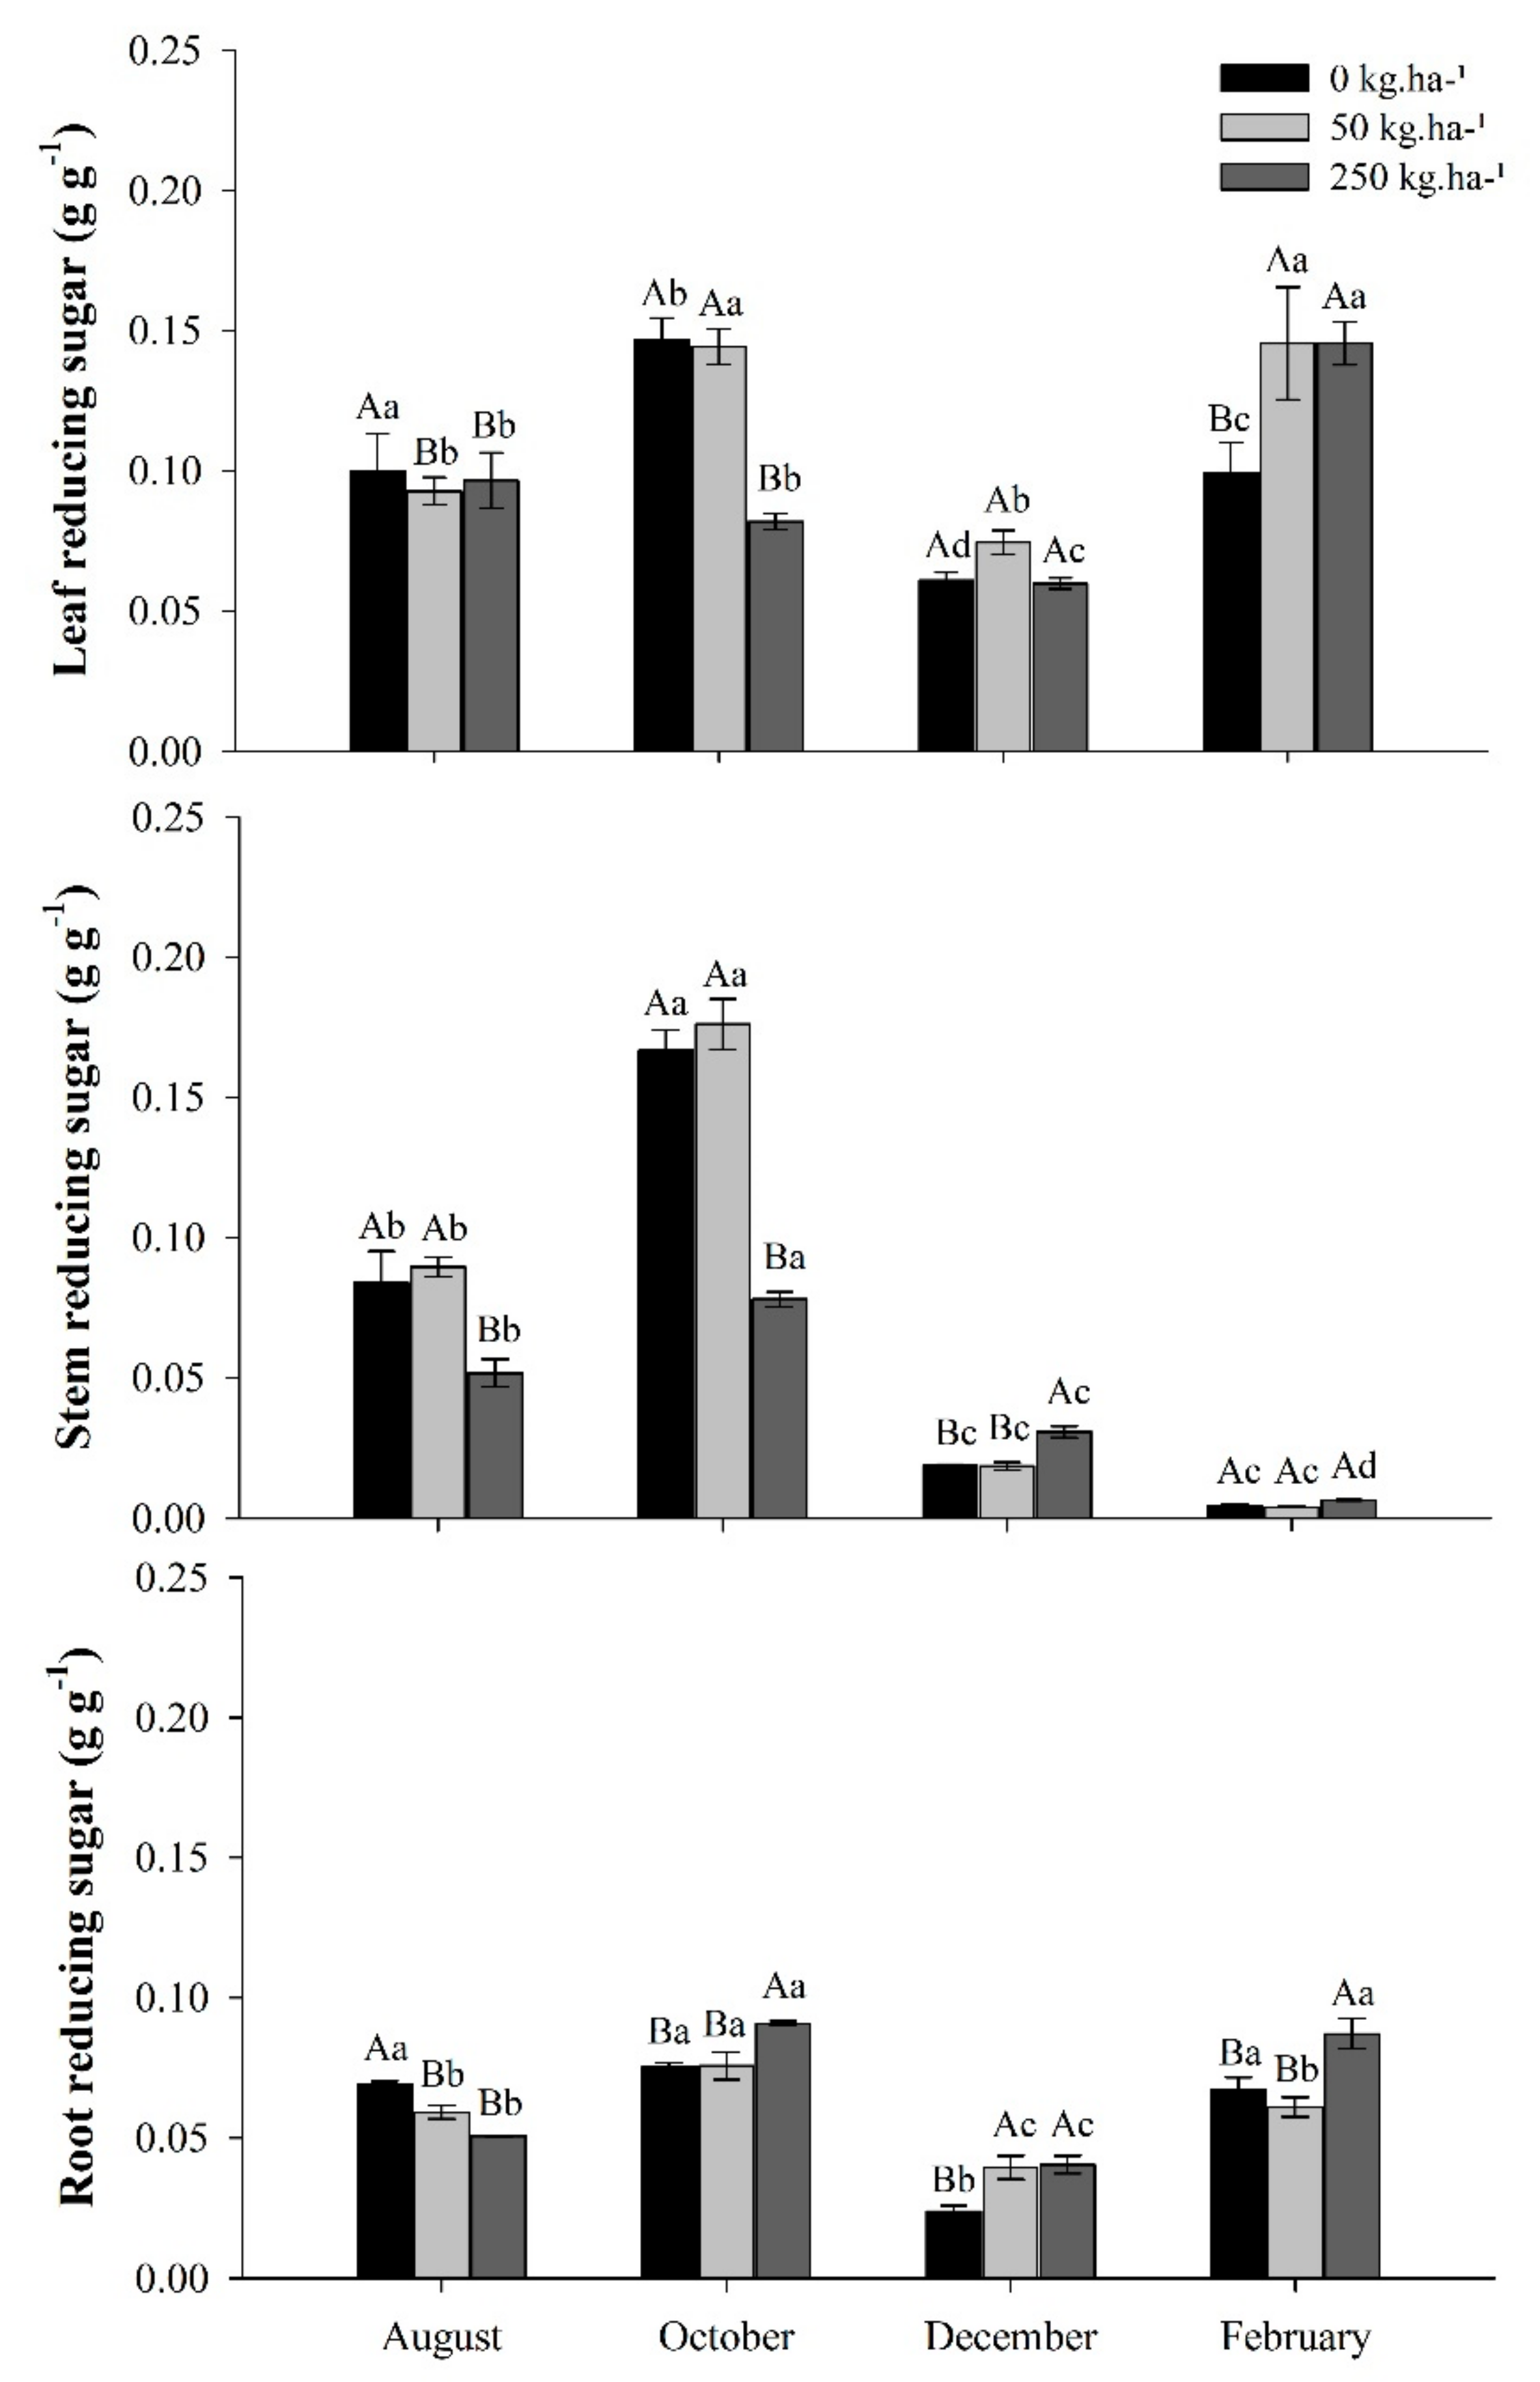
2.3.2. Reducer sugar (RS)
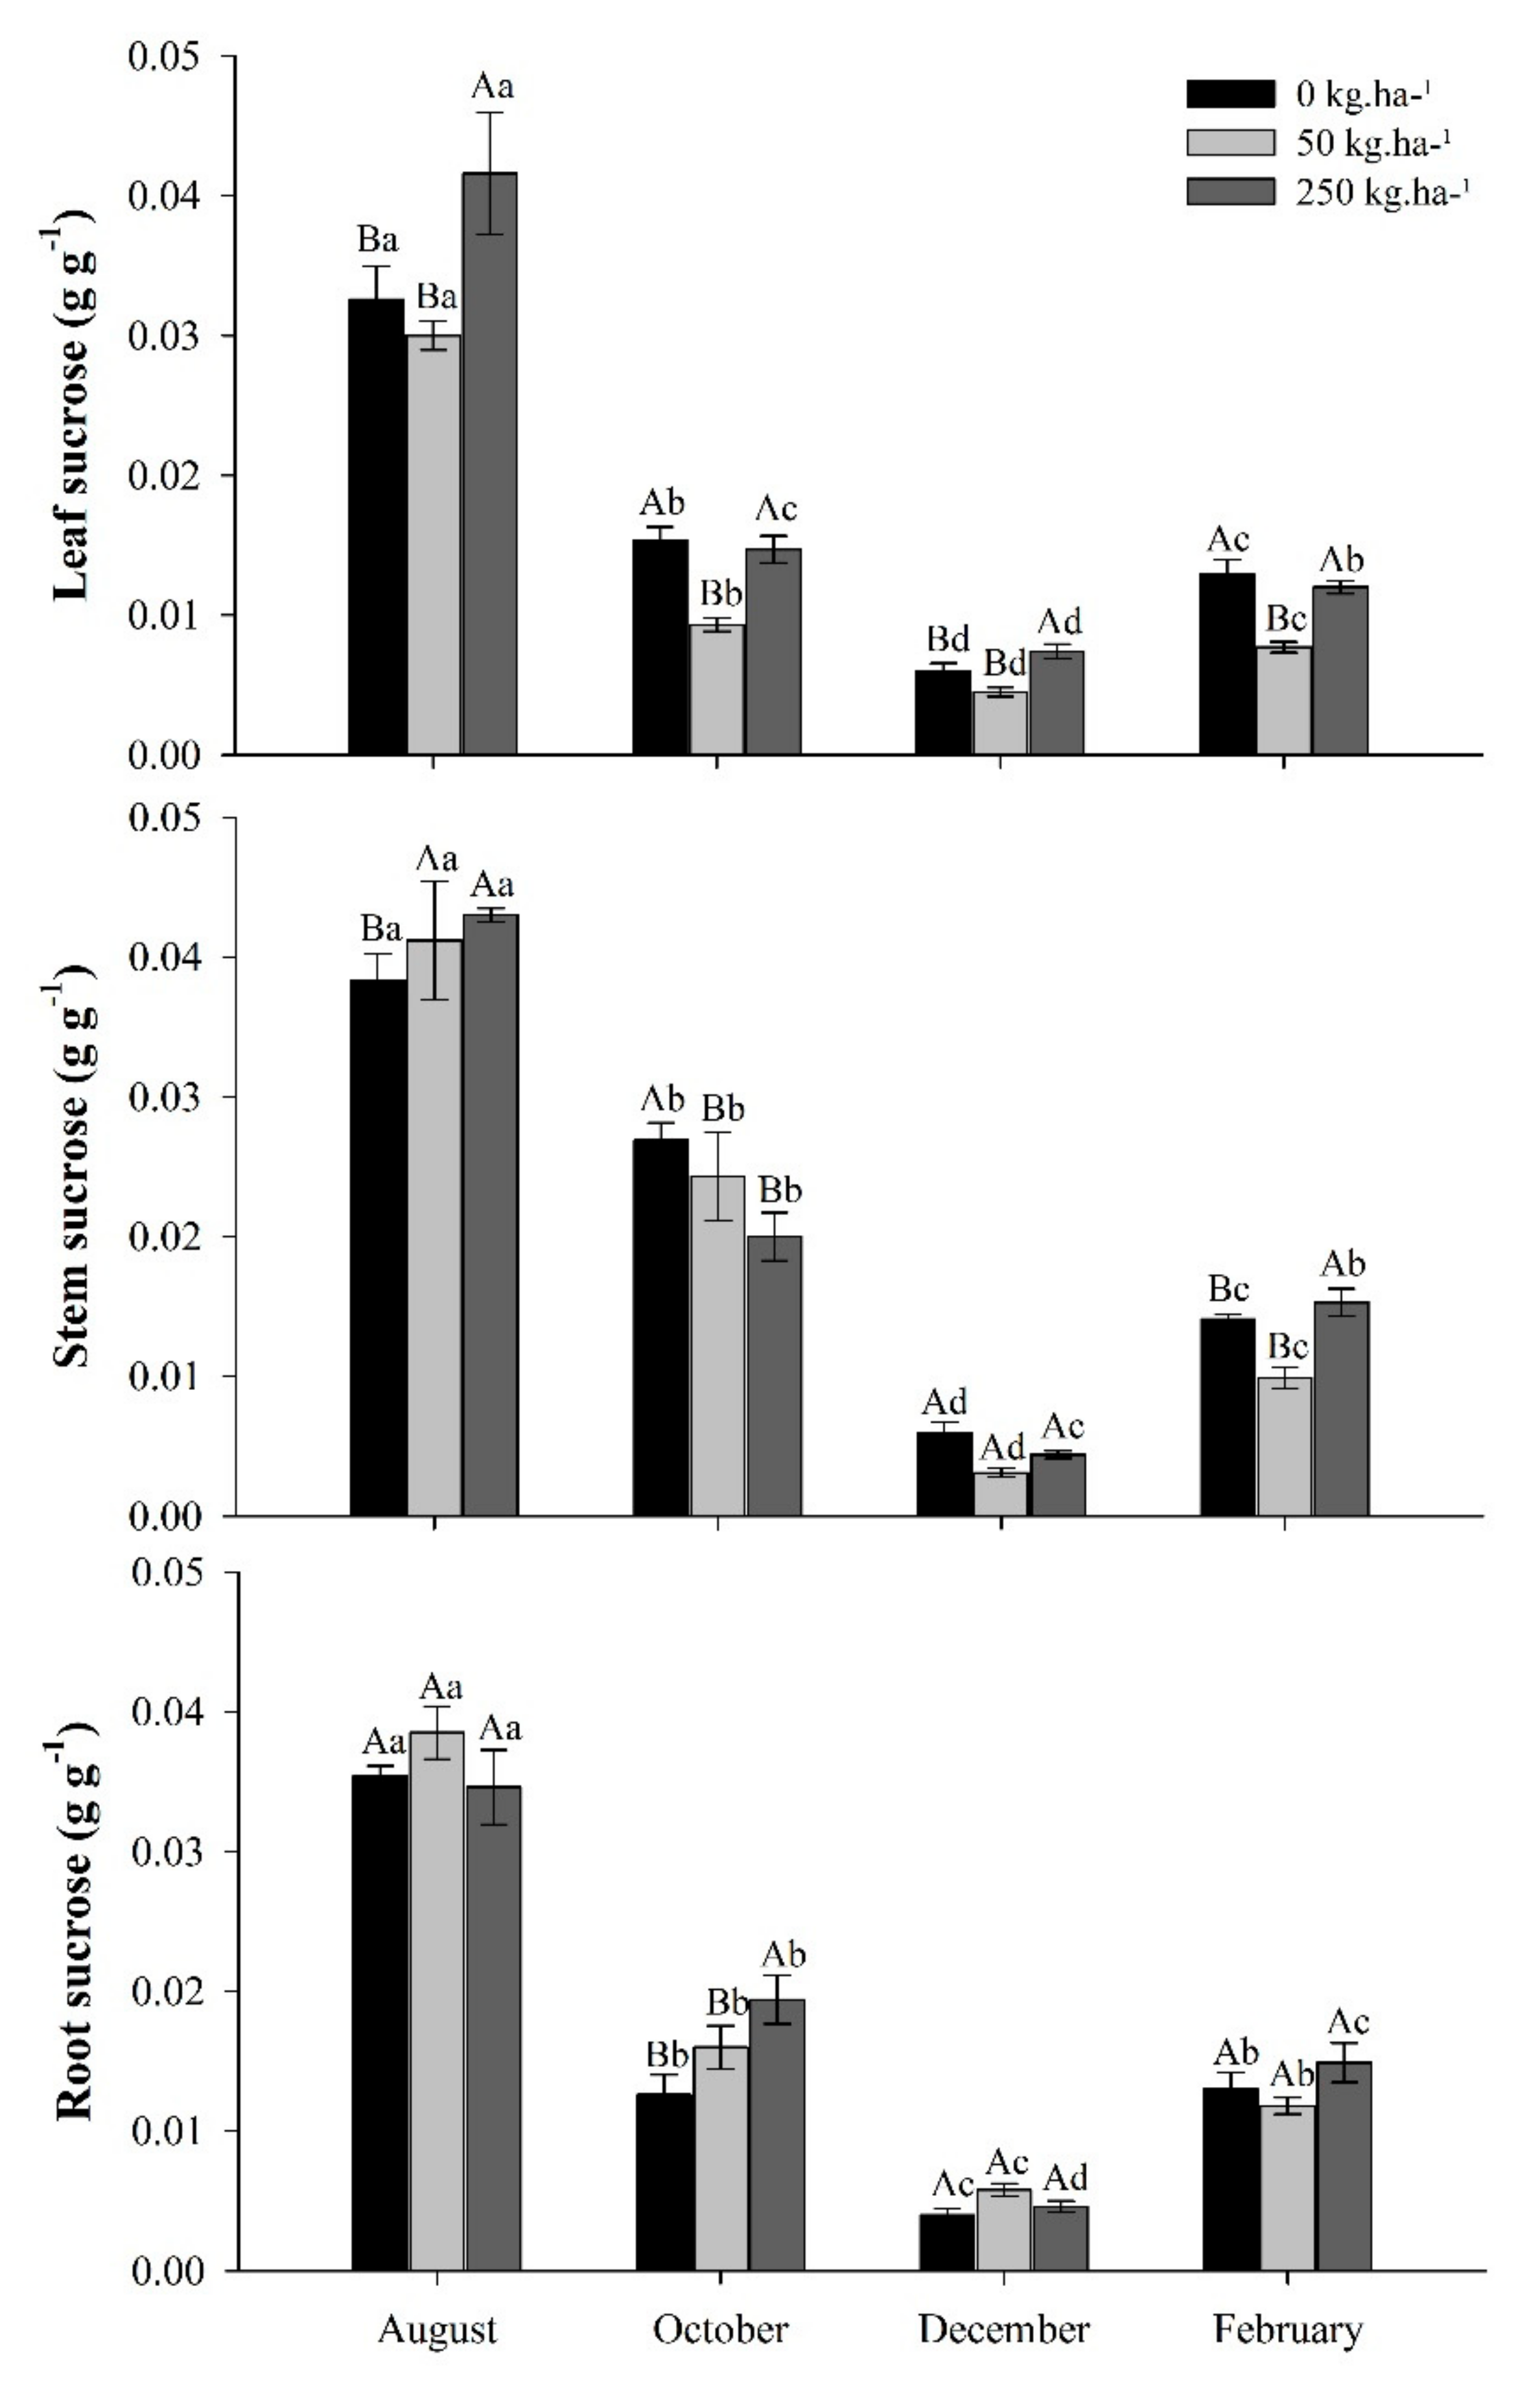
2.3.3. Sucrose
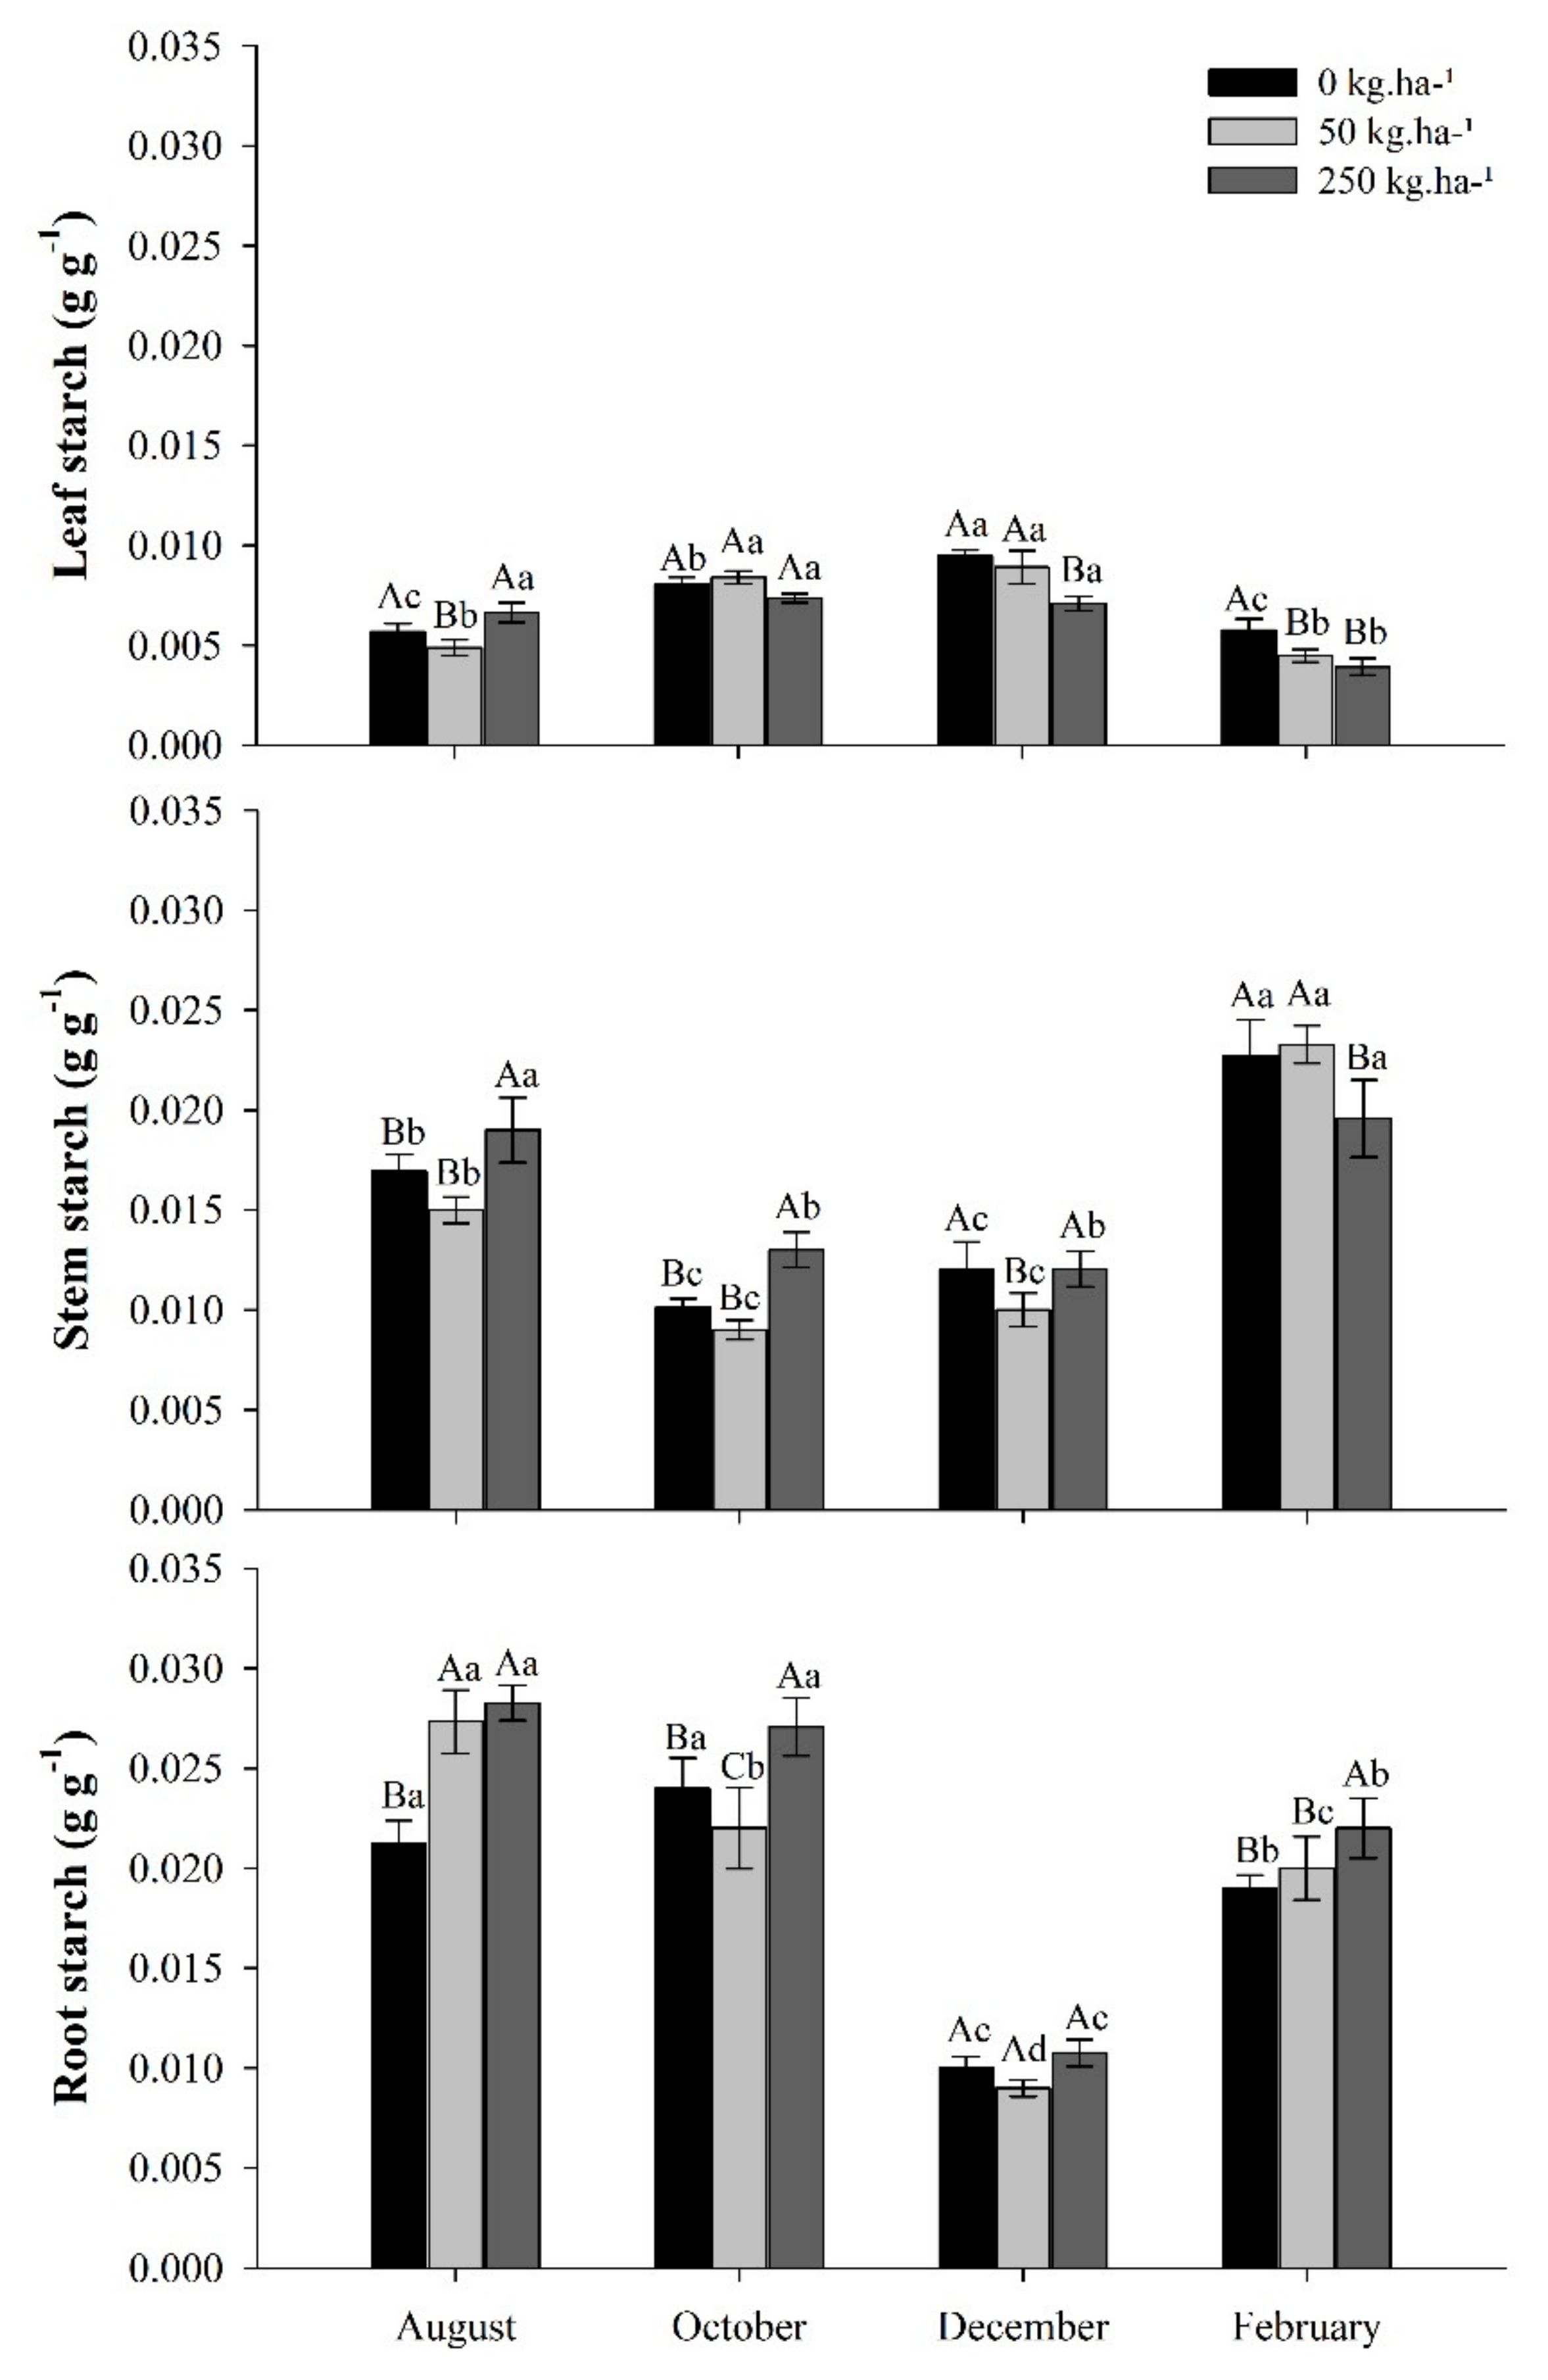
2.3.4. Starch
3. Discussion
3.1. Dry Matter Production in Response to Phosphate Fertilization in the Seasons
3.2. Total Soluble Sugar Concentrations in Response to Phosphate Fertilization in the Seasons
3.3. Reducing Sugar Concentrations in Response to Phosphate Fertilization in the Seasons
3.4. Sucrose Concentrations in Response to Phosphate Fertilization in the Seasons
3.5. Starch Concentrations in Response to Phosphate Fertilization in the Seasons
4. Materials and Methods
4.1. Study Area
4.2. Plant Material Preparation
4.3. Experimental Design and Treatments
4.4. Area Preparation and Conduction Experiment
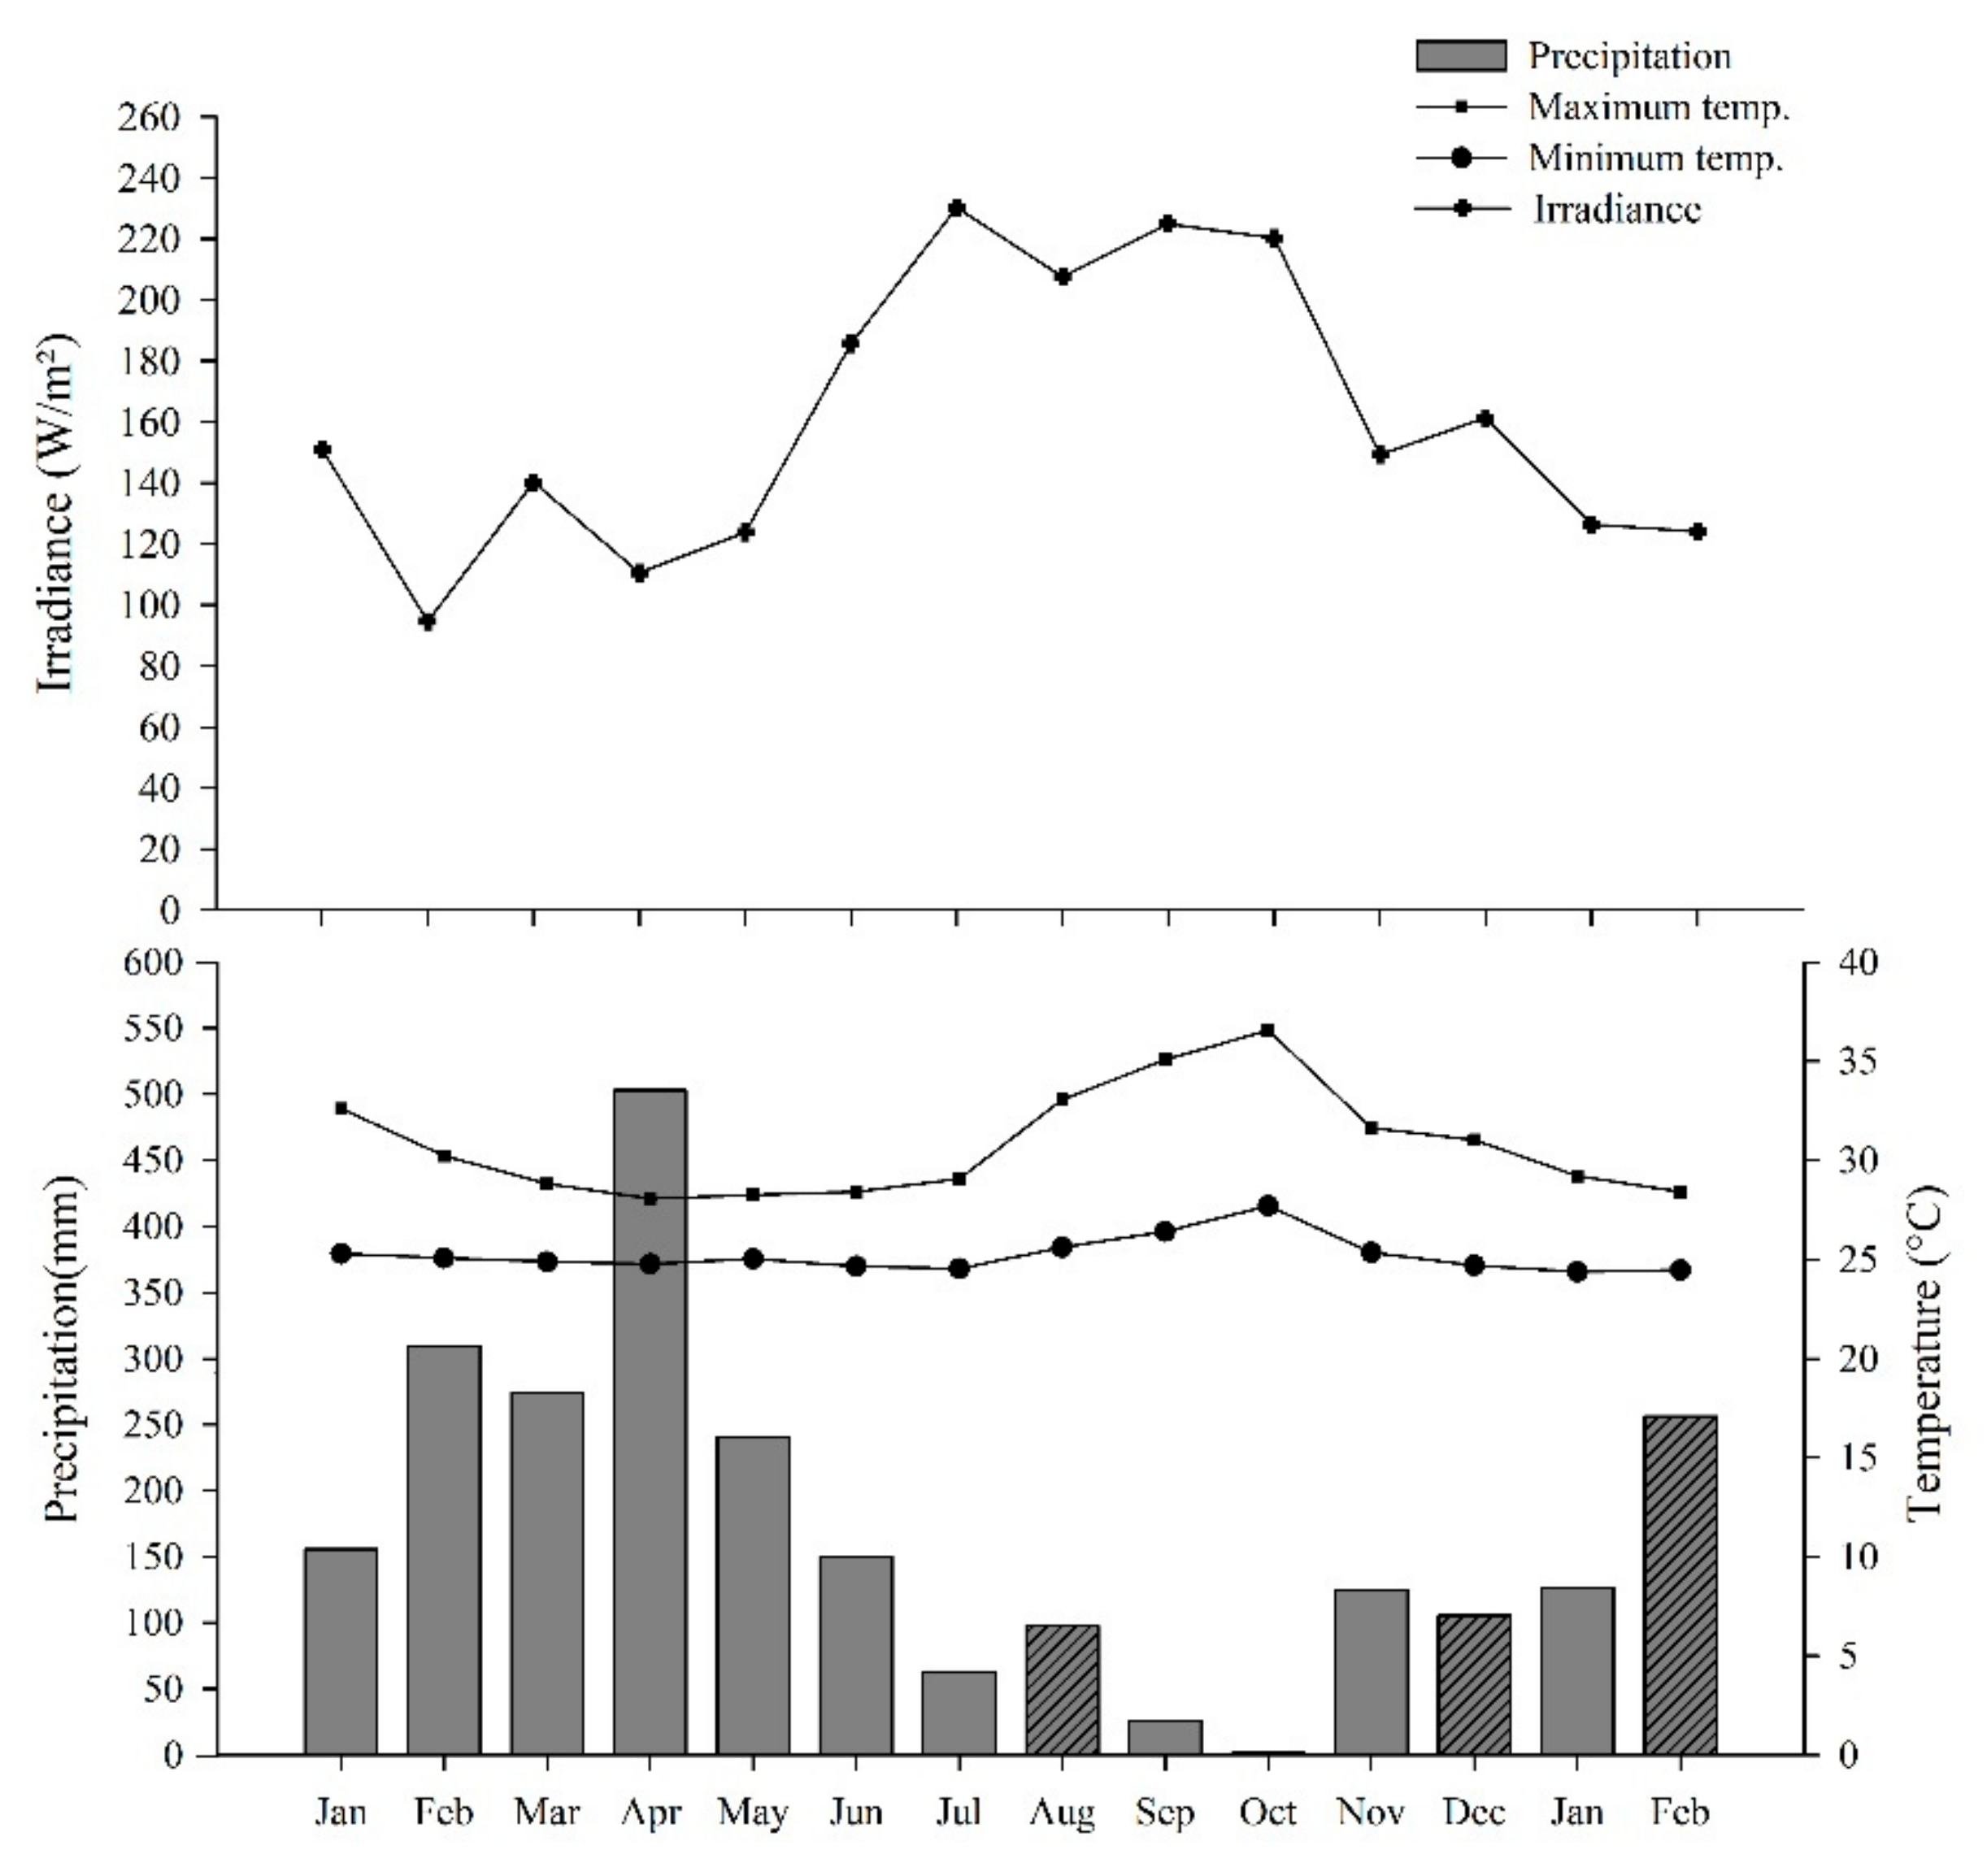
4.5. Climate
4.6. Evaluated Variables
4.6.1. Dry Matter
4.6.2. Phosphorus Content
4.6.3. Carbohydrate Concentration
4.6.4. Data Analysis
5. Conclusions
Author Contributions
Funding
Data Availability Statement
Acknowledgments
Conflicts of Interest
References
- Prescott, C.E.; Grayston, S.J.; Helmisaari, H.S.; Kaštovská, E.; Körner, C.; Lambers, H.; Meier, I.C.; Millard, P.; Ostonen, I. Surplus Carbon Drives Allocation and Plant–Soil Interactions. Trends Ecol. Evol. 2020, 35, 1110–1118. [Google Scholar] [CrossRef] [PubMed]
- Lemoine, R.; La Camera, S.; Atanassova, R.; Dédaldéchamp, F.; Allario, T.; Pourtau, N.; Bonnemain, J.L.; Laloi, M.; Coutos-Thévenot, P.; Maurousset, L.; et al. Source-to-Sink Transport of Sugar and Regulation by Environmental Factors. Front. Plant Sci. 2013, 4, 272. [Google Scholar] [CrossRef] [PubMed] [Green Version]
- Hartmann, H.; Adams, H.D.; Hammond, W.M.; Hoch, G.; Landhäusser, S.M.; Wiley, E.; Zaehle, S. Identifying Differences in Carbohydrate Dynamics of Seedlings and Mature Trees to Improve Carbon Allocation in Models for Trees and Forests. Environ. Exp. Bot. 2018, 152, 7–18. [Google Scholar] [CrossRef]
- Halford, N.G.; Curtis, T.Y.; Muttucumaru, N.; Postles, J.; Mottram, D.S. Sugars in Crop Plants. Ann. Appl. Biol. 2011, 158, 1–25. [Google Scholar] [CrossRef]
- Kruse, J.; Abraham, M.; Amelung, W.; Baum, C.; Bol, R.; Kühn, O.; Lewandowski, H.; Niederberger, J.; Oelmann, Y.; Rüger, C.; et al. Innovative Methods in Soil Phosphorus Research: A Review. J. Plant Nutr. Soil Sci. 2015, 178, 43–88. [Google Scholar] [CrossRef] [Green Version]
- McClain, A.M.; Sharkey, T.D. Triose Phosphate Utilization and beyond: From Photosynthesis to End Product Synthesis. J. Exp. Bot. 2019, 70, 1755–1766. [Google Scholar] [CrossRef]
- Saddhe, A.A.; Manuka, R.; Penna, S. Plant Sugars: Homeostasis and Transport under Abiotic Stress in Plants. Physiol. Plant. 2021, 171, 739–755. [Google Scholar] [CrossRef]
- O’Brien, M.J.; Burslem, D.F.R.P.; Caduff, A.; Tay, J.; Hector, A. Contrasting Nonstructural Carbohydrate Dynamics of Tropical Tree Seedlings under Water Deficit and Variability. New Phytol. 2015, 205, 1083–1094. [Google Scholar] [CrossRef] [Green Version]
- Kong, J.J.; Liu, W.Q.; Huang, F.; Hua, L.; Yu, F.; He, Q.; Su, Y.; Li, J.Y.; Qiu, Q. Spatial Patterns of Non-Structural Carbohydrates in Eucalyptus Urophylla × e. Grandis under Dry-Season Irrigation with Fertilization. Forests 2021, 12, 1049. [Google Scholar] [CrossRef]
- Lourenço, J.N.; Ferreira, L.M.M.; Martins, G.C.; Nascimento, D.G. Produção, Biometria de Frutos e Sementes e Extração Do Óleo de Andiroba (Carapa Guianensis Aublet.) Sob Manejo Comunitário Em Parintins, AM. Embrapa Amaz. Ocident. 2017, 138, 1–36. [Google Scholar]
- Kenfack, D. Resurrection in Carapa (Meliaceae): A Reassessment of Morphological Variation and Species Boundaries Using Multivariate Methods in a Phylogenetic Context. Bot. J. Linn. Soc. 2011, 165, 186–221. [Google Scholar] [CrossRef] [Green Version]
- Fujii, K.; Shibata, M.; Kitajima, K.; Ichie, T.; Kitayama, K.; Turner, B.L. Plant–Soil Interactions Maintain Biodiversity and Functions of Tropical Forest Ecosystems. Ecol. Res. 2018, 33, 149–160. [Google Scholar] [CrossRef]
- Lugli, L.F.; Andersen, K.M.; Aragão, L.E.O.C.; Cordeiro, A.L.; Cunha, H.F.V.; Fuchslueger, L.; Meir, P.; Mercado, L.M.; Oblitas, E.; Quesada, C.A.; et al. Multiple Phosphorus Acquisition Strategies Adopted by Fine Roots in Low-Fertility Soils in Central Amazonia. Plant Soil 2020, 450, 49–63. [Google Scholar] [CrossRef] [Green Version]
- Baker, A.; Ceasar, S.A.; Palmer, A.J.; Paterson, J.B.; Qi, W.; Muench, S.P.; Baldwin, S.A. Replace, Reuse, Recycle: Improving the Sustainable Use of Phosphorus by Plants. J. Exp. Bot. 2015, 66, 3523–3540. [Google Scholar] [CrossRef] [Green Version]
- Zhang, S.; Tang, D.; Korpelainen, H.; Li, C. Metabolic and Physiological Analyses Reveal That Populus Cathayana Males Adopt an Energy-Saving Strategy to Cope with Phosphorus Deficiency. Tree Physiol. 2019, 39, 1630–1645. [Google Scholar] [CrossRef] [Green Version]
- Pantigoso, H.A.; Yuan, J.; He, Y.; Guo, Q.; Vollmer, C.; Vivanco, J.M. Role of Root Exudates on Assimilation of Phosphorus in Young and Old Arabidopsis Thaliana Plants. PLoS ONE 2020, 15, e0234216. [Google Scholar] [CrossRef]
- Balemi, T.; Negisho, K. Management of Soil Phosphorus and Plant Adaptation Mechanisms to Phosphorus Stress for Sustainable Crop Production: A Review. J. Soil Sci. Plant Nutr. 2012, 12, 547–561. [Google Scholar] [CrossRef] [Green Version]
- Veneklaas, E.J.; Lambers, H.; Bragg, J.; Finnegan, P.M.; Lovelock, C.E.; Plaxton, W.C.; Price, C.A.; Scheible, W.R.; Shane, M.W.; White, P.J.; et al. Opportunities for Improving Phosphorus-Use Efficiency in Crop Plants. New Phytol. 2012, 195, 306–320. [Google Scholar] [CrossRef]
- Yang, S.Y.; Huang, T.K.; Kuo, H.F.; Chiou, T.J. Role of Vacuoles in Phosphorus Storage and Remobilization. J. Exp. Bot. 2017, 68, 3045–3055. [Google Scholar] [CrossRef] [Green Version]
- Seabra, C.E.B.C.; Osiecka, A.; Tucci, C.A.F.; Minogue, P.J.; Pereira, B.F.F.; Andersen, P.C. Influence of Phosphorus Limitations on the Growth, Nutrient Partitioning and Physiology of Mahogany (Swietenia Macrophylla King) Seedlings. J. Plant Nutr. 2018, 41, 358–370. [Google Scholar] [CrossRef]
- Ostertag, R. Foliar Nitrogen and Phosphorus Accumulation Responses after Fertilization: An Example from Nutrient-Limited Hawaiian Forests. Plant Soil 2010, 334, 85–98. [Google Scholar] [CrossRef]
- Turner, B.L.; Brenes-Arguedas, T.; Condit, R. Pervasive Phosphorus Limitation of Tree Species but Not Communities in Tropical Forests. Nature 2018, 555, 367–370. [Google Scholar] [CrossRef] [PubMed]
- Williams, A.; George, S.; Birt, H.W.G.; Daws, M.I.; Tibbett, M. Sensitivity of Seedling Growth to Phosphorus Supply in Six Tree Species of the Australian Great Western Woodlands. Aust. J. Bot. 2019, 67, 390–396. [Google Scholar] [CrossRef]
- Mao, Q.; Chen, H.; Gurmesa, G.A.; Gundersen, P.; Ellsworth, D.S.; Gilliam, F.S.; Wang, C.; Zhu, F.; Ye, Q.; Mo, J.; et al. Negative Effects of Long-Term Phosphorus Additions on Understory Plants in a Primary Tropical Forest. Sci. Total Environ. 2021, 798, 149306. [Google Scholar] [CrossRef]
- Mousavi, S.R. Zinc in Crop Production and Interaction with Phosphorus. Aust. J. Basic Appl. Sci. 2011, 5, 1503–1509. [Google Scholar]
- Zhang, W.; Liu, D.Y.; Li, C.; Chen, X.P.; Zou, C.Q. Accumulation, Partitioning, and Bioavailability of Micronutrients in Summer Maize as Affected by Phosphorus Supply. Eur. J. Agron. 2017, 86, 48–59. [Google Scholar] [CrossRef] [Green Version]
- Xie, X.; Hu, W.; Fan, X.; Chen, H.; Tang, M. Interactions Between Phosphorus, Zinc, and Iron Homeostasis in Nonmycorrhizal and Mycorrhizal Plants. Front. Plant Sci. 2019, 10, 1–15. [Google Scholar] [CrossRef]
- Fan, X.; Zhou, X.; Chen, H.; Tang, M.; Xie, X. Cross-Talks Between Macro- and Micronutrient Uptake and Signaling in Plants. Front. Plant Sci. 2021, 12, 663477. [Google Scholar] [CrossRef]
- Miguel, M.A.; Postma, J.A.; Lynch, J.P. Phene Synergism between Root Hair Length and Basal Root Growth Angle for Phosphorus Acquisition. Plant Physiol. 2015, 167, 1430–1439. [Google Scholar] [CrossRef]
- Yu, M.; Hochholdinger, F.; Li, C. Plasticity of Lateral Root Branching in Maize. Front. Plant Sci. 2019, 10, 363. [Google Scholar] [CrossRef]
- Leonel, M.; Bolfarini, A.C.B.; Rodrigues da Silva, M.J.; Souza, J.M.A.; Leonel, S. Banana Fruits with High Content of Resistant Starch: Effect of Genotypes and Phosphorus Fertilization. Int. J. Biol. Macromol. 2020, 150, 1020–1026. [Google Scholar] [CrossRef]
- Johnston, A.E.; Poulton, P.R.; Fixen, P.E.; Curtin, D. Phosphorus. In Advances in Agronomy; Elsevier: Amsterdam, The Netherlands, 2014; Volume 123, pp. 65–121. [Google Scholar]
- Wang, Y.; Tang, J.; Zhang, H.; Schroder, J.L.; He, Y. Phosphorus Availability and Sorption as Affected by Long-Term Fertilization. Agron. J. 2014, 106, 1583–1592. [Google Scholar] [CrossRef]
- Casaroli, D.; Sérvulo, A.C.O.; Vellame, L.M.; Alves Júnior, J.; Evangelista, A.W.P.; Mesquita, M.; Flores, R.A. Transpiration and Growth of Young African Mahogany Plants Subject to Different Water Regimes. Int. J. Biometeorol. 2020, 64, 1–13. [Google Scholar] [CrossRef]
- Egea, G.; Verhoef, A.; Vidale, P.L. Towards an Improved and More Flexible Representation of Water Stress in Coupled Photosynthesis-Stomatal Conductance Models. Agric. For. Meteorol. 2011, 151, 1370–1384. [Google Scholar] [CrossRef]
- Nóia Júnior, R.D.S.; Amaral, G.C.; Pezzopane, J.E.M.; Fonseca, M.D.S.; Câmara da Silva, A.P.; Xavier, T.M.T. Ecophysiological Acclimatization to Cyclic Water Stress in Eucalyptus. J. For. Res. 2020, 31, 797–806. [Google Scholar] [CrossRef]
- Gonçalves, J.F.D.C.; Silva, C.E.M.D.; Guimarães, D.G. Fotossíntese e Potencial Hídrico Foliar de Plantas Jovens de Andiroba Submetidas à Deficiência Hídrica e à Reidratação. Pesqui. Agropecu. Bras. 2009, 44, 8–14. [Google Scholar] [CrossRef] [Green Version]
- De Oliveira, M.F.; Marenco, R.A. Gas Exchange, Biomass Allocation and Water-Use Efficiency in Response to Elevated CO 2 and Drought in Andiroba (Carapa Surinamensis, Meliaceae). IForest 2019, 12, 61–68. [Google Scholar] [CrossRef]
- Piper, F.I.; Fajardo, A.; Hoch, G. Single-Provenance Mature Conifers Show Higher Non-Structural Carbohydrate Storage and Reduced Growth in a Drier Location. Tree Physiol. 2017, 37, 1001–1010. [Google Scholar] [CrossRef]
- Ozturk, M.; Turkyilmaz Unal, B.; García-Caparrós, P.; Khursheed, A.; Gul, A.; Hasanuzzaman, M. Osmoregulation and Its Actions during the Drought Stress in Plants. Physiol. Plant. 2021, 172, 1321–1335. [Google Scholar] [CrossRef]
- Furze, M.E.; Huggett, B.A.; Aubrecht, D.M.; Stolz, C.D.; Carbone, M.S.; Richardson, A.D. Whole-Tree Nonstructural Carbohydrate Storage and Seasonal Dynamics in Five Temperate Species. New Phytol. 2019, 221, 1466–1477. [Google Scholar] [CrossRef]
- Sala, A.; Woodruff, D.R.; Meinzer, F.C. Carbon Dynamics in Trees: Feast or Famine? Tree Physiol. 2012, 32, 764–775. [Google Scholar] [CrossRef] [Green Version]
- O’Brien, M.J.; Leuzinger, S.; Philipson, C.D.; Tay, J.; Hector, A. Drought Survival of Tropical Tree Seedlings Enhanced by Non-Structural Carbohydrate Levels. Nat. Clim. Chang. 2014, 4, 710–714. [Google Scholar] [CrossRef]
- O’Brien, M.J.; Valtat, A.; Abiven, S.; Studer, M.S.; Ong, R.; Schmid, B. The Role of Soluble Sugars during Drought in Tropical Tree Seedlings with Contrasting Tolerances. J. Plant Ecol. 2020, 13, 389–397. [Google Scholar] [CrossRef]
- Li, N.; He, N.; Yu, G.; Wang, Q.; Sun, J. Leaf Non-Structural Carbohydrates Regulated by Plant Functional Groups and Climate: Evidences from a Tropical to Cold-Temperate Forest Transect. Ecol. Indic. 2016, 62, 22–31. [Google Scholar] [CrossRef]
- Sapes, G.; Demaree, P.; Lekberg, Y.; Sala, A. Plant Carbohydrate Depletion Impairs Water Relations and Spreads via Ectomycorrhizal Networks. New Phytol. 2021, 229, 3172–3183. [Google Scholar] [CrossRef]
- Tomasella, M.; Petrussa, E.; Petruzzellis, F.; Nardini, A.; Casolo, V. The Possible Role of Non-structural Carbohydrates in the Regulation of Tree Hydraulics. Int. J. Mol. Sci. 2020, 21, 144. [Google Scholar] [CrossRef] [Green Version]
- Singh, M.; Kumar, J.; Singh, S.; Singh, V.P.; Prasad, S.M. Roles of Osmoprotectants in Improving Salinity and Drought Tolerance in Plants: A Review. Rev. Environ. Sci. Biotechnol. 2015, 14, 407–426. [Google Scholar] [CrossRef]
- Yang, J.; Zhang, J.; Li, C.; Zhang, Z.; Ma, F.; Li, M. Response of Sugar Metabolism in Apple Leaves Subjected to Short-Term Drought Stress. Plant Physiol. Biochem. 2019, 141, 164–171. [Google Scholar] [CrossRef]
- Nio, S.A.; Cawthray, G.R.; Wade, L.J.; Colmer, T.D. Pattern of Solutes Accumulated during Leaf Osmotic Adjustment as Related to Duration of Water Deficit for Wheat at the Reproductive Stage. Plant Physiol. Biochem. 2011, 49, 1126–1137. [Google Scholar] [CrossRef]
- Königshofer, H.; Löppert, H.G. Regulation of Invertase Activity in Different Root Zones of Wheat (Triticum Aestivum L.) Seedlings in the Course of Osmotic Adjustment under Water Deficit Conditions. J. Plant Physiol. 2015, 183, 130–137. [Google Scholar] [CrossRef] [PubMed]
- Silber, A.; Ben-Jaacov, J.; Ackerman, A.; Bar-Tal, A.; Levkovitch, I.; Matsevitz-Yosef, T.; Swartzberg, D.; Riov, J.; Granot, D. Interrelationship between Phosphorus Toxicity and Sugar Metabolism in Verticordia plumosa L. Plant Soil 2002, 245, 249–260. [Google Scholar] [CrossRef]
- Claeyssen, É.; Rivoal, J. Isozymes of Plant Hexokinase: Occurrence, Properties and Functions. Phytochemistry 2007, 68, 709–731. [Google Scholar] [CrossRef] [PubMed]
- Chea, L.; Pfeiffer, B.; Schneider, D.; Daniel, R.; Pawelzik, E.; Naumann, M. Morphological and Metabolite Responses of Potatoes under Various Phosphorus Levels and Their Amelioration by Plant Growth-Promoting Rhizobacteria. Int. J. Mol. Sci. 2021, 22, 5162. [Google Scholar] [CrossRef]
- García-Caparrós, P.; Lao, M.T.; Preciado-Rangel, P.; Sanchez, E. Phosphorus and Carbohydrate Metabolism in Green Bean Plants Subjected to Increasing Phosphorus Concentration in the Nutrient Solution. Agronomy 2021, 11, 245. [Google Scholar] [CrossRef]
- Hernández, I.; Munné-Bosch, S. Linking Phosphorus Availability with Photo-Oxidative Stress in Plants. J. Exp. Bot. 2015, 66, 2889–2900. [Google Scholar] [CrossRef] [Green Version]
- Zhang, G.; Zhang, L.; Wen, D. Photosynthesis of Subtropical Forest Species from Different Successional Status in Relation to Foliar Nutrients and Phosphorus Fractions. Sci. Rep. 2018, 8, 1–12. [Google Scholar] [CrossRef]
- Mathan, J.; Singh, A.; Ranjan, A. Sucrose Transport in Response to Drought and Salt Stress Involves ABA-Mediated Induction of OsSWEET13 and OsSWEET15 in Rice. Physiol. Plant. 2021, 171, 620–637. [Google Scholar] [CrossRef]
- Yoon, J.; Cho, L.H.; Tun, W.; Jeon, J.S.; An, G. Sucrose Signaling in Higher Plants. Plant Sci. 2021, 302, 110703. [Google Scholar] [CrossRef]
- Fu, J.; Huang, B.; Fry, J. Osmotic Potential, Sucrose Level, and Activity of Sucrose Metabolic Enzymees in Tall Fescue in Response to Deficit Irrigation. J. Am. Soc. Hortic. Sci. 2010, 135, 506–510. [Google Scholar] [CrossRef]
- Guo, X.; Peng, C.; Li, T.; Huang, J.; Song, H.; Zhu, Q.; Wang, M. The Effects of Drought and Re-Watering on Non-Structural Carbohydrates of Pinus Tabulaeformis Seedlings. Biology 2021, 10, 281. [Google Scholar] [CrossRef]
- Loka, D.A.; Oosterhuis, D.M.; Baxevanos, D.; Noulas, C.; Hu, W. Single and Combined Effects of Heat and Water Stress and Recovery on Cotton (Gossypium Hirsutum L.) Leaf Physiology and Sucrose Metabolism. Plant Physiol. Biochem. 2020, 148, 166–179. [Google Scholar] [CrossRef]
- Darko, E.; Végh, B.; Khalil, R.; Marček, T.; Szalai, G.; Pál, M.; Janda, T. Metabolic Responses of Wheat Seedlings to Osmotic Stress Induced by Various Osmolytes under Iso-Osmotic Conditions. PLoS ONE 2019, 14, e0226151. [Google Scholar] [CrossRef]
- Thalmann, M.; Santelia, D. Starch as a Determinant of Plant Fitness under Abiotic Stress. New Phytol. 2017, 214, 943–951. [Google Scholar] [CrossRef] [Green Version]
- MacNeill, G.J.; Mehrpouyan, S.; Minow, M.A.A.; Patterson, J.A.; Tetlow, I.J.; Emes, M.J. Starch as a Source, Starch as a Sink: The Bifunctional Role of Starch in Carbon Allocation. J. Exp. Bot. 2017, 68, 4433–4453. [Google Scholar] [CrossRef] [PubMed]
- Deng, X.; Xiao, W.; Shi, Z.; Zeng, L.; Lei, L. Combined Effects of Drought and Shading on Growth and Non-Structural Carbohydrates in Pinus Massoniana Lamb. Seedlings. Forests 2019, 11, 18. [Google Scholar] [CrossRef] [Green Version]
- Zhang, P.; Zhou, X.; Fu, Y.; Shao, J.; Zhou, L.; Li, S.; Zhou, G.; Hu, Z.; Hu, J.; Bai, S.H.; et al. Differential Effects of Drought on Nonstructural Carbohydrate Storage in Seedlings and Mature Trees of Four Species in a Subtropical Forest. For. Ecol. Manag. 2020, 469, 118159. [Google Scholar] [CrossRef]
- Raij, B.V.; Andrade, J.C.; Cantarella, H.; Quaggio, J.A. Análise Química para Avaliação da Fertilidade de Solos Tropicais; Instituto Agronômico: Campinas, Brazil, 2001; pp. 173–213. ISBN 9788585564056. [Google Scholar]
- Teixeira, P.C.; Donagemma, G.K.; Fontana, A.; Teixeira, W.G. Manual de Métodos de Análise de Solo, 3rd ed.; Embrapa: Brasília, Brazil, 2017; pp. 95–116. ISBN 9788570357717. [Google Scholar]
- Alvares, C.A.; Stape, J.L.; Sentelhas, P.C.; Gonçalvez, J.L.D.M.; Sparovek, G. Koppen’s Climate Classification Map for Brazil. Meteorol. Zeitschrift 2014, 22, 711–728. [Google Scholar] [CrossRef]
- Dos Santos, G.P.; Almeida, R.M.; da Silva Moura, E.R.; de Oliveira, L.L. Sensação Térmica Urbana Em Área Residencial Planejada No Município de Santarém—Pará, Amazônia, Brasil. Rev. Bras. Geogr. Física 2021, 14, 1333–1351. [Google Scholar] [CrossRef]
- Lola, A.C.; Uchoa, P.W.; Silva, J.; Cunha, A.C.; Feitosa, J.R.P. Variações Termo-Higrométricas e Influências de Processo de Expansão Urbana Em Cidade Equatorial de Médio Porte. Brazilian Geogr. J. Geosci. Humanit. Res. Mediu. 2013, 4, 615–632. [Google Scholar]
- NASA Power Data Access Viewer. Available online: https://power.larc.nasa.gov/data-access-viewer/ (accessed on 3 February 2022).
- INMET—Instituto Nacional de Meteorologia. Banco de Dados Meteorológicos Do INMET. Available online: https://bdmep.inmet.gov.br/ (accessed on 3 February 2022).
- da Silva, F.C. Manual de Análises Químicas de Solos, Plantas e Fertilizantes, 2nd ed.; Embrapa Informação Tecnológica: Brasília, Brazil, 2009. [Google Scholar]
- Van Handel, E. Direct Microdetermination of Sucrose. Anal. Biochem. 1968, 22, 280–283. [Google Scholar] [CrossRef]
- Yemm, E.W.; Willis, A. The Estimation of Carbohydrates in Plant Extracts by Anthrone. Biochem. J. 1954, 57, 508–514. [Google Scholar] [CrossRef] [Green Version]
- Miller, G.L. Use of Dinitrosalicylic Acid Reagent for Determination of Reducing Sugar. Anal. Chem. 1959, 31, 426–428. [Google Scholar] [CrossRef]
- Ferreira, D.F. Sisvar: A Computer Statistical Analysis System. Ciência e Agrotecnologia 2011, 35, 1039–1042. [Google Scholar] [CrossRef] [Green Version]


| Chemical Analysis | ||||||||||
|---|---|---|---|---|---|---|---|---|---|---|
| MO | P | K | Ca | Mg | H + Al | CTC (t) | SB | m | V | pH |
| g kg−1 | mg dm−3 | cmolc dm−3 | % | H2O | ||||||
| 0.9 | 6 | 28 | 0.5 | 0.3 | 5.1 | 1.7 | 0.9 | 48.3 | 14.8 | 4.3 |
| Granulometry | ||||||||||
| Total sand | Silt | Clay | ||||||||
| g kg−1 | ||||||||||
| 278 | 146 | 576 | ||||||||
Publisher’s Note: MDPI stays neutral with regard to jurisdictional claims in published maps and institutional affiliations. |
© 2022 by the authors. Licensee MDPI, Basel, Switzerland. This article is an open access article distributed under the terms and conditions of the Creative Commons Attribution (CC BY) license (https://creativecommons.org/licenses/by/4.0/).
Share and Cite
Peleja, V.L.; Peleja, P.L.; Lara, T.S.; Tribuzy, E.S.; de Moura, J.M.S. Seasonality and Phosphate Fertilization in Carbohydrates Storage: Carapa guianensis Aubl. Seedlings Responses. Plants 2022, 11, 1956. https://doi.org/10.3390/plants11151956
Peleja VL, Peleja PL, Lara TS, Tribuzy ES, de Moura JMS. Seasonality and Phosphate Fertilization in Carbohydrates Storage: Carapa guianensis Aubl. Seedlings Responses. Plants. 2022; 11(15):1956. https://doi.org/10.3390/plants11151956
Chicago/Turabian StylePeleja, Vanessa Leão, Poliana Leão Peleja, Túlio Silva Lara, Edgard Siza Tribuzy, and José Mauro Sousa de Moura. 2022. "Seasonality and Phosphate Fertilization in Carbohydrates Storage: Carapa guianensis Aubl. Seedlings Responses" Plants 11, no. 15: 1956. https://doi.org/10.3390/plants11151956