
Different LED Light Wavelengths and Photosynthetic Photon Flux Density Effect on Colletotrichum acutatum Growth

 ,
, 
 and
and
Abstract
:1. Introduction
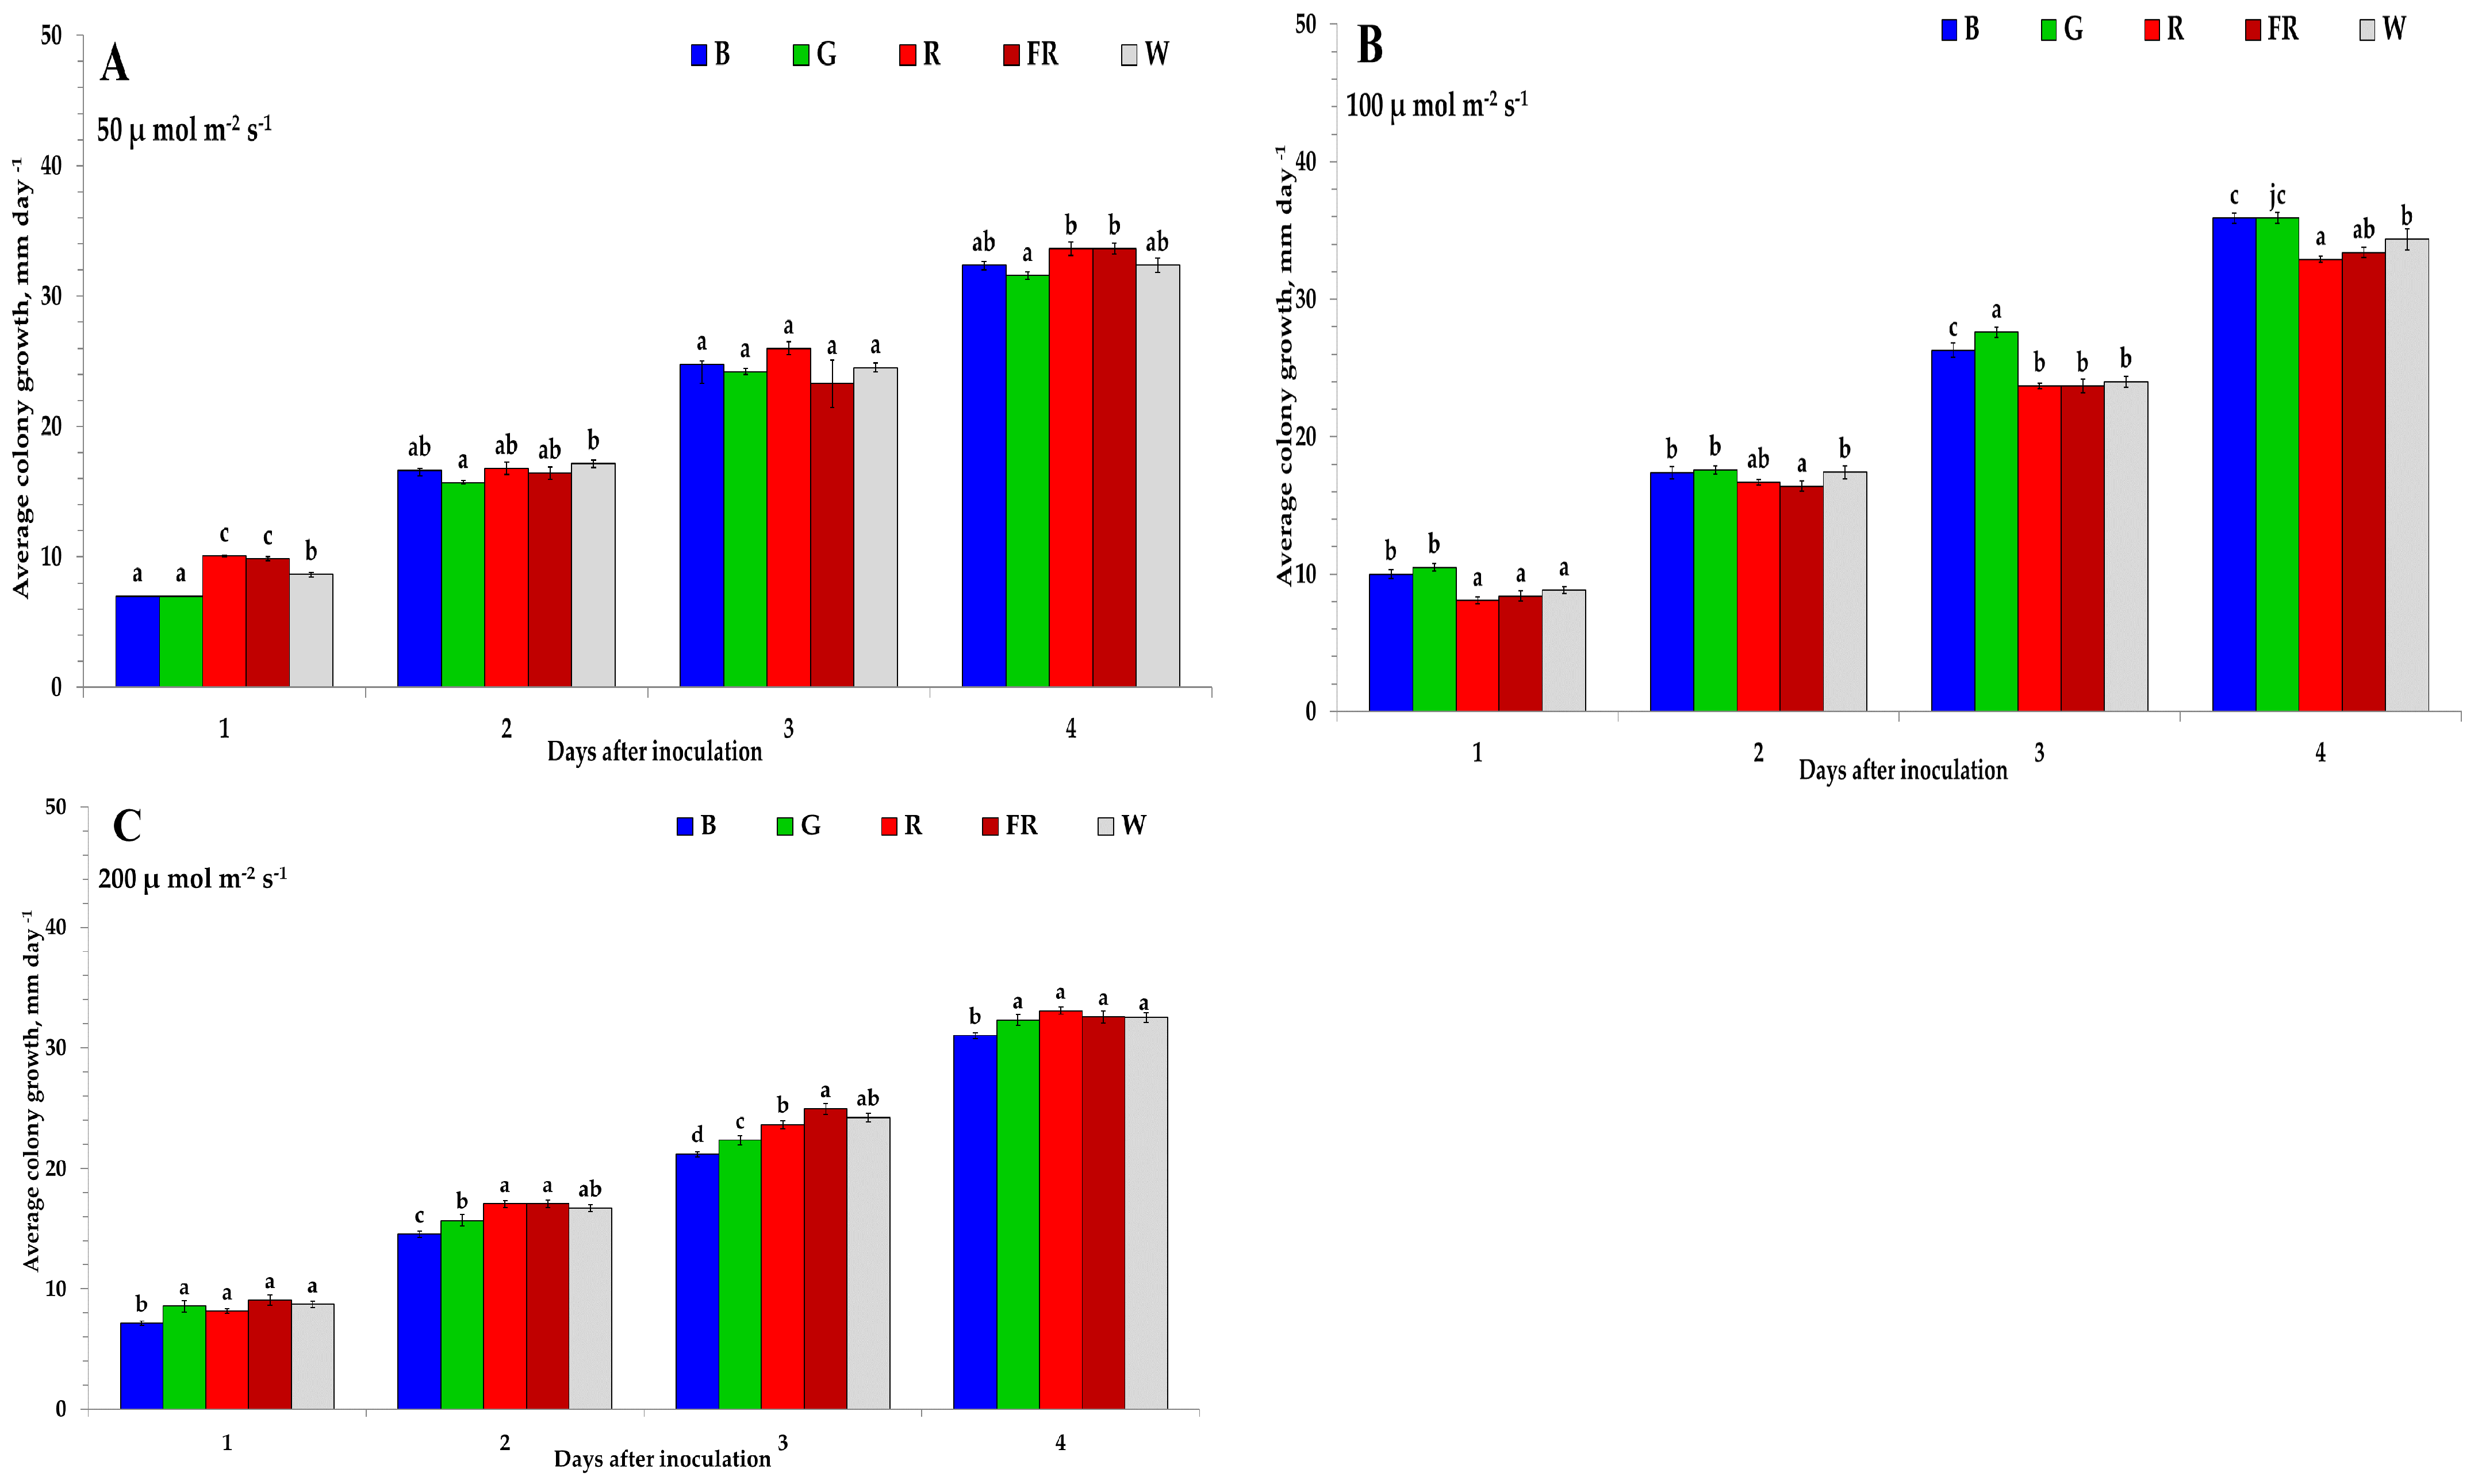
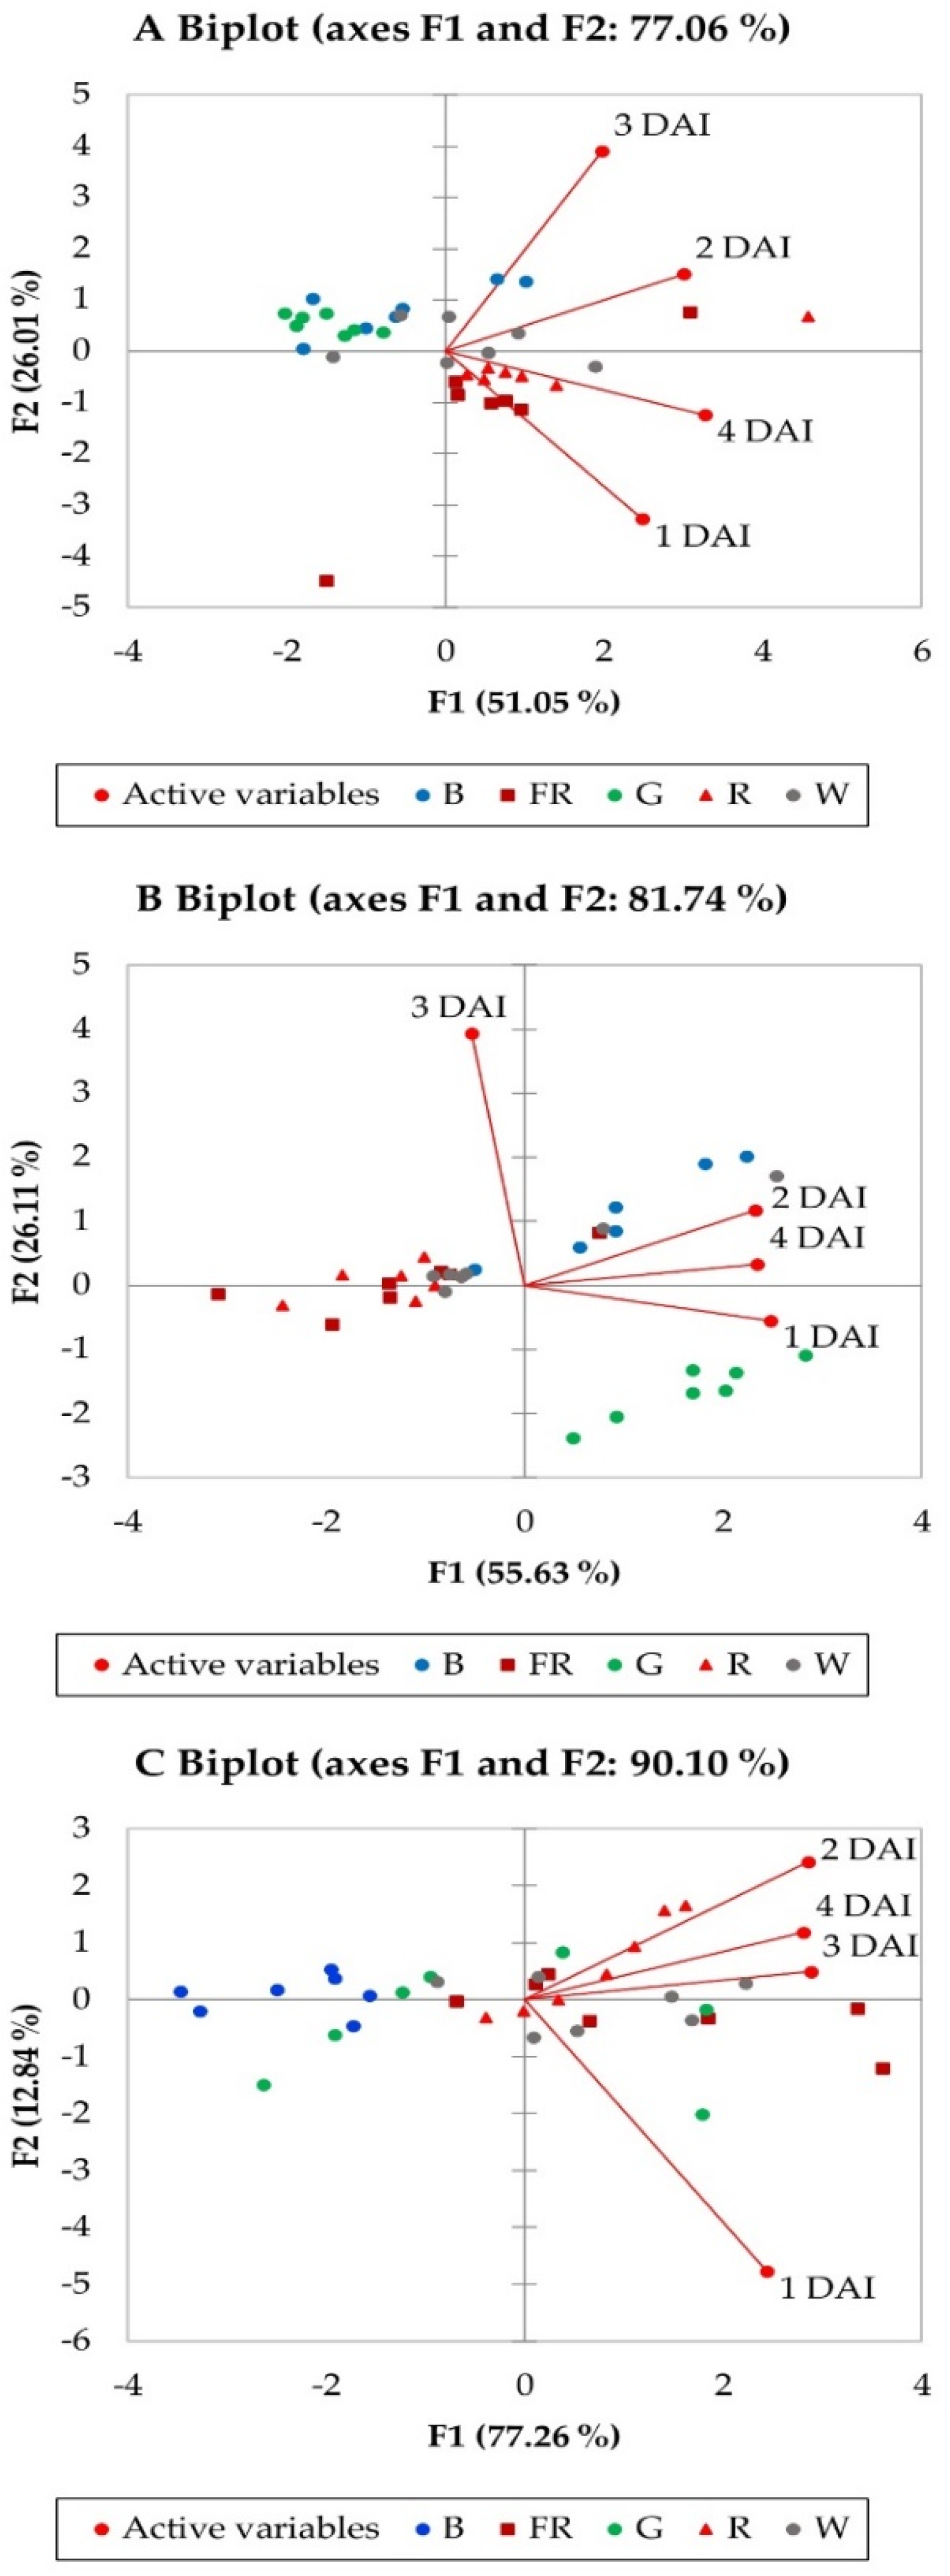
2. Results
3. Discussion
4. Materials and Methods
4.1. Fungal Isolate and Its Cultivation
4.2. Light Treatments and Intensity
4.3. Phenotypic and Morphological Characteristics Evaluation
4.4. Statistical Analysis and Principal Component Analysis
5. Conclusions
Supplementary Materials
Author Contributions
Funding
Institutional Review Board Statement
Informed Consent Statement
Data Availability Statement
Conflicts of Interest
References
- Fung, F.; Wang, H.S.; Menon, S. Food safety in the 21st century. Biomed. J. 2018, 41, 88–95. [Google Scholar] [CrossRef]
- Rather, I.A.; Koh, W.Y.; Paek, W.K.; Lim, J. The Sources of chemical contaminants in food and their health implications. Front. Pharmacol. 2017, 8, 830. [Google Scholar] [CrossRef] [PubMed] [Green Version]
- Tiilikkala, K.; Lindqvist, I.; Hagner, M.; Setälä, H.; Perdikis, D. Use of botanical pesticides in modern plant protection. In Pesticides in the Modern World—Pesticides Use and Management; Stoytcheva, M., Ed.; IntechOpen Limited: London, UK, 2011; pp. 259–272. [Google Scholar]
- Stentiford, G.D.; Becnel, J.; Weiss, L.M.; Keeling, P.J.; Didier, E.S.; Williams, B.P.; Bjornson, S.; Kent, M.L.; Freeman, M.A.; Brown, M.J.F.; et al. Microsporidia—Emergent Pathogens in the Global Food Chain. Trends Parasitol. 2016, 32, 336–348. [Google Scholar] [CrossRef] [PubMed] [Green Version]
- Elad, Y.; Vivier, M.; Fillinger, S. Botrytis, the good, the bad and the ugly. In Botrytis—The Fungus, the Pathogen and Its Management in Agricultural Systems; Fillinger, S., Elad, Y., Eds.; Springer: New York, NY, USA; Dordrecht, The Netherlands; London, UK, 2016; pp. 1–15. [Google Scholar]
- Carisse, O.; Morissette-Thomas, V.; Van der Heyden, H. Lagged association between powdery mildew leaf severity, airborne inoculum, weather, and crop losses in strawberry. Phytopathology 2013, 103, 811–821. [Google Scholar] [CrossRef] [PubMed] [Green Version]
- Elad, Y. Cultural and integrated control of Botrytis. In Botrytis—The Fungus, the Pathogen and Its Management in Agricultural Systems; Fillinger, S., EditorElad, Y., Eds.; Springer: New York, NY, USA; Dordrecht, The Netherlands; London, UK, 2016; pp. 149–164. [Google Scholar]
- Kim, K.; Kook, H.-S.; Jang, Y.-J.; Lee, W.-H.; Kamala-Kannan, S.; Chae, J.-C.; Lee, K.-J. The effect of blue-light emitting diodes on antioxidant properties and resistance to Botrytis cinerea in tomato. J. Plant Pathol. Microbiol. 2013, 4, 203. [Google Scholar] [CrossRef] [Green Version]
- Kook, H.S.; Park, S.H.; Jang, Y.J.; Lee, G.W.; Kim, J.S.; Kim, H.M.; Oh, B.T.; Chae, J.C.; Lee, K.J. Blue LED (light-emitting diodes)-mediated growth promotion and control of Botrytis disease in lettuce. Acta Agric. Scand. B Soil Plant Sci. 2013, 63, 271–277. [Google Scholar] [CrossRef]
- Damos, P.; Colomar, L.A.; Ioriatti, C. Integrated fruit production and pest management in Europe: The apple case study and how far are from the original concept? Insects 2015, 6, 626–657. [Google Scholar] [CrossRef]
- Beckerman, J.L.; Sundin, G.W.; Rosenberger, D.A. Do some IPM concepts contribute to the development of fungicide resistance? Lessons learned from the apple scab pathosystem in the United States. Pest Manag. Sci. 2015, 71, 331–342. [Google Scholar] [CrossRef]
- Morkeliūnė, A.; Rasiukevičiūtė, N.; Valiuškaitė, A. Pathogenicity of Colletotrichum acutatum to different strawberry cultivars and anthracnose control with essential oils. Zemdirb.-Agric. 2021, 108, 173–180. [Google Scholar] [CrossRef]
- D’Souza, C.; Yuk, H.; Khoo, H.G.; Zhou, W. Application of light-emitting diodes in food production, postharvest preservation, and microbiological food safety. Compr. Rev. Food Sci. Food Saf. 2015, 14, 719–740. [Google Scholar] [CrossRef]
- Hasan, M.M.; Bashir, T.; Ghosh, R.; Lee, S.K.; Bae, H. An Overview of LEDs’ effects on the production of bioactive compounds and crop quality. Molecules 2017, 22, 1420. [Google Scholar] [CrossRef] [PubMed] [Green Version]
- Šernaitė, L.; Valiuškaitė, A.; Rasiukevičiūtė, N.; Dambrauskienė, E.; Viškelis, P. Effectiveness of mixtures and individual plant extracts and essential oils for biocontrol of Botrytis cinerea. Žemdirb.-Agric. 2020, 107, 147–152. [Google Scholar] [CrossRef]
- Freeman, S.; Horowitz, S.; Sharon, A. Pathogenic and nonpathogenic life style in Colletotrichum acutatum from strawberry and other plants. Phytopathology 2001, 91, 986–992. [Google Scholar] [CrossRef] [Green Version]
- Aguado, A.; Pastrana, A.M.; Santos, B.; Romero, F.; Sánchez, M.C.; Capote, N. The efficiency of natural products for the control of Colletotrichum acutatum monitored by real-time PCR. Acta Hort. 2014, 1049, 329–334. [Google Scholar] [CrossRef]
- Feliziani, E.; Romanazzi, G. Postharvest decay of strawberry fruit: Etiology, epidemiology, and disease management. J. Berry Res. 2016, 6, 47–63. [Google Scholar] [CrossRef] [Green Version]
- Cannon, P.F.; Damm, U.; Johnston, P.R.; Weir, B.S. Colletotrichum—Current status and future directions. Stud. Mycol. 2012, 73, 181–213. [Google Scholar] [CrossRef] [PubMed] [Green Version]
- Udayanga, D.; Manamgoda, D.S.; Liu, X.; Chukeatirote, E.; Hyde, K.D. What are the common anthracnose pathogens of tropical fruits? Fungal Divers. 2013, 61, 165–179. [Google Scholar] [CrossRef]
- Sreenivasaprasad, S.; Talhinhas, P. Genotypic and phenotypic diversity in Colletotrichum acutatum, a cosmopolitan pathogen causing anthracnose on a wide range of hosts. Mol. Plant Pathol. 2005, 6, 361–378. [Google Scholar] [CrossRef]
- Bian, Z.H.; Yang, Q.C.; Liu, W.K. Effects of light quality on the accumulation of phytochemicals in vegetables produced in controlled environments: A review. J. Sci. Food Agric. 2015, 95, 869–877. [Google Scholar] [CrossRef]
- Vaštakaitė, V.; Viršilė, A.; Brazaitytė, A.; Samuolienė, G.; Jankauskienė, J.; Novičkovas, A.; Duchovskis, P. Pulsed Light-Emitting diodes for a higher phytochemical level in microgreens. J. Agric. Food Chem. 2017, 65, 6529–6534. [Google Scholar] [CrossRef]
- Brazaitytė, A.; Viršilė, A.; Samuolienė, G.; Vaštakaitė-Kairienė, V.; Jankauskienė, J.; Miliauskienė, J.; Novičkovas, A.; Duchovskis, P. Response of mustard microgreens to different wavelengths and durations of UV-A LEDs. Front. Plant Sci. 2019, 10, 1153. [Google Scholar] [CrossRef] [PubMed] [Green Version]
- Bantis, F.; Smirnakou, S.; Ouzounis, T.; Koukounaras, A.; Ntagkas, N.; Radoglou, K. Current status and recent achievements in the field of horticulture with the use of light-emitting diodes (LEDs). Sci. Hortic. 2018, 235, 437–451. [Google Scholar] [CrossRef]
- Paul, N.D.; Rasanayagam, S.; Moody, S.A.; Hatcher, P.E.; Ayres, P.G. The role of interactions between trophic levels in determining the effects of UV-B on terrestrial ecosystems. Plant Ecol. 1997, 128, 296–308. [Google Scholar] [CrossRef]
- Schumacher, J. How light affects the life of Botrytis. Fungal Genet. Biol. 2017, 106, 26–41. [Google Scholar] [CrossRef] [PubMed]
- Schumacher, J.; Gorbushina, A.A. Light sensing in plant- and rock-associated black fungi. Fungal Biol. 2020, 124, 407–417. [Google Scholar] [CrossRef] [PubMed]
- Costa, T.P.C.; Rodrigues, E.M.; Dias, P.D.; Pupin, B.; Ferreira, P.C.; Rangel, D.E.N. Different wavelengths of visible light influence the conidial production and tolerance to ultra-violet radiation of the plant pathogens Colletotrichum acutatum and Fusarium fujikuroi. Eur. J. Plant Pathol. 2021, 159, 105–115. [Google Scholar] [CrossRef]
- Liao, H.-L.; Alferez, F.; Burns, J.K. Assessment of blue light treatments on citrus postharvest diseases. Postharvest Biol. Technol. 2013, 81, 81–88. [Google Scholar] [CrossRef]
- Ballaré, C.L. Light Regulation of Plant Defense. Annu. Rev. Plant Biol. 2014, 65, 335–363. [Google Scholar] [CrossRef]
- Alferez, F.; Liao, H.-L.; Burns, J.K. Blue light alters infection by Penicillium digitatum in tangerines. Postharvest Biol. Technol. 2012, 63, 11–15. [Google Scholar] [CrossRef]
- Xu, H.; Fu, Y.; Li, T.; Wang, R. Effects of different LED light wavelengths on the resistance of tomato against Botrytis cinerea and the corresponding physiological mechanisms. J. Integr. Agric. 2017, 16, 106–114. [Google Scholar] [CrossRef] [Green Version]
- Suthaparan, A.; Torre, S.; Stensvand, A.; Herrero, M.L.; Pettersen, R.I.; Gadoury, D.M.; Gislerød, H.R. Specific light-emitting diodes can suppress sporulation of Podosphaera pannosa on greenhouse roses. Plant Dis. 2010, 94, 1105–1110. [Google Scholar] [CrossRef] [PubMed] [Green Version]
- Alsanius, B.W.; Karlsson, M.; Rosberg, A.K.; Dorais, M.; Naznin, M.T.; Khalil, S.; Bergstrand, K.-J. Light and microbial lifestyle: The impact of light quality on plant–microbe interactions in horticultural production systems—A review. Horticulturae 2019, 5, 41. [Google Scholar] [CrossRef] [Green Version]
- Yu, S.-M.; Ramkumar, G.; Lee, Y.H. Light quality influences the virulence and physiological responses of Colletotrichum acutatum causing anthracnose in pepper plants. J. Appl. Microbiol. 2014, 115, 509–516. [Google Scholar] [CrossRef]
- Kommula, S.K.; Reddy, G.P.D.; Undrajavarapu, P.; Kanchana, K.S. Effect of Various Factors (Temperature, pH and Light Intensity) on Growth of Colletotrichum capsici Isolated from Infected Chilli. Int. J. Pure App. Biosci. 2017, 5, 535–543. [Google Scholar] [CrossRef]
- Simkovitch, R.; Gajst, O.; Zelinger, E.; Yarden, O.; Huppert, D. Irradiation by blue light in the presence of a photoacid confers changes to colony morphology of the plant pathogen Colletotrichum gloeosporioides. J. Photochem. Photobiol. B 2017, 174, 1–9. [Google Scholar] [CrossRef]
- Yoon, J.B.; Park, H.G. Screening method for resistance to pepper fruit anthracnose: Pathogen sporulation, inoculation methods related to inoculum concentrations and post-inoculation environment. Korean J. Hortic. Sci. Technol. 2001, 42, 389–393. [Google Scholar]
- Xie, L.; Zhang, J.; Wan, Y.; Hu, D. Identification of Colletotrichum spp. isolated from strawberry in Zhejiang Province and Shanghai City, China. J. Zhejiang Univ. Sci. B 2010, 11, 61–70. [Google Scholar] [CrossRef] [PubMed]
- Cherkupally, R.; Kota, R.; Amballa, H.; Reddy, B.N. In vitro antifungal potential of plant extracts against Fusarium oxysporum, Rhizoctonia solani and Macrophomina phaseolina. Ann. Plant Sci. 2017, 6, 1676–1680. [Google Scholar] [CrossRef] [Green Version]
- Campbell, C.L.; Madden, L.V. Introduction to Plant Disease Epidemiology; John Wiley & Sons: New York, NY, USA, 1990; p. 532. [Google Scholar]


| PCA Biplot | A | B | C | |||
|---|---|---|---|---|---|---|
| Factors | F1 | F2 | F1 | F2 | F1 | F2 |
| Eigenvalue | 2.042 | 1.041 | 2.225 | 1.044 | 3.091 | 0.513 |
| Variability (%) | 51.047 | 26.013 | 55.626 | 26.110 | 77.265 | 12.836 |
| Cumulative variability (%) | 77.060 | 81.736 | 90.100 | |||
| Factor loadings | ||||||
| 1 DAI | 0.651 | −0.614 | 0.888 | −0.136 | 0.779 | −0.622 |
| 2 DAI | 0.786 | 0.282 | 0.833 | 0.289 | 0.912 | 0.315 |
| 3 DAI | 0.517 | 0.728 | −0.194 | 0.967 | 0.920 | 0.064 |
| 4 DAI | 0.856 | −0.232 | 0.839 | 0.081 | 0.897 | 0.154 |
| Factor scores | ||||||
| B | −0.5736 | 0.8253 | 0.951 | 1.096 | −2.3484 | 0.0937 |
| G | −1.4932 | 0.5292 | 1.678 | −1.644 | −0.3940 | −0.4173 |
| R | 1.2799 | −0.3262 | −1.331 | 0.052 | 0.6982 | 0.5869 |
| FR | 0.5885 | −1.1771 | −1.236 | 0.047 | 1.2974 | −0.1943 |
| W | 0.1984 | 0.1488 | −0.061 | 0.449 | 0.7469 | −0.0690 |
| LED Light Wavelengths | Photosynthetic Photon Flux Density | ||
|---|---|---|---|
| 50 µ mol m−2 s−1 | 100 µ mol m−2 s−1 | 200 µ mol m−2 s−1 | |
| B | 10.22 ± 0.41 | 11.33 ± 0.33 | 9.37 ± 0.24 |
| G | 9.94 ± 0.21 | 11.58 ± 0.29 | 9.99 ± 0.38 |
| R | 10.94 ± 0.32 | 10.30 ± 0.23 | 10.37 ± 0.27 |
| FR | 10.53 ± 0.48 | 10.36 ± 0.33 | 10.58 ± 0.34 |
| W | 10.46 ± 0.29 | 10.71 ± 0.36 | 10.39 ± 0.28 |
| Conidia Size, μm | LED Light Wavelengths | ||||
|---|---|---|---|---|---|
| B | G | R | FR | W | |
| 50 µ mol m−2 s−1 photosynthetic photon flux density | |||||
| Width | 9.0 ± 0.6 | 8.1 ± 0.5 | 9.1 ± 0.3 | 7.6 ± 0.3 | 10.3 ± 0.5 |
| Length | 26.5 ± 3.0 | 23.8 ± 1.8 | 27.5 ± 2.5 | 23.9 ± 1.8 | 33.3 ± 2.7 |
| 100 µ mol m−2 s−1 photosynthetic photon flux density | |||||
| Width | 8.9 ± 0.5 | 8.6 ± 0.6 | 9.2 ± 0.7 | 9.6 ± 0.4 | 9.9 ± 0.5 |
| Length | 24.7 ± 1.0 | 23.3 ± 1.2 | 26.8 ± 2.0 | 21.5 ± 2.4 | 30.1 ± 2.1 |
| 200 µ mol m−2 s−1 photosynthetic photon flux density | |||||
| Width | 9.4 ± 0.6 | 8.3 ± 0.7 | 8.7 ± 0.3 | 9.1 ± 0.5 | 9.3 ± 0.6 |
| Length | 26.2 ± 1.9 | 25.0 ± 0.8 | 24.9 ± 1.9 | 30.5 ± 0.6 | 30.0 ± 0.9 |
| LED Light Wavelengths | ||||
|---|---|---|---|---|
| B | G | R | FR | W |
| 50 µ mol m−2 s−1 photosynthetic photon flux density | ||||
| 25.8 ± 0.3 a | 26.5 ± 0.5 a | 28.9 ± 0.2 d | 28.4 ± 0.1 cd | 27.8 ± 0.2 bcd |
| 100 µ mol m−2 s−1 photosynthetic photon flux density | ||||
| 24.5 ± 0.7 abc | 26.0 ± 0.4 c | 23.8 ± 0.1 a | 24.8 ± 0.1 abc | 23.6 ± 0.2 a |
| 200 µ mol m−2 s−1 photosynthetic photon flux density | ||||
| 24.1 ± 0.2 b | 24.5 ± 0.2 b | 24.6 ± 0.1 b | 24.4 ± 0.1 b | 27.4 ± 0.6 c |
Publisher’s Note: MDPI stays neutral with regard to jurisdictional claims in published maps and institutional affiliations. |
© 2022 by the authors. Licensee MDPI, Basel, Switzerland. This article is an open access article distributed under the terms and conditions of the Creative Commons Attribution (CC BY) license (https://creativecommons.org/licenses/by/4.0/).
Share and Cite
Rasiukevičiūtė, N.; Brazaitytė, A.; Vaštakaitė-Kairienė, V.; Valiuškaitė, A. Different LED Light Wavelengths and Photosynthetic Photon Flux Density Effect on Colletotrichum acutatum Growth. Plants 2022, 11, 143. https://doi.org/10.3390/plants11010143
Rasiukevičiūtė N, Brazaitytė A, Vaštakaitė-Kairienė V, Valiuškaitė A. Different LED Light Wavelengths and Photosynthetic Photon Flux Density Effect on Colletotrichum acutatum Growth. Plants. 2022; 11(1):143. https://doi.org/10.3390/plants11010143
Chicago/Turabian StyleRasiukevičiūtė, Neringa, Aušra Brazaitytė, Viktorija Vaštakaitė-Kairienė, and Alma Valiuškaitė. 2022. "Different LED Light Wavelengths and Photosynthetic Photon Flux Density Effect on Colletotrichum acutatum Growth" Plants 11, no. 1: 143. https://doi.org/10.3390/plants11010143