
Regional Heritability Mapping of Quantitative Trait Loci Controlling Traits Related to Growth and Productivity in Popcorn (Zea mays L.)

 ,
,  ,
,  ,
,  , , ,
, , ,  ,
,  and
and 
Abstract
:1. Introduction
2. Results
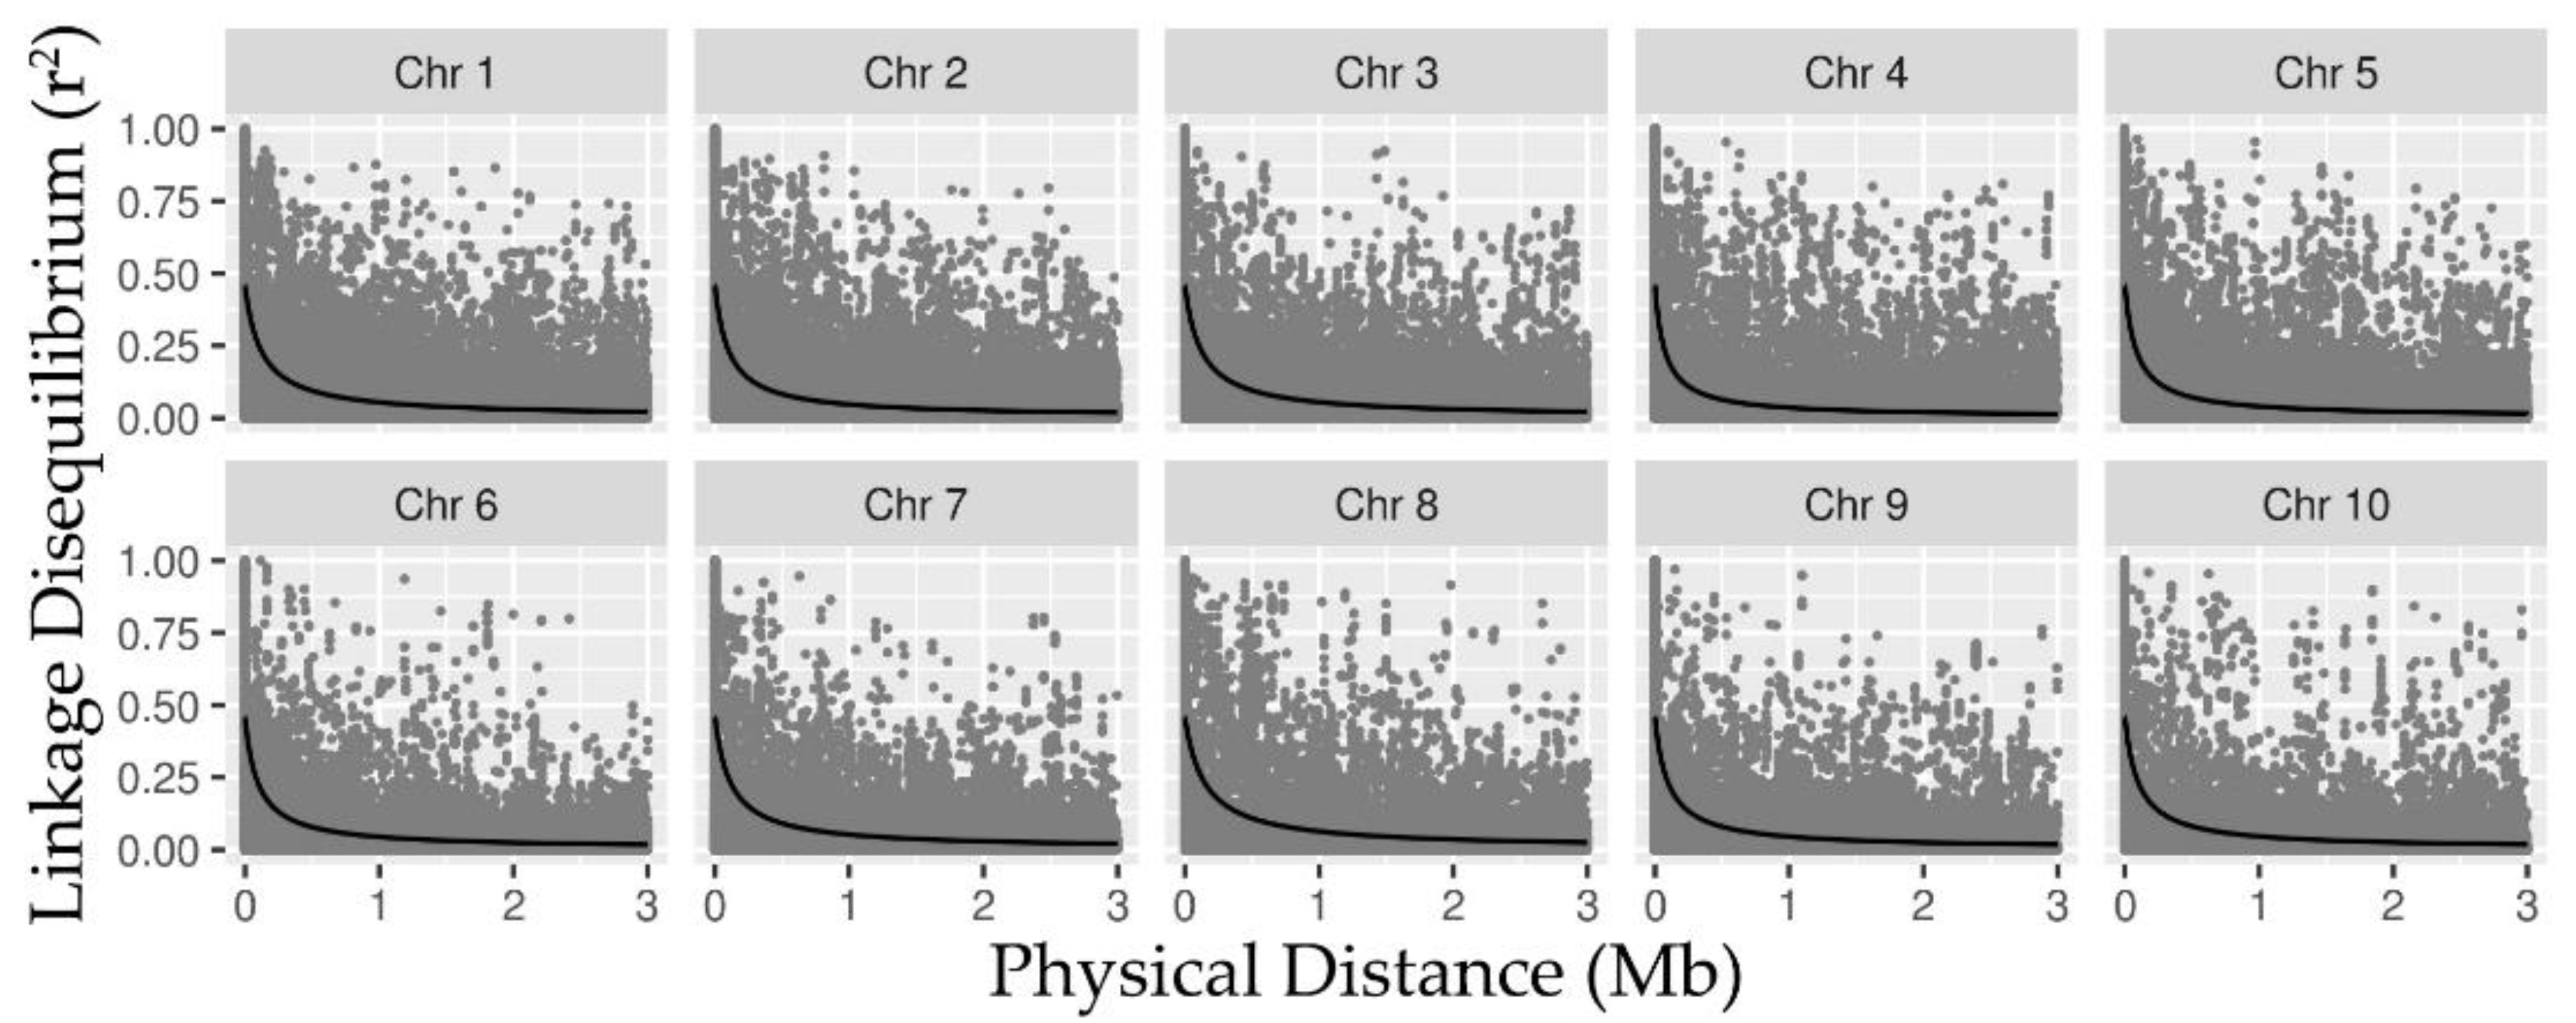
2.1. SNP Data, LD, and Detection of Associations via RHM
2.2. Gene Identification in QTL Regions
3. Discussion
3.1. Linkage Disequilibrium and Heritability Captured by RHM
3.2. RHM Analysis and Candidate Genes
4. Materials and Methods
4.1. Study Population and Phenotypic Evaluations
4.2. Genotyping
4.3. Genetic Aspects of the Population
4.4. Regional Heritability Mapping
4.5. Identification of Candidate Genes
5. Conclusions
Supplementary Materials
Author Contributions
Funding
Institutional Review Board Statement
Data Availability Statement
Acknowledgments
Conflicts of Interest
References
- Maldonado, C.; Mora, F.; Scapim, C.A.; Coan, M. Genome-wide haplotype-based association analysis of key traits of plant lodging and architecture of maize identifies major determinants for leaf angle: HapLA4. PLoS ONE 2019, 14, e0212925. [Google Scholar] [CrossRef] [Green Version]
- FAO. FAOSTAT—Crops. 2017. Available online: http://www.fao.org/faostat/en/#data/QC (accessed on 20 May 2021).
- Paraginski, R.T.; Ziegler, V.; Ferreira, C.D.; Colussi, R.; Gutkoski, L.C.; Zavareze, E.D.R.; Elias, M.C. Properties of popcorn starch expanded in a microwave, with and without the presence of vegetable oil. J. Food Process. Pres. 2017, 41, e13142. [Google Scholar] [CrossRef]
- Vittorazzi, C.; Junior, A.A.; Guimarães, A.G.; Viana, A.P.; Silva, F.H.L.; Pena, G.F.; Daher, R.F.; Gerhardt, I.F.S.; Oliveira, G.H.F.; Pereira, M.G. Indices estimated using REML/BLUP and introduction of a super-trait for the selection of progenies in popcorn. Genet. Mol. Res. 2017, 16, gmr16039769. [Google Scholar] [CrossRef]
- Lu, H.-J.; Bernardo, R.; Ohm, H. Mapping QTL for popping expansion volume in popcorn with simple sequence repeat markers. Theor. Appl. Genet. 2003, 106, 423–427. [Google Scholar] [CrossRef]
- Coan, M.M.D.; Pinto, R.J.B.; Kuki, M.C.; Amaral Júnior, A.T.; Figueiredo, A.S.T.; Scapim, C.A.; Warburton, M. Inheritance Study for Popping Expansion in Popcorn vs. Flint Corn Genotypes. Agron. J. 2019, 111, 2174–2183. [Google Scholar] [CrossRef]
- Li, Y.; Dong, Y.; Niu, S.; Cui, D. The genetic relationship among plant-height traits found using multiple-trait QTL mapping of a dent corn and popcorn cross. Genome 2007, 50, 357–364. [Google Scholar] [CrossRef]
- Mafra, G.S.; do Amaral Júnior, A.T.; de Almeida Filho, J.E.; Vivas, M.; Santos, P.H.A.D.; Santos, J.S.; Pena, G.F.; de Lima, V.J.; Kamphorst, S.H.; de Oliveira, F.T.; et al. SNP-based mixed model association of growth- and yield-related traits in popcorn. PLoS ONE 2019, 14, e0218552. [Google Scholar] [CrossRef]
- Babu, R.; Nair, S.K.; Kumar, A.; Rao, H.S.; Verma, P.; Gahalain, A.; Singh, I.S.; Gupta, H.S. Mapping QTLs for popping ability in a popcorn × flint corn cross. Theor. Appl. Genet. 2006, 112, 1392–1399. [Google Scholar] [CrossRef] [PubMed]
- Thakur, S.; Kumar, R.; Vikal, Y.; Vyas, P.; Sheikh, I.; Dhaliwal, H.S. Molecular mapping of popping volume QTL in popcorn (Zea maize L.). J. Plant Biochem. Biotechnol. 2021, 30, 496–503. [Google Scholar] [CrossRef]
- Li, Y.L.; Dong, Y.B.; Cui, D.Q.; Wang, Y.Z.; Liu, Y.Y.; Wei, M.G.; Li, X.H. The genetic relationship between popping expansion volume and two yield components in popcorn using unconditional and conditional QTL analysis. Euphytica 2008, 162, 345–351. [Google Scholar] [CrossRef]
- Dell’Acqua, M.; Gatti, D.M.; Pea, G.; Cattonaro, F.; Coppens, F.; Magris, G.; Hlaing, A.L.; Aung, H.H.; Nelissen, H.; Baute, J.; et al. Genetic properties of the MAGIC maize population: A new platform for high definition QTL mapping in Zea mays. Genome Biol. 2015, 16, 167. [Google Scholar] [CrossRef] [Green Version]
- Li, J.; Li, D.; Espinosa, C.Z.; Pastor, V.T.; Rasheed, A.; Rojas, N.P.; Wang, J.; Varela, A.S.; Carolina de Almeida Silva, N.; Schnable, P.S.; et al. Genome-wide analyses reveal footprints of divergent selection and popping-related traits in CIMMYT’s maize inbred lines. J. Exp. Bot. 2021, 72, 1307–1320. [Google Scholar] [CrossRef]
- Valenzuela, C.E.; Ballesta, P.; Ahmar, S.; Fiaz, S.; Heidari, P.; Maldonado, C.; Mora-Poblete, F. Haplotype-and SNP-Based GWAS for Growth and Wood Quality Traits in Eucalyptus cladocalyx Trees under Arid Conditions. Plants 2021, 10, 148. [Google Scholar] [CrossRef]
- Maldonado, C.; Mora, F.; Bertagna, F.A.B.; Kuki, M.C.; Scapim, C.A. SNP-and haplotype-based GWAS of flowering-related traits in maize with network-assisted gene prioritization. Agronomy 2019, 9, 725. [Google Scholar] [CrossRef] [Green Version]
- Nagamine, Y.; Pong-Wong, R.; Navarro, P.; Vitart, V.; Hayward, C.; Rudan, I.; Campbell, H.; Wilson, J.; Wild, S.; Hicks, A.A.; et al. Localising Loci underlying Complex Trait Variation Using Regional Genomic Relationship Mapping. PLoS ONE 2012, 7, e46501. [Google Scholar] [CrossRef] [PubMed] [Green Version]
- Uemoto, Y.; Pong-Wong, R.; Navarro, P.; Vitart, V.; Hayward, C.; Wilson, J.F.; Rudan, I.; Campbell, H.; Hastie, N.D.; Wright, A.F.; et al. The power of regional heritability analysis for rare and common variant detection: Simulations and application to eye biometrical traits. Front. Genet. 2013, 4, 232. [Google Scholar] [CrossRef] [Green Version]
- Resende, R.T.; Resende, M.D.V.; Silva, F.F.; Azevedo, C.F.; Takahashi, E.K.; Silva-Junior, O.B.; Grattapaglia, D. Regional heritability mapping and genome-wide association identify loci for complex growth, wood and disease resistance traits in Eucalyptus. New Phytol. 2017, 213, 1287–1300. [Google Scholar] [CrossRef] [PubMed] [Green Version]
- Haiman, C.A.; Patterson, N.; Freedman, M.L.; Myers, S.R.; Pike, M.C.; Waliszewska, A.; Neubauer, J.; Tandon, A.; Schirmer, C.; McDonald, G.J.; et al. Multiple regions within 8q24 independently affect risk for prostate cancer. Nat. Genet. 2007, 39, 638–644. [Google Scholar] [CrossRef] [Green Version]
- Duerr, R.H.; Taylor, K.D.; Brant, S.R.; Rioux, J.D.; Silverberg, M.S.; Daly, M.J.; Steinhart, A.H.; Abraham, C.; Regueiro, M.; Griffiths, A.; et al. A Genome-Wide Association Study Identifies IL23R as an Inflammatory Bowel Disease Gene. Science 2006, 314, 1461–1463. [Google Scholar] [CrossRef] [Green Version]
- Resende, R.T. Regional Heritability Mapping and Gwas for Molecular Breeding in Eucalyptus Hybrids. Ph.D. Thesis, Universidade Federal de Viçosa, Viçosa, MG, Brazil, 2017. [Google Scholar]
- Shirali, M.; Pong-Wong, R.; Navarro, P.; Knott, S.; Hayward, C.; Vitart, V.; Rudan, I.; Campbell, H.; Hastie, N.D.; Wright, A.F.; et al. Regional heritability mapping method helps explain missing heritability of blood lipid traits in isolated populations. Heredity 2016, 116, 333–338. [Google Scholar] [CrossRef] [PubMed] [Green Version]
- Caballero, A.; Tenesa, A.; Keightley, P.D. The Nature of Genetic Variation for Complex Traits Revealed by GWAS and Regional Heritability Mapping Analyses. Genetics 2015, 201, 1601–1613. [Google Scholar] [CrossRef] [Green Version]
- Resende, R.T.; de Resende, M.D.V.; Azevedo, C.F.; Fonseca e Silva, F.; Melo, L.C.; Pereira, H.S.; Souza, T.L.P.O.; Valdisser, P.A.M.R.; Brondani, C.; Vianello, R.P. Genome-Wide Association and Regional Heritability Mapping of Plant Architecture, Lodging and Productivity in Phaseolus vulgaris. G3-Genes Genom. Genet. 2018, 8, 2841–2854. [Google Scholar] [CrossRef] [PubMed] [Green Version]
- Okeke, U.G.; Akdemir, D.; Rabbi, I.; Kulakow, P.; Jannink, J. Regional Heritability Mapping Provides Insights into Dry Matter Content in African White and Yellow Cassava Populations. Plant Genome US 2018, 11, 1–18. [Google Scholar] [CrossRef] [PubMed]
- Neves, L.G.; Davis, J.M.; Barbazuk, W.B.; Kirst, M. A High-Density Gene Map of Loblolly Pine (Pinus taeda L.) Based on Exome Sequence Capture Genotyping. G3 Genes Genomes Genet. 2014, 4, 29–37. [Google Scholar] [CrossRef] [PubMed] [Green Version]
- Schwantes, I.A.; do Amaral Júnior, A.T.; Almeida Filho, J.E.; Vivas, M.; Silva Cabral, P.D.; Gonçalves Guimarães, A.; Lima e Silva, F.H.; Araújo Diniz Santos, P.H.; Gonzaga Pereira, M.; Pio Viana, A.; et al. Genomic selection helps accelerate popcorn population breeding. Crop Sci. 2020, 60, 1373–1385. [Google Scholar] [CrossRef]
- Rigas, S.; Daras, G.; Tsitsekian, D.; Alatzas, A.; Hatzopoulos, P. Evolution and significance of the Lon gene family in Arabidopsis organelle biogenesis and energy metabolism. Front. Plant Sci. 2014, 5, 145. [Google Scholar] [CrossRef] [Green Version]
- Zhang, M.; Wang, C.; Lin, Q.; Liu, A.; Wang, T.; Feng, X.; Liu, J.; Han, H.; Ma, Y.; Bonea, D.; et al. A tetratricopeptide repeat domain-containing protein SSR1 located in mitochondria is involved in root development and auxin polar transport in Arabidopsis. Plant J. 2015, 83, 582–599. [Google Scholar] [CrossRef] [Green Version]
- Masuda, S.; Mizusawa, K.; Narisawa, T.; Tozawa, Y.; Ohta, H.; Takamiya, K. The Bacterial Stringent Response, Conserved in Chloroplasts, Controls Plant Fertilization. Plant Cell Physiol. 2008, 49, 135–141. [Google Scholar] [CrossRef] [Green Version]
- Sun, R.; Ye, R.; Gao, L.; Zhang, L.; Wang, R.; Mao, T.; Zheng, Y.; Li, D.; Lin, Y. Characterization and Ectopic Expression of CoWRI1, an AP2/EREBP Domain-Containing Transcription Factor from Coconut (Cocos nucifera L.) Endosperm, Changes the Seeds Oil Content in Transgenic Arabidopsis thaliana and Rice (Oryza sativa L.). Front. Plant Sci. 2017, 8, 63. [Google Scholar] [CrossRef] [PubMed] [Green Version]
- Arthikala, M.-K.; Quinto, C. RbohA coordinates lateral root emergence in common bean. Commun. Integr. Biol. 2018, 11, 1–5. [Google Scholar] [CrossRef] [PubMed] [Green Version]
- Yoshioka, H.; Numata, N.; Nakajima, K.; Katou, S.; Kawakita, K.; Rowland, O.; Jones, J.D.G.; Doke, N. Nicotiana benthamiana gp91 phox Homologs NbrbohA and NbrbohB Participate in H2O2 Accumulation and Resistance to Phytophthora infestans. Plant Cell 2003, 15, 706–718. [Google Scholar] [CrossRef] [Green Version]
- Chai, W.; Jiang, P.; Huang, G.; Jiang, H.; Li, X. Identification and expression profiling analysis of TCP family genes involved in growth and development in maize. Physiol. Mol. Biol. Plants 2017, 23, 779–791. [Google Scholar] [CrossRef] [PubMed]
- Manohar, M.; Choi, H.W.; Manosalva, P.; Austin, C.A.; Peters, J.E.; Klessig, D.F. Plant and Human MORC Proteins Have DNA-Modifying Activities Similar to Type II Topoisomerases, but Require One or More Additional Factors for Full Activity. Mol. Plant-Microbe Interact. 2017, 30, 87–100. [Google Scholar] [CrossRef] [PubMed] [Green Version]
- Nziengui, H.; Schoefs, B. Functions of reticulons in plants: What we can learn from animals and yeasts. Cell. Mol. Life Sci. 2009, 66, 584–595. [Google Scholar] [CrossRef]
- Tai, F.J.; Yuan, Z.L.; Wu, X.L.; Zhao, P.F.; Hu, X.L.; Wang, W. Identification of membrane proteins in maize leaves, altered in expression under drought stress through polyethylene glycol treatment. Plant Omi. J. 2011, 4, 250–256. [Google Scholar]
- Delgado-Alvarado, A.; Walker, R.P.; Leegood, R.C. Phosphoenolpyruvate carboxykinase in developing pea seeds is associated with tissues involved in solute transport and is nitrogen-responsive. Plant. Cell Environ. 2007, 30, 225–235. [Google Scholar] [CrossRef] [PubMed]
- Avisar, D.; Abu-Abied, M.; Belausov, E.; Sadot, E.; Hawes, C.; Sparkes, I.A. A Comparative Study of the Involvement of 17 Arabidopsis Myosin Family Members on the Motility of Golgi and Other Organelles. Plant Physiol. 2009, 150, 700–709. [Google Scholar] [CrossRef] [Green Version]
- Ge, W.; Song, Y.; Zhang, C.; Zhang, Y.; Burlingame, A.L.; Guo, Y. Proteomic analyses of apoplastic proteins from germinating Arabidopsis thaliana pollen. Biochim. Biophys. Acta Proteins Proteom. 2011, 1814, 1964–1973. [Google Scholar] [CrossRef] [Green Version]
- Donnini, S.; Prinsi, B.; Negri, A.S.; Vigani, G.; Espen, L.; Zocchi, G. Proteomic characterization of iron deficiency responses in Cucumis sativus L. roots. BMC Plant Biol. 2010, 10, 268. [Google Scholar] [CrossRef] [Green Version]
- Kong, F.; Deng, Y.; Zhou, B.; Wang, G.; Wang, Y.; Meng, Q. A chloroplast-targeted DnaJ protein contributes to maintenance of photosystem II under chilling stress. J. Exp. Bot. 2014, 65, 143–158. [Google Scholar] [CrossRef] [Green Version]
- Yu, R.M.; Zhou, Y.; Xu, Z.F.; Chye, M.L.; Kong, R.Y. Two genes encoding protein phosphatase 2A catalytic subunits are differentially expressed in rice. Plant Mol. Biol. 2003, 51, 295–311. [Google Scholar] [PubMed]
- Dutt, S.; Parkash, J.; Mehra, R.; Sharma, N.; Singh, B.; Raigond, P.; Joshi, A.; Chopra, S.; Singh, B.P. Translation initiation in plants: Roles and implications beyond protein synthesis. Biol. Plant. 2015, 59, 401–412. [Google Scholar] [CrossRef]
- País, S.M.; Téllez-Iñón, M.T.; Capiati, D.A. Serine/Threonine Protein Phosphatases type 2A and their roles in stress signaling. Plant Signal. Behav. 2009, 4, 1013–1015. [Google Scholar] [CrossRef] [PubMed]
- Jue, D.; Sang, X.; Lu, S.; Dong, C.; Zhao, Q.; Chen, H.; Jia, L. Genome-Wide Identification, Phylogenetic and Expression Analyses of the Ubiquitin-Conjugating Enzyme Gene Family in Maize. PLoS ONE 2015, 10, e0143488. [Google Scholar] [CrossRef] [PubMed]
- Bolduc, N.; Yilmaz, A.; Mejia-Guerra, M.K.; Morohashi, K.; O’Connor, D.; Grotewold, E.; Hake, S. Unraveling the KNOTTED1 regulatory network in maize meristems. Genes Dev. 2012, 26, 1685–1690. [Google Scholar] [CrossRef] [PubMed] [Green Version]
- Capovilla, G.; Pajoro, A.; Immink, R.G.; Schmid, M. Role of alternative pre-mRNA splicing in temperature signaling. Curr. Opin. Plant Biol. 2015, 27, 97–103. [Google Scholar] [CrossRef] [PubMed]
- Kim, M.; Hersh, L.B.; Leissring, M.A.; Ingelsson, M.; Matsui, T.; Farris, W.; Lu, A.; Hyman, B.T.; Selkoe, D.J.; Bertram, L.; et al. Decreased Catalytic Activity of the Insulin-degrading Enzyme in Chromosome 10-Linked Alzheimer Disease Families. J. Biol. Chem. 2007, 282, 7825–7832. [Google Scholar] [CrossRef] [Green Version]
- Kuramata, M.; Masuya, S.; Takahashi, Y.; Kitagawa, E.; Inoue, C.; Ishikawa, S.; Youssefian, S.; Kusano, T. Novel Cysteine-Rich Peptides from Digitaria ciliaris and Oryza sativa Enhance Tolerance to Cadmium by Limiting its Cellular Accumulation. Plant Cell Physiol. 2009, 50, 106–117. [Google Scholar] [CrossRef] [PubMed] [Green Version]
- Li, Y.; Kabbage, M.; Liu, W.; Dickman, M.B. Aspartyl Protease-Mediated Cleavage of BAG6 Is Necessary for Autophagy and Fungal Resistance in Plants. Plant Cell 2016, 28, 233–247. [Google Scholar] [CrossRef] [Green Version]
- Ostertag, M.; Stammler, J.; Douchkov, D.; Eichmann, R.; Hückelhoven, R. The conserved oligomeric Golgi complex is involved in penetration resistance of barley to the barley powdery mildew fungus. Mol. Plant Pathol. 2013, 14, 230–240. [Google Scholar] [CrossRef]
- Zhang, L.; Tian, L.-H.; Zhao, J.-F.; Song, Y.; Zhang, C.-J.; Guo, Y. Identification of an Apoplastic Protein Involved in the Initial Phase of Salt Stress Response in Rice Root by Two-Dimensional Electrophoresis. Plant Physiol. 2009, 149, 916–928. [Google Scholar] [CrossRef] [Green Version]
- Stirpe, F. Ribosome-inactivating proteins: From toxins to useful proteins. Toxicon 2013, 67, 12–16. [Google Scholar] [CrossRef]
- Tian, S.; Muneeruddin, K.; Choi, M.Y.; Tao, L.; Bhuiyan, R.H.; Ohmi, Y.; Furukawa, K.; Furukawa, K.; Boland, S.; Shaffer, S.A.; et al. Genome-wide CRISPR screens for Shiga toxins and ricin reveal Golgi proteins critical for glycosylation. PLoS Biol. 2018, 16, e2006951. [Google Scholar] [CrossRef] [PubMed] [Green Version]
- Walley, J.W.; Kelley, D.R.; Nestorova, G.; Hirschberg, D.L.; Dehesh, K. Arabidopsis Deadenylases AtCAF1a and AtCAF1b Play Overlapping and Distinct Roles in Mediating Environmental Stress Responses. Plant Physiol. 2010, 152, 866–875. [Google Scholar] [CrossRef] [PubMed] [Green Version]
- Hsu, K.; Liu, C.; Wu, S.; Kuo, Y.; Lu, C.; Wu, C.; Lian, P.; Hong, C.; Ke, Y.; Huang, J.; et al. Expression of a gene encoding a rice RING zinc-finger protein, OsRZFP34, enhances stomata opening. Plant Mol. Biol. 2014, 86, 125–137. [Google Scholar] [CrossRef]
- Jia, F.; Wan, X.; Zhu, W.; Sun, D.; Zheng, C.; Liu, P.; Huang, J. Overexpression of Mitochondrial Phosphate Transporter 3 Severely Hampers Plant Development through Regulating Mitochondrial Function in Arabidopsis. PLoS ONE 2015, 10, e0129717. [Google Scholar] [CrossRef]
- Jamann, T.M.; Luo, X.; Morales, L.; Kolkman, J.M.; Chung, C.L.; Nelson, R.J. A remorin gene is implicated in quantitative disease resistance in maize. Theor. Appl. Genet. 2016, 129, 591–602. [Google Scholar] [CrossRef]
- Iglesias-Fernández, R.; Rodríguez-Gacio, M.C.; Barrero-Sicilia, C.; Carbonero, P.; Matilla, A. Three endo-β-mannanase genes expressed in the micropylar endosperm and in the radicle influence germination of Arabidopsis thaliana seeds. Planta 2011, 233, 25–36. [Google Scholar] [CrossRef] [Green Version]
- Qi, Y.; Liu, Y.; Zhang, Z.; Gao, J.; Guan, Z.; Fang, W.; Chen, S.; Chen, F.; Jiang, J. The over-expression of a chrysanthemum gene encoding an RNA polymerase II CTD phosphatase-like 1 enzyme enhances tolerance to heat stress. Hortic. Res. 2018, 5, 37. [Google Scholar] [CrossRef]
- Newell, M.A.; Cook, D.; Tinker, N.A.; Jannink, J.-L. Population structure and linkage disequilibrium in oat (Avena sativa L.): Implications for genome-wide association studies. Theor. Appl. Genet. 2011, 122, 623–632. [Google Scholar] [CrossRef] [PubMed]
- Morosini, J.S.; de Freitas Mendonça, L.; Lyra, D.H.; Galli, G.; Vidotti, M.S.; Fritsche-Neto, R. Association mapping for traits related to nitrogen use efficiency in tropical maize lines under field conditions. Plant Soil 2017, 421, 453–463. [Google Scholar] [CrossRef]
- Wang, M.; Yan, J.; Zhao, J.; Song, W.; Zhang, X.; Xiao, Y.; Zheng, Y. Genome-wide association study (GWAS) of resistance to head smut in maize. Plant Sci. 2012, 196, 125–131. [Google Scholar] [CrossRef]
- Viana, J.M.S.; e Silva, F.F.; Mundim, G.B.; Azevedo, C.F.; Jan, H.U. Efficiency of low heritability QTL mapping under high SNP density. Euphytica 2017, 213, 13. [Google Scholar] [CrossRef]
- Arnhold, E.; Mora, F.; Silva, R.G.; Good-God, P., IV; Rodovalho, M.A. Evaluation of top-cross popcorn hybrids using Mixed Linear Model methodology. Chil. J. Agric. Res. 2009, 69, 46–53. [Google Scholar] [CrossRef] [Green Version]
- Soni, N.V.; Khanorkar, S.M. Genetic architecture of yield traits and popping quality in popcorn (Zea mays var. everta) inbred lines. Electron. J. Plant Breed. 2014, 5, 11–16. [Google Scholar]
- de Rodovalho, M.A.; Mora, F.; dos Santos, E.M.; Scapim, C.A.; Arnhold, E. Heredabilidad de la sobrevivencia en 169 familias de maíz-roseta de granos blancos: Un enfoque Bayesiano. Int. J. Agric. Nat. Resour. 2008, 35, 303–309. [Google Scholar] [CrossRef] [Green Version]
- Ribeiro, R.M.; do Amaral Júnior, A.T.; Gonçalves, L.S.A.; Candido, L.S.; Silva, T.R.C.; Pena, G.F. Genetic progress in the UNB-2U population of popcorn under recurrent selection in Rio de Janeiro, Brazil. Genet. Mol. Res. 2012, 11, 1417–1423. [Google Scholar] [CrossRef]
- Ribeiro, R.M.; do Amaral Júnior, A.T.; Pena, G.F.; Vivas, M.; Kurosawa, R.N.; Gonçalves, L.S.A. Effect of recurrent selection on the variability of the UENF-14 popcorn population. Crop Breed. Appl. Biotechnol. 2016, 16, 123–131. [Google Scholar] [CrossRef]
- Guimarães, A.G.; do Amaral Júnior, A.T.; Pena, G.F.; de Almeida filho, J.E.; Pereira, M.G.; Santos, P.H.A.D. Genetic gains in the popcorn population UENF-14: Developing the ninth generation of intrapopulation recurrent selection. Rev. Caatinga 2019, 32, 625–633. [Google Scholar] [CrossRef]
- Yu, Y.; Zhao, Z.; Shi, Y.; Tian, H.; Liu, L.; Bian, X.; Xu, Y.; Zheng, X.; Gan, L.; Shen, Y.; et al. Hybrid Sterility in Rice (Oryza sativa L.) Involves the Tetratricopeptide Repeat Domain Containing Protein. Genetics 2016, 203, 1439–1451. [Google Scholar] [CrossRef] [PubMed] [Green Version]
- Sharma, M.; Pandey, G.K. Expansion and Function of Repeat Domain Proteins During Stress and Development in Plants. Front. Plant Sci. 2016, 6, 1218. [Google Scholar] [CrossRef] [PubMed] [Green Version]
- Awasthi, A.; Paul, P.; Kumar, S.; Verma, S.K.; Prasad, R.; Dhaliwal, H.S. Abnormal endosperm development causes female sterility in rice insertional mutant OsAPC6. Plant Sci. 2012, 183, 167–174. [Google Scholar] [CrossRef]
- Wu, Y.; Pu, C.; Lin, H.; Huang, H.; Huang, Y.; Hong, C.; Chang, M.; Lin, Y. Three novel alleles of FLOURY ENDOSPERM2 (FLO2 ) confer dull grains with low amylose content in rice. Plant Sci. 2015, 233, 44–52. [Google Scholar] [CrossRef] [PubMed] [Green Version]
- She, K.-C.; Kusano, H.; Koizumi, K.; Yamakawa, H.; Hakata, M.; Imamura, T.; Fukuda, M.; Naito, N.; Tsurumaki, Y.; Yaeshima, M.; et al. A Novel Factor FLOURY ENDOSPERM2 Is Involved in Regulation of Rice Grain Size and Starch Quality. Plant Cell 2010, 22, 3280–3294. [Google Scholar] [CrossRef] [Green Version]
- Liu, C.; Zhang, T. Expansion and stress responses of the AP2/EREBP superfamily in cotton. BMC Genom. 2017, 18, 118. [Google Scholar] [CrossRef] [Green Version]
- Zhang, M.; Chen, Y.; Jin, X.; Cai, Y.; Yuan, Y.; Fu, C.; Yu, L. New different origins and evolutionary processes of AP2/EREBP transcription factors in Taxus chinensis. BMC Plant Biol. 2019, 19, 413. [Google Scholar] [CrossRef] [Green Version]
- Khan, M.B.; Hussain, N.; Iqbal, M. Effect of water stress on growth and yield components of maize variety YHS 202. J. Res. 2001, 12, 15–18. [Google Scholar]
- Borrmann, D.; de Junqueira, R.M.; Sinnecker, P.; de Gomes, M.S.O.; Castro, I.A.; Marquez, U.M.L. Chemical and biochemical characterization of soybean produced under drought stress. Ciência Tecnol. Aliment. 2009, 29, 676–681. [Google Scholar] [CrossRef] [Green Version]
- Terra, T.G.R.; de Leal, T.C.A.B.; Borém, A.; Rangel, P.H.N. Tolerância de linhagens de arroz de terras altas à seca. Pesqui. Agropecuária Trop. 2013, 43, 201–208. [Google Scholar] [CrossRef]
- Zain, N.A.M.; Ismail, M.R.; Puteh, A.; Mahmood, M.; Islam, M.R. Impact of cyclic water stress on growth, physiological responses and yield of rice (Oryza sativa L.) grown in tropical environment. Ciência Rural 2014, 44, 2136–2141. [Google Scholar] [CrossRef] [Green Version]
- Kamphorst, S.H.; Lima, V.J.; Schimitt, K.F.M.; Leite, J.T.; Azeredo, V.C.; Pena, G.F.; Santos, P.H.A.D.; Júnior, D.R.S.; da Júnior, S.B.S.; Bispo, R.B.; et al. Water stress adaptation of popcorn roots and association with agronomic traits. Genet. Mol. Res. 2018, 17, 1–14. [Google Scholar] [CrossRef]
- Zheng, K.; Ni, Z.; Qu, Y.; Cai, Y.; Yang, Z.; Sun, G.; Chen, Q. Genome-wide identification and expression analyses of TCP transcription factor genes in Gossypium barbadense. Sci. Rep. 2018, 8, 14526. [Google Scholar] [CrossRef] [PubMed]
- Koyama, T.; Furutani, M.; Tasaka, M.; Ohme-Takagi, M. TCP Transcription Factors Control the Morphology of Shoot Lateral Organs via Negative Regulation of the Expression of Boundary-Specific Genes in Arabidopsis. Plant Cell 2007, 19, 473–484. [Google Scholar] [CrossRef] [PubMed] [Green Version]
- Parapunova, V.; Busscher, M.; Busscher-Lange, J.; Lammers, M.; Karlova, R.; Bovy, A.G.; Angenent, G.C.; de Maagd, R.A. Identification, cloning and characterization of the tomato TCP transcription factor family. BMC Plant Biol. 2014, 14, 157. [Google Scholar] [CrossRef] [PubMed] [Green Version]
- Koteyeva, N.K.; Voznesenskaya, E.V.; Edwards, G.E. An assessment of the capacity for phosphoenolpyruvate carboxykinase to contribute to C4 photosynthesis. Plant Sci. 2015, 235, 70–80. [Google Scholar] [CrossRef]
- Qin, N.; Xu, W.; Hu, L.; Li, Y.; Wang, H.; Qi, X.; Fang, Y.; Hua, X. Drought tolerance and proteomics studies of transgenic wheat containing the maize C4 phosphoenolpyruvate carboxylase (PEPC) gene. Protoplasma 2016, 253, 1503–1512. [Google Scholar] [CrossRef]
- Hu, L.; Li, Y.; Xu, W.; Zhang, Q.; Zhang, L.; Qi, X.; Dong, H. Improvement of the photosynthetic characteristics of transgenic wheat plants by transformation with the maize C4 phosphoenolpyruvate carboxylase gene. Plant Breed. 2012, 131, 385–391. [Google Scholar] [CrossRef]
- Leegood, R.C.; Walker, R.P. Regulation and roles of phosphoenolpyruvate carboxykinase in plants. Arch. Biochem. Biophys. 2003, 414, 204–210. [Google Scholar] [CrossRef]
- Xu, M.; Li, L.; Fan, Y.; Wan, J.; Wang, L. ZmCBF3 overexpression improves tolerance to abiotic stress in transgenic rice (Oryza sativa) without yield penalty. Plant Cell Rep. 2011, 30, 1949–1957. [Google Scholar] [CrossRef]
- Xu, Y.; Yu, Z.; Zhang, D.; Huang, J.; Wu, C.; Yang, G.; Yan, K.; Zhang, S.; Zheng, C. CYSTM, a Novel Non-Secreted Cysteine-Rich Peptide Family, Involved in Environmental Stresses in Arabidopsis thaliana. Plant Cell Physiol. 2018, 59, 423–438. [Google Scholar] [CrossRef] [Green Version]
- Zhu, W.; Miao, Q.; Sun, D.; Yang, G.; Wu, C.; Huang, J.; Zheng, C. The Mitochondrial Phosphate Transporters Modulate Plant Responses to Salt Stress via Affecting ATP and Gibberellin Metabolism in Arabidopsis thaliana. PLoS ONE 2012, 7, e43530. [Google Scholar] [CrossRef] [Green Version]
- Climate Data for Cities Worldwide—Climate-Data.org. OpenStreetMap Contributor. Available online: https://en.climate-data.org/amerika-selatan/brasil/rio-de-janeiro-208/ (accessed on 11 August 2021).
- Fontes, P.S.F.; Carvalho, A.J.C.D.; Cereja, B.S.; Marinho, C.S.; Monnerat, P.H. Avaliação do estado nutricional e do desenvolvimento da bananeira-prata-anã (Musa spp.) em função da adubação nitrogenada. Rev. Bras. Frutic. 2003, 25, 156–159. [Google Scholar] [CrossRef] [Green Version]
- Amaral Júnior, A.T.; Gonçalves, L.S.A.; de Freitas Júnior, S.P.; Candido, L.S.; Vittorazzi, C.; Pena, G.F.; Ribeiro, R.M.; da Silva, T.R.C.; Pereira, M.G.; Scapim, C.A.; et al. UENF 14: A new popcorn cultivar. Crop Breed. Appl. Biotechnol. 2013, 13, 218–220. [Google Scholar] [CrossRef] [Green Version]
- Daros, M.; do Amaral Júnior, A.T.; Pereira, M.G. Genetic gain for grain yield and popping expansion in full-sib recurrent selection in popcorn. Crop Breed. Appl. Biot. 2002, 2, 339–344. [Google Scholar] [CrossRef]
- Daros, M.; Amaral, A.T.D., Jr.; Pereira, M.G.; Santos, F.S.; Gabriel, A.P.C.; Scapim, C.A.; Freitas Júnior, S.D.P.; Silvério, L. Recurrent selection in inbred popcorn families. Sci. Agr. 2004, 61, 609–614. [Google Scholar] [CrossRef]
- Santos, F.S.; Amaral Júnior, A.T.D.; Freitas Júnior, S.D.P.; Rangel, R.M.; Pereira, M.G. Predição de ganhos genéticos por índices de seleção na população de milho pipoca UNB-2U sob seleção recorrente. Bragantia 2007, 66, 389–396. [Google Scholar] [CrossRef] [Green Version]
- Freitas, S.P., Jr.; Amaral Juniot, A.T.; Rangel, R.M.; Viana, A.P. Genetic gains in popcorn by full-sib recurrent selection. Crop. Breed. Appl. Biotechnol. 2009, 9, 1–7. [Google Scholar] [CrossRef]
- Rangel, R.M.; doAmaral Júnior, T.; Gonçalves, L.S.; Freitas Júnior, S.D.; Candido, L.S. Biometric analysis of selection gains in popcorn population of the fifth cycle of recurrent selection. Rev. Cienc. Agron. 2011, 42, 473. [Google Scholar] [CrossRef] [Green Version]
- Freitas, I.L.J.; Amaral Júnior, A.T.; Freitas Júnior, S.P.; Cabral, P.D.S.; Ribeiro, R.M.; Goncalves, L.S.A. Genetic gains in the UENF-14 popcorn population with recurrent selection. Genet. Mol. Res. 2014, 13, 518–527. [Google Scholar] [CrossRef] [PubMed]
- Bates, D.; Mächler, M.; Bolker, B.; Walker, S. Fitting Linear Mixed-Effects Models Using lme4. J. Stat. Softw. 2015, 67, 1–51. [Google Scholar] [CrossRef]
- R Core Team, R. A Language and Environment for Statistical Computing; R Core Team R: Vienna, Austria, 2016. [Google Scholar]
- Lenth, R.V. Least-Squares Means: The R Package lsmeans. J. Stat. Softw. 2016, 69, 1–33. [Google Scholar] [CrossRef] [Green Version]
- Doyle, J.J.; Doyle, J.L. Isolation of plant DNA from fresh tissue. Focus 1990, 12, 13–15. [Google Scholar]
- Endelman, J.B. Ridge Regression and Other Kernels for Genomic Selection with R Package rrBLUP. Plant Genome J. 2011, 4, 250. [Google Scholar] [CrossRef] [Green Version]
- VanRaden, P.M. Efficient Methods to Compute Genomic Predictions. J. Dairy Sci. 2008, 91, 4414–4423. [Google Scholar] [CrossRef] [Green Version]
- Purcell, S.; Neale, B.; Todd-Brown, K.; Thomas, L.; Ferreira, M.A.R.; Bender, D.; Maller, J.; Sklar, P.; de Bakker, P.I.W.; Daly, M.J.; et al. PLINK: A Tool Set for Whole-Genome Association and Population-Based Linkage Analyses. Am. J. Hum. Genet. 2007, 81, 559–575. [Google Scholar] [CrossRef] [PubMed] [Green Version]
- Hill, W.G.; Weir, B.S. Variances and covariances of squared linkage disequilibria in finite populations. Theor. Popul. Biol. 1988, 33, 54–78. [Google Scholar] [CrossRef]
- Clifford, D.; McCullagh, P. The Regress Package; R Package Version; R Core Team R: Vienna, Austria, 2012; pp. 1–3. [Google Scholar]
- Schnable, P.S.; Ware, D.; Fulton, R.S.; Stein, J.C.; Wei, F.; Pasternak, S.; Liang, C.; Zhang, J.; Fulton, L.; Graves, T.A.; et al. The B73 Maize Genome: Complexity, Diversity, and Dynamics. Science 2009, 326, 1112–1115. [Google Scholar] [CrossRef] [Green Version]


| Trait | * Chrom. | Minor-Major Position (Base Pairs) | Gene ID | Annotation | Putative Function |
|---|---|---|---|---|---|
| GY | 1 | 48905387-49005387 | GRMZM2G003984 | Lon-like ATP-dependent protease | Seed germination [28] |
| GY | 1 | 56805387-56905387 | GRMZM2G069618 | TPR domain-containing protein | Plant development [29] |
| GY | 1 | 56855387-56955387 | GRMZM2G353147 | GTP diphosphokinase/stringent factor | Plant fertilization [30] |
| GY | 6 | 165623194-165723194 | GRMZM5G846343 | Protein of unknown function | ** NA |
| GRMZM5G846057 | AP2 domain (AP2) | Growth and development of plant tissues [31] | |||
| GY | 2 | 225088849-225188849 | GRMZM2G037993 | Respiratory burst oxidase homolog protein a-related | Root development [32] |
| GRMZM2G015945 | Respiratory burst oxidase homolog protein b | Pathogen resistance [33] | |||
| GY | 2 | 225138849-225238849 | GRMZM2G414114 | Dnaj domain (dnaj) //TCP family transcription factor (TCP)//transposase-associated domain | Growth of axillary organs and corn ear formation [34] |
| GRMZM2G114948 | Plant protein of unknown function | ** NA | |||
| GRMZM2G023328 | Arginine and glutamate-rich protein 1 (ARGLU1) | ** NA | |||
| GRMZM2G023585 | Hira-interacting protein 3 | ** NA | |||
| GY | 4 | 219528603-219628603 | GRMZM2G043242 | Zinc finger cw-type coiled-coil domain protein 3 | Plant immunity to disease [35] |
| GY | 4 | 219578603-219678603 | GRMZM2G109159 | Reticulon-like protein | Seed filling [36] |
| PE | 2 | 13388849-13488849 | GRMZM5G886913 | Predicted membrane protein | Essential for many functions [37] |
| GRMZM2G051958 | Phosphoenolpyruvate carboxykinase ATP | Involved in the coating of seeds and cotyledons [38] | |||
| GRMZM2G354053 | Myosin heavy chain-related// | Movement of the Golgi complex and mitochondria in plant cells [39]. | |||
| GRMZM5G866405 | Isoleucine--tRNA ligase/Isoleucyl-tRNA synthetase | ** NA | |||
| GRMZM5G899760 | GDP dissociation inhibitor (GDI)//transcription initiation factor IIA, | Pollen germination and tube growth [40] | |||
| GRMZM2G059791 | 2-keto-3-deoxy-l-rhamnonate aldolase | ** NA | |||
| GRMZM2G359331 | Myosin heavy chain-related | Movement of the Golgi complex and mitochondria in plant cells [39] | |||
| AC195235.3_FG003 | Phosphoglyceromutase | Concentration increase in iron-deficient Cucumis sativus L. roots [41] | |||
| PE | 5 | 13560296-13660296 | GRMZM2G461948 | Ubiquitin-protein ligase | ** NA |
| AC194618.2_FG008 | DNA(??) homolog subfamily c member | Cold tolerance in transgenic tomato plants [42] | |||
| PE | 5 | 13560296-13660296 | GRMZM2G461959 | Serine/threonine-protein phosphatase pp2a-1 catalytic | Expressed in stems, flowers, and roots of Oryza sativa [43] |
| GRMZM2G461936 | Translation initiation factor 2C (eif-2C) | Regulation of various aspects of plant development and their interactions with the environment [44] | |||
| GRMZM2G161242 | Protein Y55F3AM.3, isoform a | ** NA | |||
| GRMZM2G161222 | Serine/threonine-protein phosphatase 2a 57 kDa regulatory subunit β’ alpha isoform | Control of biotic and abiotic stress responses in plants [45] | |||
| GRMZM2G148130 | Ubiquitin-conjugating enzyme E2 16 | Maintenance of normal maize growth under stress conditions [46] | |||
| PE | 5 | 13610296-13710296 | GRMZM2G148098 | Homeobox protein transcription factors | Maintenance of adequate meristem and organ initiation [47] |
| GRMZM2G122185 | Pre-mRNA splicing factor | Temperature signaling in plants [48] | |||
| PH | 8 | 171723438-171823438 | GRMZM2G133249 | Insulysin (IDE, ide) | Beta-amyloid (Aβ) degradation [49] |
| GRMZM2G562929 | Proteasome subunit alpha type-4 | ** NA | |||
| GRMZM2G133175 | Cysteine-rich TM module stress tolerance (CYSTM) | Tolerance to heavy metals, such as cadmium and copper [50] | |||
| GRMZM2G133029 | Aspartyl protease family protein | Plant defense against fungi [51] | |||
| GRMZM2G132991 | Conserved oligomeric Golgi complex subunit 1 | Resistance penetration in barley by the barley mildew fungus [52] | |||
| GRMZM2G132978 | Pthr36737:sf1-expressed protein | ** NA | |||
| GRMZM2G434363 | Protein kinase domain (Pkinase)//salt stress response/antifungal (stress–antifungal) | Response to salt stress [53] |
| Trait | * Chrom. | Minor-Major Position (Base Pairs) | Gene ID | Annotation | Putative Function |
|---|---|---|---|---|---|
| EH | 7 | 115031917-115131917 | GRMZM2G022095 | rRNA N-glycosylase/rRNA N-glycosidase | Antiviral, antifungal, and insecticidal activities and their expression in plants are increased under stress conditions [54] |
| EH | 7 | 115081917-115181917 | GRMZM5G837058 | Golgi SNAP receptor complex member 1-1 | Transport from Golgi complex to the endoplasmic reticulum [55] |
| GRMZM2G071059 | CCR4-NOT transcription complex subunit 7/8 (CNOT7_8, CAF1, POP2) | Responses to abiotic stress [56] | |||
| EH | 4 | 178478603-178578603 | GRMZM2G170313 | Prolyl-tRNA synthetase associated domain-containing protein 1-related | ** NA |
| GRMZM2G473016 | Ring zinc finger protein | Increased stomatal opening [57] | |||
| GRMZM2G060630 | Solute carrier family 25 (mitochondrial phosphate transporter), member 3 | Normal growth and development of Arabidopsis [58] | |||
| GRMZM2G060554 | Remorin, C-terminal region (Remorin_C) | Resistance to helminthosporium in corn [59] | |||
| GRMZM2G356046 | Mannan endo-1,4-beta-mannosidase (MAN) | Seed germination [60] | |||
| GY | 2 | 200888849-200988849 | GRMZM2G024622 | RNA polymerase II ctd phosphatase | Increased tolerance to thermal stress [61] |
| Cycle | Reference | Strategy | PE (%) * | GY (%) * |
|---|---|---|---|---|
| 1° | Daros et al. [97] | Full-sib families | 10.39 | 4.69 |
| 2° | Daros et al. [98] | Inbred families (S1) | 17.8 | 26.95 |
| 3° | Santos et al. [99] | Half-sibling families | 7.16 | 10.00 |
| 4° | Freitas Júnior et al. [100] | Full-sib families | 10.58 | 7.71 |
| 5° | Rangel et al. [101] | Full-sib families | 6.01 | 8.53 |
| 6° | Ribeiro et al. [69] | Full-sib families | 10.97 | 15.30 |
| 7° | Freitas et al. [102] | Full-sib families | 5.11 | 7.78 |
| 8° | Guimarães et al. [71] | Full-sib families | 3.61 | 4.60 |
Publisher’s Note: MDPI stays neutral with regard to jurisdictional claims in published maps and institutional affiliations. |
© 2021 by the authors. Licensee MDPI, Basel, Switzerland. This article is an open access article distributed under the terms and conditions of the Creative Commons Attribution (CC BY) license (https://creativecommons.org/licenses/by/4.0/).
Share and Cite
Mafra, G.S.; de Almeida Filho, J.E.; do Amaral Junior, A.T.; Maldonado, C.; Kamphorst, S.H.; de Lima, V.J.; dos Santos Junior, D.R.; Leite, J.T.; Santos, P.H.A.D.; de Oliveira Santos, T.; et al. Regional Heritability Mapping of Quantitative Trait Loci Controlling Traits Related to Growth and Productivity in Popcorn (Zea mays L.). Plants 2021, 10, 1845. https://doi.org/10.3390/plants10091845
Mafra GS, de Almeida Filho JE, do Amaral Junior AT, Maldonado C, Kamphorst SH, de Lima VJ, dos Santos Junior DR, Leite JT, Santos PHAD, de Oliveira Santos T, et al. Regional Heritability Mapping of Quantitative Trait Loci Controlling Traits Related to Growth and Productivity in Popcorn (Zea mays L.). Plants. 2021; 10(9):1845. https://doi.org/10.3390/plants10091845
Chicago/Turabian StyleMafra, Gabrielle Sousa, Janeo Eustáquio de Almeida Filho, Antônio Teixeira do Amaral Junior, Carlos Maldonado, Samuel Henrique Kamphorst, Valter Jário de Lima, Divino Rosa dos Santos Junior, Jhean Torres Leite, Pedro Henrique Araujo Diniz Santos, Talles de Oliveira Santos, and et al. 2021. "Regional Heritability Mapping of Quantitative Trait Loci Controlling Traits Related to Growth and Productivity in Popcorn (Zea mays L.)" Plants 10, no. 9: 1845. https://doi.org/10.3390/plants10091845