
ROS-Scavenging Enzymes as an Antioxidant Response to High Concentration of Anthracene in the Liverwort Marchantia polymorpha L

 , , , , and
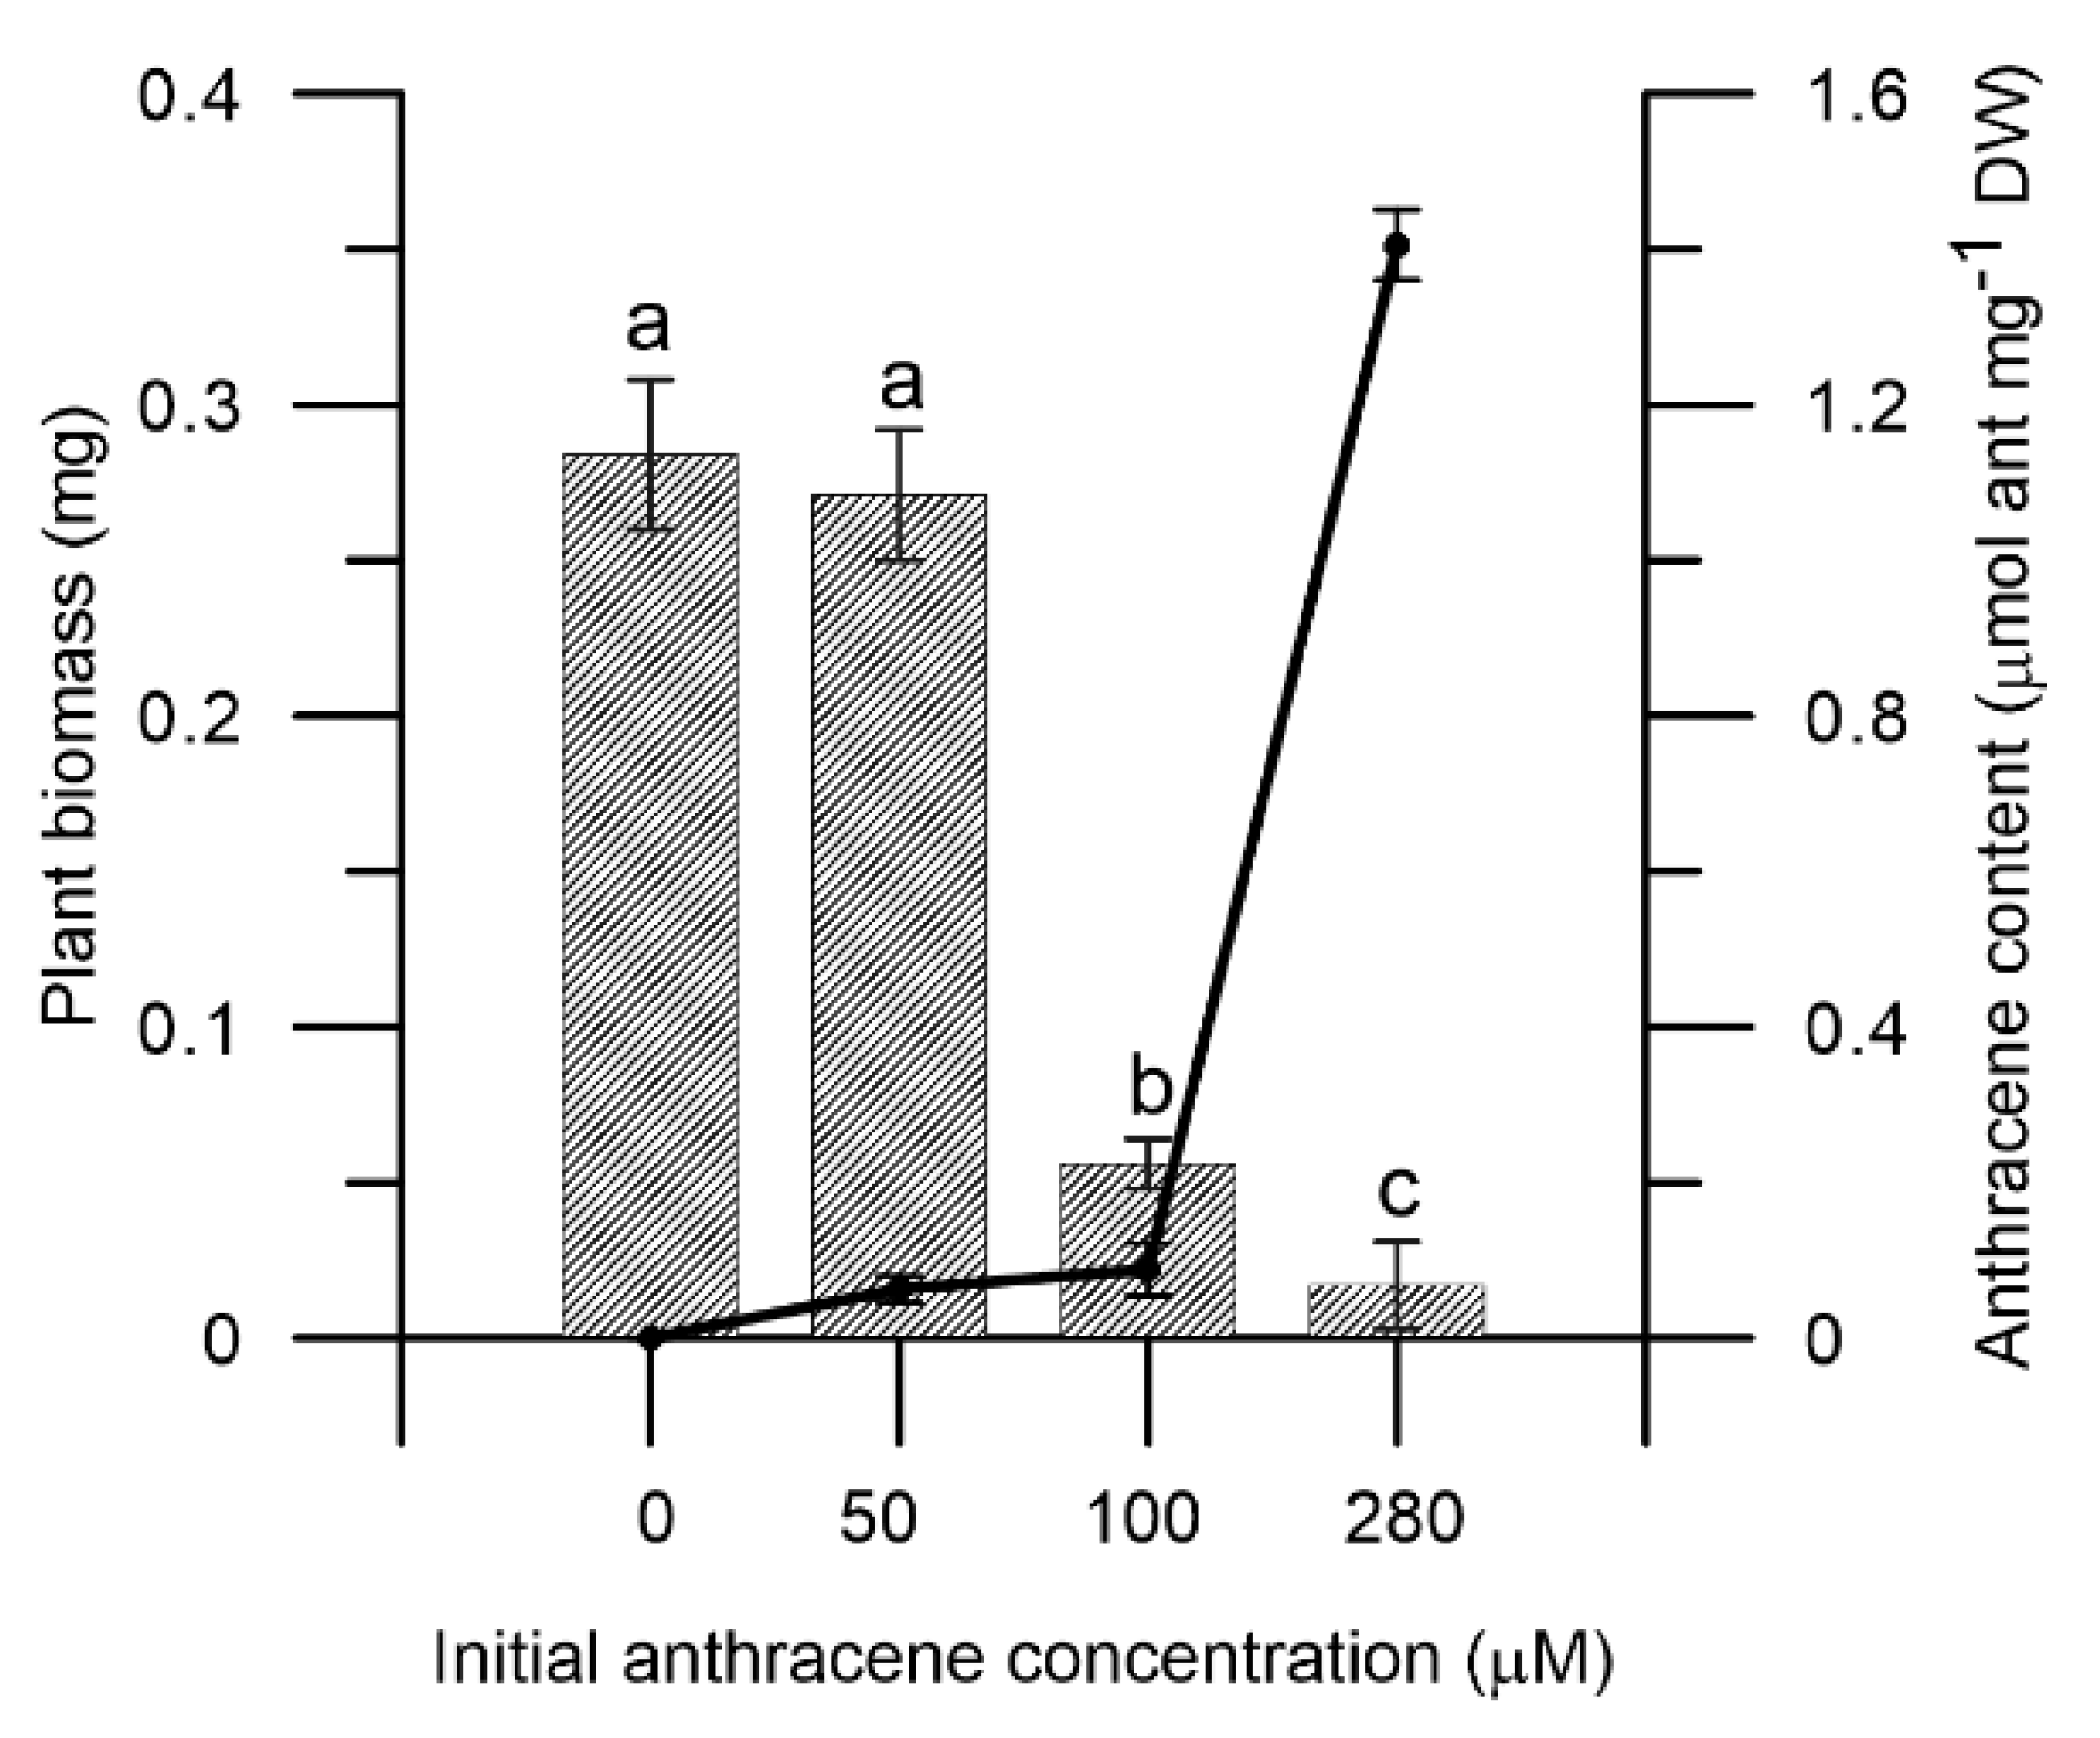
Abstract
:1. Introduction
2. Results
2.1. Effect of Anthracene on M. polymorpha Biomass and Anthracene Accumulation on the Tissues
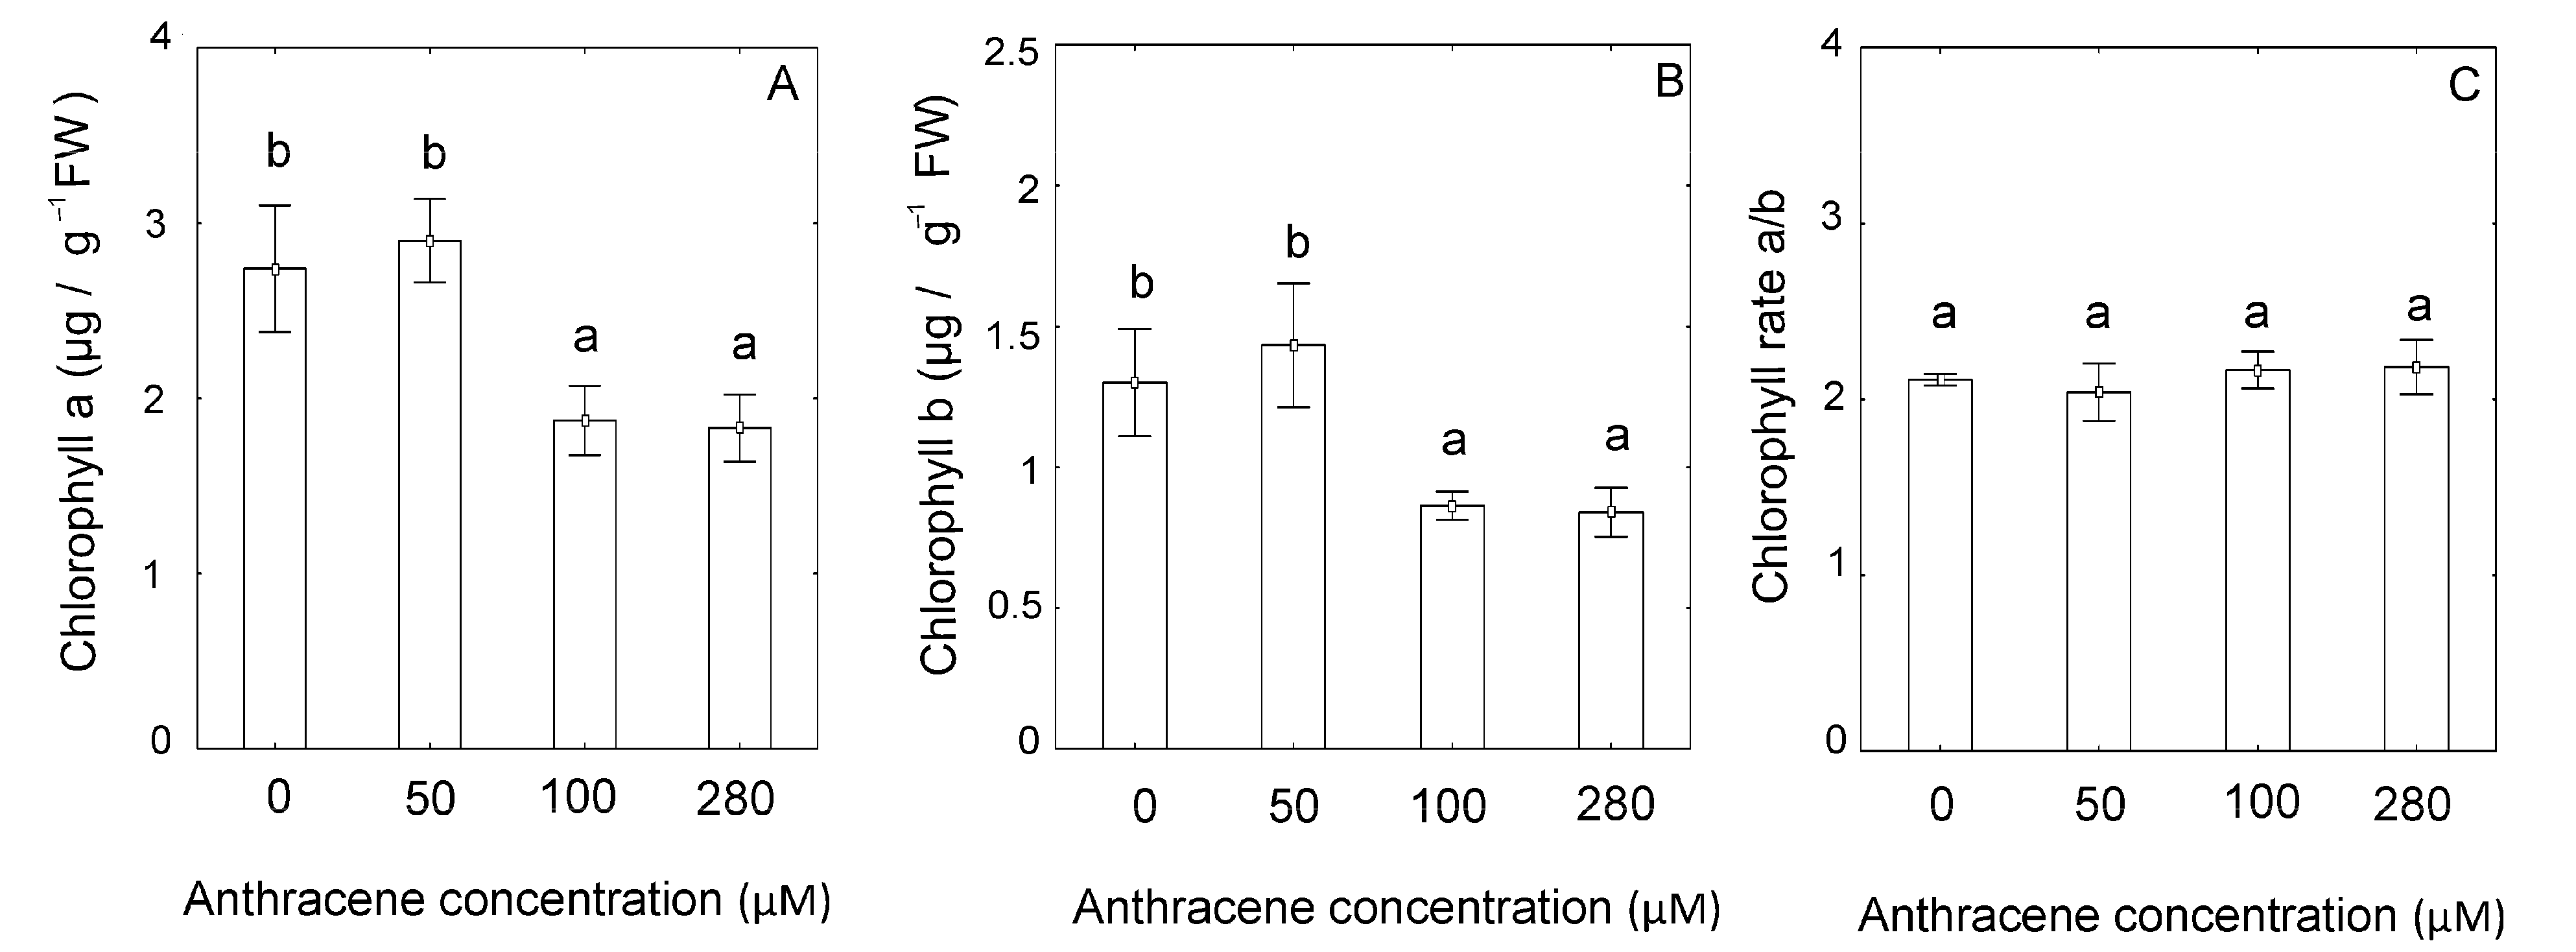
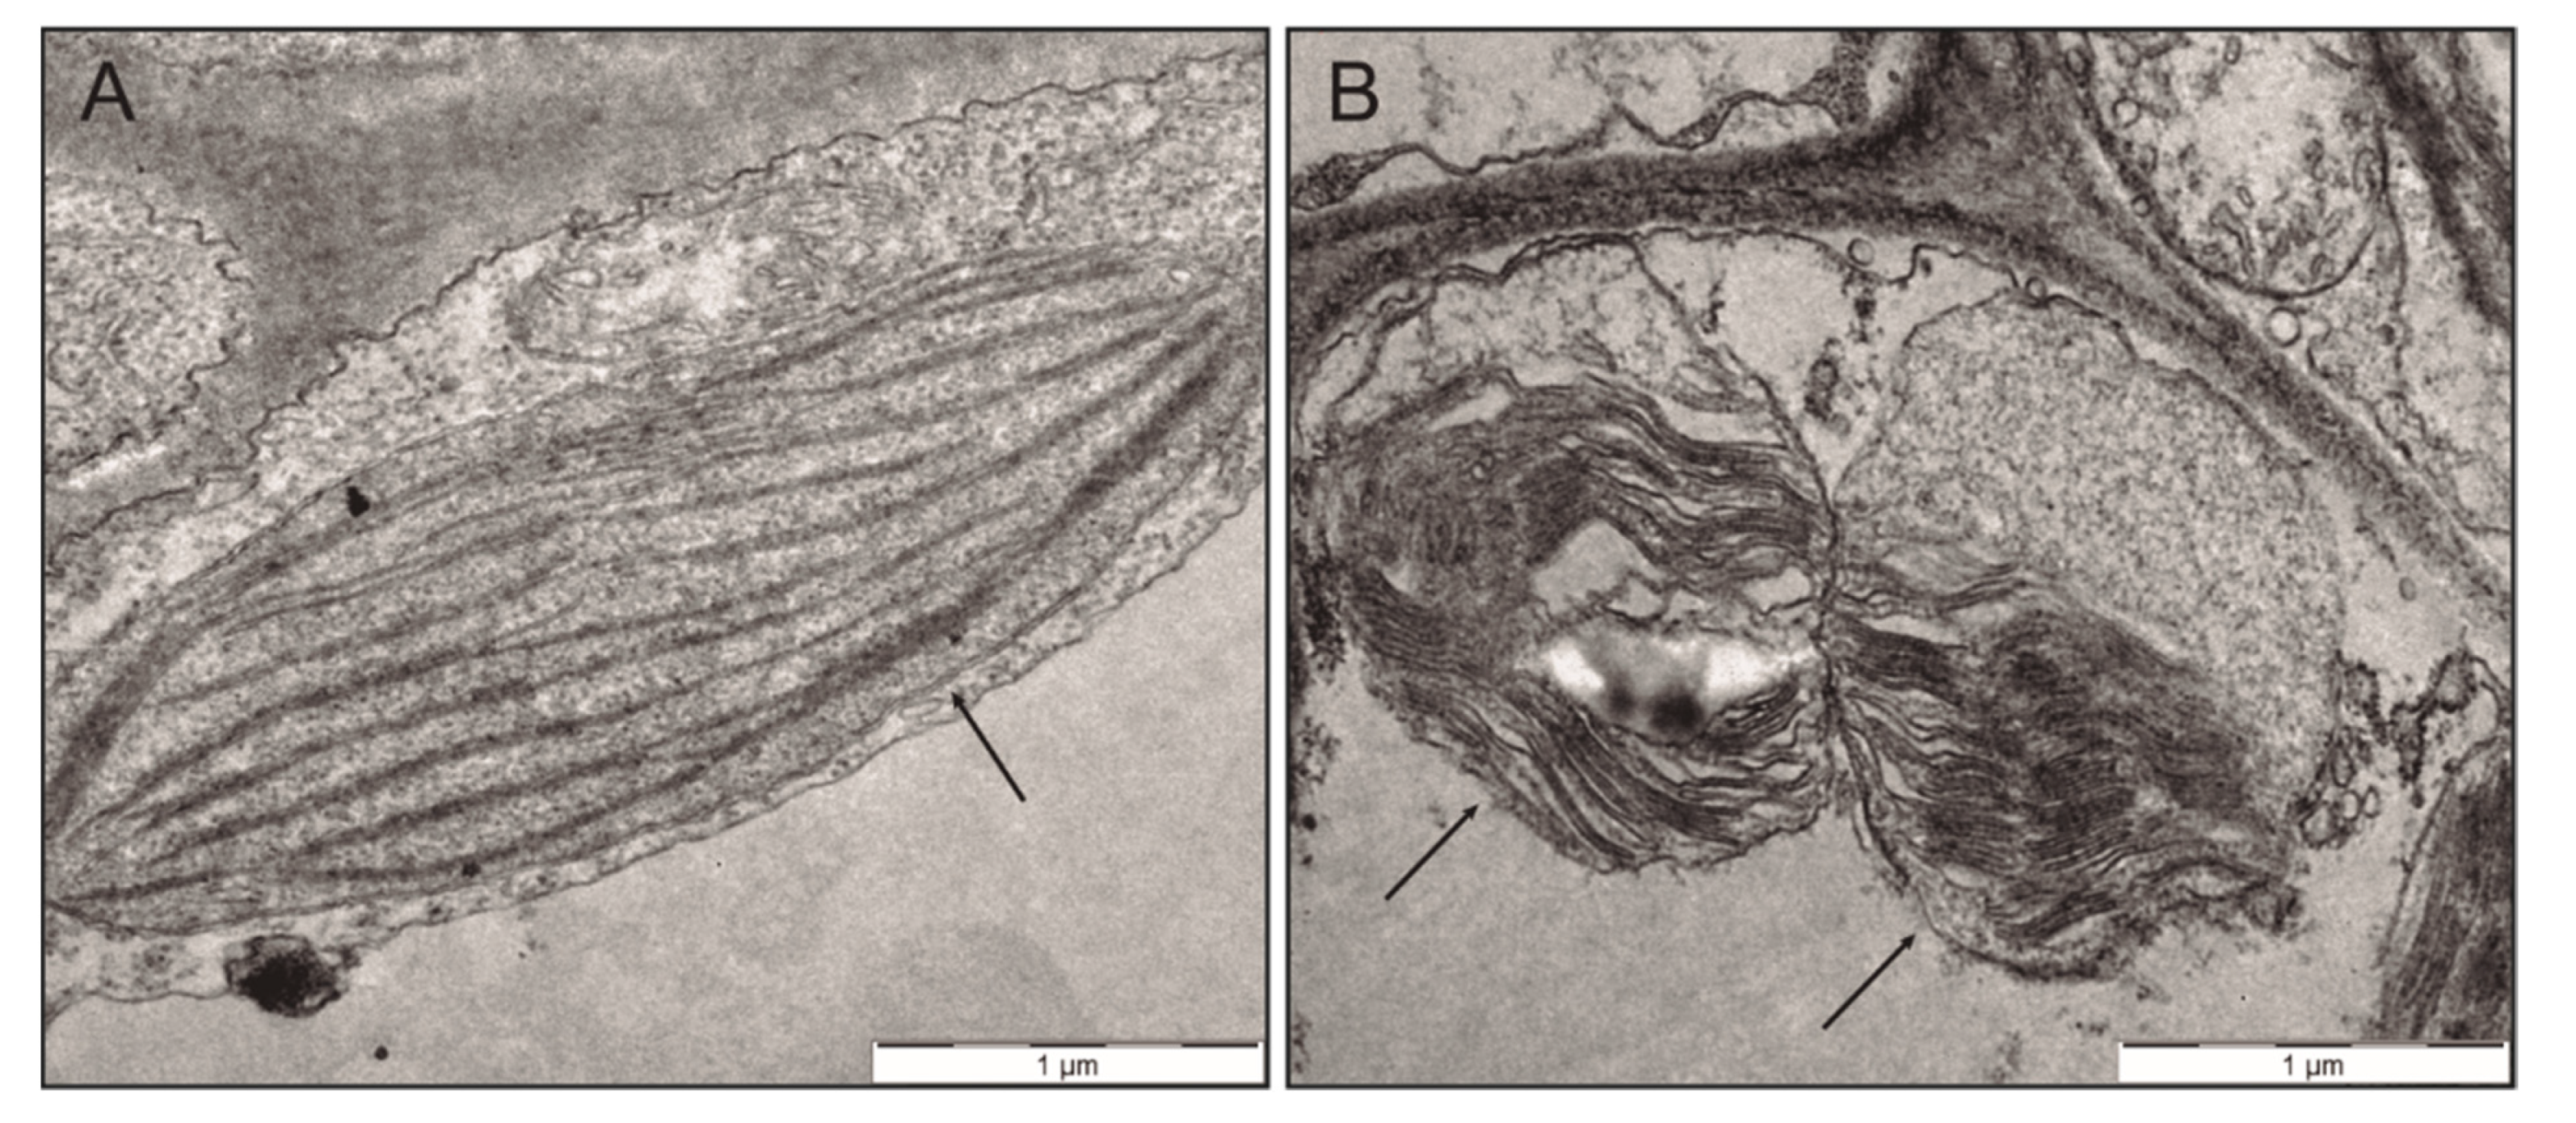
2.2. Effect of Anthracene on the Photosynthetic Apparatus and Chloroplast Ultrastructure
2.3. Anthracene Treatment Induced ROS-Scavenging Genes
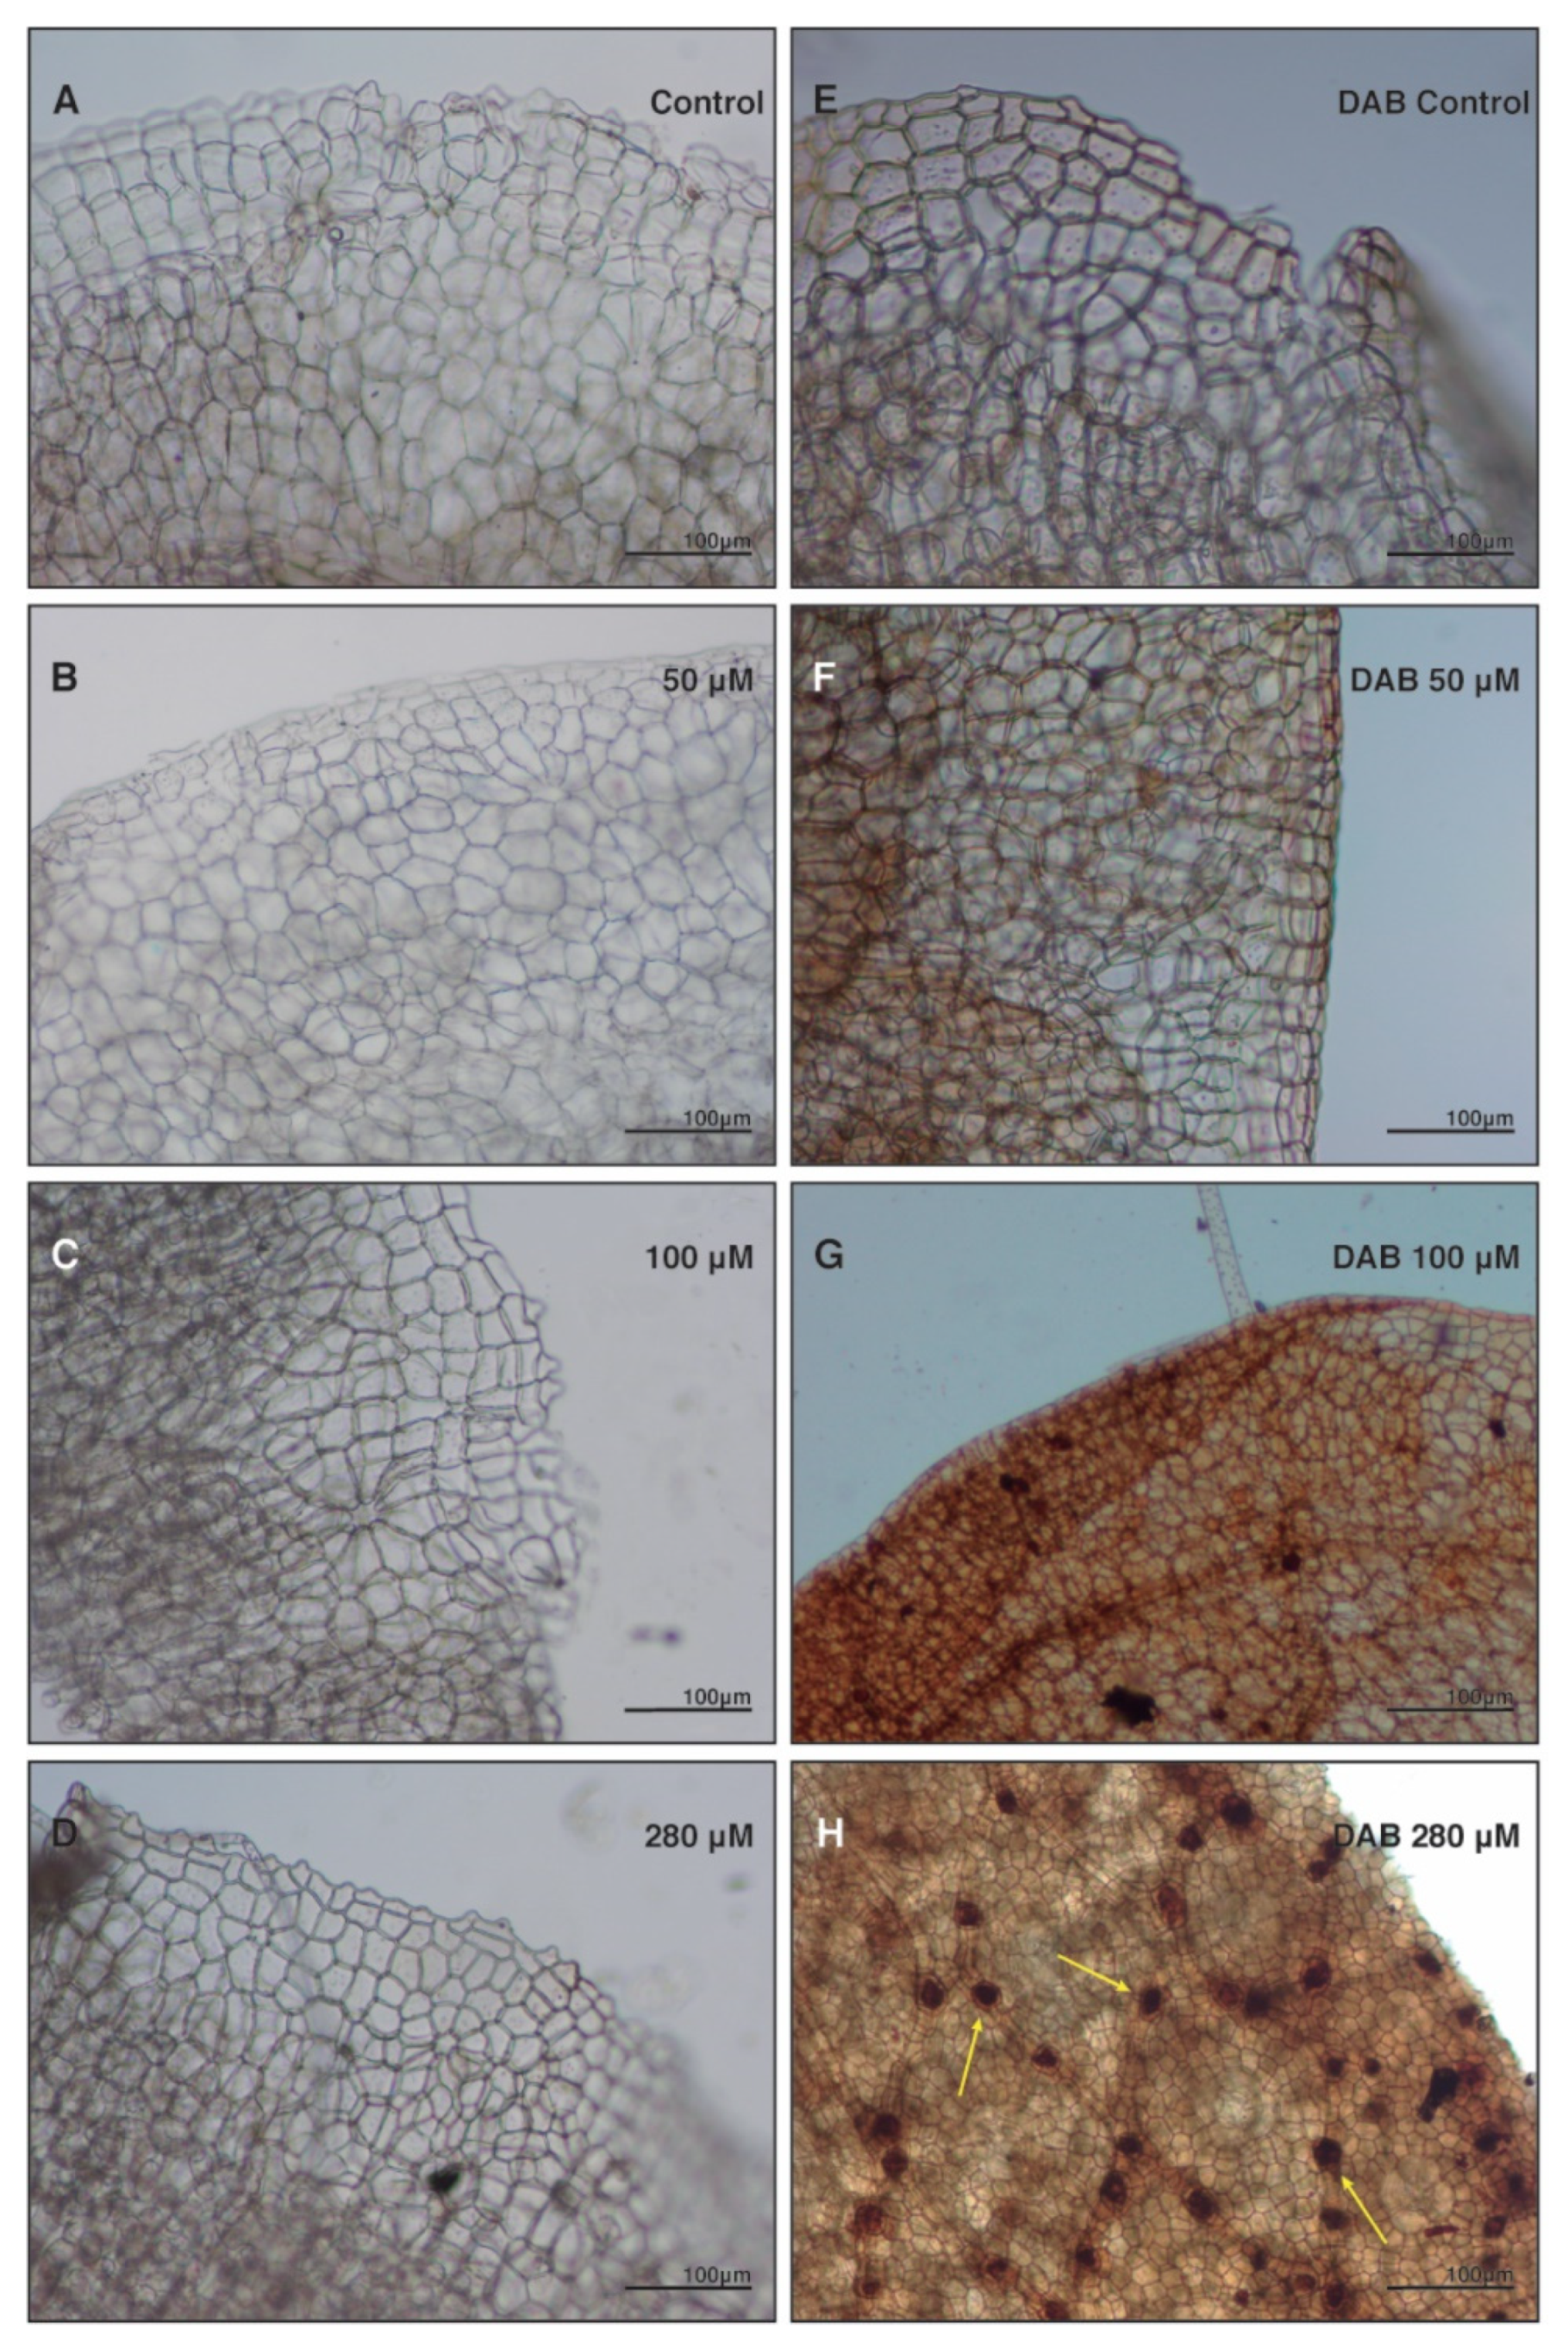
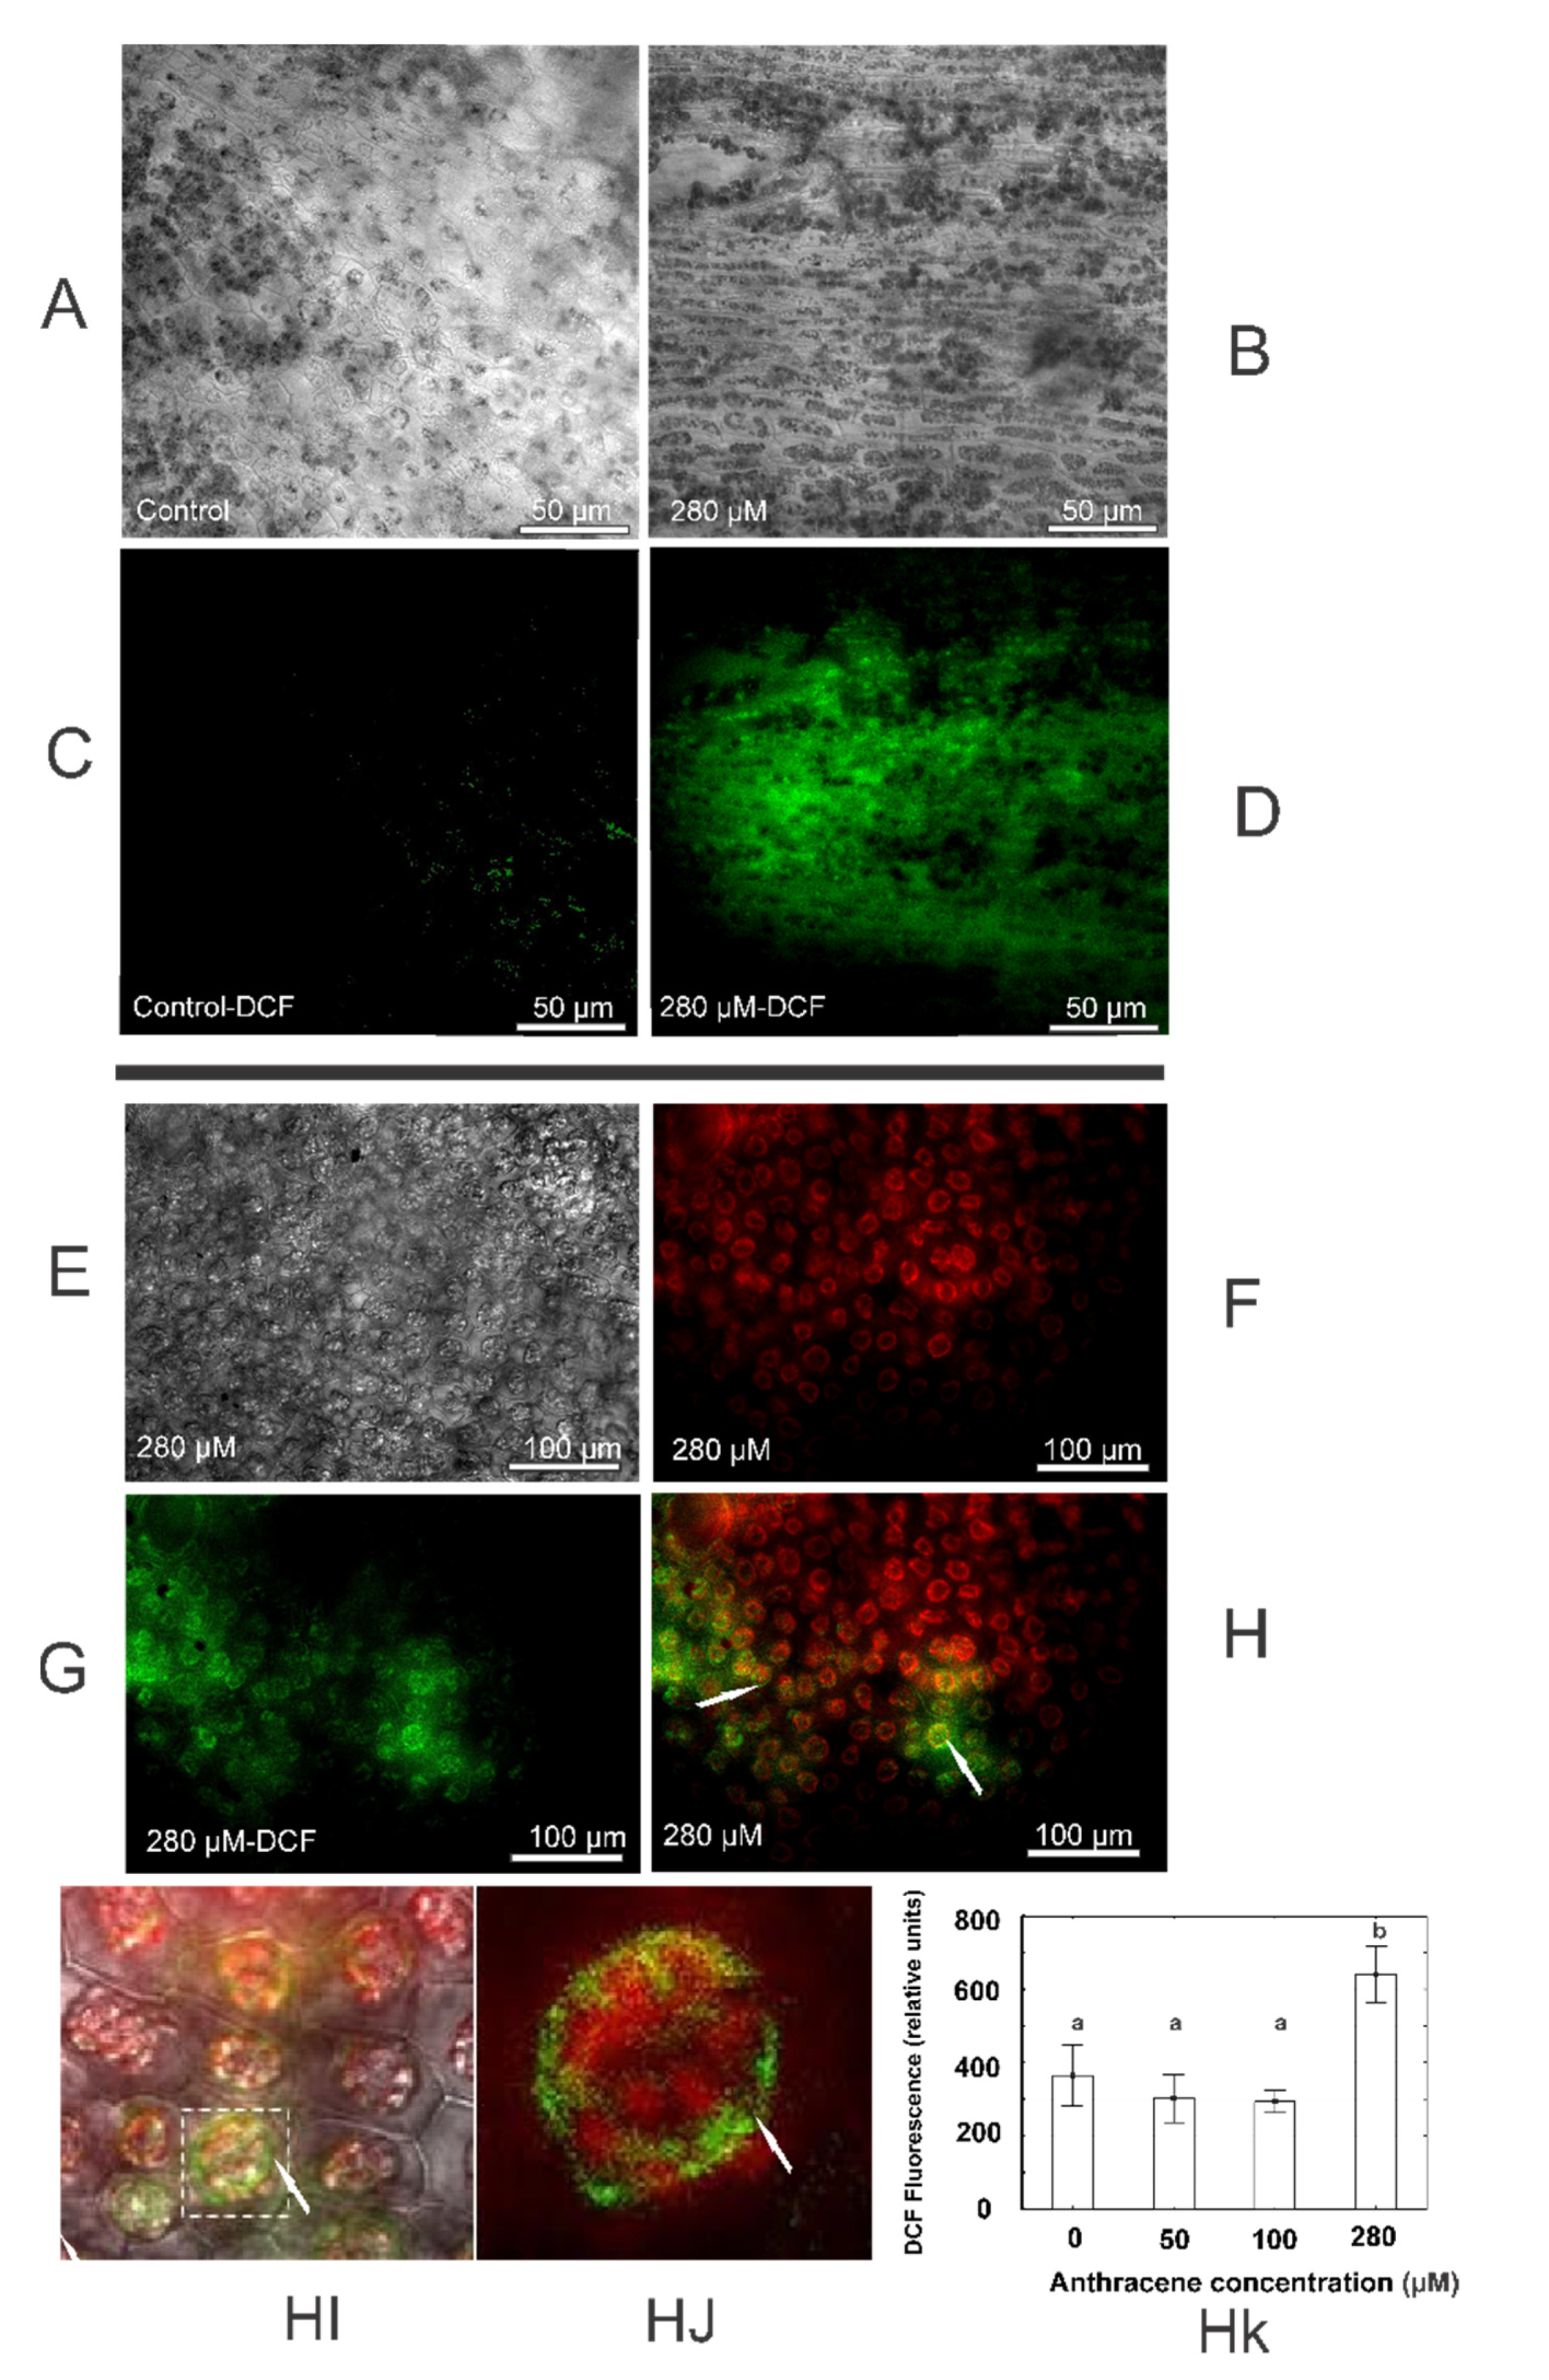
2.4. Anthracene Induces Oxidative Damage: Histochemical Staining and Fluorescence Test Determinations
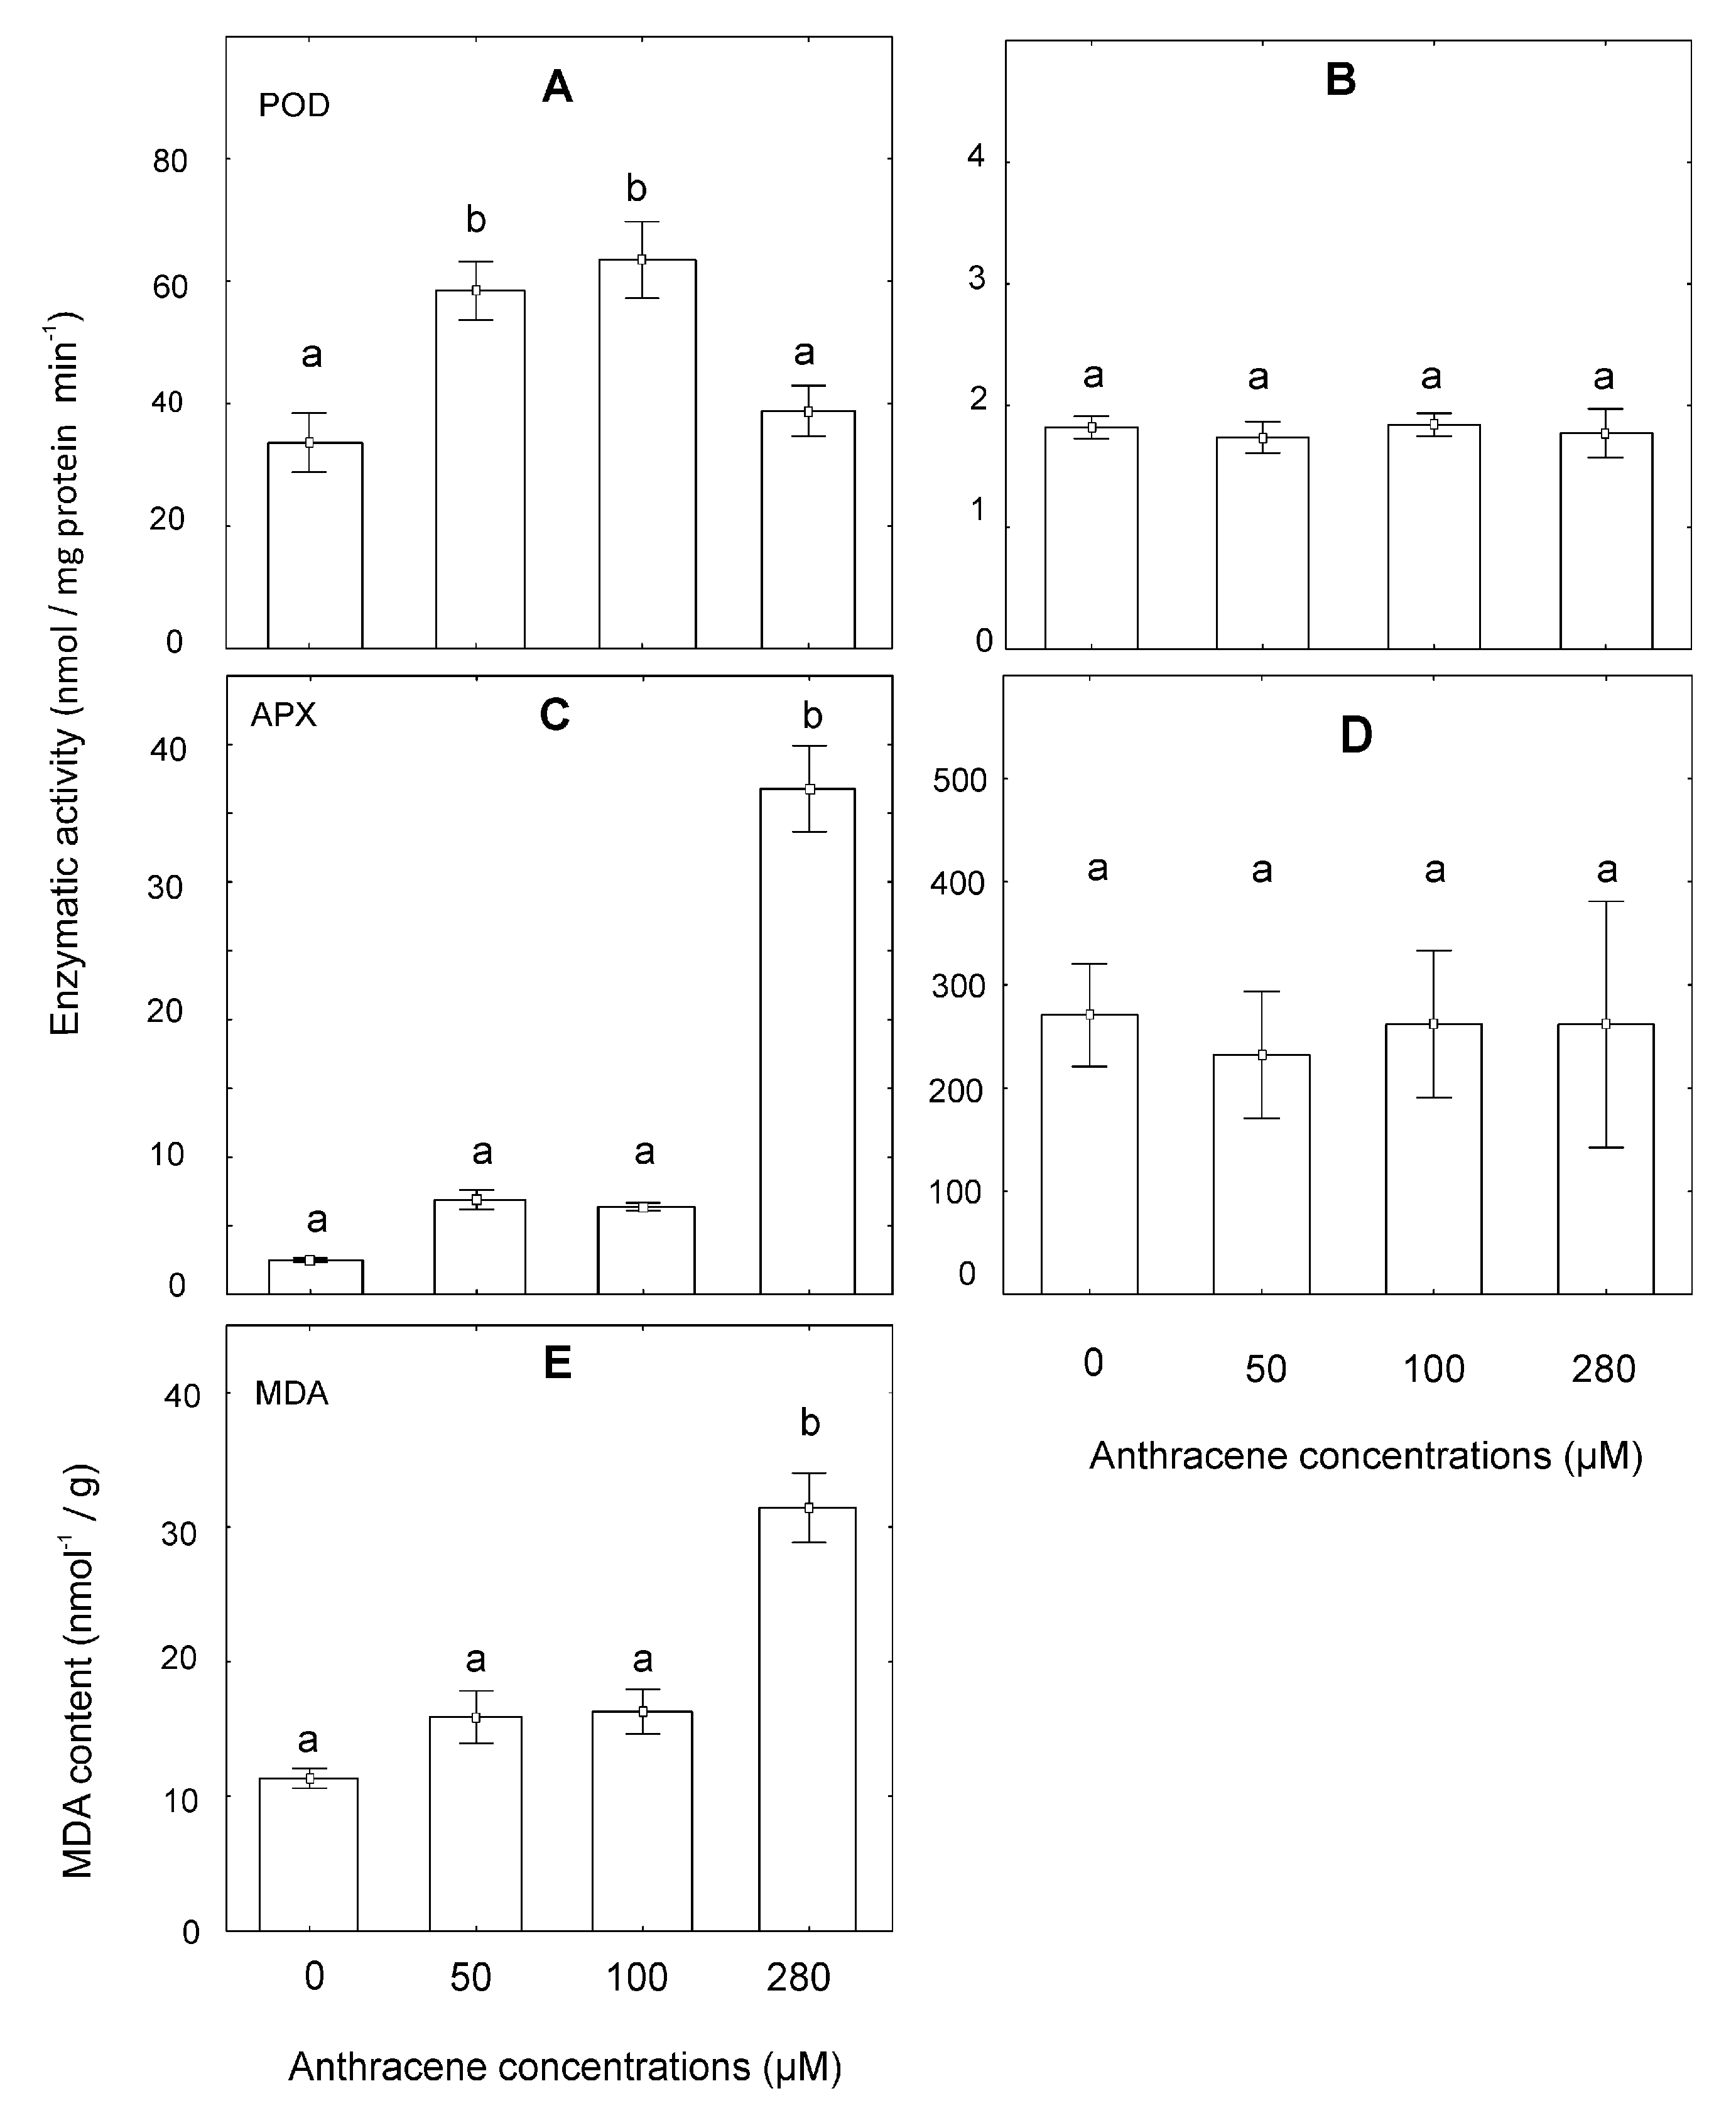
2.5. Analysis of Oxidative Damage at the Enzymatic and Lipid Peroxidation Levels
3. Discussion
4. Materials and Methods
4.1. Chemicals
4.2. Plant Biomass and Treatments
4.3. Anthracene Analyses
4.4. Chlorophyll Content
4.5. Transmission Electron Microscopy (TEM) Analysis
4.6. Histochemical Stain and Fluorescence Test
4.7. Thallus Gas Exchange and Thallus-Modulated Fluorescence of Chlorophyll
4.8. Oxidative Stress Enzymes and Lipid Peroxidation
4.9. RNA-Seq Analyses
4.10. Statistical Analysis
5. Conclusions
Supplementary Materials
Author Contributions
Funding
Institutional Review Board Statement
Informed Consent Statement
Data Availability Statement
Acknowledgments
Conflicts of Interest
References
- Khalil, M.S.; Khamis, W.M. Novel forecasting, bioindicator, and bioremediation for pesticides contamination in soil. In Pesticide Contamination in Freshwater and Soil Environs, 1st ed.; Mehmood, M.A., Hakeem, K.R., Eds.; Appel Academic Press: New York, NY, USA, 2021; pp. 283–303. [Google Scholar]
- Naveed, M.; Ditta, A.; Ahmad, M.; Mustafa, A.; Ahmad, Z.; Conde-Cid, M.; Tahir, S.; Shah, S.A.A.; Abrar, M.M.; Fahad, S. Processed animal manure improves morphophysiological and biochemical characteristic of Brassica napus L. under nickel and salinity stress. Environ. Sci. Pollut. Res. 2021. [Google Scholar] [CrossRef]
- Rizwan, M.S.; Imtiz, M.; Zhu, J.; Yousaf, B.; Hussain, M.; Ali, L.; Ditta, A.; Ihsan, M.Z.; Huang, G.; Ashraf, M.; et al. Immobilization of Pb and Cu by organic and inorganic amendments in contaminated soil. Geoderma 2021, 385, 114816. [Google Scholar] [CrossRef]
- Singha, L.P.; Pandey, P. Rhizosphere assisted bioengineering approaches for the mitigation of petroleum hydrocarbons contamination in soil. Crit. Rev. Biotechnol. 2021, 41, 649–668. [Google Scholar] [CrossRef] [PubMed]
- Wise, S.A.; Benner, B.A.; Byrd, G.D.; Chesler, S.N.; Rebbert, R.E.; Schantz, M.M. Determination of polycyclic aromatic hydrocarbons in a coal tar standard reference material. Anal. Chem. 1988, 60, 887–894. [Google Scholar] [CrossRef]
- Nadal, M.; Schuhmacher, M.; Domingo, J.L. Levels of PAHs in soil and vegetation samples from Tarragona County, Spain. Environ. Pollut. 2004, 132, 1–11. [Google Scholar] [CrossRef] [PubMed]
- García-Sánchez, M.; Kosnar, Z.; Mercl, F.; Aranda, E.; Tlustos, P. A comparative study to evaluate natural attenuation, mycoaugmentation, phytoremediation, and microbial-assisted phytoremediation strategies for the bioremediation of an aged PAH-polluted soil. Ecotoxicol. Environ. Saf. 2018, 147, 165–174. [Google Scholar] [CrossRef] [PubMed]
- Kong, H.; He, J.; Gao, Y.; Han, J.; Zhu, X. Removal of polycyclic aromatic hydrocarbons from aqueous solution on soybean stalk–based carbon. J. Enviro. Qual. 2011, 40, 1737–1744. [Google Scholar] [CrossRef] [PubMed]
- Werle, S.; Trana, K.Q.; Magdziarz, A.; Sobek, S.; Pogrzeba, M.; Løvås, T. Energy crops for sustainable phytoremediation–Fuel characterization. Energy Procedia 2019, 158, 867–872. [Google Scholar] [CrossRef]
- Xu, C.; Yang, W.; Wei, L.; Huang, Z.; Wei, W.; Lin, A. Enhanced phytoremediation of PAHs-contaminated soil from an industrial relocation site by Ochrobactrum sp. Environ. Sci. Pollut. Res. 2019, 27, 8991–8999. [Google Scholar] [CrossRef]
- Alkio, M.; Tabuchi, T.M.; Wang, X.; Colon-Carmona, A. Stress responses to polycyclic aromatic hydrocarbons in Arabidopsis include growth inhibition and hypersensitive response-like symptoms. J. Exp. Bot. 2005, 56, 2983–2994. [Google Scholar] [CrossRef] [Green Version]
- Kang, F.; Chen, D.; Gao, Y.; Zhang, Y. Distribution of polycyclic aromatic hydrocarbons in subcellular root tissues of ryegrass (Lolium multiflorum (Lam). BMC Plant Biol. 2010, 10, 1–7. [Google Scholar] [CrossRef] [Green Version]
- Liu, H.; Weisman, D.; Ye, Y.B.; Cui, B.; Huang, Y.H.; Colón-Carmona, A.; Wang, Z.H. An oxidative stress response to polycyclic aromatic hydrocarbon exposure is rapid and complex in Arabidopsis thaliana. Plant Sci. 2009, 176, 375–382. [Google Scholar] [CrossRef]
- Maliszewska-Kordybach, B.; Smreczak, B. Ecotoxicological activity of soils polluted with polycyclic aromatic hydrocarbons (PAHs)-effect on plants. Environ. Technol. 2000, 21, 1099–1110. [Google Scholar] [CrossRef]
- Oguntimehin, I.; Eissa, F.; Sakugawa, H. Simultaneous ozone fumigation and fluoranthene sprayed as mists negatively affected cherry tomato (Lycopersicon esculentum Mill.). Ecotox. Environ. Safe 2010, 73, 1028–1033. [Google Scholar] [CrossRef]
- Oguntimehin, I.; Nakatani, N.; Sakugawa, H. Phytotoxicities of fluoranthene and phenanthrene deposited on needle surfaces of the evergreen conifer, Japanese red pine (Pinus densiflora Sieb. et Zucc.). Environ. Pollut. 2008, 154, 264–271. [Google Scholar] [CrossRef] [Green Version]
- Agrawal, P.K.; Shrivastava, R.; Verma, J. Emerging and eco-friendly approaches for waste management. In Bioremediation Approaches for Degradation and Detoxification of Polycyclic Aromatic Hydrocarbons; Springer: Singapore, 2019; pp. 99–119. [Google Scholar]
- Bates, J.W. Mineral nutrient acquisition and retention by bryophytes. J. Bryol. 1992, 17, 223–240. [Google Scholar] [CrossRef]
- Spinedi, N.; Rojas, N.; Storb, R.; Cabrera, J.; Aranda, E.; Salierno, M.; Svriz, M.; Scervino, J.M. Exploring the response of Marchantia polymorpha: Growth, morphology and chlorophyll content in the presence of anthracene. Plant Physiol. Biochem. 2019, 135, 570–574. [Google Scholar] [CrossRef] [Green Version]
- Vranová, E.; Inzé, D.; Van Breusegem, F. Signal transduction during oxidative stress. J. Exp. Bot. 2002, 53, 1227–1236. [Google Scholar] [CrossRef] [PubMed] [Green Version]
- Foyer, C.H. Reactive oxygen species, oxidative signaling and the regulation of photosynthesis. Environ. Exp. Bot. 2018, 154, 134–142. [Google Scholar] [CrossRef] [PubMed]
- Foyer, C.H.; Noctor, G. Oxidant and antioxidant signalling in plants: A re-evaluation of the concept of oxidative stress in a physiological context. Plant Cell Environ. 2005, 28, 056–1071. [Google Scholar] [CrossRef]
- Farooq, M.A.; Niazi, A.K.; Akhtar, J.; Farooq, M.; Souri, Z.; Karimi, N.; Rengel, Z. Acquiring control: The evolution of ROS-Induced oxidative stress and redox signaling pathways in plant stress responses. Plant Physiol. Biochem. 2019, 141, 353–369. [Google Scholar] [CrossRef] [PubMed]
- Shen, Y.; Li, J.; Gu, R.; Yue, L.; Wang, H.; Zhan, X.; Xing, B. Carotenoid and superoxide dismutase are the most effective antioxidants participating in ROS scavenging in phenanthrene accumulated wheat leaf. Chemosphere 2018, 197, 513–525. [Google Scholar] [CrossRef]
- Peidro-Guzmán, H.; Pérez-Llano, Y.; González-Abradelo, D.; Fernández-López, M.G.; Dávila-Ramos, S.; Aranda, E.; Hernández, D.R.; García, A.O.; Lira-Ruan, V.; Pliego, O.R.; et al. Transcriptomic analysis of polyaromatic hydrocarbon degradation by the halophilic fungus Aspergillus sydowii at hypersaline conditions. Environ. Microbiol. 2020. [Google Scholar] [CrossRef] [PubMed]
- Jahan, A.; Komatsu, K.; Wakida-Sekiya, M.; Hiraide, M.; Tanaka, K.; Ohtake, R.; Umezawa, T.; Toriyama, T.; Shinozawa, A.; Yotsui, I.; et al. Archetypal roles of an abscisic acid receptor in drought and sugar responses in liverworts. Plant Physiol. 2019, 179, 317–328. [Google Scholar] [CrossRef] [PubMed] [Green Version]
- Tanaka, H.; Suzuki, R.; Okabe, N.; Suzuki, T.; Kodama, Y. Salinity stress-responsive transcription factors in the liverwort Marchantia polymorpha. Plant Biotechnol. 2018, 35, 281–284. [Google Scholar] [CrossRef]
- Davies, K.M.; Jibran, R.; Zhou, Y.; Albert, N.W.; Brummell, D.A.; Jordan, B.R.; Bowman, J.L.; Schwinn, K.E. The evolution of flavonoid biosynthesis: A bryophyte perspective. Front. Plant Sci. 2020, 11, 7. [Google Scholar] [CrossRef] [Green Version]
- Monte, I.; Ishida, S.; Zamarreño, A.M.; Hamberg, M.; Franco-Zorrilla, J.M.; García-Casado, G.; Gouhier-Darimont, C.; Reymond, P.; Takahashi, K.; García-Mina, J.M.; et al. Ligand-receptor co-evolution shaped the jasmonate pathway in land plants. Nat. Chem. Biol. 2018, 14, 480–488. [Google Scholar] [CrossRef] [Green Version]
- Sperschneider, J.; Catanzariti, A.M.; DeBoer, K.; Petre, B.; Gardiner, D.M.; Singh, K.B.; Dodds, P.N.; Taylor, J.M. LOCALIZER: Subcellular localization prediction of both plant and effector proteins in the plant cell. Sci. Rep. 2017, 7, 1–14. [Google Scholar] [CrossRef] [Green Version]
- Dumas, A.S.; Taconnat, L.; Barbas, E.; Rigaill, G.; Catrice, O.; Bernard, D.; Benamar, A.; Macherel, D.; El Amrani, A.; Berthome, R. Unraveling the early molecular and physiological mechanisms involved in response to phenanthrene exposure. BMC Genom. 2016, 17, 1–23. [Google Scholar] [CrossRef]
- Clayton, W.A.; Albert, N.W.; Thrimawithana, A.H.; McGhie, T.K.; Deroles, S.C.; Schwinn, K.E.; Davies, K.M. UVR8-mediated induction of flavonoid biosynthesis for UVB tolerance is conserved between the liverwort Marchantia polymorpha and flowering plants. Plant J. 2018, 96, 503–517. [Google Scholar] [CrossRef] [PubMed] [Green Version]
- Burritt, D.J. The polycyclic aromatic hydrocarbon phenanthrene causes oxidative stress and alters polyamine metabolism in the aquatic liverwort Riccia fluitans L. Plant Cell Environ. 2008, 31, 1416–1431. [Google Scholar] [CrossRef] [PubMed]
- Wieczorek, J.K.; Wieczorek, Z.J. Phytotoxicity and accumulation of anthracene applied to the foliage and sandy substrate in lettuce and radish plants. Ecotox. Environ. Safe 2007, 66, 369–377. [Google Scholar] [CrossRef] [PubMed]
- Aranda, E.; Scervino, J.M.; Godoy, P.; Reina, R.; Ocampo, J.A.; Wittich, R.M.; García-Romera, I. Role of arbuscular mycorrhizal fungus Rhizophagus custos in the dissipation of PAHs under root-organ culture conditions. Environ. Pollut. 2013, 181, 182–189. [Google Scholar] [CrossRef] [PubMed]
- Carginale, V.; Sorbo, S.; Capasso, C.; Trinchella, F.; Cafiero, G.; Basile, A. Accumulation, localization and toxic effects of cadmium in the liverwort Lunuaria cruciata. Protoplasma 2004, 223, 53–61. [Google Scholar] [CrossRef] [PubMed]
- Zhan, X.; Zhang, X.; Yin, X.; Ma, H.; Liang, J.; Zhou, L.; Jiang, T.; Xu, G. H+/phenanthrene symporter and aquaglyceroporin are implicate in phenanthrene uptake by wheat (Triticum aestivum L.) roots. J. Environ. Qual. 2012, 41, 188–196. [Google Scholar] [CrossRef]
- Jajoo, A.; Mekala, N.R.; Tomar, R.S.; Grieco, M.; Tikkanen, M.; Aro, E.M. Inhibitory effects of polycyclic aromatic hydrocarbons (PAHs) on photosynthetic performance are not related to their aromaticity. J. Photochem. Photobiol. B Biol. 2014, 137, 151–155. [Google Scholar] [CrossRef] [PubMed]
- Zhao, X.; Chen, T.; Feng, B.; Zhang, C.; Peng, S.; Zhang, X.; Tao, L. Non-photochemical quenching plays a key role in light acclimation of rice plants differing in leaf color. Front. Plant Sci. 2017, 7, 1968. [Google Scholar] [CrossRef] [Green Version]
- Kreslavski, V.D.; Brestic, M.; Zharmukhamedov, S.K.; Lyubimov, V.Y.; Lankin, A.V.; Jajoo, A.; Allakhverdiev, S.I. Mechanisms of inhibitory effects of polycyclic aromatic hydrocarbons in photosynthetic primary processes in pea leaves and thylakoid preparations. Plant Biol. 2017, 19, 683–688. [Google Scholar] [CrossRef]
- Duxbury, C.L.; Dixon, D.G.; Greenberg, B.M. Effects of simulated solar radiation on the bioaccumulation of polycyclic aromatic hydrocarbons by the duckweed Lemna gibba. Environ. Toxicol. Chem. 1997, 16, 1739–1748. [Google Scholar] [CrossRef]
- Aksmann, A.; Tukaj, Z. Intact anthracene inhibits photosynthesis in algal cells: A fluorescence induction study on Chlamydomonas reinhardtii cw92 strain. Chemosphere 2008, 74, 26–32. [Google Scholar] [CrossRef] [PubMed]
- Kummerová, M.; Vanová, L.; Krulová, J.; Zezulká, S. The use of physiological characteristics for comparison of organic compounds phytotoxicity. Chemosphere 2008, 71, 2050–2059. [Google Scholar] [CrossRef]
- Eklund, D.M.; Kanei, M.; Flores-Sandoval, E.; Ishizaki, K.; Nishihama, R.; Kohchi, T.; Lagercrantz, U.; Bhalerao, R.P.; Sakata, Y.; Bowman, J.L. An evolutionarily conserved abscisic acid signaling pathway regulates dormancy in the liverwort Marchantia polymorpha. Curr. Biol. 2018, 28, 3691–3699. [Google Scholar] [CrossRef] [PubMed] [Green Version]
- Ghosh, T.K.; Kaneko, M.; Akter, K.; Murai, S.; Komatsu, K.; Ishizaki, K.; Yamato, K.T.; Kohchi, T.; Takezawa, D. Abscisic acid-induced gene expression in the liverwort Marchantia polymorpha is mediated by evolutionarily conserved promoter elements. Physiol. Plantarum 2016, 156, 407–420. [Google Scholar] [CrossRef]
- Battaglia, M.; Covarrubias, A.A. Late Embryogenesis Abundant (LEA) proteins in legumes. Front. Plant Sci. 2013, 4, 190. [Google Scholar] [CrossRef] [PubMed] [Green Version]
- Liang, Y.; Kang, K.; Gan, L.; Ning, S.; Xiong, J.; Song, S.; Xi, L.; Lai, S.; Yin, Y.; Gu, J.; et al. Drought-responsive genes, late embryogenesis abundant group3 (LEA3) and vicinal oxygen chelate, function in lipid accumulation in Brassica napus and Arabidopsis mainly via enhancing photosynthetic efficiency and reducing ROS. Plant. Biotechnol. J. 2019, 17, 2123–2142. [Google Scholar] [CrossRef] [PubMed] [Green Version]
- Fürst-Jansen, J.M.; de Vries, S.; de Vries, J. Evo-physio: On stress responses and the earliest land plants. J. Exp. Bot. 2020, 71, 3254–3269. [Google Scholar] [CrossRef] [Green Version]
- Godinez-Vidal, D.; López-Leal, G.; Covarrubias, A.A.; Reyes, J.L. Early events leading to water deficit responses in the liverwort Marchantia polymorpha. Environ. Exp. Bot. 2020, 178, 104–172. [Google Scholar] [CrossRef]
- González, A.; Vidal, C.; Espinoza, D.; Moenne, A. Anthracene induces oxidative stress and activation of antioxidant and detoxification enzymes in Ulva lactuca (Chlorophyta). Sci. Rep. 2021, 11, 7748. [Google Scholar] [CrossRef] [PubMed]
- You, J.; Chan, Z. ROS Regulation During abiotic stress responses in crop plants. Front. Plant Sci. 2015, 6, 1092. [Google Scholar] [CrossRef] [Green Version]
- Tanwir, K.; Javed, M.T.; Shahid, M.; Akram, M.S.; Ali, Q. Chapter 32—Antioxidant defense systems in bioremediation of organic pollutants. In Handbook of Bioremediation; Hasanuzzaman, M., Prasad, M.N.V., Eds.; Academic Press: Cambridge, MA, USA, 2021; pp. 505–521. [Google Scholar]
- Ahammed, G.J.; Wang, M.M.; Zhou, Y.H.; Xia, X.J.; Mao, W.H.; Shi, K.; Yu, J.Q. The growth, photosynthesis and antioxidant defense responses of five vegetable crops to phenanthrene stress. Ecotox. Environ. Safe 2012, 80, 132–139. [Google Scholar] [CrossRef]
- Wei, H.; Song, S.; Tian, H.; Liu, T. Effects of phenanthrene on seed germination and some physiological activities of wheat seedling. Comptes Rendus Biol. 2014, 337, 95–100. [Google Scholar] [CrossRef] [PubMed]
- Krinsky, N.I. Antioxidant functions of carotenoids. Free Radical Bio. Med. 1989, 7, 617–635. [Google Scholar] [CrossRef]
- Anderson, S.M.; Krinsky, N.I. Protective action of carotenoid pigments against hotodynamic damage to liposomes. Photochem. Photobiol. 1973, 18, 403–408. [Google Scholar] [CrossRef] [PubMed]
- Krinsky, N.I.; Deneke, S.M. Interaction of oxygen and oxy-radicals with carotenoids. J. Natl. Cancer Inst. 1982, 69, 205–210. [Google Scholar]
- Bécard, G.; Fortin, J.A. Early events of vesicular–arbuscular mycorrhiza formation on Ri T-DNA transformed roots. New Phytol. 1988, 108, 211–218. [Google Scholar] [CrossRef] [PubMed]
- Alves, W.S.; Manoel, E.A.; Santos, N.S.; Nunes, R.O.; Domiciano, G.C.; Soares, M.R. Phytoremediation of polycyclic aromatic hydrocarbons (PAH) by cv. Crioula: A Brazilian alfalfa cultivar. Int. J. Phytoremediat. 2018, 20, 747–755. [Google Scholar] [CrossRef] [PubMed]
- Košnář, Z.; Mercl, F.; Perná, I.; Tlustoš, P. Investigation of polycyclic aromatic hydrocarbon content in fly ash and bottom ash of biomass incineration plants in relation to the operating temperature and unburned carbon content. Sci. Total Environ. 2016, 563, 53–61. [Google Scholar] [CrossRef] [PubMed]
- Milenković, S.M.; Zvezdanović, J.B.; Anđelković, T.D.; Marković, D.Z. The identification of chlorophyll and its derivatives in the pigment mixtures: HPLC-chromatography, visible and mass spectroscopy studies. Adv. Technol. 2012, 1, 16–24. [Google Scholar]
- Wang, H.; Joseph, J.A. Quantifying cellular oxidative stress by dichlorofluorescein assay using microplate reader. Free Radic. Biol. Med. 1999, 27, 612–616. [Google Scholar] [CrossRef]
- Maxwell, K.; Johnson, G.N. Chlorophyll fluorescence—A practical guide. J. Exp. Bot. 2000, 51, 659–668. [Google Scholar] [CrossRef]
- McCord, J.M.; Fridovich, I. Superoxide dismutase an enzymic function for erythrocuprein (hemocuprein). J. Biol. Chem. 1969, 244, 6049–6055. [Google Scholar] [CrossRef]
- Silva, E.; Nogueira, J.N. Estudo da atividade da polifenol oxidase e da peroxidase em algumas frutas e hortaliças. Solo 1984, 46–51. [Google Scholar]
- Rao, M.V.; Paliyath, G.; Ormrod, D.P. Ultraviolet-B-and ozone-induced biochemical changes in antioxidant enzymes of Arabidopsis thaliana. Plant Physiol. 1996, 110, 125–136. [Google Scholar] [CrossRef] [Green Version]
- Nakano, Y.; Asada, K. Purification of ascorbate peroxidase in spinach chloroplasts; its inactivation in ascorbate-depleted medium and reactivation by monodehydroascorbate radical. Plant Cell Physiol. 1987, 28, 131–140. [Google Scholar]
- Hodges, D.M.; DeLong, J.M.; Forney, C.F.; Prange, R.K. Improving the thiobarbituric acid-reactive-substances assay for estimating lipid peroxidation in plant tissues containing anthocyanin and other interfering compounds. Planta 1999, 207, 604–611. [Google Scholar] [CrossRef]
- Bradford, M.M. A rapid and sensitive method for the quantification of microgram quantities of protein utilizing the principle of protein-dye binding. Anal. Biochem. 1976, 72, 248–254. [Google Scholar] [CrossRef]
- Afgan, E.; Baker, D.; Batut, B.; Van Den Beek, M.; Bouvier, D.; Čech, M.; Chilton, J.; Clements, D.; Coraor, N.; Grüning, B.A.; et al. The Galaxy platform for accessible, reproducible and collaborative biomedical analyses: 2018 update. Nucleic Acids Res. 2018, 46, 537–544. [Google Scholar] [CrossRef] [Green Version]
- Kim, D.; Langmead, B.; Salzberg, S.L. HISAT: A fast spliced aligner with low memory requirements. Nat. Methods 2015, 12, 357–360. [Google Scholar] [CrossRef] [Green Version]
- Anders, S.; Pyl, P.T.; Huber, W. HTSeq—A Python framework to work with high-throughput sequencing data. Bioinformatics 2015, 31, 166–169. [Google Scholar] [CrossRef] [PubMed]
- Love, M.I.; Huber, W.; Anders, S. Moderated estimation of fold change and dispersion for RNA-seq data with DESeq2. Genome Biol. 2014, 15, 550. [Google Scholar] [CrossRef] [PubMed] [Green Version]
- Gu, Z.; Eils, R.; Schlesner, M. Complex heatmaps reveal patterns and correlations in multidimensional genomic data. Bioinformatics 2016, 32, 2847–2849. [Google Scholar] [CrossRef] [PubMed] [Green Version]
- Bowman, J.L.; Kohchi, T.; Yamato, K.T.; Jenkins, J.; Shu, S.; Ishizaki, K.; Yamaoka, S.; Nishihama, R.; Nakamura, Y.; Berger, F.; et al. Insights into land plant evolution garnered from the Marchantia polymorpha genome. Cell 2017, 171, 287–304. [Google Scholar] [CrossRef] [PubMed] [Green Version]
- Flores-Sandoval, E.; Romani, F.; Bowman, J.L. Co-expression and transcriptome analysis of Marchantia polymorpha transcription factors supports class C ARFs as independent actors of an ancient auxin regulatory module. Front. Plant Sci. 2018, 9, 1345. [Google Scholar] [CrossRef]
- Van Bel, M.; Diels, T.; Vancaester, E.; Kreft, L.; Botzki, A.; Van de Peer, Y.; Coppens, F.; Vandepoele, K. PLAZA 4.0: An integrative resource for functional, evolutionary and comparative plant genomics. Nucleic Acids Res. 2018, 46, D1190–D1196. [Google Scholar] [CrossRef] [PubMed]


Publisher’s Note: MDPI stays neutral with regard to jurisdictional claims in published maps and institutional affiliations. |
© 2021 by the authors. Licensee MDPI, Basel, Switzerland. This article is an open access article distributed under the terms and conditions of the Creative Commons Attribution (CC BY) license (https://creativecommons.org/licenses/by/4.0/).
Share and Cite
Spinedi, N.; Storb, R.; Aranda, E.; Romani, F.; Svriz, M.; Varela, S.A.; Moreno, J.E.; Fracchia, S.; Cabrera, J.; Batista-García, R.A.; et al. ROS-Scavenging Enzymes as an Antioxidant Response to High Concentration of Anthracene in the Liverwort Marchantia polymorpha L. Plants 2021, 10, 1478. https://doi.org/10.3390/plants10071478
Spinedi N, Storb R, Aranda E, Romani F, Svriz M, Varela SA, Moreno JE, Fracchia S, Cabrera J, Batista-García RA, et al. ROS-Scavenging Enzymes as an Antioxidant Response to High Concentration of Anthracene in the Liverwort Marchantia polymorpha L. Plants. 2021; 10(7):1478. https://doi.org/10.3390/plants10071478
Chicago/Turabian StyleSpinedi, Nahuel, Romina Storb, Elisabet Aranda, Facundo Romani, Maya Svriz, Santiago A. Varela, Javier E. Moreno, Sebastian Fracchia, Juan Cabrera, Ramón Alberto Batista-García, and et al. 2021. "ROS-Scavenging Enzymes as an Antioxidant Response to High Concentration of Anthracene in the Liverwort Marchantia polymorpha L" Plants 10, no. 7: 1478. https://doi.org/10.3390/plants10071478