
Density Dependence Influences the Efficacy of Wastewater Remediation by Lemna minor

 , and
, and 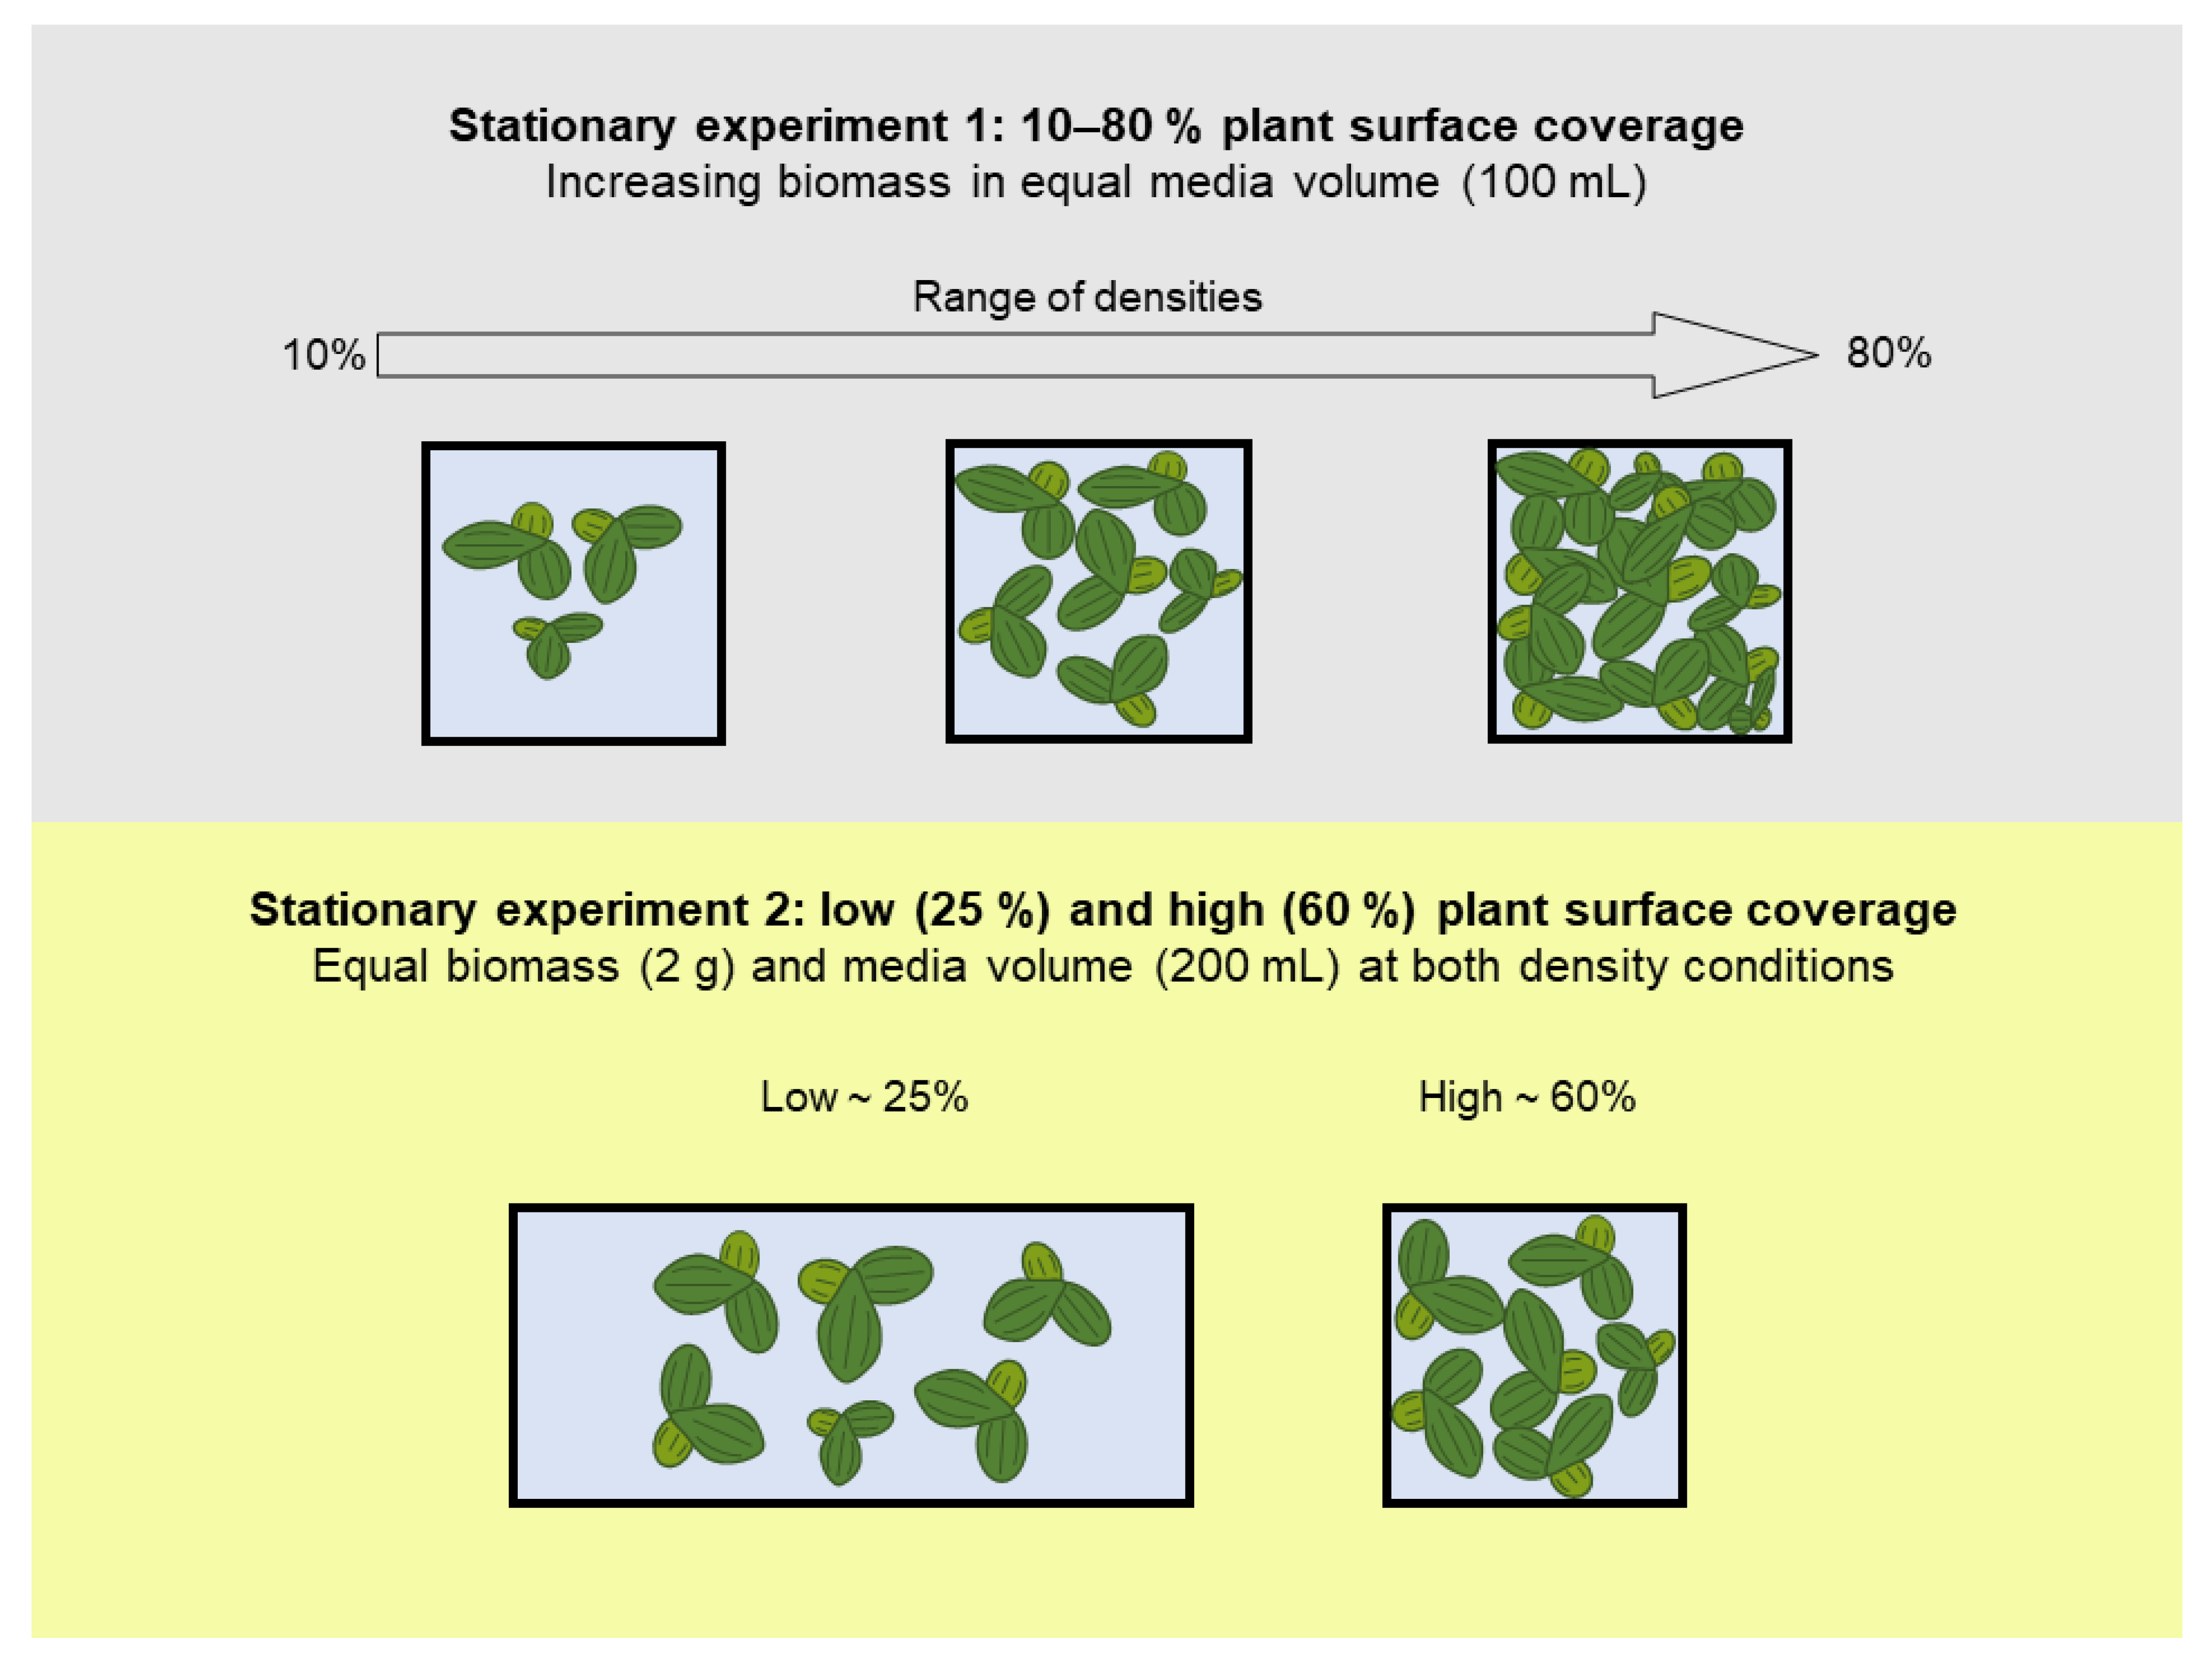
Abstract
:1. Introduction
2. Materials and Methods
2.1. Stock Cultivation
2.2. Experimental Design
2.2.1. Synthetic Dairy Processing Wastewater
2.2.2. Manipulation of Plant Density
2.2.3. Stationary Remediation Experiment 1: Growth and Remediation at Variable Plant Densities
2.2.4. Stationary Remediation Experiment 2: Growth and Remediation at Low and High Density
2.2.5. Re-Circulating Remediation System: Growth and Remediation at Variable Plant Densities
2.3. Measured Parameters
2.3.1. Growth
2.3.2. Chlorophyll a Fluorescence
2.3.3. Total Nitrogen and Total Phosphorous Analysis
2.3.4. Protein Analysis
2.4. Data Analysis
3. Results
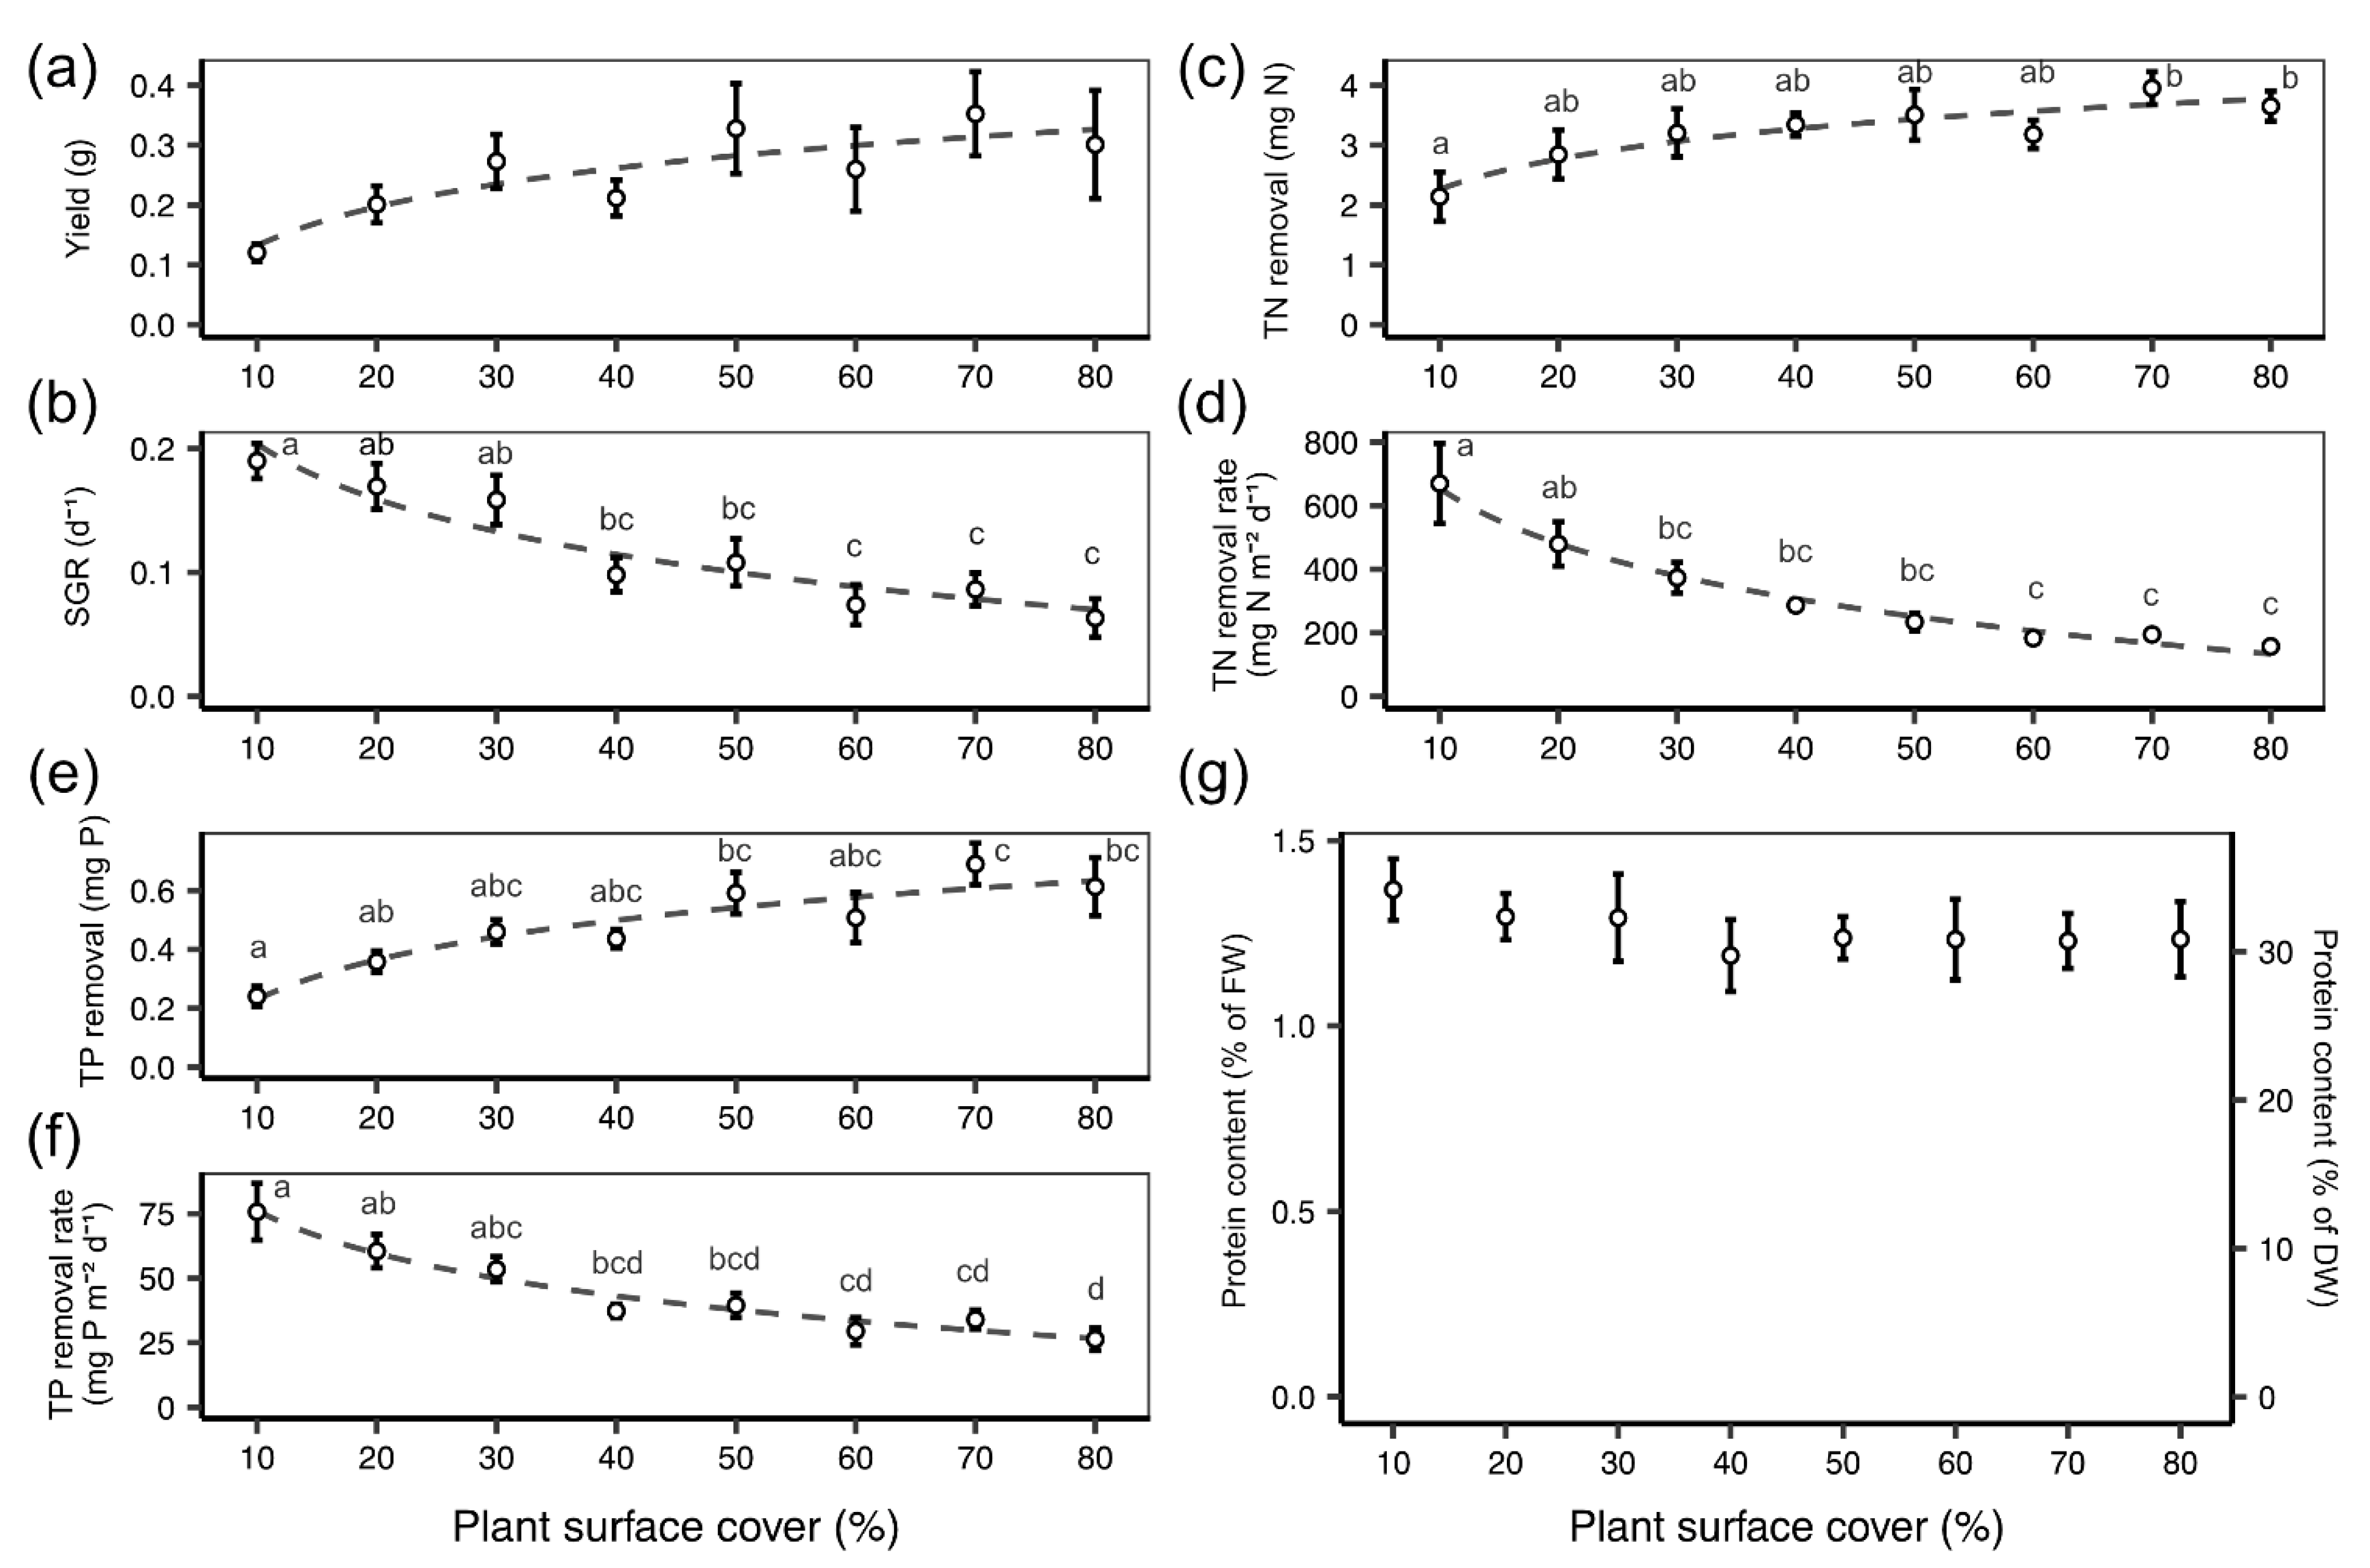
3.1. Stationary Remediation Experiment 1: Growth and Remediation at Variable Plant Densities
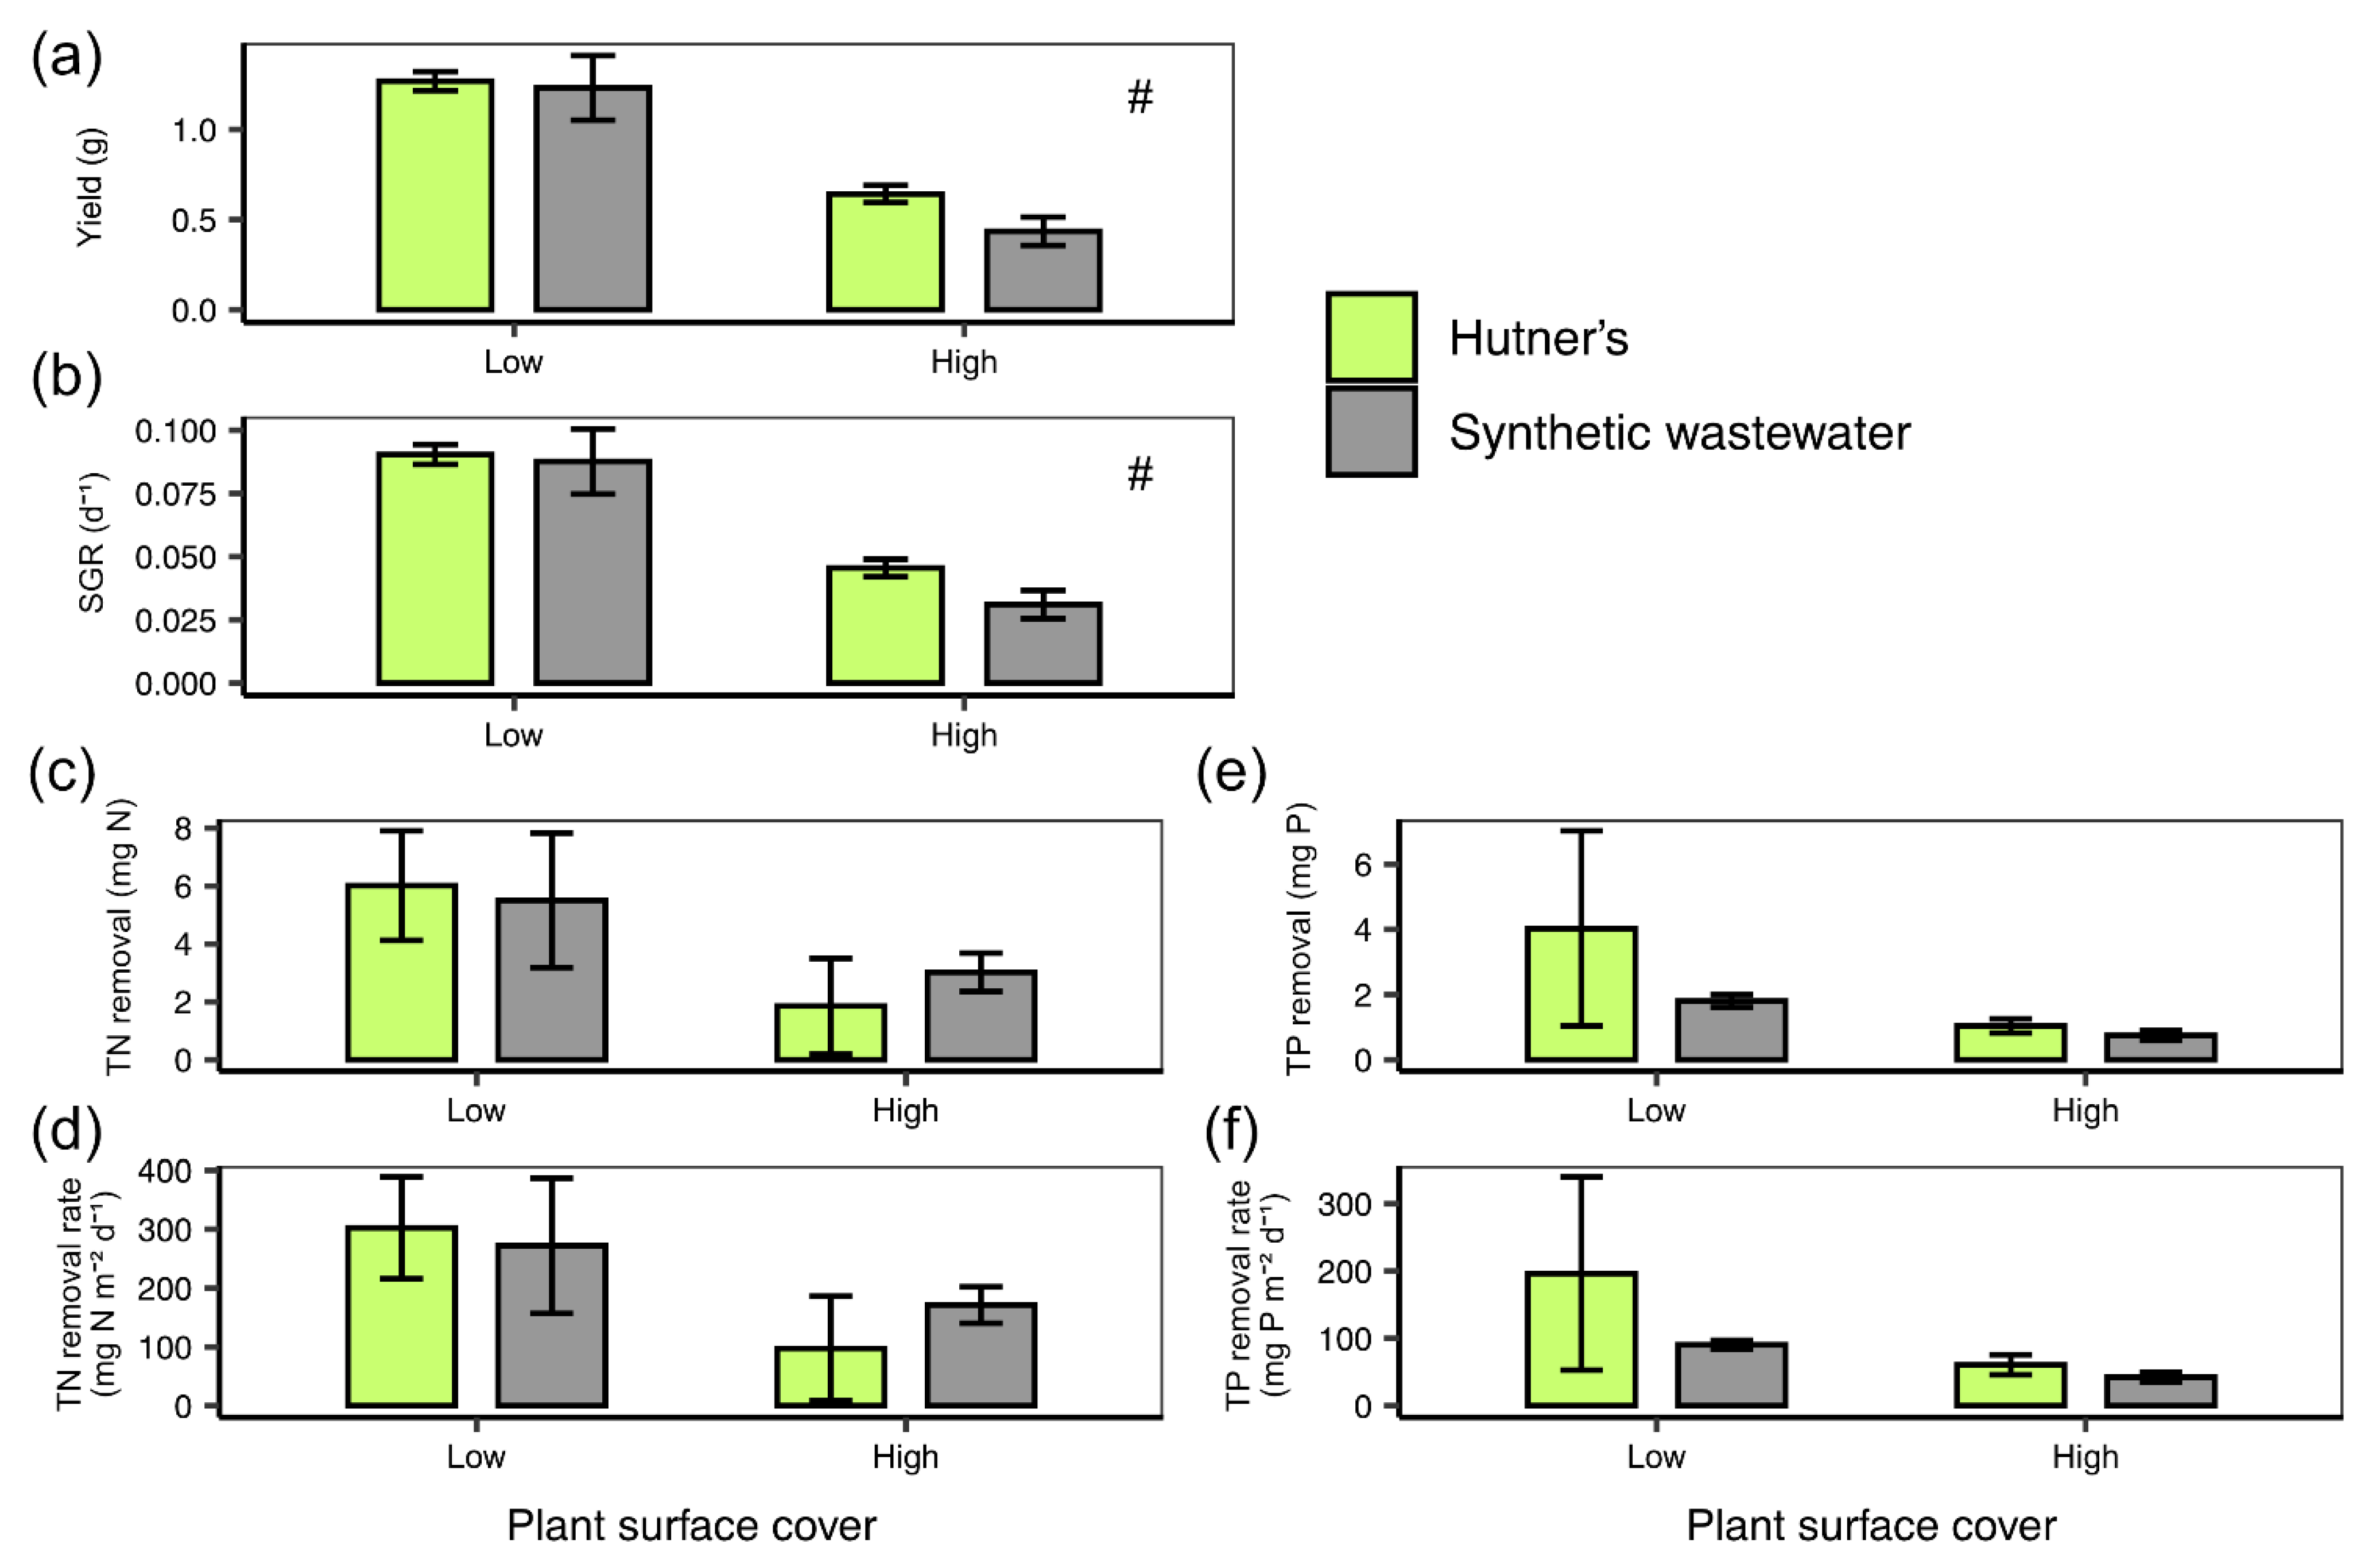
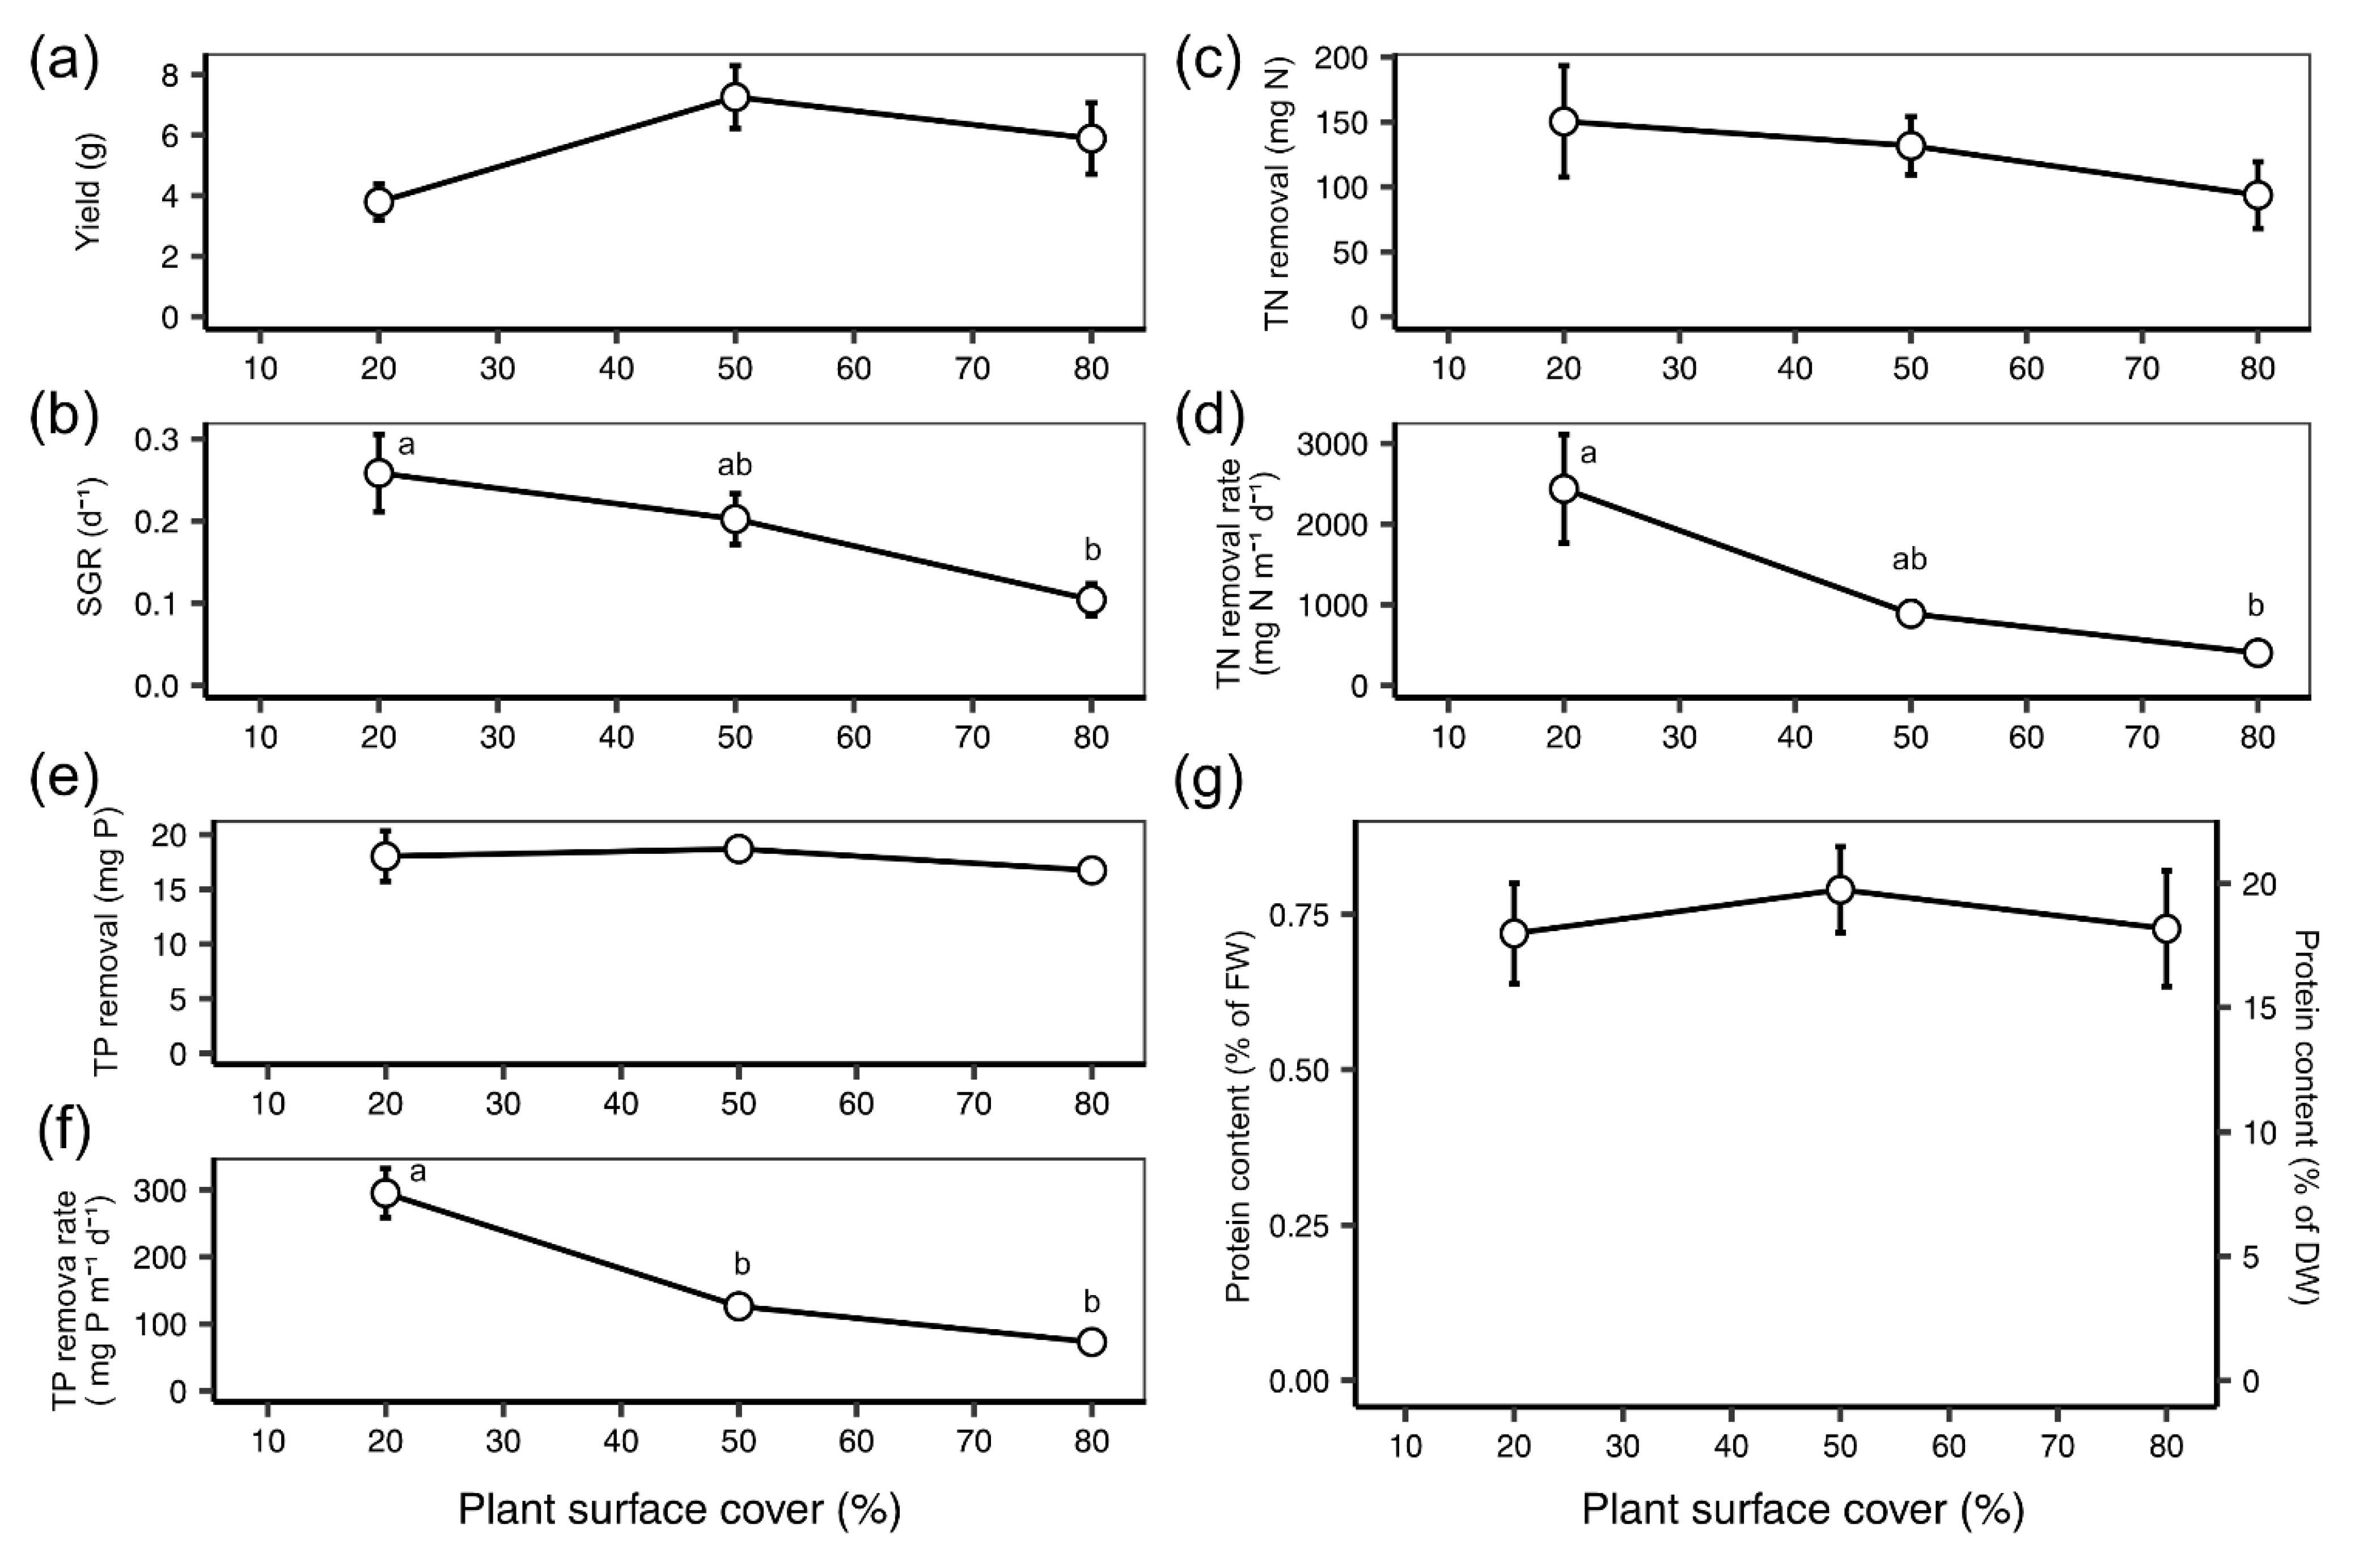
3.2. Stationary Remediation Experiment 2: Growth and Remediation at Low and High Density
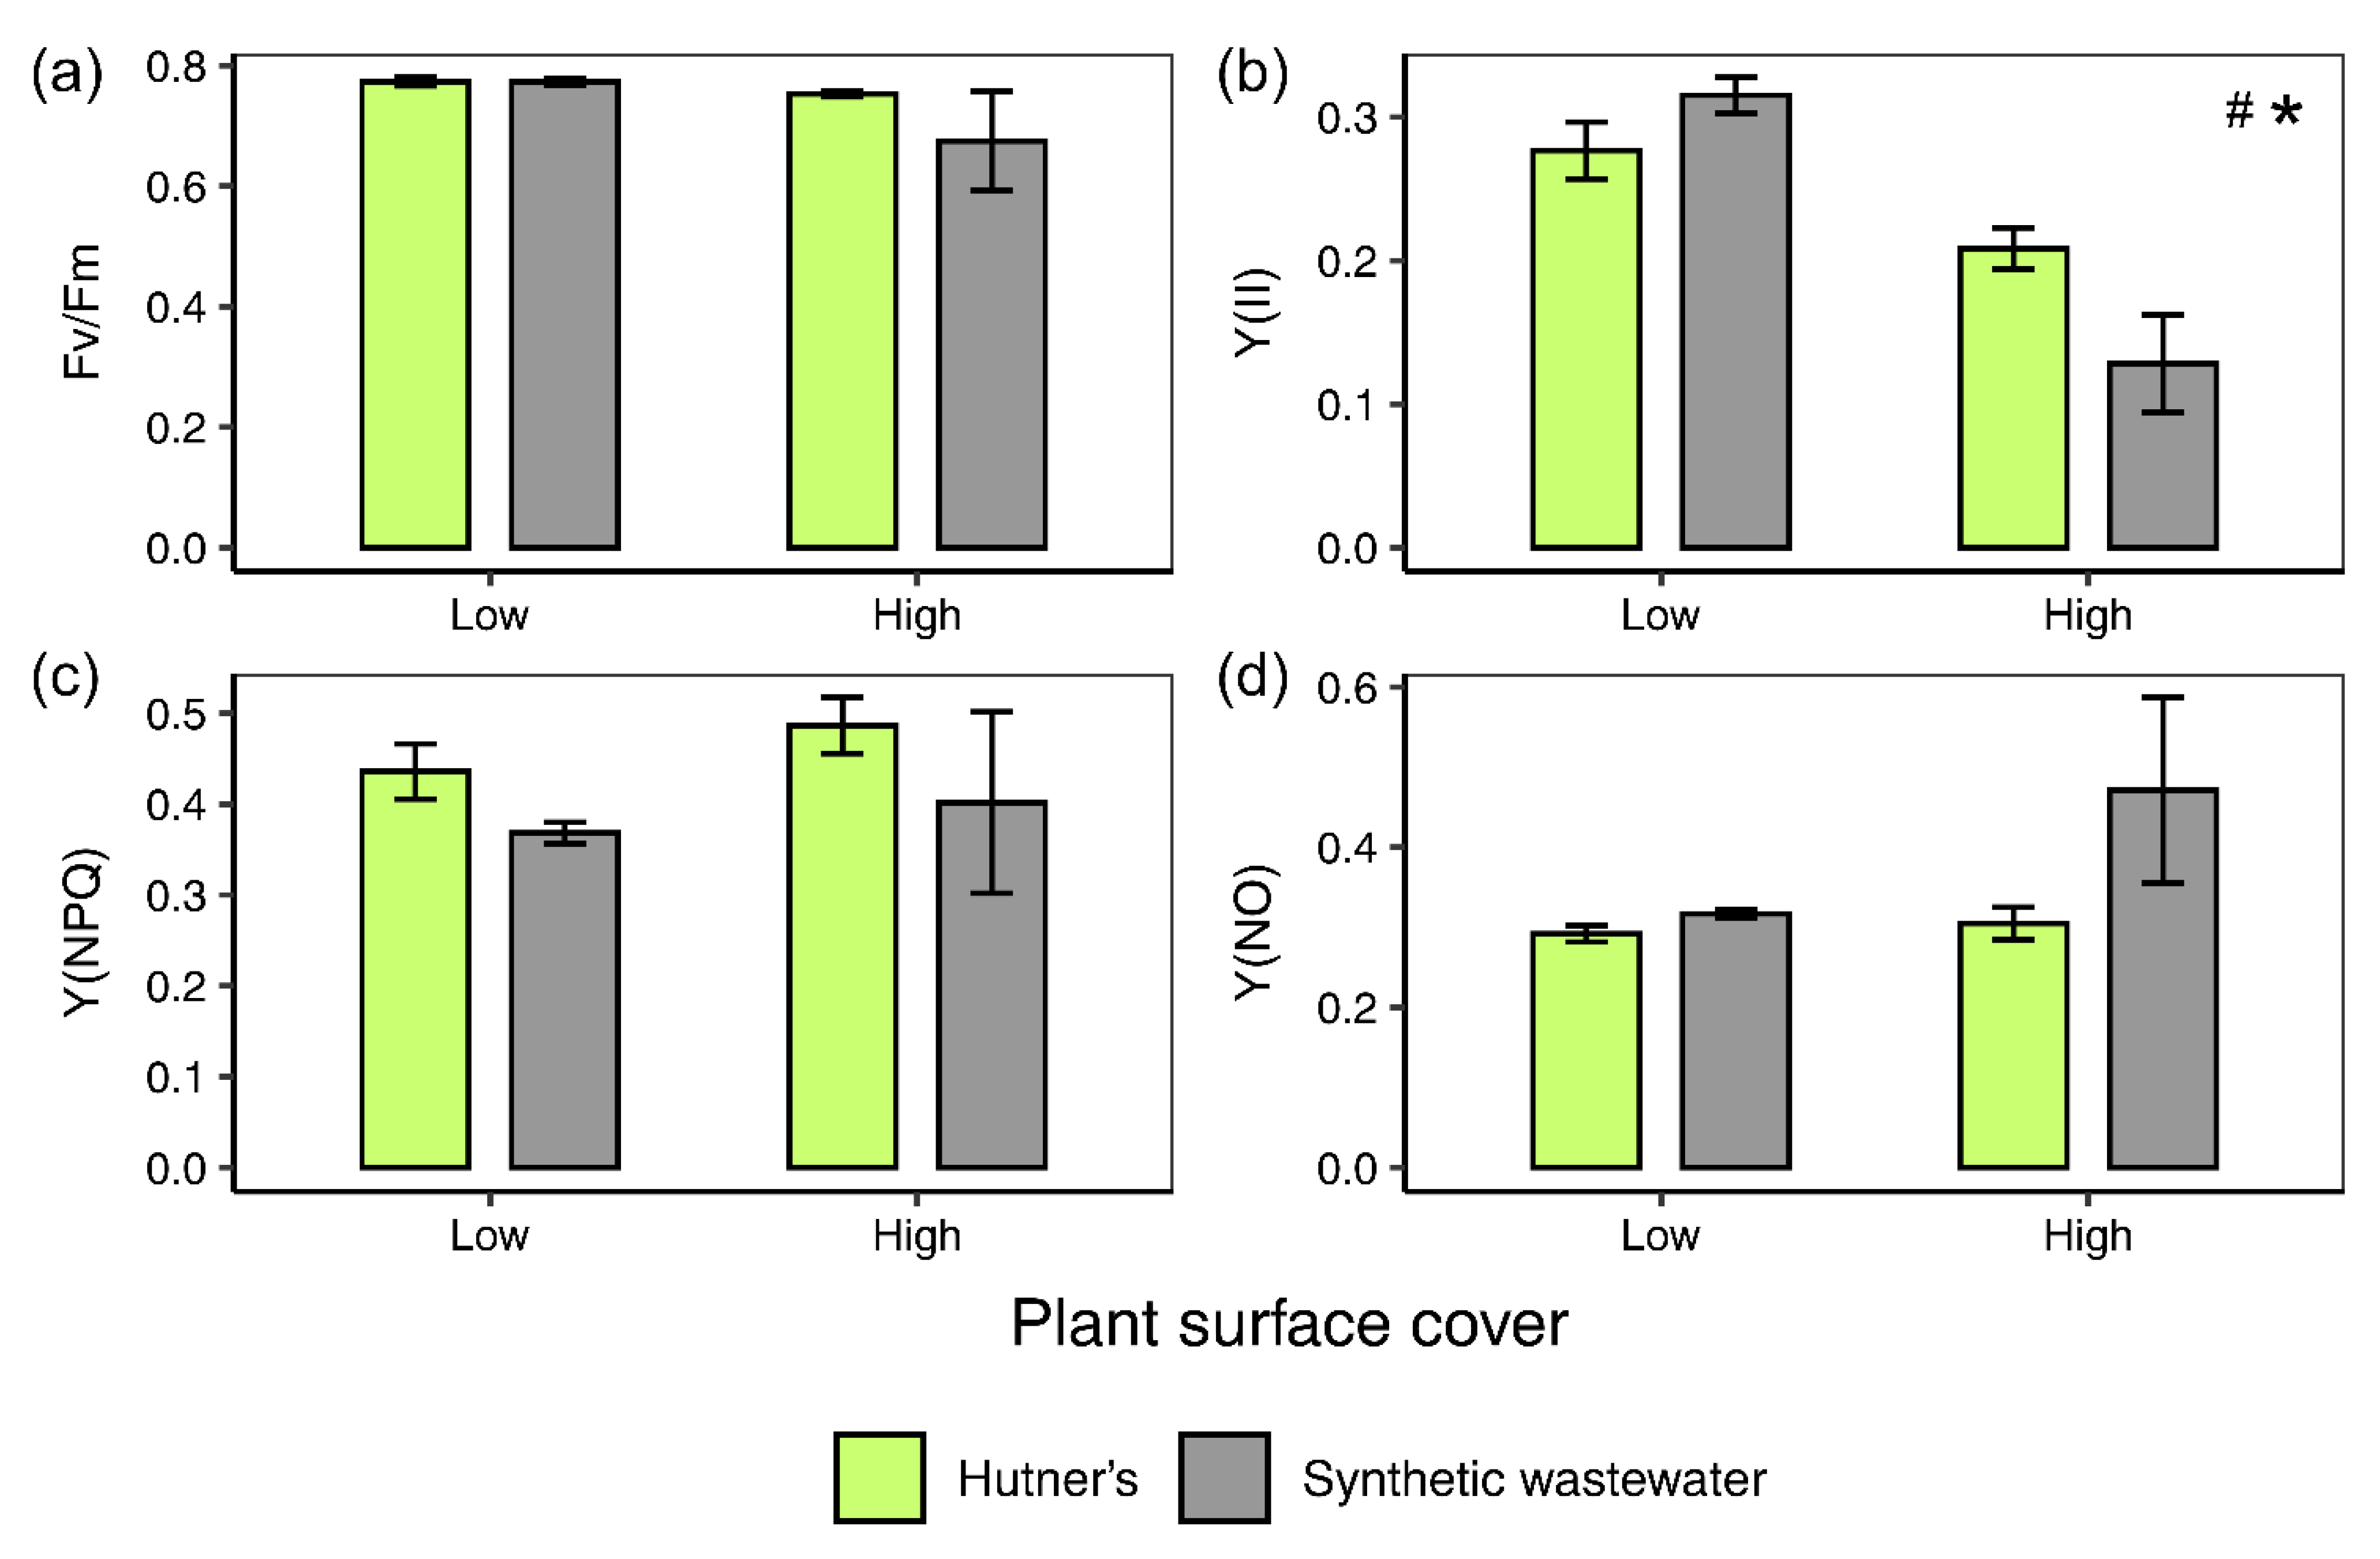
3.3. Chlorophyll a Fluorescence
3.4. Re-Circulating Remediation System: Growth and Remediation at Variable Plant Densities
4. Discussion
4.1. L. minor Growth on Synthetic Wastewater
4.2. Exploring the Mechanism Underlying Density Dependent Changes in Growth Using Chlorophyll Fluorometry
4.3. L. minor Biomass Yield and Protein Content under Variable Density and System Conditions
4.4. Remediation of TN and TP by L. minor from Synthetic Wastewater
5. Conclusions
Author Contributions
Funding
Institutional Review Board Statement
Informed Consent Statement
Data Availability Statement
Acknowledgments
Conflicts of Interest
References
- Mehrabi, Z.; Ellis, E.C.; Ramankutty, N. The challenge of feeding the world while conserving half the planet. Nat. Sustain. 2018, 1, 409–412. [Google Scholar] [CrossRef] [Green Version]
- Ranganathan, J.; Vennard, D.; Waite, R.; Dumas, P.; Lipinski, B.; Searchinger, T. Shifting Diets for a Sustainable Food Future; World Resources Institute: Washington, DC, USA, 2016. [Google Scholar]
- Nearing, M.A.; Xie, Y.; Liu, B.; Ye, Y. Natural and anthropogenic rates of soil erosion. Int. Soil Water Conserv. Res. 2017, 5, 77–84. [Google Scholar] [CrossRef]
- Rosa, L.; Chiarelli, D.D.; Rulli, M.C.; Dell’Angelo, J.; D’Odorico, P. Global agricultural economic water scarcity. Sci. Adv. 2020, 6, eaaz6031. [Google Scholar] [CrossRef] [PubMed]
- Pathak, T.B.; Maskey, M.L.; Dahlberg, J.A.; Kearns, F.; Bali, K.M.; Zaccaria, D. Climate Change Trends and Impacts on California Agriculture: A Detailed Review. Agronomy 2018, 8, 25. [Google Scholar] [CrossRef] [Green Version]
- Obersteiner, M.; Peñuelas, J.; Ciais, P.; van der Velde, M.; Janssens, I.A. The phosphorus trilemma. Nat. Geosci. 2013, 6, 897–898. [Google Scholar] [CrossRef]
- Del Borghi, A.; Moreschi, L.; Gallo, M. Circular economy approach to reduce water–energy–food nexus. Curr. Opin. Environ. Sci. Health 2020, 13, 23–28. [Google Scholar] [CrossRef]
- Ghisellini, P.; Cialani, C.; Ulgiati, S. A review on circular economy: The expected transition to a balanced interplay of environmental and economic systems. J. Clean. Prod. 2016, 114, 11–32. [Google Scholar] [CrossRef]
- Xue, Y.; Luan, W.; Wang, H.; Yang, Y. Environmental and economic benefits of carbon emission reduction in animal husbandry via the circular economy: Case study of pig farming in Liaoning, China. J. Clean. Prod. 2019, 238, 117968. [Google Scholar] [CrossRef]
- Gaucheron, F. Milk and Dairy Products: A Unique Micronutrient Combination. J. Am. Coll. Nutr. 2011, 30, 400S–409S. [Google Scholar] [CrossRef]
- OECD-FAO. Dairy and Dairy Products. In OECD-FAO Agricultural Outlook 2020-2029; OECD-FAO Agricultural Outlook; OECD: Rome, Italy, 2020; ISBN 9789264317673. [Google Scholar]
- Wang, Y.; Serventi, L. Sustainability of dairy and soy processing: A review on wastewater recycling. J. Clean. Prod. 2019, 237, 117821. [Google Scholar] [CrossRef]
- Ince, O. Performance of a two-phase anaerobic digestion system when treating dairy wastewater. Water Res. 1998, 32, 2707–2713. [Google Scholar] [CrossRef]
- Demirel, B.; Yenigun, O. Anaerobic acidogenesis of dairy wastewater: The effects of variations in hydraulic retention time with no pH control. J. Chem. Technol. Biotechnol. 2004, 79, 755–760. [Google Scholar] [CrossRef]
- Malaspina, F.; Cellamare, C.M.; Stante, L.; Tilche, A. Anaerobic treatment of cheese whey with a downflow-upflow hybrid reactor. Bioresour. Technol. 1996, 55, 131–139. [Google Scholar] [CrossRef]
- Ghaly, A.E.; Singh, R.K. Pollution potential reduction of cheese whey through yeast fermentation. Appl. Biochem. Biotechnol. 1989, 22, 181–203. [Google Scholar] [CrossRef]
- Ahmad, T.; Aadil, R.M.; Ahmed, H.; ur Rahman, U.; Soares, B.C.V.; Souza, S.L.Q.; Pimentel, T.C.; Scudino, H.; Guimarães, J.T.; Esmerino, E.A.; et al. Treatment and utilization of dairy industrial waste: A review. Trends Food Sci. Technol. 2019, 88, 361–372. [Google Scholar] [CrossRef]
- Bunce, J.T.; Ndam, E.; Ofiteru, I.D.; Moore, A.; Graham, D.W. A Review of Phosphorus Removal Technologies and Their Applicability to Small-Scale Domestic Wastewater Treatment Systems. Front. Environ. Sci. 2018, 6, 8. [Google Scholar] [CrossRef] [Green Version]
- López-Mosquera, M.E.; Moirón, C.; Carral, E. Use of dairy-industry sludge as fertiliser for grasslands in northwest Spain: Heavy metal levels in the soil and plants. Resour. Conserv. Recycl. 2000, 30, 95–109. [Google Scholar] [CrossRef]
- Akansha, J.; Nidheesh, P.V.; Gopinath, A.; Anupama, K.V.; Kumar, M.S. Treatment of dairy industry wastewater by combined aerated electrocoagulation and phytoremediation process. Chemosphere 2020, 253, 126652. [Google Scholar] [CrossRef] [PubMed]
- Walsh, É.; Paolacci, S.; Burnell, G.; Jansen, M.A.K. The importance of the calcium-to-magnesium ratio for phytoremediation of dairy industry wastewater using the aquatic plant Lemna minor L. Int. J. Phytoremediat. 2020, 22, 694–702. [Google Scholar] [CrossRef] [PubMed]
- Carvalho, F.; Prazeres, A.R.; Rivas, J. Cheese whey wastewater: Characterization and treatment. Sci. Total Environ. 2013, 445, 385–396. [Google Scholar] [CrossRef]
- Toyama, T.; Hanaoka, T.; Tanaka, Y.; Morikawa, M.; Mori, K. Comprehensive evaluation of nitrogen removal rate and biomass, ethanol, and methane production yields by combination of four major duckweeds and three types of wastewater effluent. Bioresour. Technol. 2018, 250, 464–473. [Google Scholar] [CrossRef] [PubMed]
- Dinh, T.T.U.; Soda, S.; Nguyen, T.A.H.; Nakajima, J.; Cao, T.H. Nutrient removal by duckweed from anaerobically treated swine wastewater in lab-scale stabilization ponds in Vietnam. Sci. Total Environ. 2020, 722, 137854. [Google Scholar] [CrossRef]
- Verma, R.; Suthar, S. Synchronized urban wastewater treatment and biomass production using duckweed Lemna gibba L. Ecol. Eng. 2014, 64, 337–343. [Google Scholar] [CrossRef]
- Ziegler, P.; Adelmann, K.; Zimmer, S.; Schmidt, C.; Appenroth, K.J. Relative in vitro growth rates of duckweeds (Lemnaceae)—The most rapidly growing higher plants. Plant Biol. 2015, 17, 33–41. [Google Scholar] [CrossRef]
- Xu, J.; Cui, W.; Cheng, J.J.; Stomp, A.-M. Production of high-starch duckweed and its conversion to bioethanol. Biosyst. Eng. 2011, 110, 67–72. [Google Scholar] [CrossRef]
- Appenroth, K.J.; Sree, K.S.; Böhm, V.; Hammann, S.; Vetter, W.; Leiterer, M.; Jahreis, G. Nutritional value of duckweeds (Lemnaceae) as human food. Food Chem. 2017, 217, 266–273. [Google Scholar] [CrossRef] [PubMed]
- Cheng, J.J.; Stomp, A.-M. Growing Duckweed to Recover Nutrients from Wastewaters and for Production of Fuel Ethanol and Animal Feed. Clean Soil Air Water 2009, 37, 17–26. [Google Scholar] [CrossRef]
- de Beukelaar, M.F.A.; Zeinstra, G.G.; Mes, J.J.; Fischer, A.R.H. Duckweed as human food. The influence of meal context and information on duckweed acceptability of Dutch consumers. Food Qual. Prefer. 2019, 71, 76–86. [Google Scholar] [CrossRef]
- Stadtlander, T.; Förster, S.; Rosskothen, D.; Leiber, F. Slurry-grown duckweed (Spirodela polyrhiza) as a means to recycle nitrogen into feed for rainbow trout fry. J. Clean. Prod. 2019, 228, 86–93. [Google Scholar] [CrossRef]
- Walsh, É.; Kuehnhold, H.; O’Brien, S.; Coughlan, N.E.; Jansen, M.A.K. Light intensity alters the phytoremediation potential of Lemna minor. Environ. Sci. Pollut. Res. 2021. [Google Scholar] [CrossRef] [PubMed]
- Kushwaha, J.P.; Srivastava, V.C.; Mall, I.D. Sequential batch reactor for dairy wastewater treatment: Parametric optimization; kinetics and waste sludge disposal. J. Environ. Chem. Eng. 2013, 1, 1036–1043. [Google Scholar] [CrossRef]
- Charalambous, P.; Shin, J.; Shin, S.G.; Vyrides, I. Anaerobic digestion of industrial dairy wastewater and cheese whey: Performance of internal circulation bioreactor and laboratory batch test at pH 5–6. Renew. Energy 2020, 147, 1–10. [Google Scholar] [CrossRef]
- Landolt, E. Biosystematic Investigations in the Family of Duckweeds (Lemnaceae). The Family of Lemnaceae—A Monographic Study, Volume 1; Veröffentlichungen des Geobotanischen Institutes der ETH: Zürich, Switzerland, 1986. [Google Scholar]
- Driever, S.M.; van Nes, E.H.; Roijackers, R.M.M. Growth limitation of Lemna minor due to high plant density. Aquat. Bot. 2005, 81, 245–251. [Google Scholar] [CrossRef]
- Frédéric, M.; Samir, L.; Louise, M.; Abdelkrim, A. Comprehensive modeling of mat density effect on duckweed (Lemna minor) growth under controlled eutrophication. Water Res. 2006, 40, 2901–2910. [Google Scholar] [CrossRef] [PubMed]
- Ceschin, S.; Sgambato, V.; Ellwood, N.T.W.; Zuccarello, V. Phytoremediation performance of Lemna communities in a constructed wetland system for wastewater treatment. Environ. Exp. Bot. 2019, 162, 67–71. [Google Scholar] [CrossRef]
- Xu, J.; Shen, G. Growing duckweed in swine wastewater for nutrient recovery and biomass production. Bioresour. Technol. 2011, 102, 848–853. [Google Scholar] [CrossRef]
- Xu, J.; Zhao, H.; Stomp, A.-M.; Cheng, J.J. The production of duckweed as a source of biofuels. Biofuels 2012, 3, 589–601. [Google Scholar] [CrossRef]
- Lahive, E.; O’Halloran, J.; Jansen, M.A.K. Differential sensitivity of four Lemnaceae species to zinc sulphate. Environ. Exp. Bot. 2011, 71, 25–33. [Google Scholar] [CrossRef]
- Hutner, S.H. Comparative physiology of heterotrophic growth in higher plants. In Growth and Differentiation in Plants; Iowa State College Press: Ames, IA, USA, 1953; pp. 417–447. [Google Scholar]
- Tarpey, E. An Investigation into the Use of IASBRs for Treatment of Dairy Processing Wastewater. Master’ Thesis, National University of Ireland, Galway, Ireland, 2016. [Google Scholar]
- Landolt, E.; Kandeler, R. Biosystematic Investigations in the Family of Duckweeds (Lemnaceae). The Family of Lemnaceae—A Monographic Study, Volume 2; Veröffentlichungen des Geobotanischen Institutes der ETH: Zürich, Switzerland, 1987. [Google Scholar]
- Easlon, H.M.; Bloom, A.J. Easy Leaf Area: Automated digital image analysis for rapid and accurate measurement of leaf area. Appl. Plant Sci. 2014, 2, 1400033. [Google Scholar] [CrossRef]
- Chaiprapat, S.; Cheng, J.J.; Classen, J.J.; Liehr, S.K. Role of internal nutrient storage in duckweed growth for swine wastewater treatment. Trans. ASAE 2005, 48, 2247–2258. [Google Scholar] [CrossRef]
- Connolly, J.; Wayne, P. Asymmetric competition between plant species. Oecologia 1996, 108, 311–320. [Google Scholar] [CrossRef] [PubMed]
- Balen, B.; Tkalec, M.; Šikić, S.; Tolić, S.; Cvjetko, P.; Pavlica, M.; Vidaković-Cifrek, Ž. Biochemical responses of Lemna minor experimentally exposed to cadmium and zinc. Ecotoxicology 2011, 20, 815–826. [Google Scholar] [CrossRef]
- Bradford, M.M. A rapid and sensitive method for the quantitation of microgram quantities of protein utilizing the principle of protein-dye binding. Anal. Biochem. 1976, 72, 248–254. [Google Scholar] [CrossRef]
- R Core Team. R: A Language and Environment for Statistical Computing; R Foundation for Statistical Computing: Vienna, Austria, 2019. [Google Scholar]
- Al-Nozaily, F.; Alaerts, G.; Veenstra, S. Performance of duckweed-covered sewage lagoons—II. Nitrogen and phosphorus balance and plant productivity. Water Res. 2000, 34, 2734–2741. [Google Scholar] [CrossRef]
- Iatrou, E.I.; Stasinakis, A.S.; Aloupi, M. Cultivating duckweed Lemna minor in urine and treated domestic wastewater for simultaneous biomass production and removal of nutrients and antimicrobials. Ecol. Eng. 2015, 84, 632–639. [Google Scholar] [CrossRef]
- Paolacci, S.; Harrison, S.; Jansen, M.A.K. The invasive duckweed Lemna minuta Kunth displays a different light utilisation strategy than native Lemna minor Linnaeus. Aquat. Bot. 2018, 146, 8–14. [Google Scholar] [CrossRef]
- Wedge, R.M.; Burris, J.E. Effects of light and temperature on duckweed photosynthesis. Aquat. Bot. 1982, 13, 133–140. [Google Scholar] [CrossRef]
- Al-Nozaily, F.; Alaerts, G.; Veenstra, S. Performance of duckweed-covered sewage lagoons—I. Oxygen balance and COD removal. Water Res. 2000, 34, 2727–2733. [Google Scholar] [CrossRef]
- OECD. Test No. 221: Lemna sp. Growth Inhibition Test; OECD Guidelines for the Testing of Chemicals, Section 2; OECD: Paris, France, 2006. [Google Scholar]
- Körner, S.; Vermaat, J.E. The relative importance of Lemna gibba L., bacteria and algae for the nitrogen and phosphorus removal in duckweed-covered domestic wastewater. Water Res. 1998, 32, 3651–3661. [Google Scholar] [CrossRef]
- Porath, D.; Hepher, B.; Koton, A. Duckweed as an aquatic crop: Evaluation of clones for aquaculture. Aquat. Bot. 1979, 7, 273–278. [Google Scholar] [CrossRef]
- Debusk, T.A.; Ryther, J.H.; Hanisak, M.D.; Williams, L.D. Effects of seasonality and plant density on the productivity of some freshwater macrophytes. Aquat. Bot. 1981, 10, 133–142. [Google Scholar] [CrossRef]
- Kong, C.-H.; Zhang, S.-Z.; Li, Y.-H.; Xia, Z.-C.; Yang, X.-F.; Meiners, S.J.; Wang, P. Plant neighbor detection and allelochemical response are driven by root-secreted signaling chemicals. Nat. Commun. 2018, 9, 3867. [Google Scholar] [CrossRef] [Green Version]
- Pierik, R.; Mommer, L.; Voesenek, L.A.C.J. Molecular mechanisms of plant competition: Neighbour detection and response strategies. Funct. Ecol. 2013, 27, 841–853. [Google Scholar] [CrossRef]
- Murchie, E.H.; Lawson, T. Chlorophyll fluorescence analysis: A guide to good practice and understanding some new applications. J. Exp. Bot. 2013, 64, 3983–3998. [Google Scholar] [CrossRef] [PubMed] [Green Version]
- Klughammer, C.; Schreiber, U. Complementary PS II quantum yields calculated from simple fluorescence parameters measured by PAM fluorometry and the Saturation Pulse method. PAM Appl. Notes 2008, 1, 27–35. [Google Scholar]
- Kramer, D.M.; Johnson, G.; Kiirats, O.; Edwards, G.E. New fluorescence parameters for the determination of QA redox state and excitation energy fluxes. Photosynth. Res. 2004, 79, 209–218. [Google Scholar] [CrossRef] [PubMed]
- Juneau, P.; Qiu, B.; Deblois, C.P. Use of chlorophyll fluorescence as a tool for determination of herbicide toxic effect: Review. Toxicol. Environ. Chem. 2007, 89, 609–625. [Google Scholar] [CrossRef]
- Kufel, L.; Strzałek, M.; Przetakiewicz, A. Plant response to overcrowding–Lemna minor example. Acta Oecologica 2018, 91, 73–80. [Google Scholar] [CrossRef]
- Zhang, L.-M.; Jin, Y.; Yao, S.-M.; Lei, N.-F.; Chen, J.-S.; Zhang, Q.; Yu, F.-H. Growth and Morphological Responses of Duckweed to Clonal Fragmentation, Nutrient Availability, and Population Density. Front. Plant Sci. 2020, 11, 618. [Google Scholar] [CrossRef] [PubMed]
- Huang, D.; Wu, L.; Chen, J.R.; Dong, L. Morphological plasticity, photosynthesis and chlorophyll fluorescence of Athyrium pachyphlebium at different shade levels. Photosynthetica 2011, 49, 611–618. [Google Scholar] [CrossRef]
- Hallik, L.; Niinemets, Ü.; Kull, O. Photosynthetic acclimation to light in woody and herbaceous species: A comparison of leaf structure, pigment content and chlorophyll fluorescence characteristics measured in the field. Plant Biol. 2012, 14, 88–99. [Google Scholar] [CrossRef] [PubMed]
- Bilas, R.D.; Bretman, A.; Bennett, T. Friends, neighbours and enemies: An overview of the communal and social biology of plants. Plant. Cell Environ. 2021, 44, 997–1013. [Google Scholar] [CrossRef]
- Jang, M.-H.; Ha, K.; Takamura, N. Reciprocal allelopathic responses between toxic cyanobacteria (Microcystis aeruginosa) and duckweed (Lemna japonica). Toxicon 2007, 49, 727–733. [Google Scholar] [CrossRef]
- Bich, T.T.N.; Kato-Noguchi, H. Allelopathic potential of two aquatic plants, duckweed (Lemna minor L.) and water lettuce (Pistia stratiotes L.), on terrestrial plant species. Aquat. Bot. 2012, 103, 30–36. [Google Scholar] [CrossRef]
- Färber, E.; Königshofer, H.; Kandeler, R. Ethylene Production and Overcrowding in Lemnaceae. J. Plant Physiol. 1986, 124, 379–384. [Google Scholar] [CrossRef]
- Dubois, M.; Van den Broeck, L.; Inzé, D. The Pivotal Role of Ethylene in Plant Growth. Trends Plant Sci. 2018, 23, 311–323. [Google Scholar] [CrossRef] [PubMed] [Green Version]
- Färber, E.; Kandeler, R. Significance of Calcium Ions in the Overcrowding Effect in Spirodela Polyrrhiza P 143. J. Plant Physiol. 1989, 135, 94–98. [Google Scholar] [CrossRef]
- Färber, E.; Kandeler, R. Phytochrome effect on ethylene production after overcrowding in Spirodela (Lemnaceae). Phyton Ann. Rei Bot. Austria 1990, 30, 89–95. [Google Scholar]
- Anderson, K.E.; Lowman, Z.; Stomp, A.M.; Chang, J. Duckweed as a Feed Ingredient in Laying Hen Diets and its Effect on Egg Production and Composition. Int. J. Poult. Sci. 2011, 10, 4–7. [Google Scholar] [CrossRef] [Green Version]
- Ge, X.; Zhang, N.; Phillips, G.C.; Xu, J. Growing Lemna minor in agricultural wastewater and converting the duckweed biomass to ethanol. Bioresour. Technol. 2012, 124, 485–488. [Google Scholar] [CrossRef]
- Verma, R.; Suthar, S. Impact of density loads on performance of duckweed bioreactor: A potential system for synchronized wastewater treatment and energy biomass production. Environ. Prog. Sustain. Energy 2015, 34, 1596–1604. [Google Scholar] [CrossRef]
- Xu, J.; Shen, G. Effects of Harvest Regime and Water Depth on Nutrient Recovery from Swine Wastewater by Growing Spirodela oligorrhiza. Water Environ. Res. 2011, 83, 2049–2056. [Google Scholar] [CrossRef] [PubMed]
- Roijackers, R.; Szabó, S.; Scheffer, M. Experimental analysis of the competition between algae and duckweed. Arch. Hydrobiol. 2004, 160, 401–412. [Google Scholar] [CrossRef]
- Mohedano, R.A.; Costa, R.H.R.; Tavares, F.A.; Belli Filho, P. High nutrient removal rate from swine wastes and protein biomass production by full-scale duckweed ponds. Bioresour. Technol. 2012, 112, 98–104. [Google Scholar] [CrossRef] [Green Version]
- Hymowitz, T.; Collins, F.I.; Panczner, J.; Walker, W.M. Relationship between the content of oil, protein, and sugar in soybean seed. Agron. J. 1972, 64, 613–616. [Google Scholar] [CrossRef]
- Rekowski, A.; Langenkämper, G.; Dier, M.; Wimmer, M.A.; Scherf, K.A.; Zörb, C. Determination of soluble wheat protein fractions using the Bradford assay. Cereal Chem. 2021. [Google Scholar] [CrossRef]
- Mæhre, H.K.; Dalheim, L.; Edvinsen, G.K.; Elvevoll, E.O.; Jensen, I.-J. Protein Determination—Method Matters. Foods 2018, 7, 5. [Google Scholar] [CrossRef] [PubMed] [Green Version]
- Cui, W.; Cheng, J.J. Growing duckweed for biofuel production: A review. Plant Biol. 2015, 17, 16–23. [Google Scholar] [CrossRef]
- Zimmo, O.R.; van der Steen, N.P.; Gijzen, H.J. Nitrogen mass balance across pilot-scale algae and duckweed-based wastewater stabilisation ponds. Water Res. 2004, 38, 913–920. [Google Scholar] [CrossRef] [PubMed]
- Zhao, Y.; Fang, Y.; Jin, Y.; Huang, J.; Ma, X.; He, K.; He, Z.; Wang, F.; Zhao, H. Microbial community and removal of nitrogen via the addition of a carrier in a pilot-scale duckweed-based wastewater treatment system. Bioresour. Technol. 2015, 179, 549–558. [Google Scholar] [CrossRef]
- Benjawan, L.; Koottatep, T. Nitrogen removal in recirculated duckweed ponds system. Water Sci. Technol. 2007, 55, 103–110. [Google Scholar] [CrossRef] [PubMed]
- Cheng, J.; Landesman, L.; Bergmann, B.; Classen, J.J.; Howard, J.W.; Yamamoto, Y.T. Nutrient Removal from swine lagoon liquid by Lemna minor 8627. Trans. ASAE 2002, 45, 1003–1010. [Google Scholar] [CrossRef]
- Cheng, J.; Bergmann, B.A.; Classen, J.J.; Stomp, A.M.; Howard, J.W. Nutrient recovery from swine lagoon water by Spirodela punctata. Bioresour. Technol. 2002, 81, 81–85. [Google Scholar] [CrossRef]
- Szabó, S.; Braun, M.; Nagy, P.; Balázsy, S.; Reisinger, O. Decomposition of duckweed (Lemna gibba) under axenic and microbial [-2pt] conditions: Flux of nutrients between litter water and sediment, the impact of leaching and microbial degradation. Hydrobiologia 2000, 434, 201–210. [Google Scholar] [CrossRef]
- Szabó, S.; Braun, M.; Borics, G. Elemental flux between algae and duckweeds (Lemna gibba) during competition. Arch. Hydrobiol. 1999, 146, 355–367. [Google Scholar] [CrossRef]


Publisher’s Note: MDPI stays neutral with regard to jurisdictional claims in published maps and institutional affiliations. |
© 2021 by the authors. Licensee MDPI, Basel, Switzerland. This article is an open access article distributed under the terms and conditions of the Creative Commons Attribution (CC BY) license (https://creativecommons.org/licenses/by/4.0/).
Share and Cite
Walsh, É.; Coughlan, N.E.; O’Brien, S.; Jansen, M.A.K.; Kuehnhold, H. Density Dependence Influences the Efficacy of Wastewater Remediation by Lemna minor. Plants 2021, 10, 1366. https://doi.org/10.3390/plants10071366
Walsh É, Coughlan NE, O’Brien S, Jansen MAK, Kuehnhold H. Density Dependence Influences the Efficacy of Wastewater Remediation by Lemna minor. Plants. 2021; 10(7):1366. https://doi.org/10.3390/plants10071366
Chicago/Turabian StyleWalsh, Éamonn, Neil E. Coughlan, Seán O’Brien, Marcel A. K. Jansen, and Holger Kuehnhold. 2021. "Density Dependence Influences the Efficacy of Wastewater Remediation by Lemna minor" Plants 10, no. 7: 1366. https://doi.org/10.3390/plants10071366