1. Introduction
Industrial spatial agglomeration refers to the geospatial concentration of interconnected firms [
1], representing a worldwide phenomenon driven by economies of scale [
2,
3,
4]. A suitable industrial agglomeration pattern, which considers both the agglomeration degree and the cluster location, can facilitate firms in benefiting from the industrial agglomeration effect and acquiring clear advantages in terms of cost, productivity, and innovation environment [
5,
6,
7,
8,
9,
10]. It serves as a crucial force for the high-quality and sustainable development of regions and cities [
11,
12,
13,
14,
15]. A comprehensive analysis of industrial agglomeration patterns helps evaluate the performance of existing policies and formulate new ones, thereby promoting the development of a more suitable industrial agglomeration pattern [
10,
16,
17,
18]. Therefore, a comprehensive analysis of industrial agglomeration patterns is necessary. Previous studies have suggested that rapidly and accurately measuring agglomeration degrees and cluster locations is a prerequisite for comprehensive analysis of industrial spatial agglomeration patterns [
19,
20,
21]. Nonetheless, industrial agglomeration degrees and cluster locations are interrelated and have significant spatial heterogeneity across different regions, periods, and industry types, rendering the rapid and accurate measurement of both challenging [
22,
23,
24,
25,
26].
Scholars in the early days primarily focused on measuring agglomeration degrees of industries at the administrative unit scale [
17,
22]. Specifically, an industrial agglomeration degree is typically quantified by constructing an index that reflects the deviation or proportion of the industry against all industries based on statistical data in administrative units [
17]. However, traditional indexes are unable to accurately reflect agglomeration degrees, such as locational entropy, the Thiel index, spatial Gini coefficient, Herfindahl index, and EG index [
13,
15,
27,
28,
29,
30,
31]. This is mainly because these indexes were primarily designed for a fixed spatial scale [
17], which makes them inevitably influenced by the zoning scheme of the administrative unit, i.e., the existence of the Modifiable Areal Unit Problem (MAUP) [
22,
32,
33].
Subsequent studies proposed distance-based methods for measuring the agglomeration degrees of industries [
22]. These methods can overcome the limitation of the fixed spatial scale and the MAUP [
34,
35] and produce more accurate agglomeration degrees [
17,
22]. Specifically, the distance-based method includes two steps, namely, calculating an average index representing the proximity of point-pair distances of firms to distance thresholds and comparing it with confidence intervals to obtain a curve representing the multi-scale agglomeration degree. Commonly used indexes of the distance-based agglomeration degree measuring method include Ripley’s K-function (i.e., the K-function) [
36] and its variant, L-function [
37,
38], as well as the Duranton and Overman (DO) index [
20]. Among these indexes, the K-function and L-function, which count the numbers of point-pair distances of firms that are less than different distance thresholds to measure proximity, tend to overestimate the spatial scale of the agglomeration distribution. This is because the result of large spatial scales contains small spatial scales, which consequently results in a cumulative effect [
20,
22]. The DO index employs a kernel function to represent the proximity and address the cumulative effect in the K-function and L-function [
20,
39]. Although several indexes, such as the M-function [
40,
41] and W-function [
42], have emerged, they cannot entirely substitute the DO index because of their low computational efficiency, rendering it challenging to apply them to massive datasets [
22]. Thereby, the distance-based method based on the DO index has become the predominant method for measuring industrial agglomeration degrees of regions [
17]. It has been widely used in studies of industrial agglomeration in the country, urban agglomeration, and inner city levels [
19,
20,
23,
39,
43,
44,
45,
46,
47,
48,
49,
50,
51]. Nevertheless, the DO index method still faces challenges, such as a lack of explanations on the result curves, low accessibility of micro-data on firms, and ignorance of cluster locations [
21,
22,
52].
Several methods have been adopted to obtain accurate industrial cluster locations, such as the spatial scan statistic [
21,
53] and the kernel density estimation [
54,
55,
56]. However, these methods cannot simultaneously obtain cluster locations and their relationships at multiple scales, because these cluster locations may vary at different scales [
24]. To further address these limitations, Buzard et al. proposed a Multi-scale Cluster Location Mining (MCLM) method based on the Local K-function (LK), i.e., MCLM-LK. This method has provided promising results for mining cluster locations in research and development labs and breweries in America [
35,
57]. Specifically, the MCLM-LK method counts the number of industry firms within a given boundary distance parameter for each firm and then adopts a local test to identify core firms for constituting industrial cluster locations. Although the MCLM-LK method combined with the K-function method offers an effective way of simultaneously measuring agglomeration degrees and mining cluster locations of industries [
35,
57,
58], it still has several limitations. First, the LK exhibits a significant cumulative effect, which may lead to identical calculation results for neighboring firms and add biases to cluster locations. Second, the boundary distance parameter in the MCLM-LK method depends on subjective experience inputs, rendering it difficult to jointly analyze agglomeration degrees and cluster locations. Third, the computational cost is very high because the local test requires an additional 999 calculations for each firm at each spatial scale.
This study aims to propose a new framework for analyzing multi-scale industrial spatial agglomeration patterns that simultaneously consider agglomeration degrees and cluster locations. In the proposed framework, agglomeration degrees are calculated by using the DO index, while cluster locations are estimated based on a newly developed local DO (LDO) index. By incorporating the LDO index, the traditional MCLM method is improved to provide more accurate cluster location mining results with higher efficiency and a more objective parameter setting. The proposed MCLM-LDO method will be compared with three baseline methods based on two synthetic datasets. The integrated DO index and LDO index (DO-LDO) framework will be applied to analyze the spatial agglomeration patterns of the industry of computer, communication, and other electronic equipment manufacturing in Guangdong Province of China from 2000 to 2022. The remainder of this study is organized as follows.
Section 2 describes the proposed framework and
Section 3 analyzes the experimental results, followed by the discussion and conclusions in
Section 4 and
Section 5.
2. Methodology
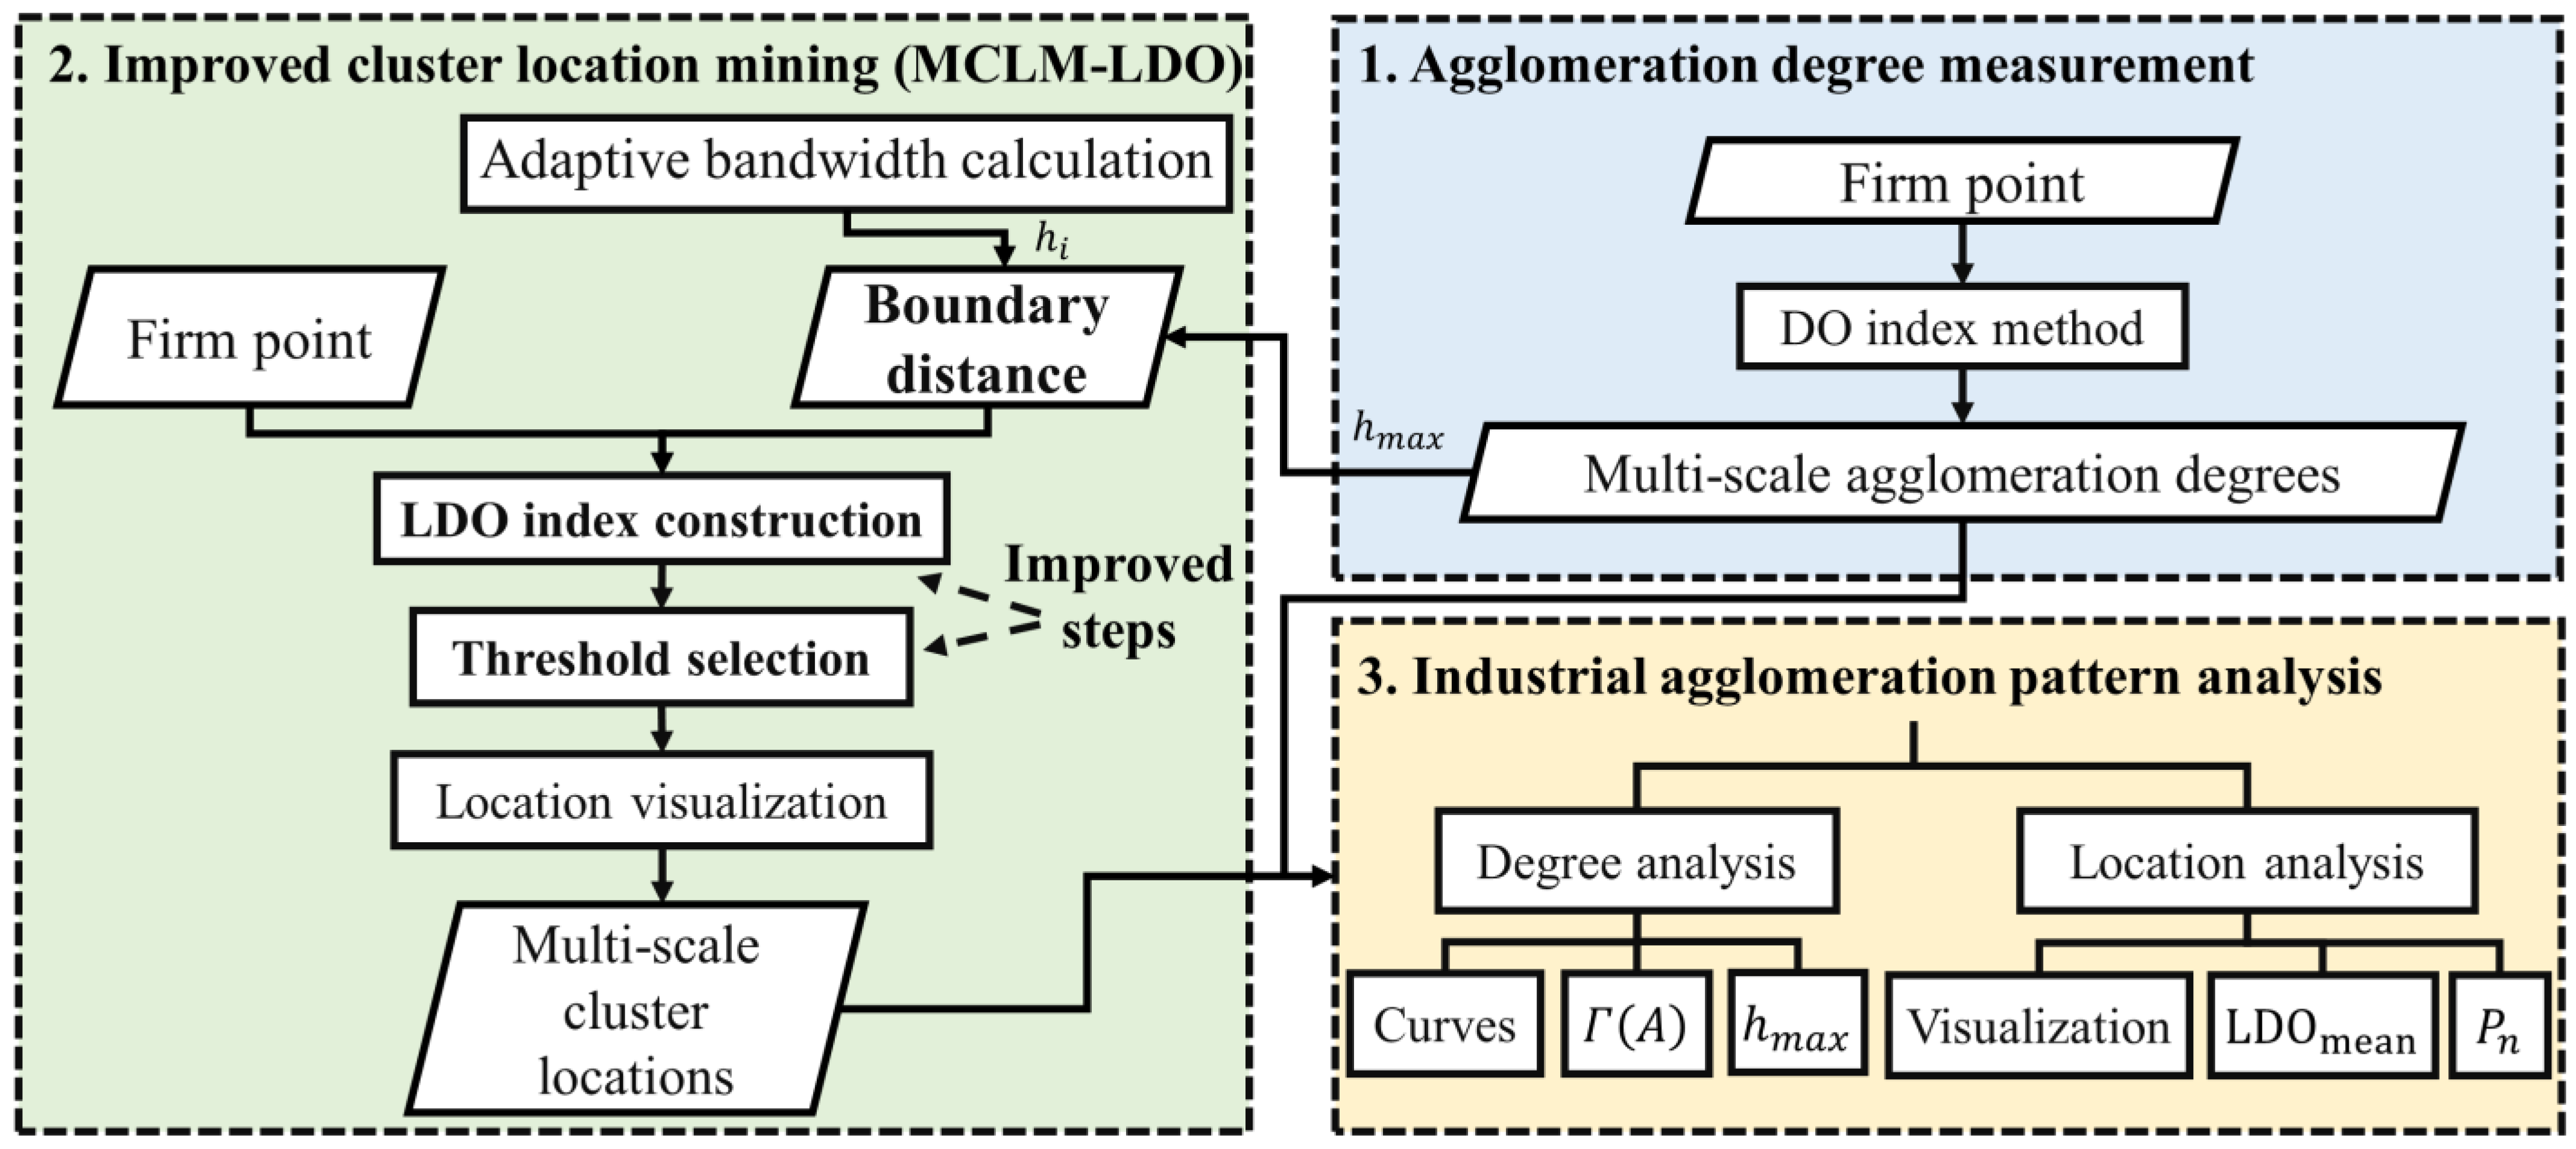
As shown in
Figure 1, the DO-LDO framework of this study mainly comprises three parts. First, the multi-scale agglomeration degrees are measured by using the DO index method. Then, to obtain multi-scale cluster locations, a novel LDO index is constructed, and an MCLM-LDO method is proposed by introducing the LDO index into the MCLM. Thirdly, a comprehensive analysis of industrial spatial agglomeration patterns is performed from the dual perspectives of agglomeration degrees and cluster locations.
2.1. Multi-Scale Agglomeration Degree Measurement Based on DO Index Method
This study adopted the widely used DO index method to measure agglomeration degrees because it often provides a satisfactory result for the multi-scale agglomeration degrees of industries [
17]. The DO index of the investigated industry
at the distance threshold
can be calculated by Equation (1), denoted as
. Generally, the sequence of distance thresholds starts at 0 and increments by one or one-tenth of the distance unit. The maximum distance threshold will be set at the quartile (e.g., median or lower quartile) of point-pair distances of firms or the area diameter [
20,
45].
where
is the number of firms in industry
,
is the Euclidean distance between firm
and firm
(unless otherwise specified, distance in this study refers to Euclidean distance), and
is the optimal bandwidth calculated using Siverman’s method (Equation (2)) [
59].
where
and
represent the standard deviation and lower quartile of point-pair distances of all firms in the industry
.
An upper global confidence band for the random distribution of industry
is then generated through a counterfactual test [
19,
20]. The main steps include the following:
(1) A Monte Carlo sample approach is used to create simulations, with firms in each simulation ( generally ranges from 100 to 1000) from all background industries (e.g., manufacturing);
(2) DO indexes of these simulations, , are calculated;
(3) For each , all of simulations are ranked in descending order, and the initial upper global confidence band is selected as the 5-th percentile;
(4) It is determined whether the number of simulations greater than the upper global confidence band for at least one exceeds 5%;
(5) If so, a larger value, i.e., the -th percentile, is taken as the new upper global confidence band to perform step (4), otherwise, a determined upper global confidence band is achieved.
For example, there are 1000 simulations created and sorted, which can be expressed as at each . Among them, denotes the initial upper global confidence band. If step (4) is not achieved, then use as a new upper global confidence band and continue with step (4) until it is achieved.
Finally, the localization index
at different spatial scales of industry
is calculated by Equation (3), and a localization index curve can be created for quantifying the multi-scale agglomeration degree [
20,
43].
where
is greater than 0 at
, the spatial scale at which industry
is agglomerated, the larger
indicates the higher agglomeration degree and the stronger industrial agglomeration effect.
2.2. LDO Index Construction for MCLM-LDO Method
To address the limitations of the MCLM-LK method, this study proposes an MCLM-LDO method by introducing a novel LDO index into the MCLM. The MCLM-LDO method first constructs the LDO index and proposes an objective determination approach for its distance parameter, enhancing an accurate measurement of the agglomeration degrees of individual firms. Then, the threshold selection is used to identify firms with higher LDO indexes as core firms, i.e., individual firms with significantly high agglomeration degrees are identified, dramatically reducing the computation time compared to the local test, and multi-scale cluster locations are subsequently visualized based on the core firms. Finally, an evaluation in terms of both the accuracy and efficiency of the proposed MCLM-LDO method was performed.
2.2.1. Construction of LDO Index
The preliminary step of the MCLM is to measure the agglomeration degrees of individual firms by using a suitable index. A traditional index, LK, was commonly used by counting the number of firms within a specified boundary distance parameter
(Equation (4)). However, it results in the shortcoming that neighboring firms have identical degrees.
where
denotes the number of firms in industry
whose distance from firm
is not greater than
.
The DO index has addressed the cumulative effect of the K-function, thereby enabling a more accurate measurement of industrial agglomeration degrees in a region [
20,
39]. This study, therefore, constructs a local version of the DO index to address the shortcomings of the LK function. Specifically, this study adopts a kernel function instead of the counting method in the LK, and it constructs a novel index (the LDO index) to obtain neighboring firms with different degrees for better measuring the agglomeration degrees of individual firms. For a firm
in industry
, its LDO index when the peak and boundary distance parameters are
and
, respectively, is denoted as
and can be described as Equation (5).
The peak distance represents the distance where the agglomeration degree is maximized, and the boundary distance represents the farthest distance where the agglomeration degree is detectable. Given that agglomeration degrees of individual firms decay with distance [
6,
24], the peak distance
in this study is set to 0, and the LDO index can be further simplified as Equation (6). Inputting different
values will obtain the LDO index of a firm at different spatial scales.
2.2.2. Determination of Boundary Distance Parameters
The boundary distance parameter of the LDO index needs to be determined for performing Equation (6). Currently, the boundary distance parameter of LK relies on subjective experience for determination, ignoring the heterogeneity of the boundary distance parameter in different regions, periods, and industry types. This makes it difficult to accurately mine multi-scale cluster locations and their relationships. In this study, both global and local spatial scales are considered to improve the accuracy of mining multi-scale cluster locations and their relationships. Combined with the advantage that the localization index curve is a superior characterization for multi-scale agglomeration degrees, an approach is proposed to determine the boundary distance parameter at a global scale (denoted as ), and global scopes of industrial agglomeration can be depicted. For the local location of small cluster, an adaptive approach is used to determine the boundary distance parameter at a local scale (denoted as ).
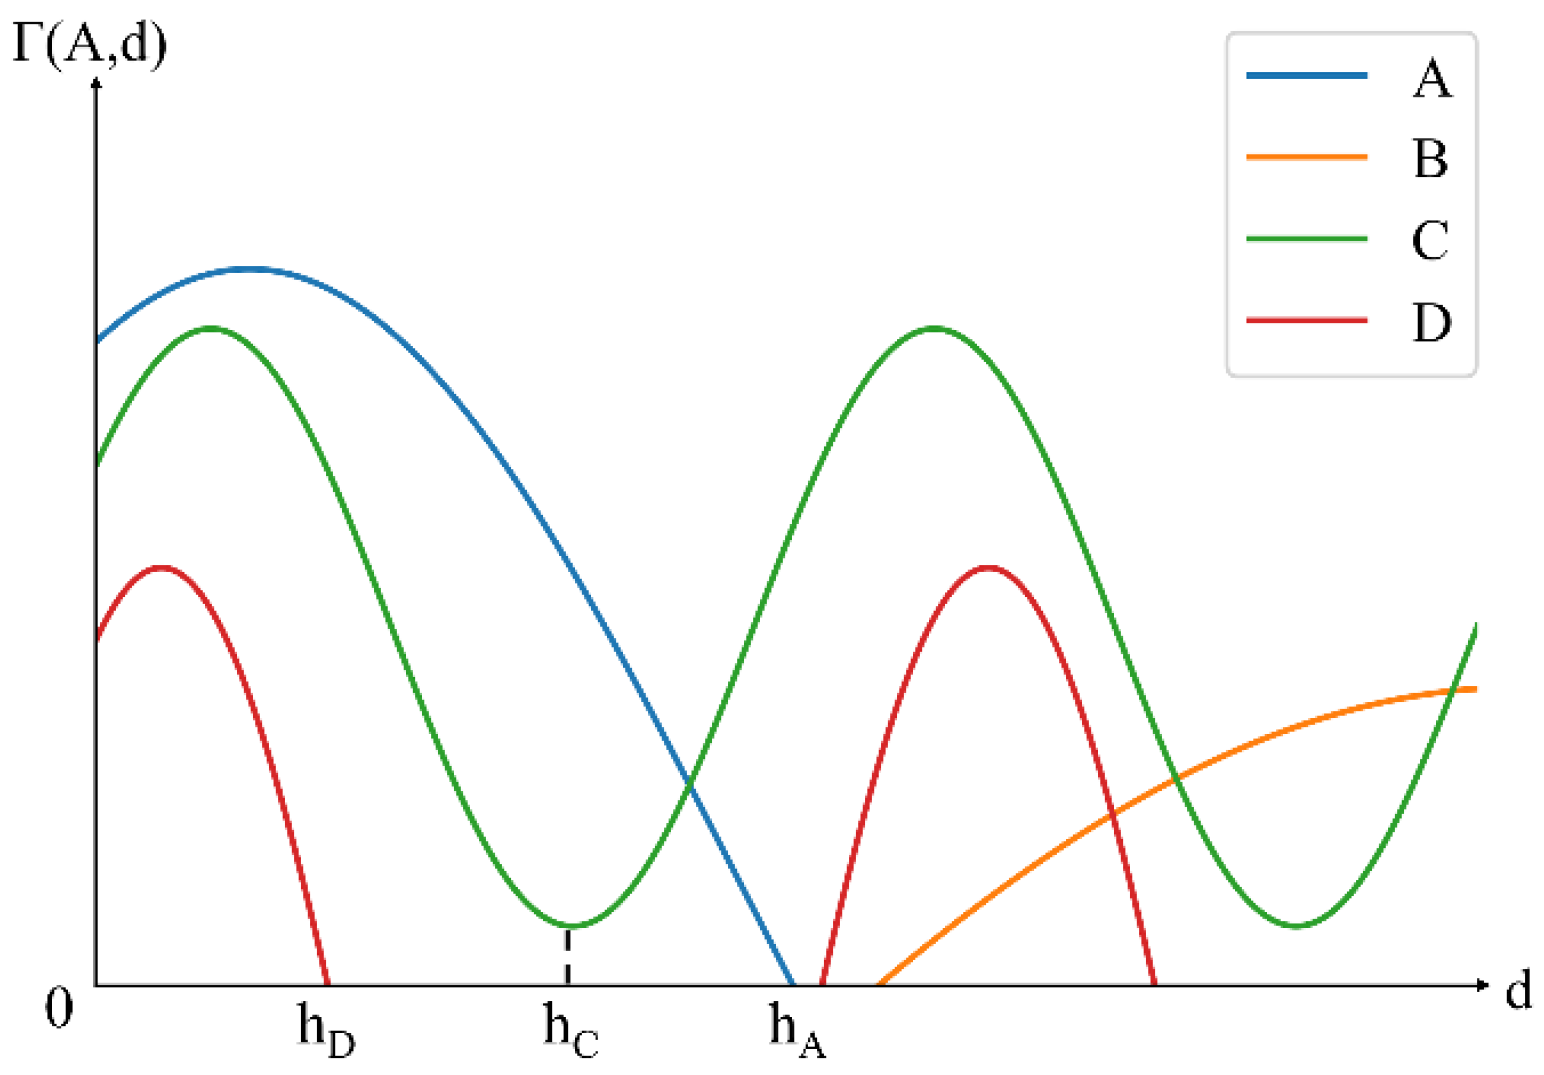
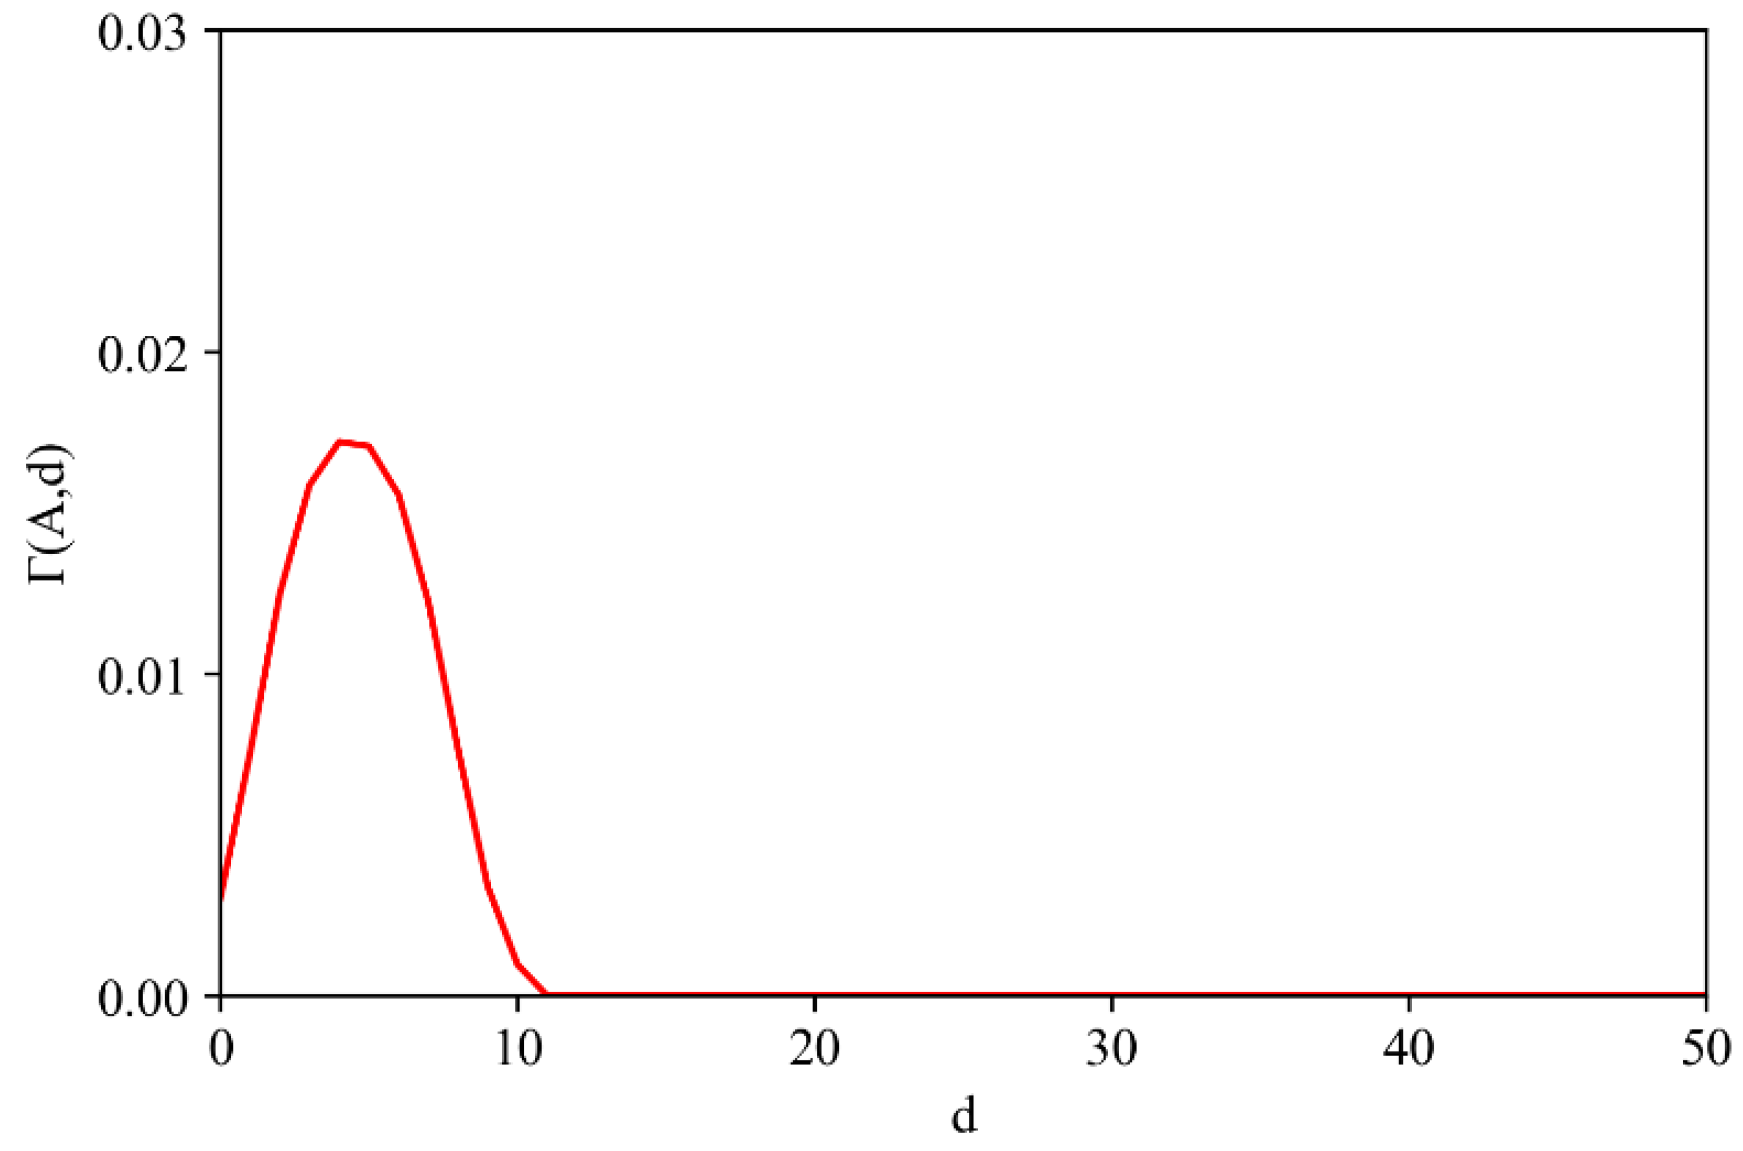
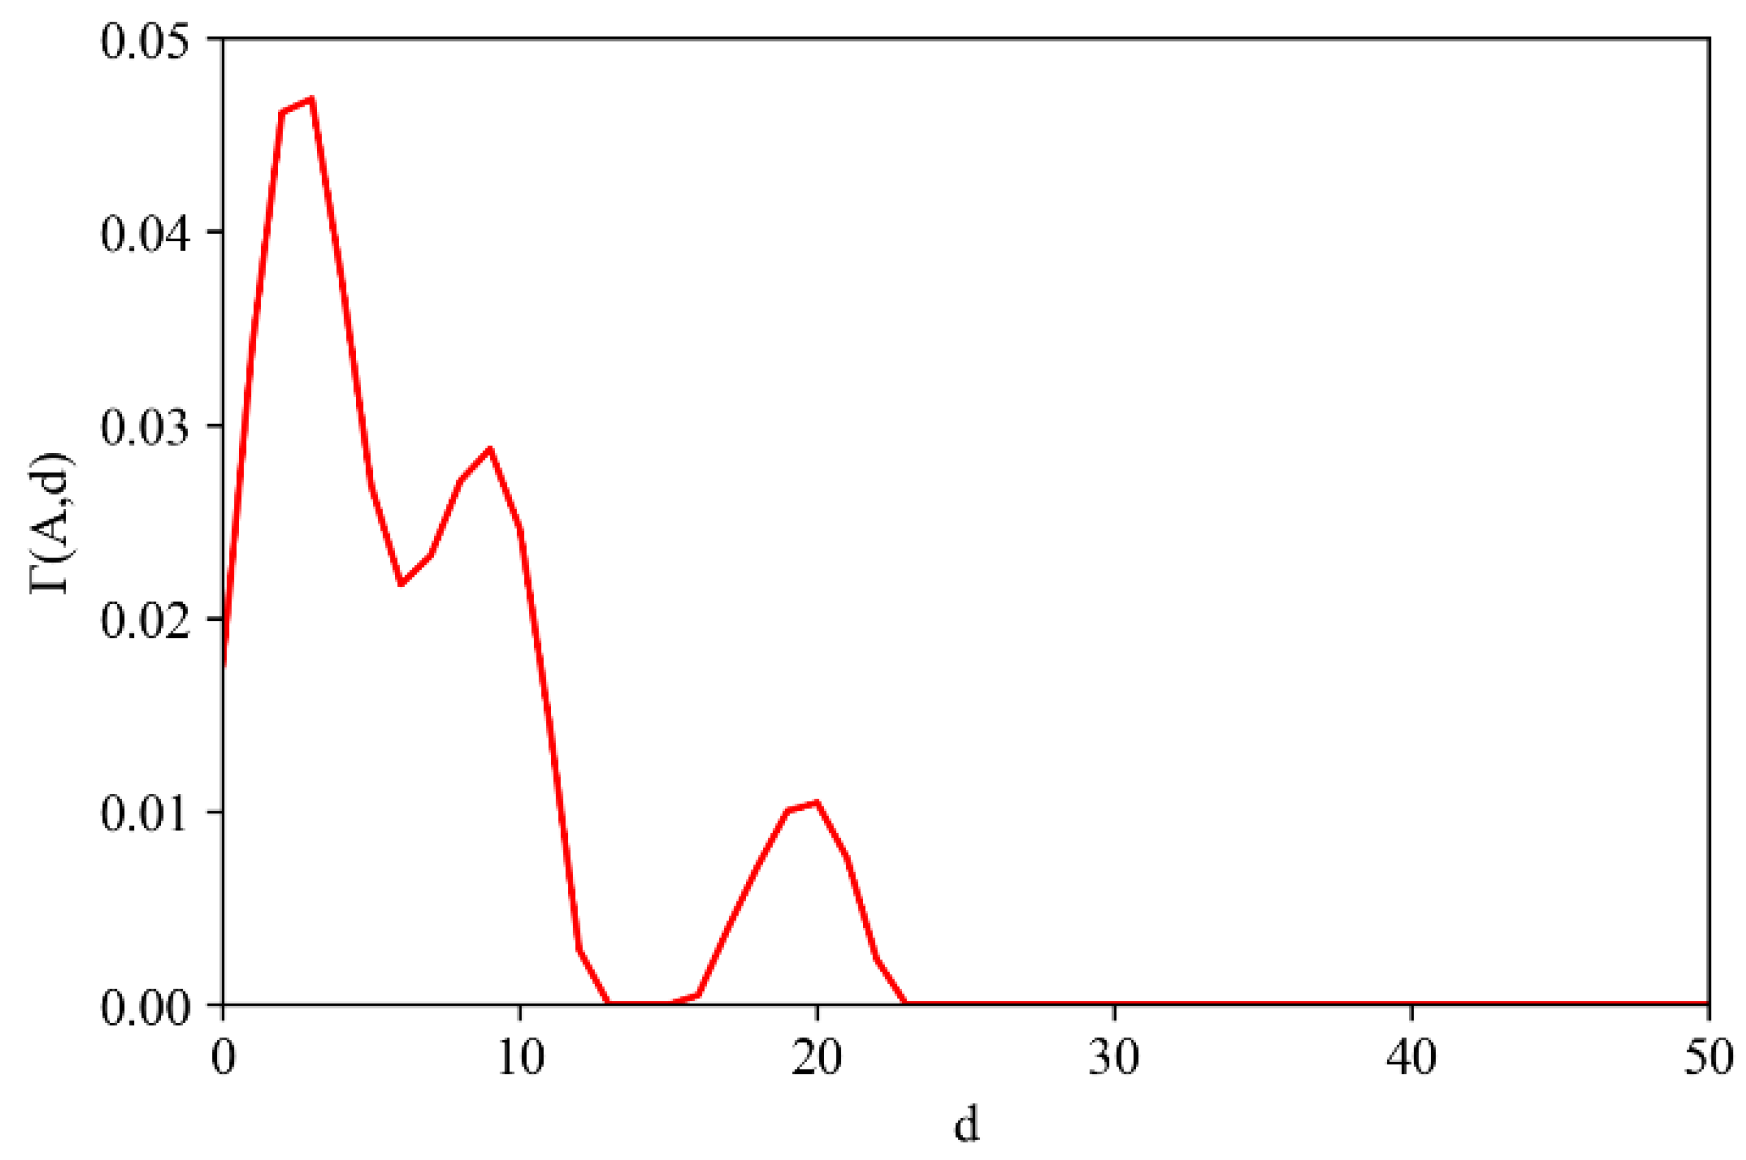
The global scale parameter of the agglomerated industry,
, is determined as the smaller distance between the first decline of the curve to 0 and the first curve trough. For example, in
Figure 2, the localization index curves of industries A, C, and D exhibit
greater than 0 within short distances, indicating agglomeration. The corresponding
,
, and
represent the
for these industries. In contrast, the localization index curve of industry B is greater than 0 at long distances, indicating dispersion [
20], with no
determined. The local scale parameter
refers to Siverman’s optimal bandwidth of the DO index method and is calculated using Equation (2). The difference here is that
and
represent the standard deviation and lower quartile of distances of firm
from the other firms in industry
. Through calculation, each firm
will have its
, which can detect clusters at the local scale different from the global scale.
2.2.3. Core Firm Identification Based on Threshold Selection
Based on the determination of two objective boundary distances, LDO indexes of all firms were calculated (Equation (6)), and cluster locations can be obtained by identifying the core firms, i.e., the firms with higher LDO indexes. The MCLM-LK method is generally limited by computational inefficiency due to the local test, that is, calculating 999 simulated values for each firm through the Monte Carlo simulation and identifying the firms whose observed value is higher than all of their simulated values to be the core firms [
35]. In this study, a threshold selection approach is proposed to identify core firms at multiple scales. The LDO index of a firm complying with Equation (7) is considered as a core firm.
where
and
denote the mean and standard deviation of LDO indexes of firms in industry
with input
. When the distances between core firms are greater than
, they are considered to belong to different clusters. If the number of a cluster is greater than or equal to 0.5%
[
54], the cluster is selected as the finally estimated cluster.
2.2.4. Cluster Location Visualization
This study uses different visualization approaches for the global and local scales to compare cluster locations. For the global spatial scale, the global agglomeration boundary is constructed using the minimum bounding rectangle of core firms, where the firm with the largest LDO index is the agglomeration center of the industry. For the local spatial scale, the spatial distribution of core firms is directly used as the visualization results.
2.2.5. Performance Evaluation of MCLM-LDO Method
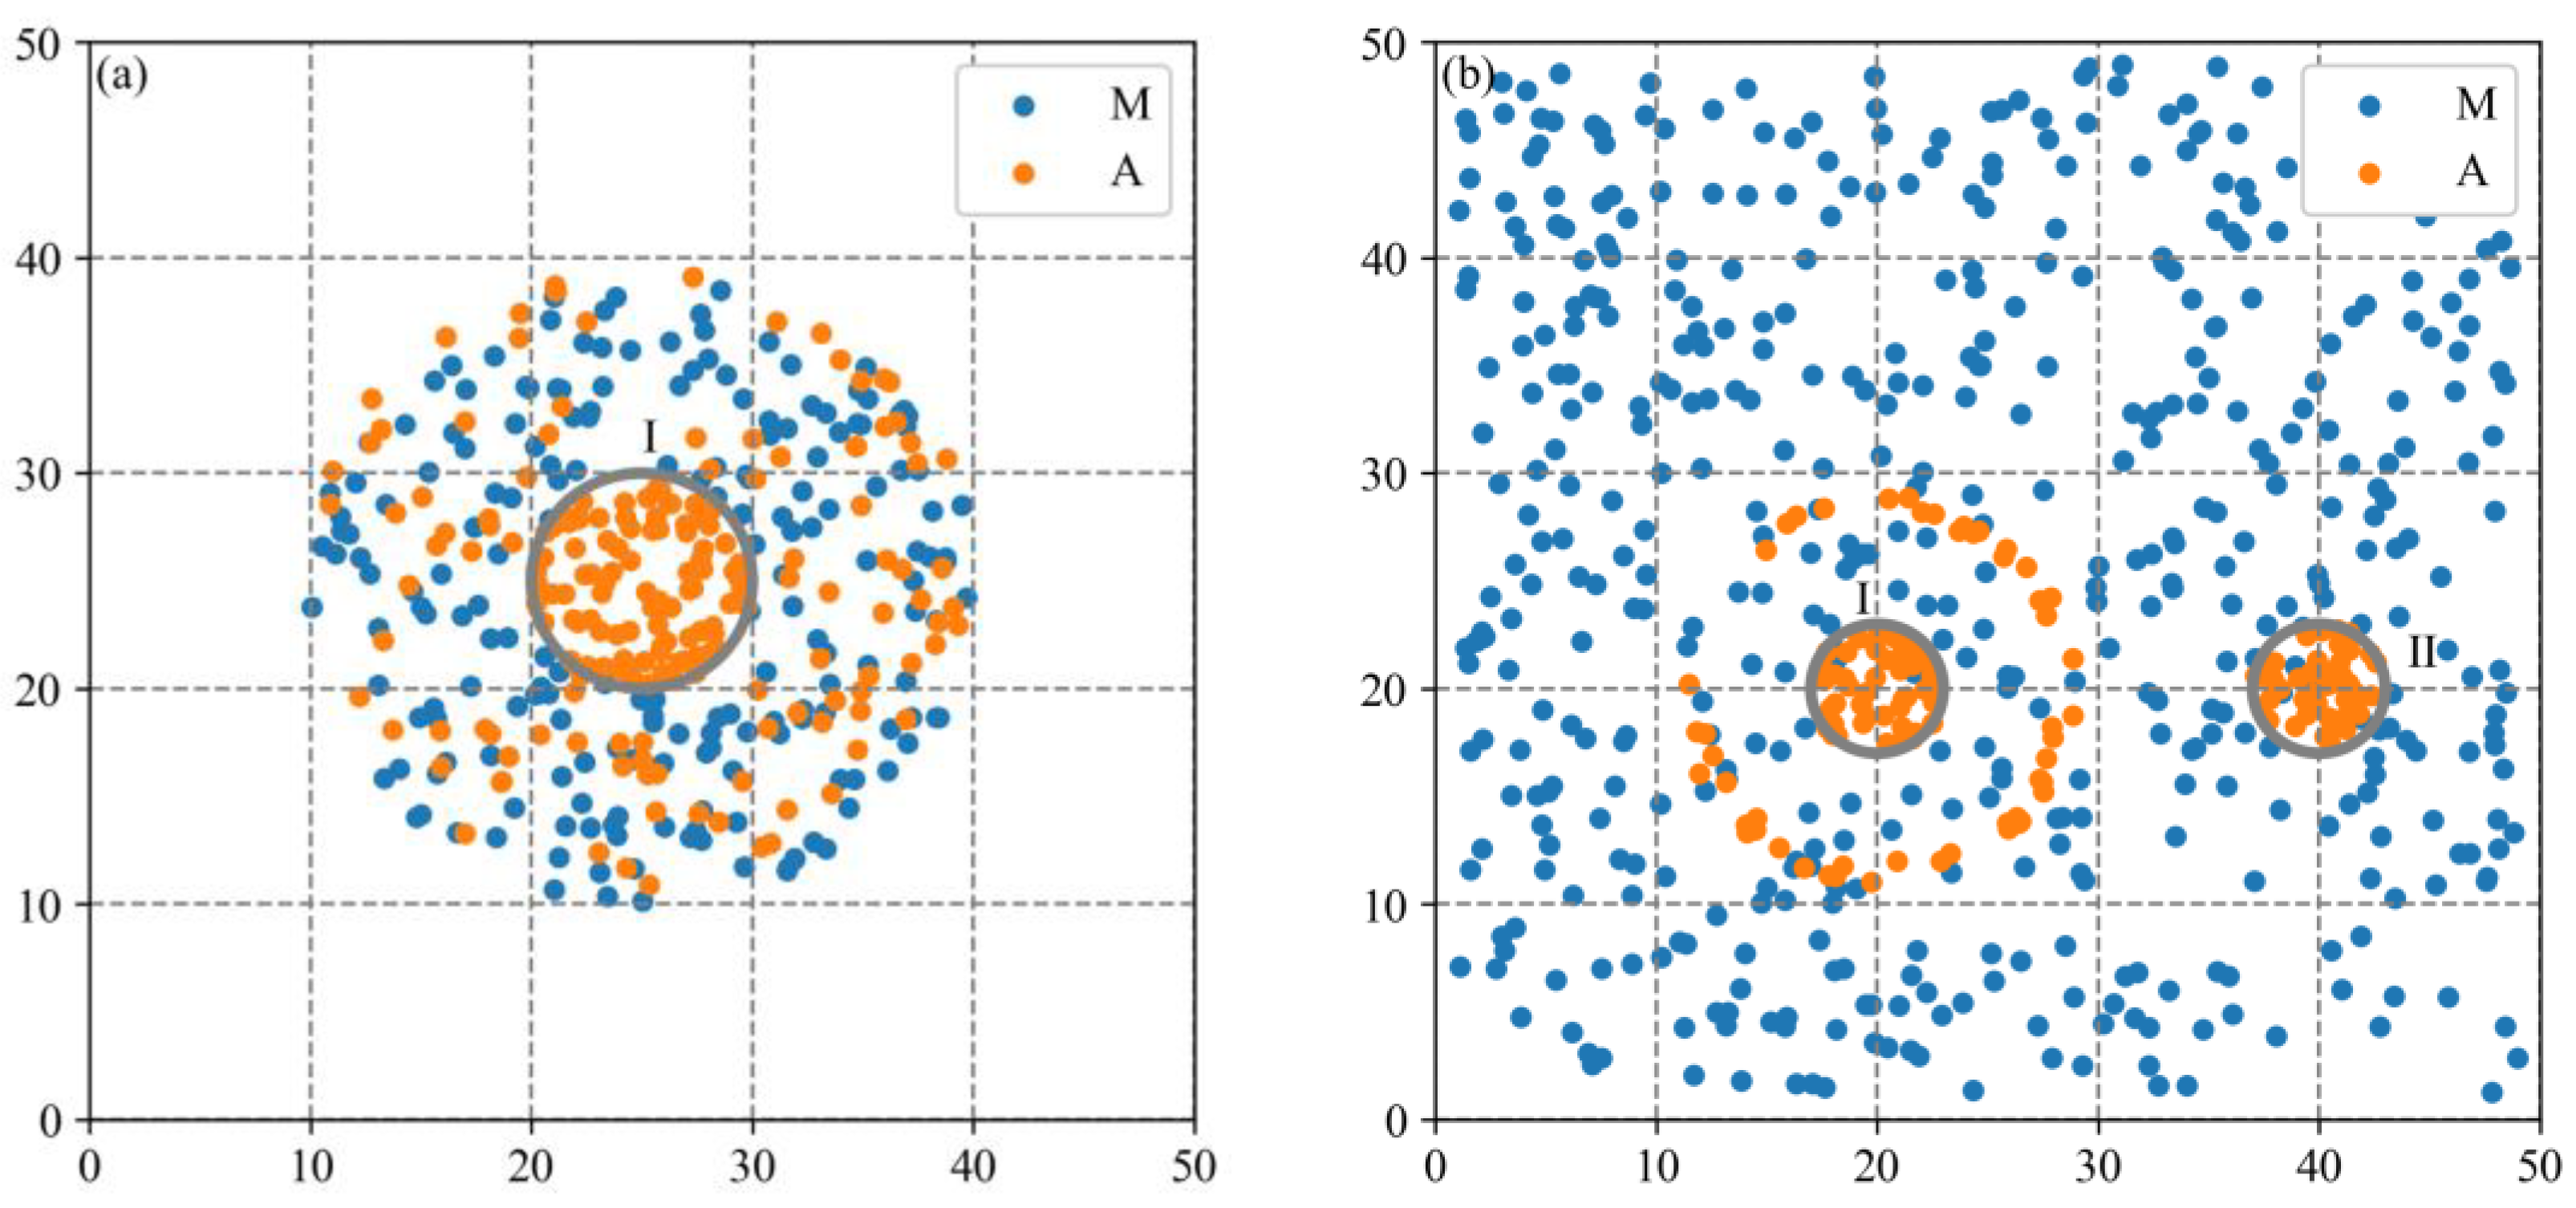
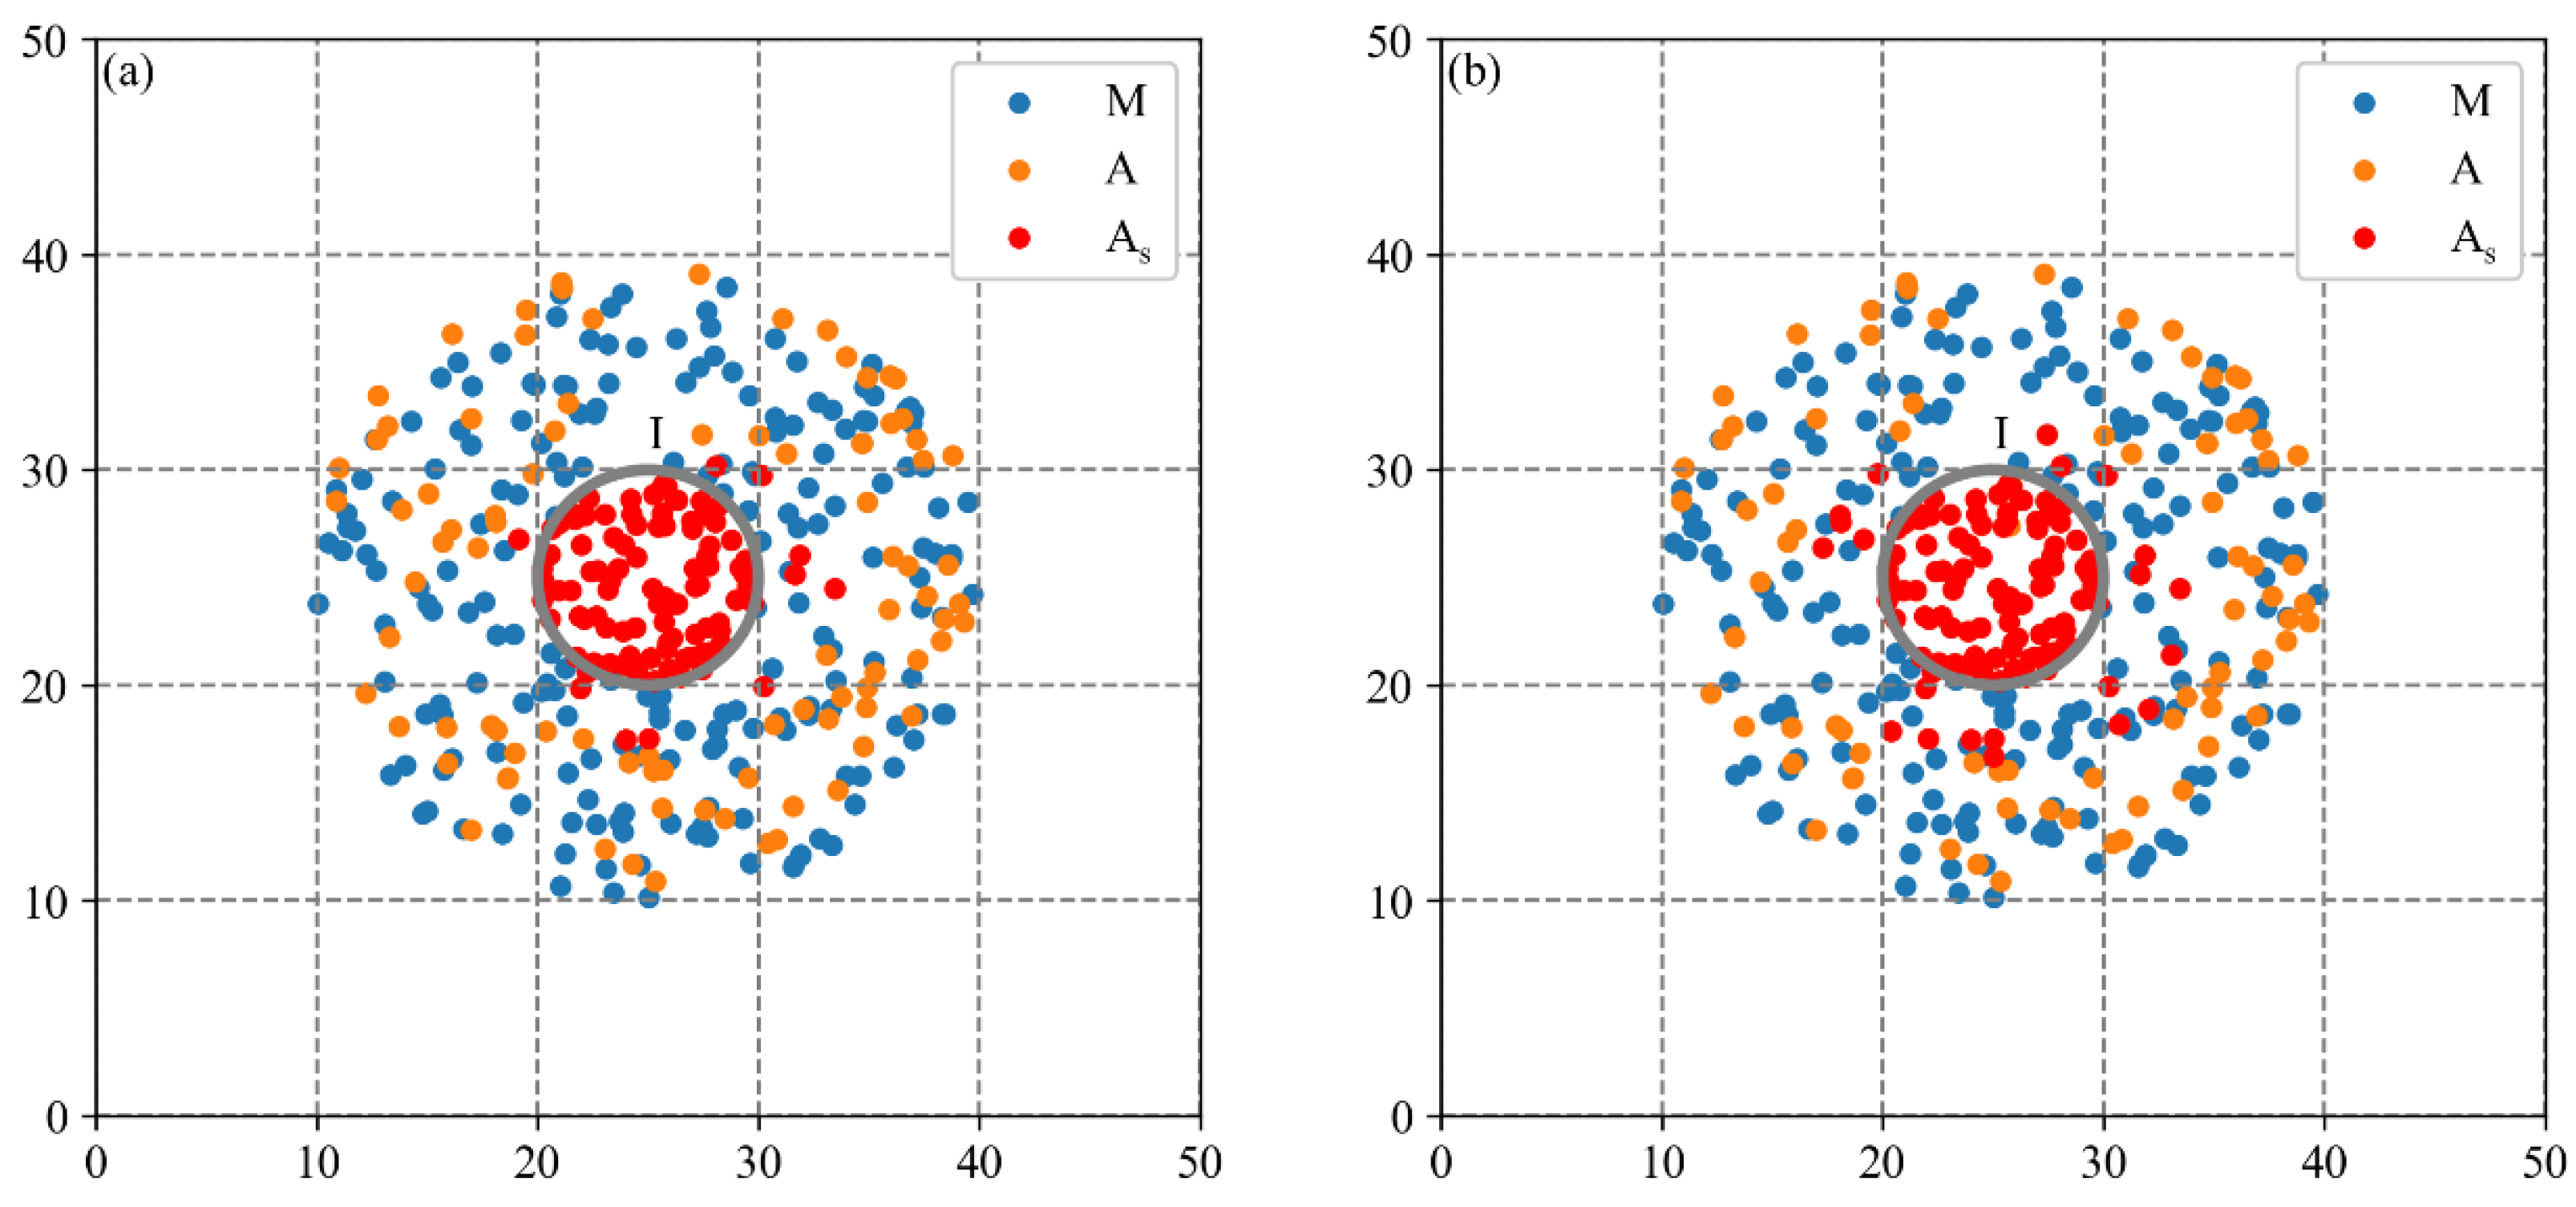
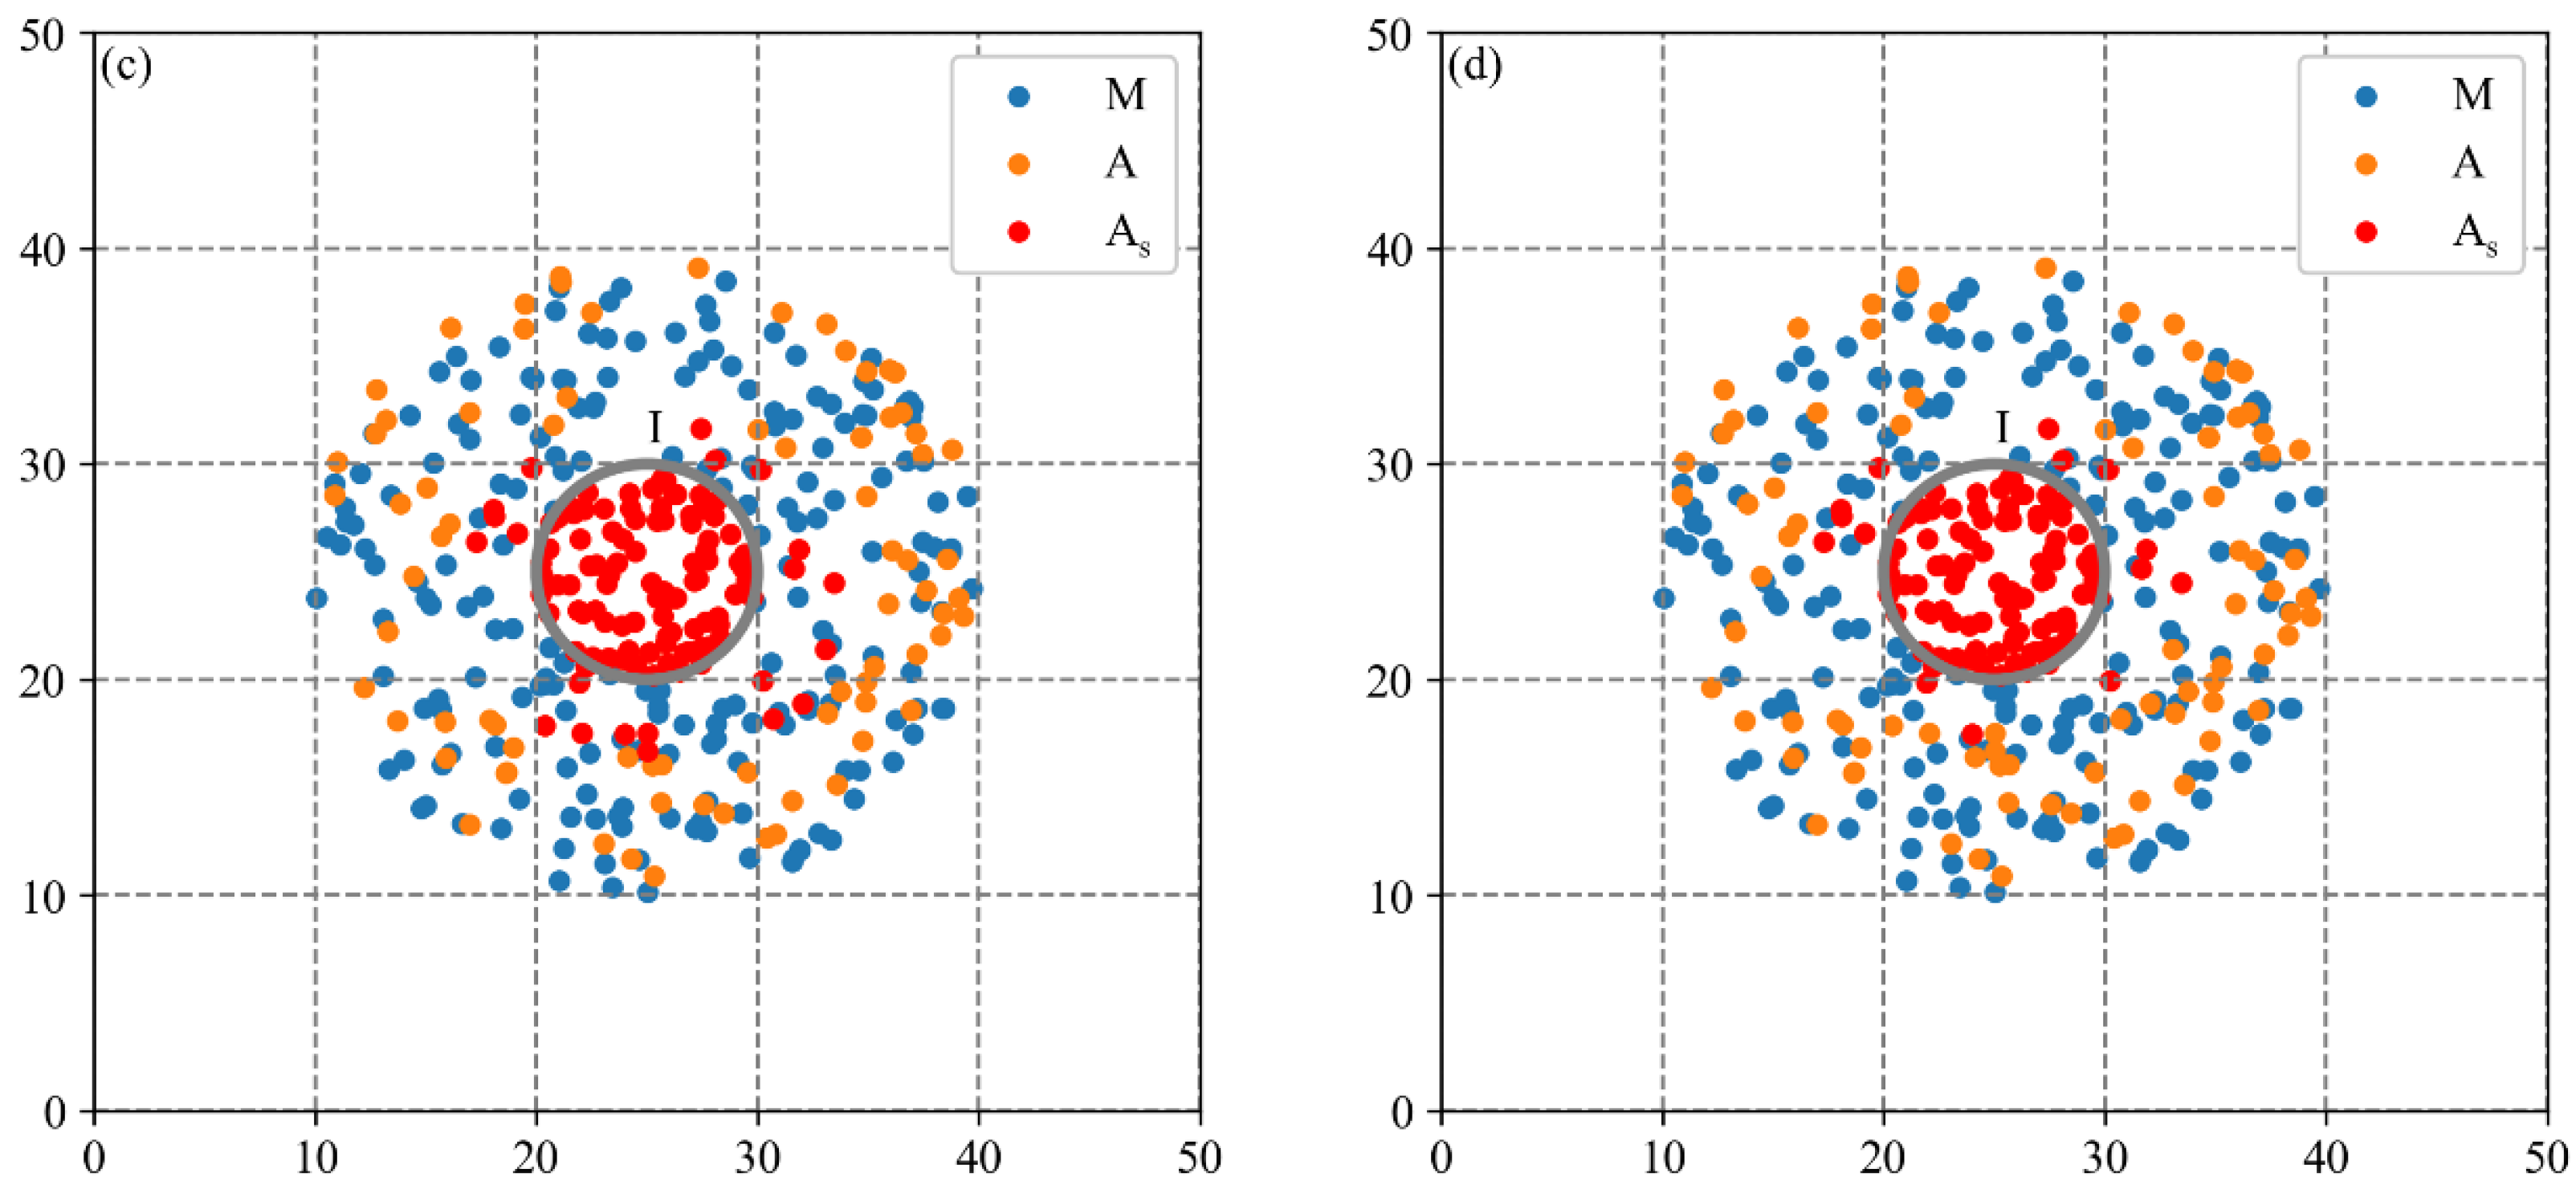
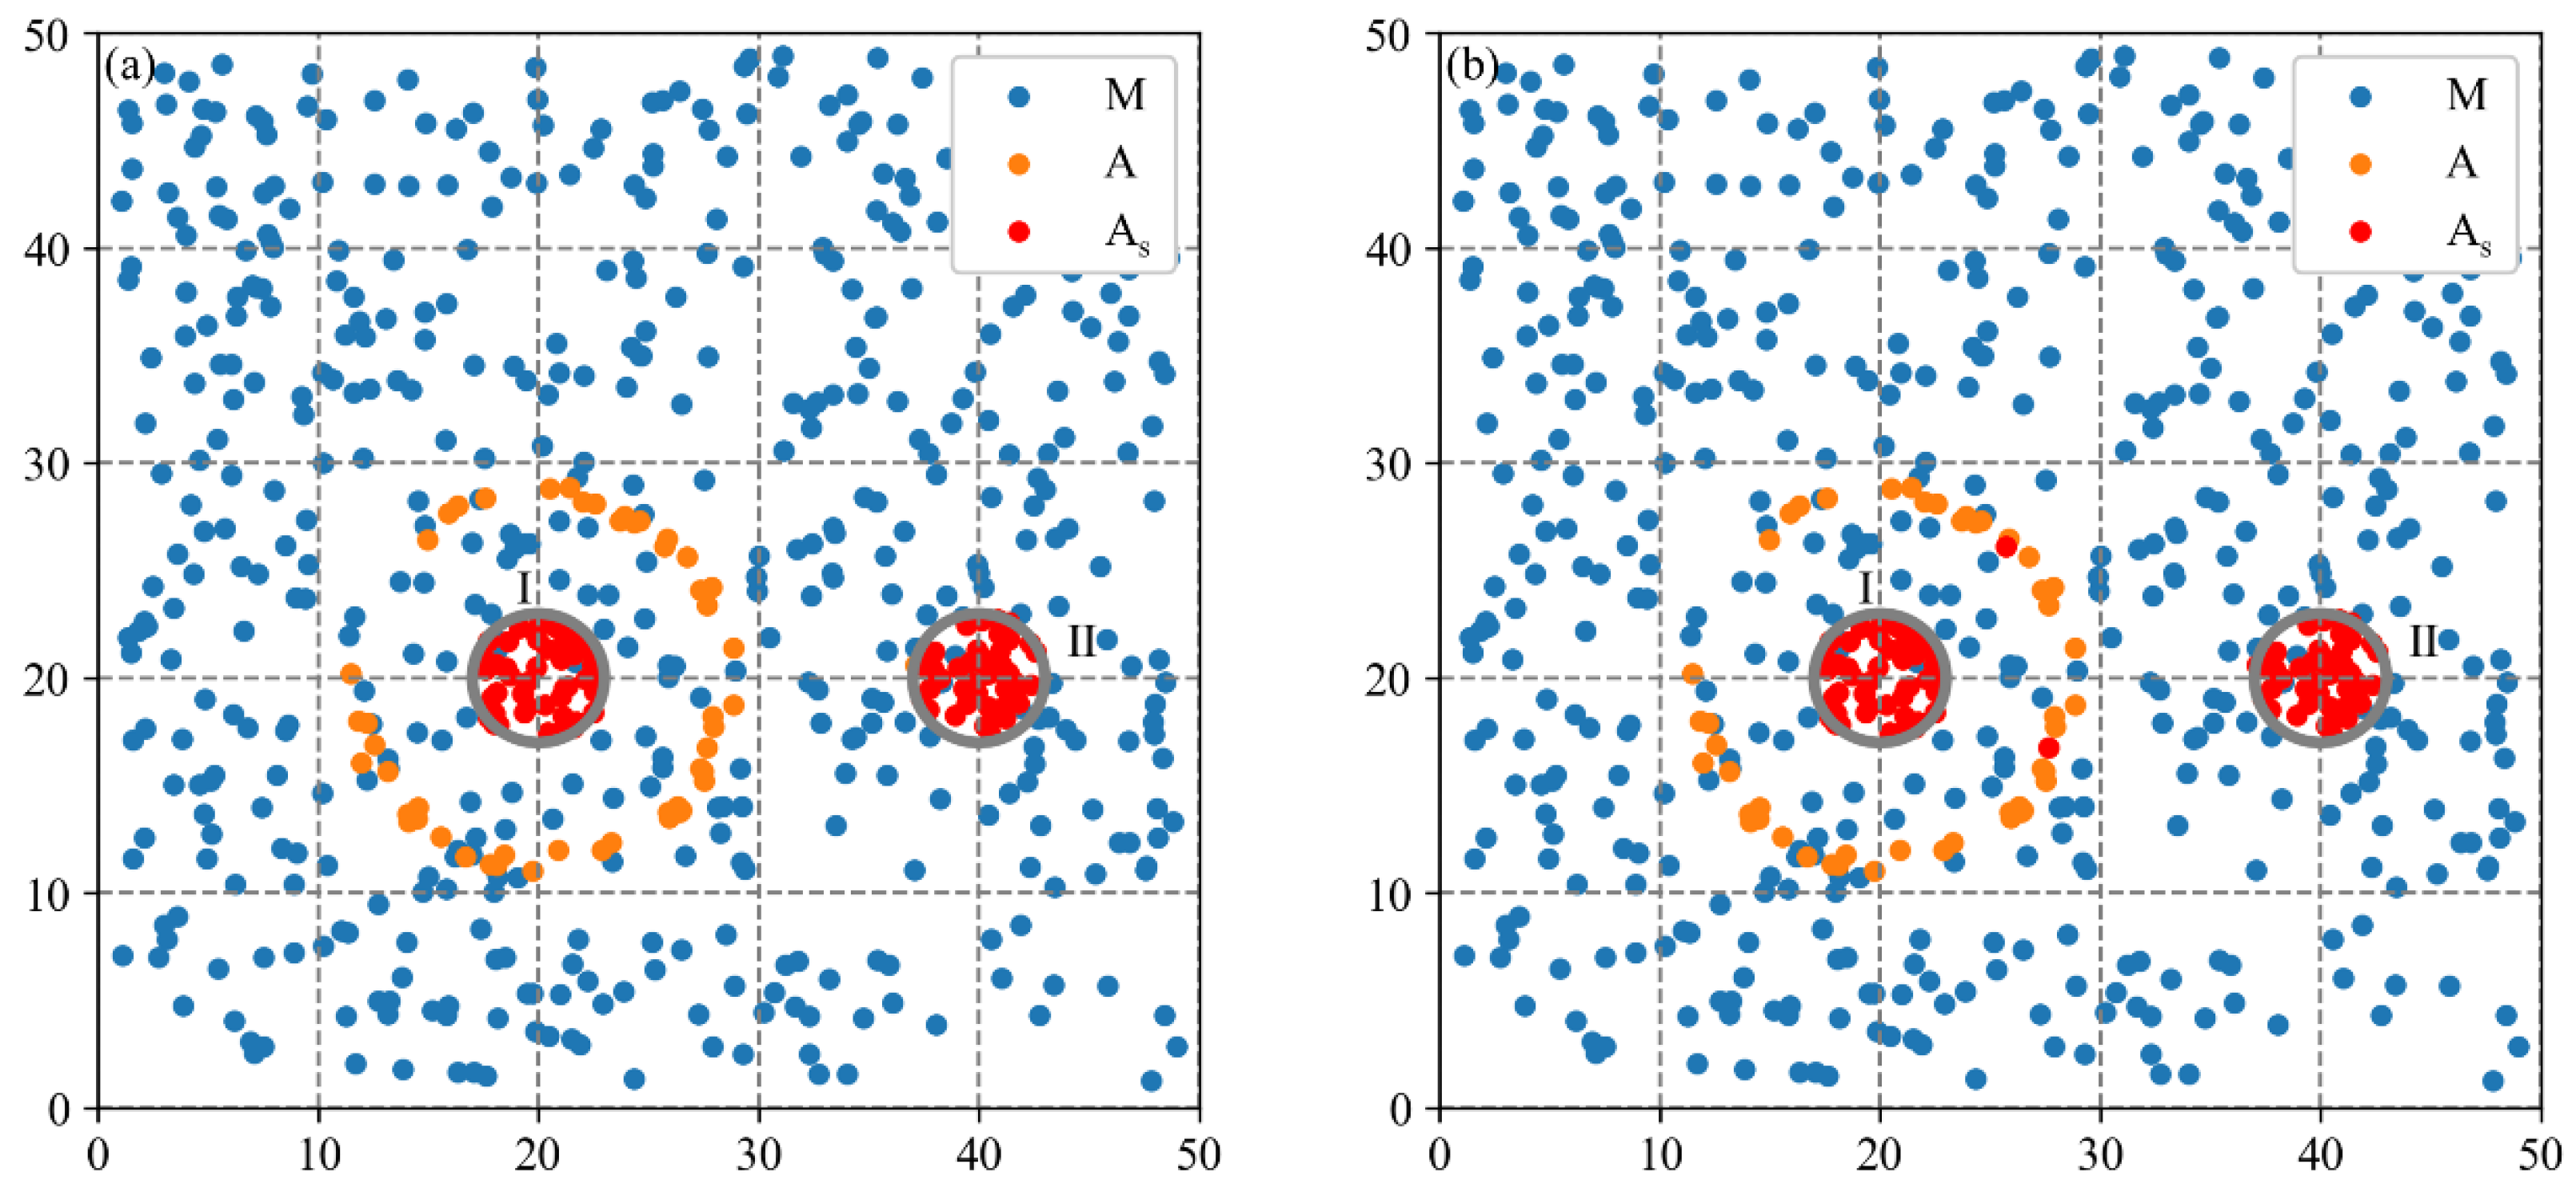
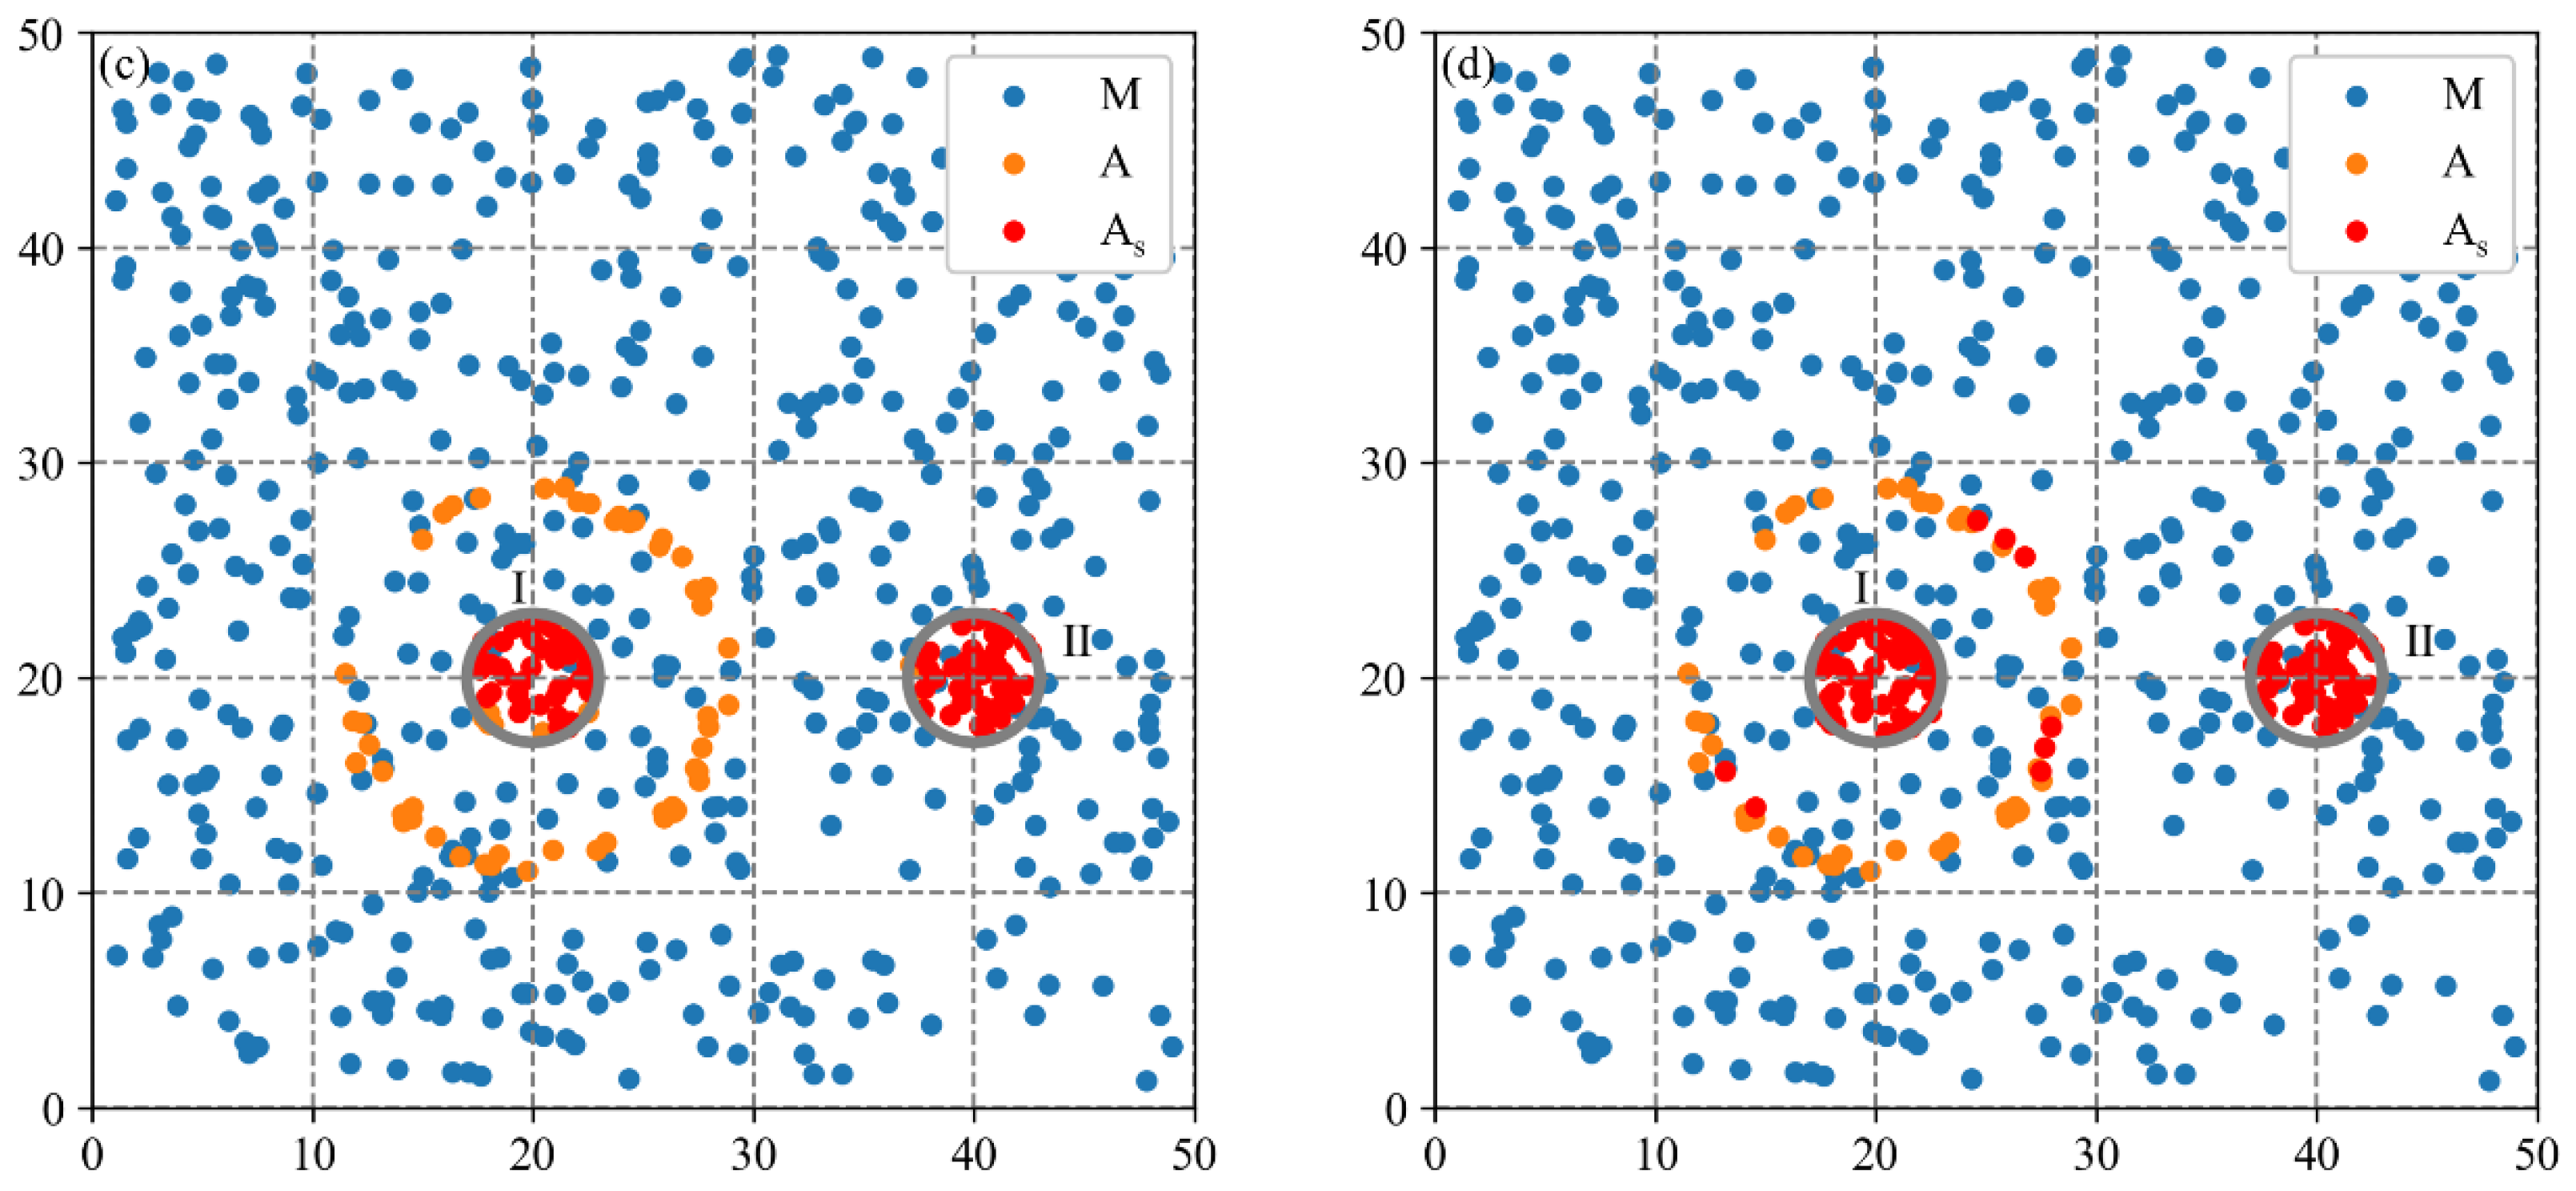
Due to the difficulty of obtaining real cluster locations to calculate accuracy indicators, two synthetic datasets characterizing common industrial spatial distribution patterns are used in this study. The aim is to evaluate the effectiveness of the MCLM-LDO method in identifying cluster locations and compare it with three baseline methods. The evaluation metrics include the accuracy and computational efficiency of methods.
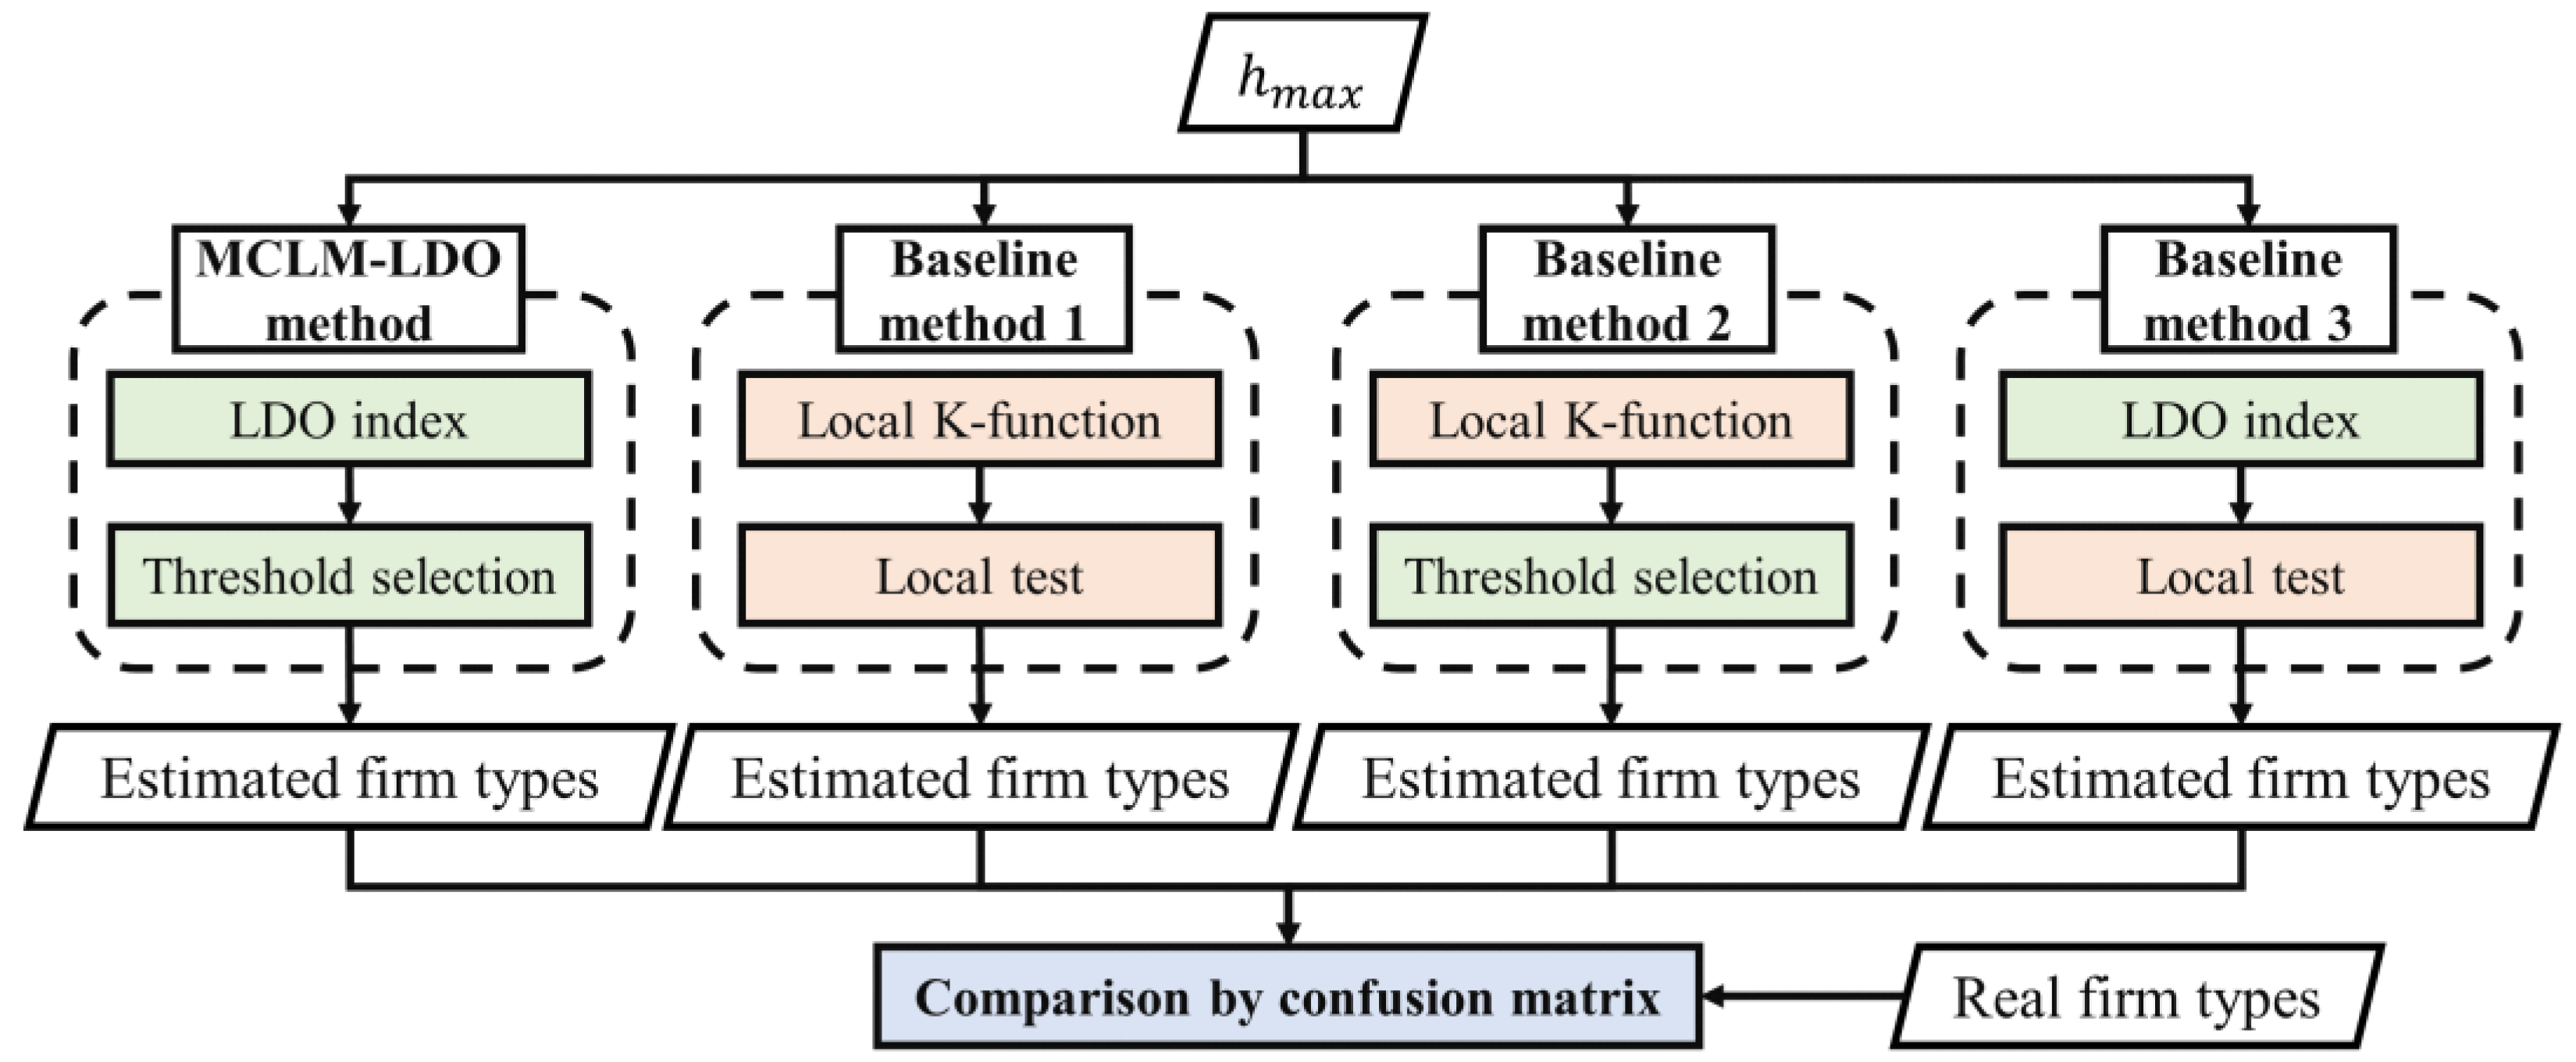
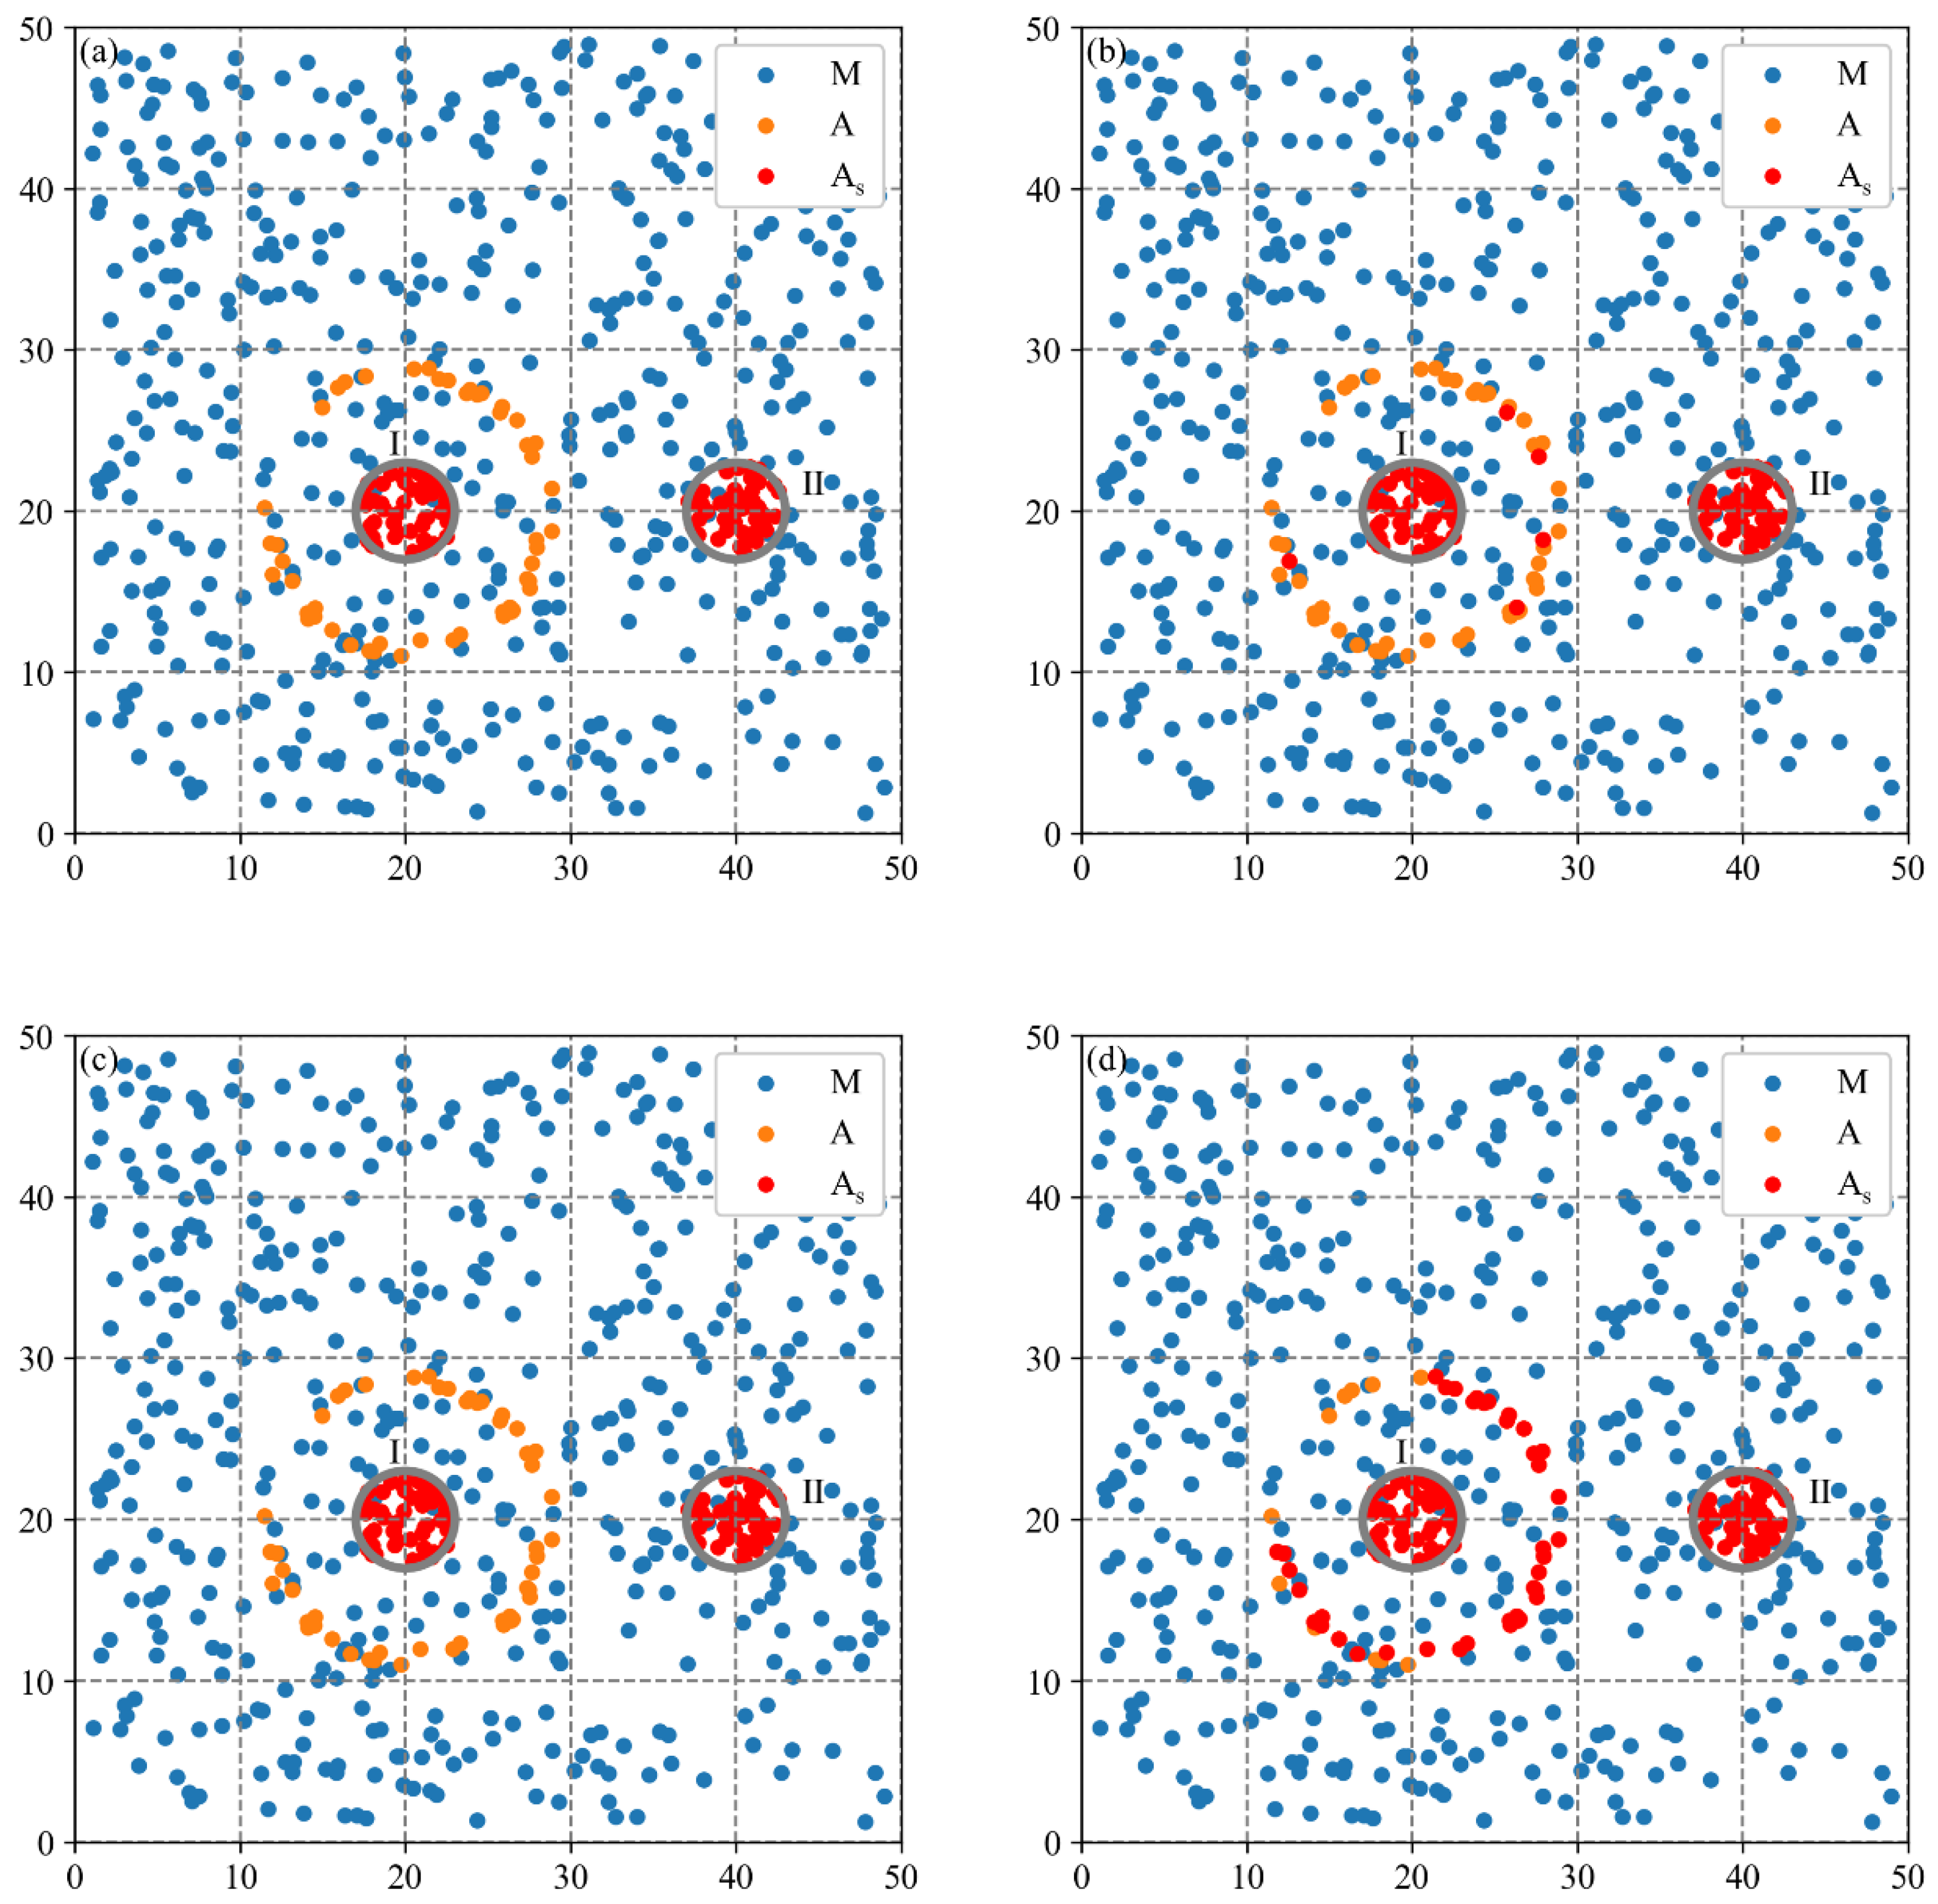
The evaluation scheme is shown in
Figure 3. The MCLM-LDO method with three baseline methods is applied to two synthetic datasets separately to obtain estimated firm types at the global scale (i.e., inputting
from the localization index curve) and uses real firm types as the reference to evaluate both in terms of efficiency and accuracy. The efficiency indicator uses the computation time, and the accuracy adopts three indicators from the confusion matrix.
denotes the rate of the number of core firms (i.e., the firms in clusters) correctly estimated to the number of real core firms (Equation (8));
denotes the rate of the number of sparse firms (i.e., the firms beyond clusters) correctly estimated to the number of real sparse firms (Equation (9)); and
denotes the rate of the number of firms correctly estimated to the total number of firms (Equation (10)). The larger the three indicators, the higher the accuracy of the method.
where
is the number of core firms correctly estimated by the method,
is the number of sparse firms correctly estimated by the method, and
as well as
are the number of firms incorrectly estimated by the method, respectively.
Baseline method 1 is the MCLM-LK method proposed by Buzard et al. [
35]. The MCLM-LK method initially calculates observed values (i.e., agglomeration degrees of individual firms) of the industry based on LK (Equation (4)), and then the core firms are identified by the local test. To evaluate the effectiveness of each improved step of the MCLM-LDO method, baseline method 2 and baseline method 3 were constructed using the step in the MCLM-LDO method replacing the step in the MCLM-LK method.
2.3. Industrial Spatial Agglomeration Pattern Analysis from Dual Perspectives
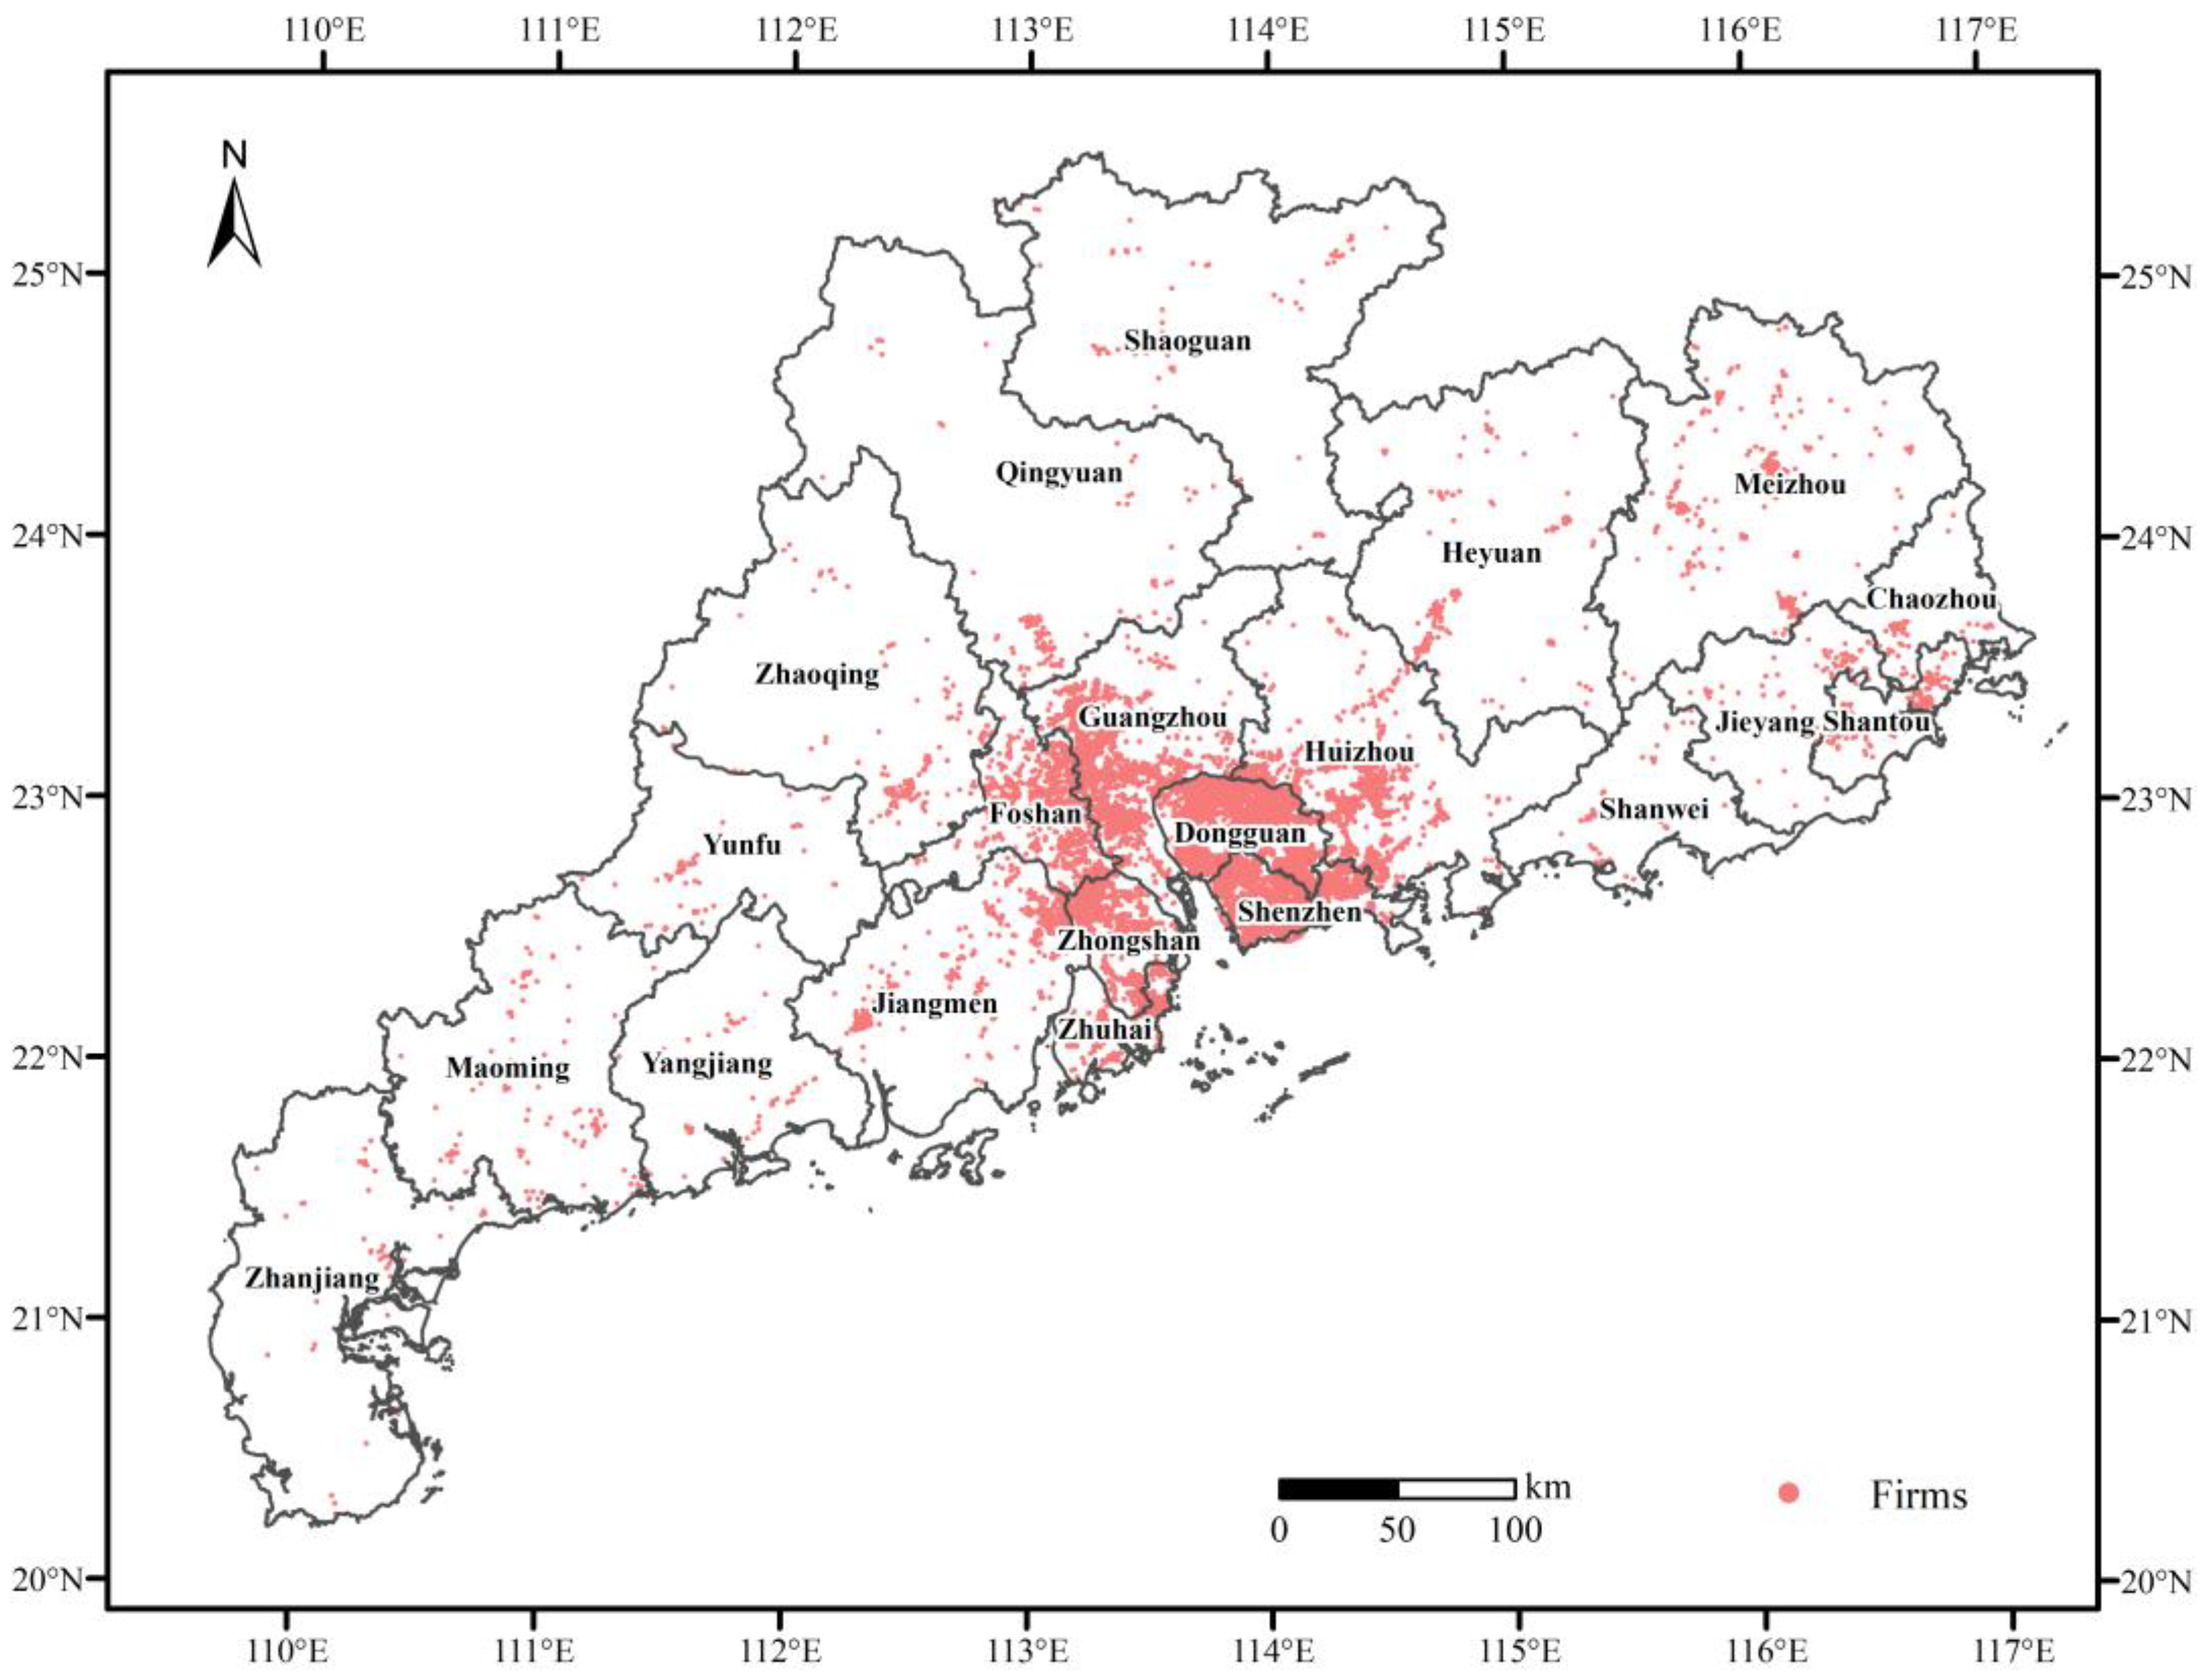
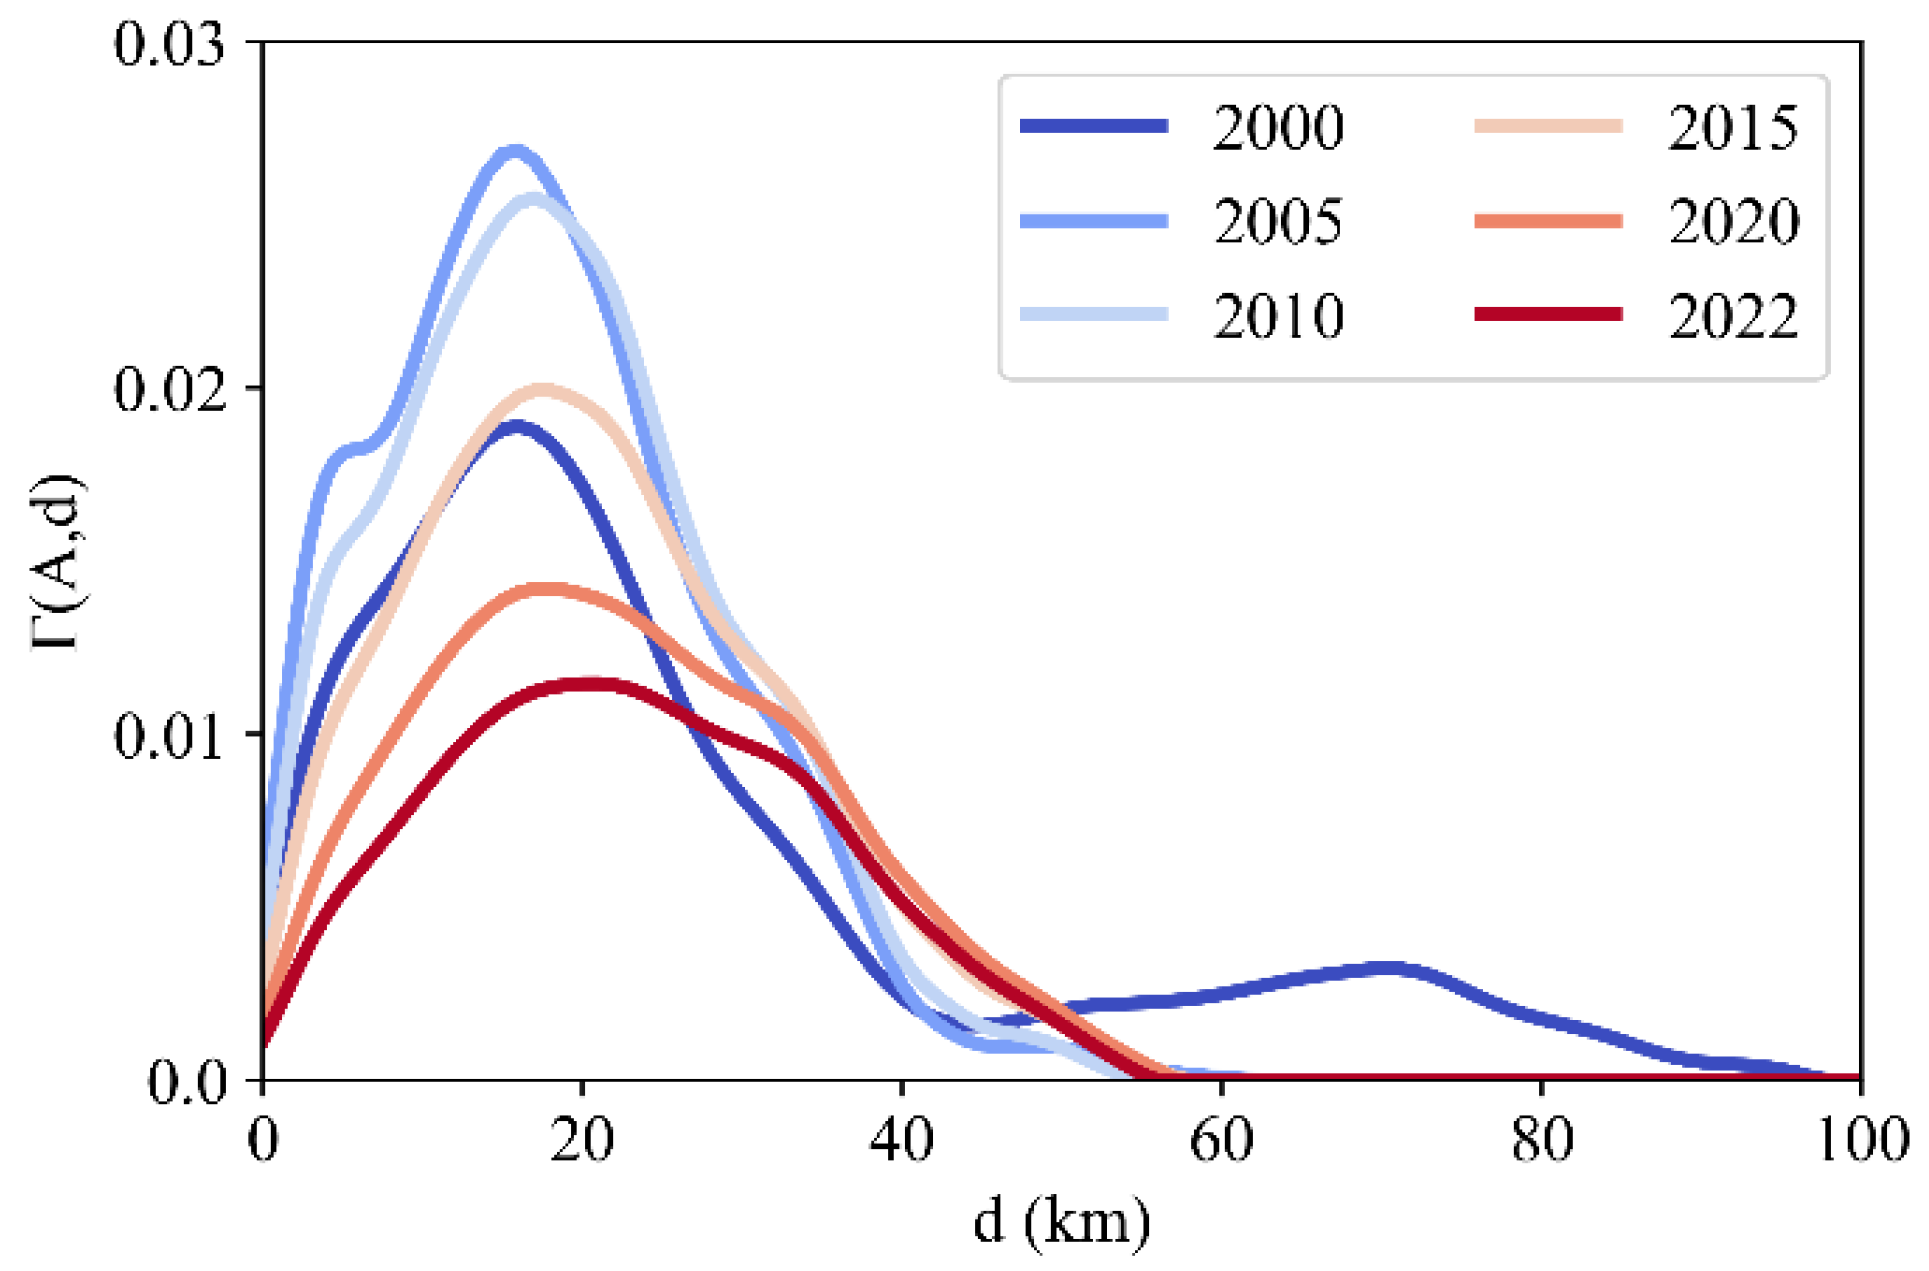
This study finally employed the proposed framework to analyze the industrial spatial agglomeration patterns of Guangdong Province from 2000 to 2022, using micro-data on firms in the computer, communication, and other electronic equipment manufacturing industry. The multi-scale agglomeration degree of the industry is analyzed using the localization index curve and its derivations, including the aggregated agglomeration degree
(Equation (11)) and the maximum spatial scale of agglomeration
.
where
greater than 0 indicates that the spatial distribution of industry
is agglomerated in the region; otherwise, it is considered random or dispersed. A larger
signifies a more significant agglomeration of industry
in the region.
Subsequently, industrial cluster locations are analyzed at the global and local scales. Additionally, the trends of cluster are quantified by calculating the average LDO index (denoted as , representing the average firm density of each cluster) and the percentage of firms within each cluster relative to (denoted as ).
4. Discussion
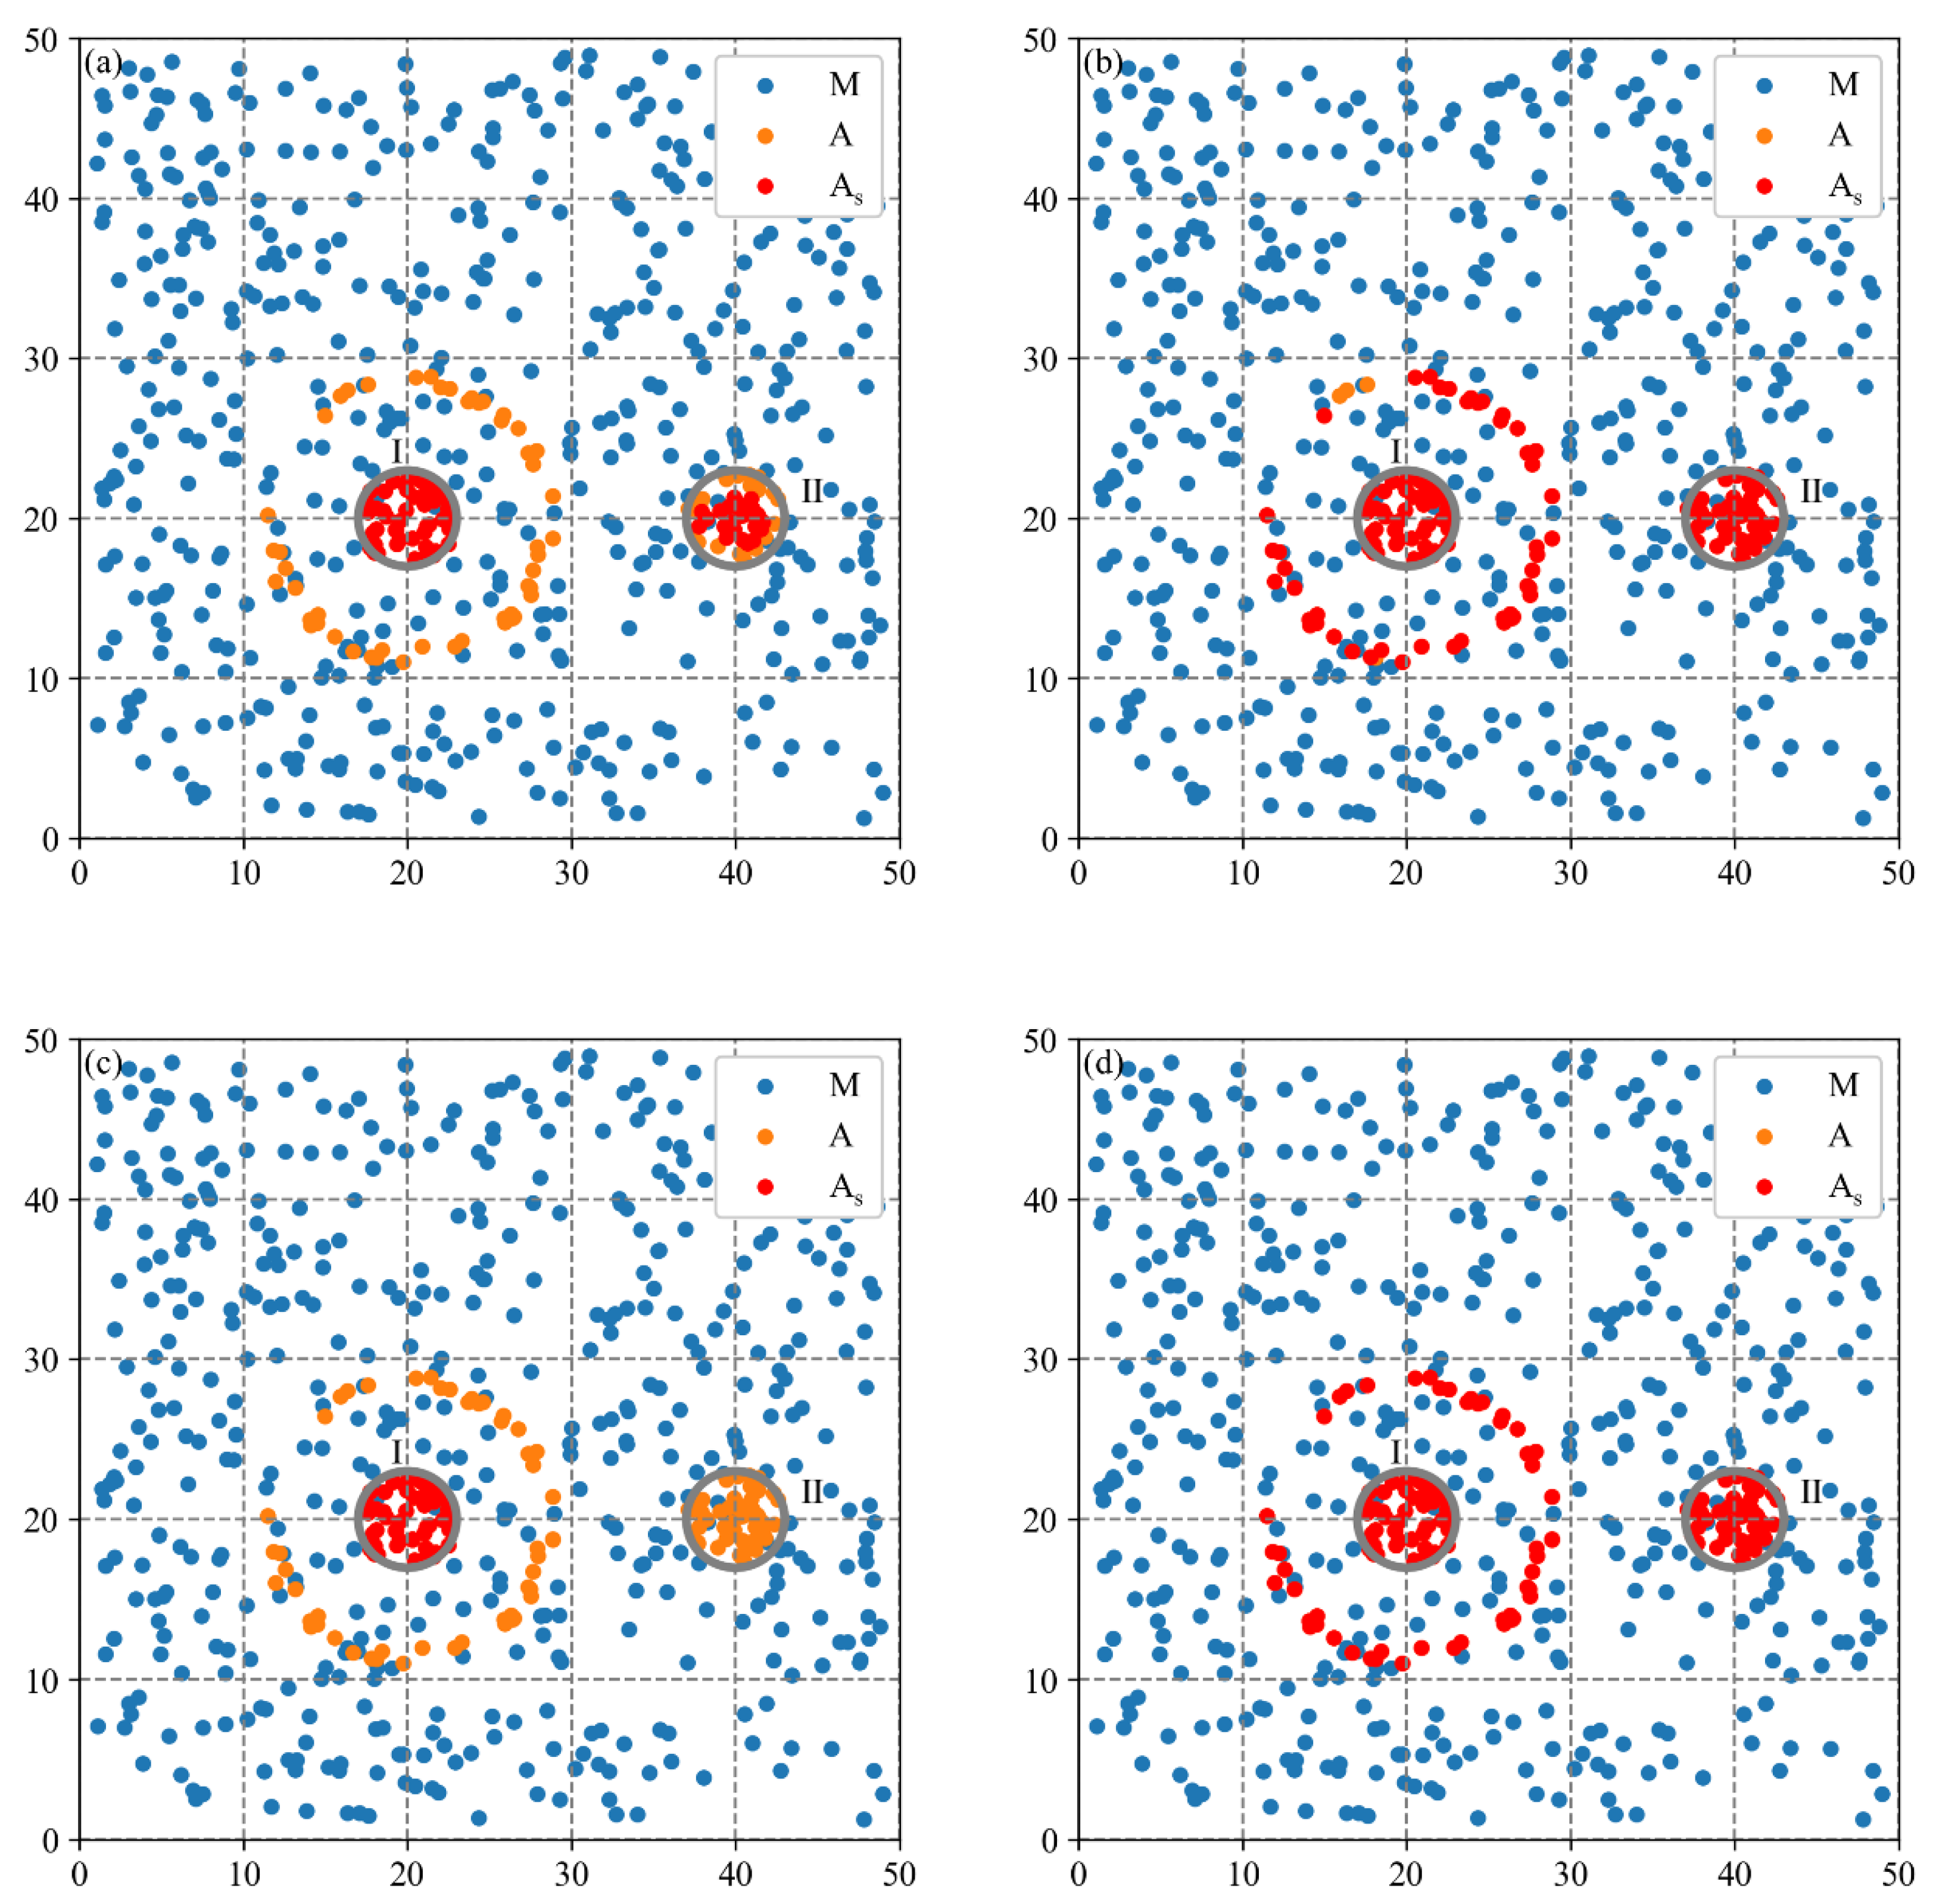
4.1. Sensitivity Analysis of Distance Parameters
The sensitivity of distance parameters of the MCLM-LDO method, i.e., the boundary distance
and the peak distance
, is analyzed in this section. Taking Synthetic Dataset 2 as an example, the additional parameters,
and
, are input into the MCLM-LDO method and three baseline methods, and the distributions of the estimated firms are shown in
Figure 12 and
Figure 13, respectively. Overall, the results identified by the four methods vary when
is different. As shown in
Table 6, the three indicators of the MCLM-LDO method varied insignificantly and remained considerably higher than the other three methods, demonstrating that the MCLM-LDO method has superior robustness and can achieve the best result when
.
For the peak distance
, this study set it to 0 in the MCLM-LDO method. When
is greater than 0, the MCLM-LDO method mines points with larger impacts that are spaced a certain distance. For example, some plants, when spaced at a certain distance from each other, will develop better [
6], and the MCLM-LDO method can be used to identify plants that match this condition. Furthermore, previous studies have argued the conclusion that multiple crests of the localization index curve imply the existence of multiple clusters in the industry [
43,
45]. By using the MCLM-LDO method with
, the correctness of this conclusion of previous studies can be discussed in this section.
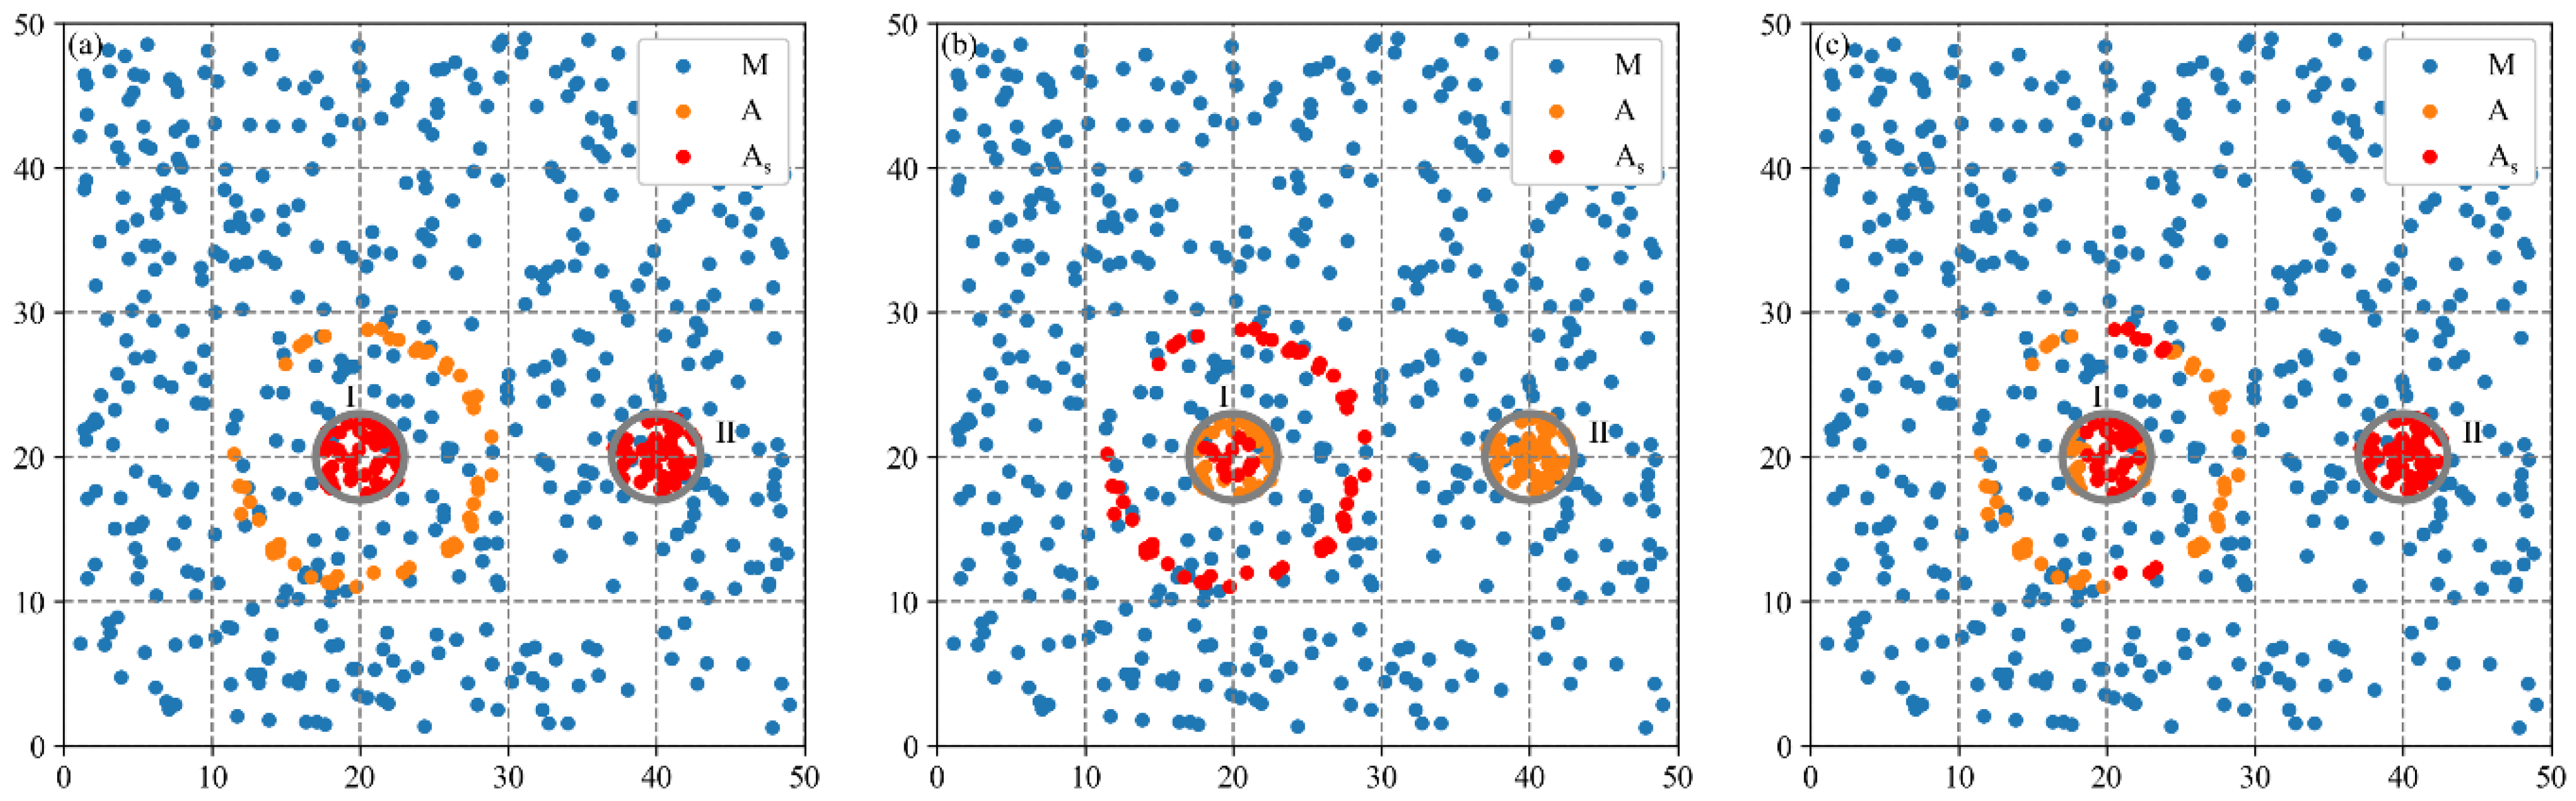
The localization index curve of Synthetic Dataset 2 has multiple crests (
Figure 8).
is set to be the distance of the maximum value of the three crests, and
is set to be 2. The combinations of distance parameters
and
are inputted into the MCLM-LDO method, and their results are shown in
Figure 14. In this case, the core firms of each combination explain why the localization index curve crests at those distances. (1) The first crest at a short distance identifies core firms located inside Cluster I and Cluster II, representing the cluster locations of industry A. (2) The core firms identified by the second crest are not located inside clusters of industry A but are exactly near 9 from Cluster I; therefore, they have higher LDO indexes. (3) The third crest identifies core firms mostly inside two clusters of industry A, which are close to each other by 20. Generally, the crests of the localization index curve may be generated both by the distance between multiple clusters and by sparse firms at some distance from the cluster. Thus, this study argues that the localization index curve having multiple crests does not necessarily mean that there are multiple clusters.
4.2. Improvement of the MCLM-LDO Method
The advantages of the proposed MCLM-LDO method lie in adopting a new approach to determine boundary distance parameters, constructing the LDO index, and proposing the threshold selection approach.
(1) The determination of boundary distance parameters is data-driven and objective, facilitating generalization across various regions, periods, and industry types, which is challenging for previous methods reliant on a priori knowledge for parameter settings [
35].
(2) The LDO index can effectively differentiate the agglomeration degrees of neighboring firms compared to the traditional LK. Consequently, the MCLM-LDO method mines cluster locations with greater accuracy than the MCLM-LK method.
(3) The threshold selection approach involves two steps, i.e., calculating the standard deviation and mean of the data and conducting a comparison. These steps have significantly improved the computational efficiency and applicability to the large-scale data. In contrast, the local test requires an additional 999 calculations for each firm at each spatial scale, resulting in highly inefficient computational processes. Furthermore, the local test bears the risk of misidentifying firms in sparse regions, leading to lower accuracy of the result.
Moreover, the MCLM-LK method used by Buzar et al. further constructs buffers, centered on core firms with a radius, as the final cluster [
35,
57], while this step is not included in the MCLM-LDO method. This is because the radius of buffers directly uses the boundary distance parameter [
35], and in some cases, the results may be unreasonable. For example, if this step is used to generate clusters of Synthetic Dataset 2 (
Figure 9), all sparse firms around Cluster I will be covered, resulting in a considerable overestimation of the results; for an industry with a large boundary distance parameter (e.g., C39 industry at the global scale in this study), the scope of the cluster derived from constructing buffers will be too large and thus meaningless.
4.3. Applicability of the DO-LDO Framework
Most studies have analyzed industrial agglomeration patterns using the DO index method, obtaining accurate agglomeration degrees but paying insufficient attention to cluster location mining [
17,
22,
23]. Although the MCLM-LK method has focused on cluster location mining, it still suffers from accuracy and efficiency shortcomings and is difficult to analyze with the agglomeration degree [
57]. Based on the DO index method, this study proposed the MCLM-LDO method to improve the accuracy and efficiency of the MCLM method. Moreover, the proposed DO-LDO framework can effectively integrate the agglomeration degree and the cluster location to analyze the industrial agglomeration pattern comprehensively.
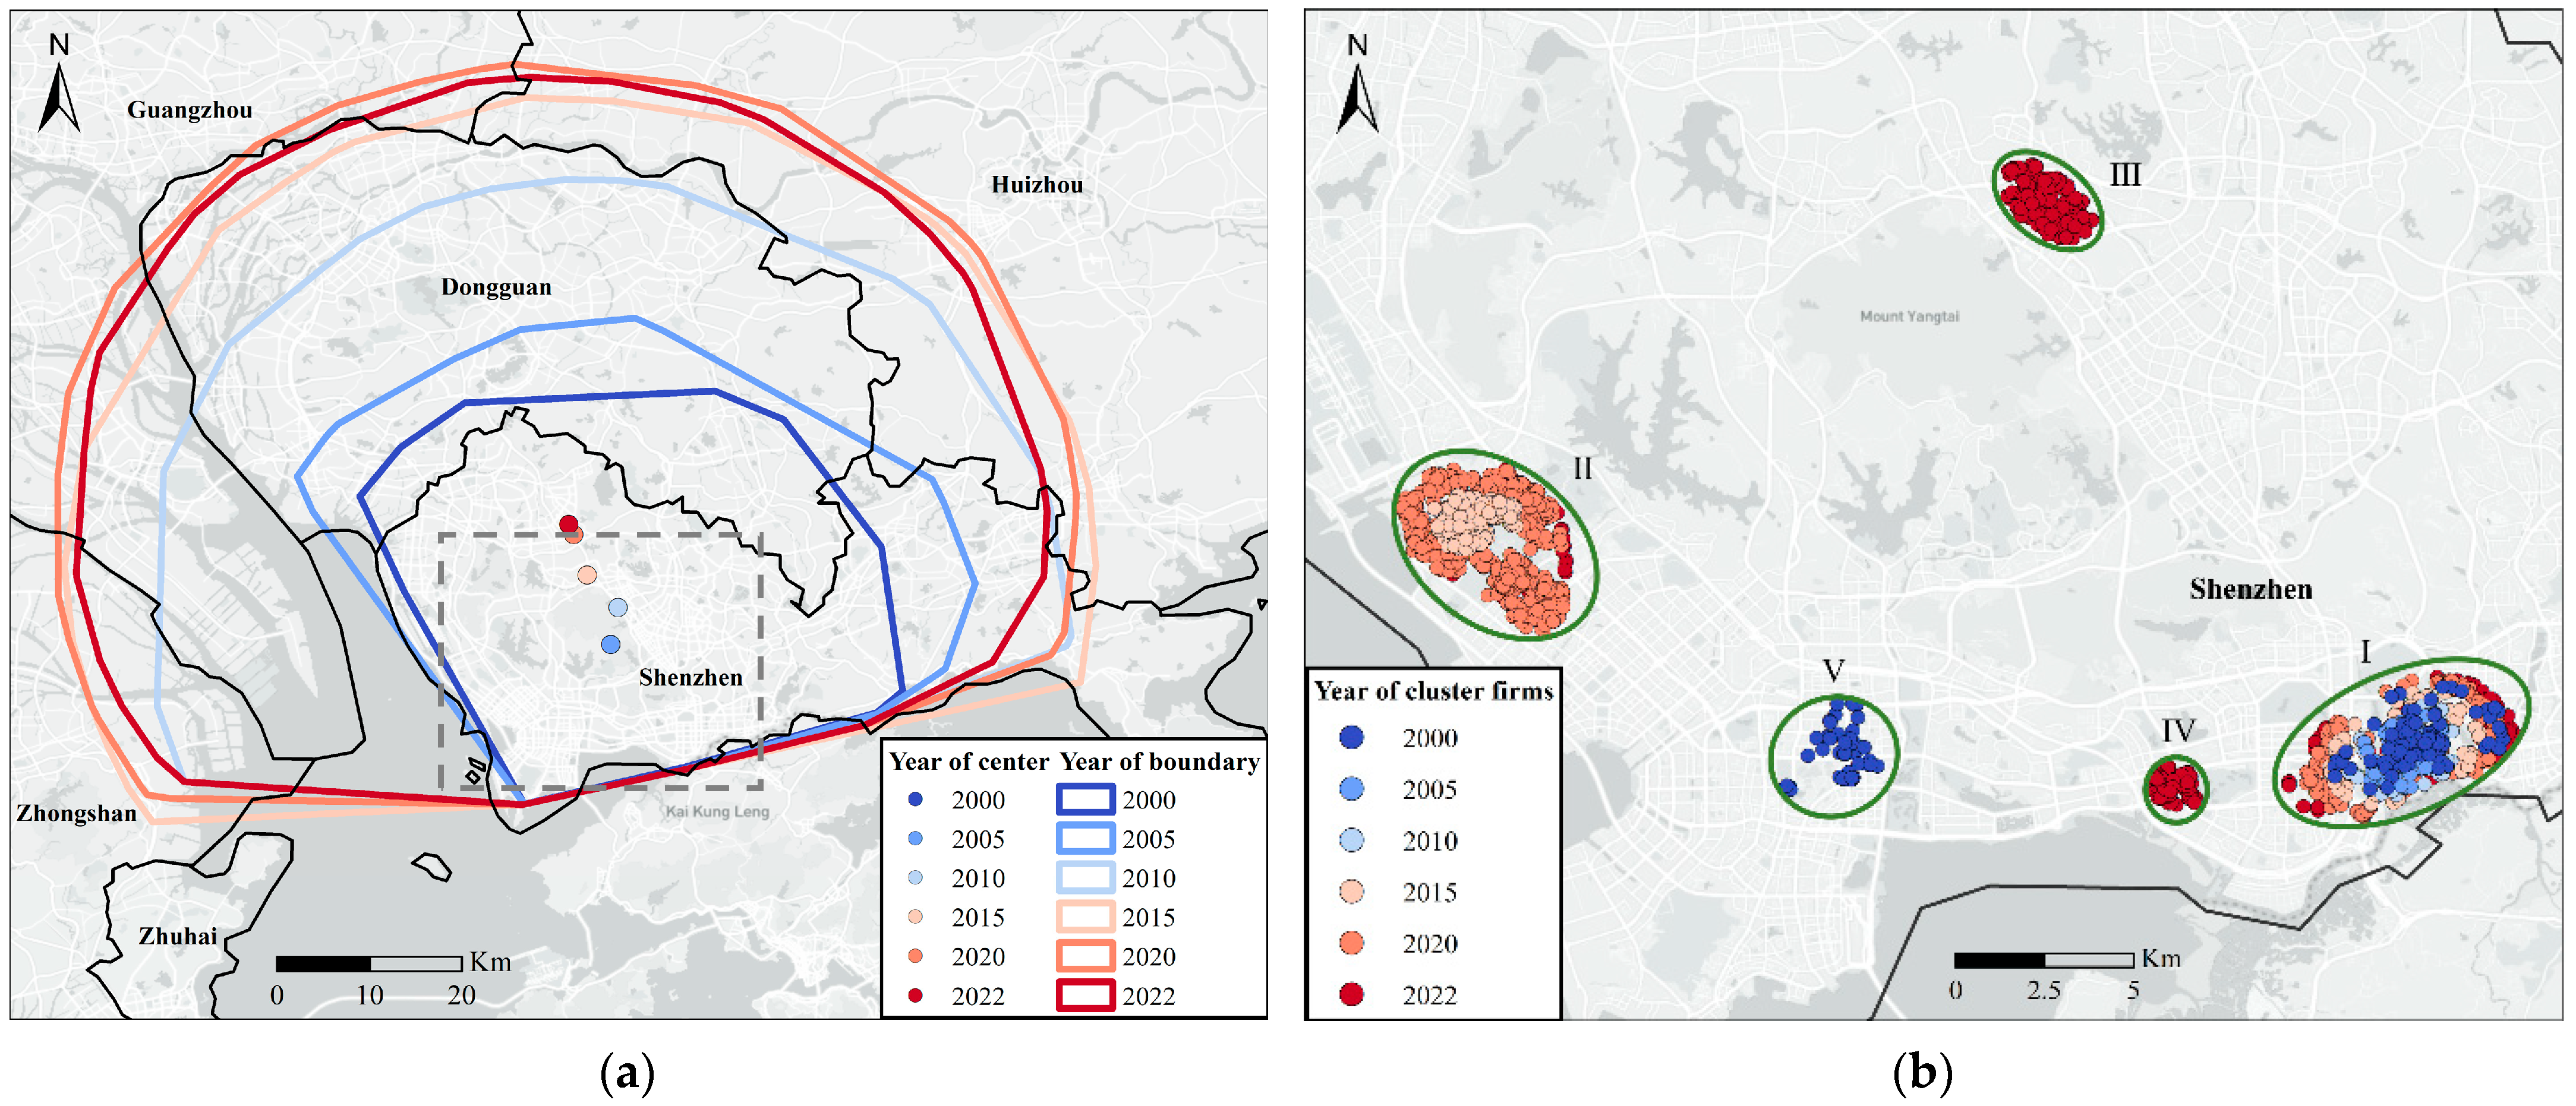
Based on the DO-LDO framework, this study presents findings regarding the evolution and the current status of the C39 industry (the computer, communication, and electronic equipment manufacturing industry) in Guangdong Province. By 2022, the industry has formed an integrated development along the east and west coasts, with startups gravitating towards emerging local clusters within the global agglomeration scope, while original local clusters have reached saturation points. Overall, the C39 industry in Guangdong Province exhibits a pattern of "global single-core agglomeration and local multi-point diffusion". Policymakers can evaluate the policy effectiveness and formulate sustainable industrial and urban development policies based on the results obtained from applying our framework.
(1) While the supportive policies have alleviated the decline of the Huaqiang North Road cluster, startups increasingly dispersed into the surrounding areas, maintaining a crowding effect. Therefore, the cluster’s policies should focus on promoting the upgrading and relocation of internal firms and relieving the population and land pressure to safeguard sustainable urban development.
(2) The initial effectiveness of the coordinated regional development strategy of Guangdong Province is evident. The C39 industry can be further distributed in Dongguan City or along the west coast of the Pearl River based on the Guangdong–Hong Kong–Macao Bridge and the Shenzhen–Zhongshan Corridor. It will mitigate excessive concentration in Shenzhen City and foster polycentric and sustainable industrial development.
4.4. Extensibility, Limitations, and Future Work
Referring to the DO index [
20], the LDO index also has a form that considers the weights of firms (Equation (12)).
where
and
are the weights of firms
and
, such as the number of employees. When the number of small- and medium-scale firms has a greater quantity in the industry, an additive weighting form can be considered [
48] (Equation (13)).
The distance metric of the LDO index can consider other linkages between firms, such as economic, knowledge, and vertical industrial linkage. Road distance is also a metric that can be considered. If alternative distance-based methods emerge, a step similar to the LDO index construction can also be applied to mine cluster locations. Since the DO-LDO framework and the MCLM-LDO method are conducted based on pure point progress, it is applicable across different economic systems and industries if the input data are well developed.
The DO-LDO framework also facilitates the balance of efficiency and equity in industrial distribution to support high-quality and sustainable development. For example, analyzing industrial agglomeration patterns in ecologically fragile areas can prevent the further development of heavily polluting industries.
Nevertheless, the DO-LDO framework still faces several limitations. For example, the distance parameters and threshold of the MCLM-LDO method need to be adjusted for different domains, thereby improving the rationality of spatial point pattern analysis. It is important to note that alternative clustering methods may be more suitable in scenarios like text recognition and map clustering, where multiple classifications for all points are necessary [
35,
63]. Moreover, more statistical indicators can be added to quantify the level of development of industrial agglomeration in a more multidimensional way.
5. Conclusions
This study constructed a novel LDO index and proposed the MCLM-LDO method for industrial cluster location mining to address the limitations of the existing MCLM-LK method in terms of accuracy, parameter setting, and calculation efficiency. The DO-LDO framework was performed to comprehensively analyze the industrial multi-scale spatial agglomeration patterns in Guangdong Province of China from 2000 to 2022 by considering the dual perspective of agglomeration degrees and cluster locations. The main conclusions of this study are as follows.
(1) The proposed MCLM-LDO method can provide industrial cluster locations at the global and local scales and deepen the understanding of the localization index curve.
(2) By inputting the objective distance parameter, the evaluation of two synthetic datasets demonstrated that the MCLM-LDO method yields superior results in accuracy and computational efficiency, compared with other baseline methods.
(3) The spatial agglomeration patterns of the C39 industry in Guangdong Province from 2000 to 2022 include three periods, a stabilizing agglomeration pattern from 2000 to 2005, an expanding dispersion pattern from 2005 to 2015, and an internal dispersion pattern from 2015 to 2022.
These findings can provide a scientific reference for the sustainable planning of the industry and analyze the impacts and mechanisms of industrial agglomeration.


