Article

Multiscale Urban Functional Zone Recognition Based on Landmark Semantic Constraints

1
National Engineering Research Center of Geographic Information System, China University of Geosciences, Wuhan 430074, China
2
State Key Laboratory of Geo-Information Engineering, Xi’an 710054, China
3
School of Computer Science, China University of Geosciences, Wuhan 430074, China
4
School of Geography and Information Engineering, China University of Geosciences, Wuhan 430074, China
5
Institute of Geophysical and Geochemical Exploration, China Academy of Geological Sciences, Langfang 065000, China
*
Author to whom correspondence should be addressed.
ISPRS Int. J. Geo-Inf. 2024, 13(3), 95; https://doi.org/10.3390/ijgi13030095
Submission received: 4 January 2024 / Revised: 23 February 2024 / Accepted: 12 March 2024 / Published: 15 March 2024

Abstract

:
The classification of urban functional areas is important for understanding the characteristics of urban areas and optimizing the utilization of urban land resources. Existing related methods have improved accuracy. However, they neglect cognitive differences amongst humans in the different scales of regional functions. Moreover, how to build the correlations of cross-scale characteristics is still unresolved when realizing the classification of multiscale urban functional zones. To resolve these problems, a transportation analysis zone involving urban buildings as research units is created and these units are described by geometric and functional characteristics using multiple data sources. Then, a hierarchical clustering model is built for the recognition of urban functional areas at varying scales with landmark semantic constraints. In the experiments, Shanghai served as the study area, and multiscale zones were created using different levels of road networks considering the constraint correlation of the significance between cross-scale maps. The experiential results show the proposed method has excellent performance and optimizes the functional zone classification at different scales. This study not only enriches the multiscale urban functional area-recognition methods but also can be used in other aspects, like cartographic generalization or spatial analysis.

1. Introduction

The recognition of urban functional zones is significant for pervasive urban computing and planning. Traditionally, the urban function classification is based on an index or clustering method in which geoscience data are integrated to decipher functions of urban zones [1,2]. However, these methods are time-consuming, labor-intensive, subjective, and inefficient [3,4]. Considering the increasing urban development in many areas, the demand for the classification of multiscale functional zones has risen in recent years. Owing to continuous development, images from remote sensing technology have been utilized for the classification of urban functional zones [5,6]. In general, these approaches are based on hierarchical or semantic features. In certain methods, low [7,8,9], middle [10,11], high [12,13,14,15] level, and global features [16,17] of a scene are considered, while the recognition of ground objects is ignored. Conversely, methods based on semantic features [18,19,20] simply acquire natural attributes, and thus further mining the functional information only based on the semantic features is challenging.
To optimize the identification of urban functional areas, multi-source data [21] such as remote sensing imagery and point of interesting (POI) data have been integrated in some studies [22,23,24,25,26,27]. Despite the advances in the recognition of urban functional zones associated with these studies, deficiencies remain in the spatial recognition of multiscale functional areas. These deficiencies are linked to the following: (1) owing to the cognitive differences among humans, current association rules for geographical entities between scales may lead to wrong understanding for function zones; (2) the extraction and association rules for the significant spatiotemporal and semantic attributes of geographical entities are fuzzy as the spatial scale changes.
The utilization of landmarks’ semantic constraints for urban functional area classification can improve the recognition of special areas, such as communities and schools. In a school, for example, the dormitory buildings, teaching areas, canteens and other buildings are associated with different functional characteristics (Figure 1a). If the regional function is recognized from single building attribution based on the association rules of classical area restriction, it may be classified as residential zones because of the large number of dormitories. Therefore, in the present study, the landmark concept is proposed when buildings are considered basic research units, and their geometric and semantic characteristics are integrated to produce the function zones (Figure 1b).
These landmarks, such as stores and hills, constitute reference points in the external environment [28], which can prevent errors inherent to individual data sources. According to the development of related concepts [29,30], buildings characterized by a special appearance or profound social meaning, for example, can be selected as landmarks. The significance is a very critical attribute for landmarks [31,32,33]. Consequently, landmark extraction based on significance calculation models have been proposed [34]. In the extraction of landmarks in urban environments, the identification in navigation maps of varying scales, public cognition, urban centrality, and related attributes have been considered [35].
In this study, a hierarchical clustering model is proposed for the recognition of urban functional areas at varying scales with landmark semantic constraints. In detail, for building function classification, a two-level clustering model is built for the buildings considering their geometric and functional features. Moreover, a cognition-based landmark extraction model is designed to constrain the mapping of features at cross scales during recognizing urban functional zones. The findings of the present study enhance the identification of urban functional zones at the spatial scale and optimize the urban function zone recognition at multiple scales.

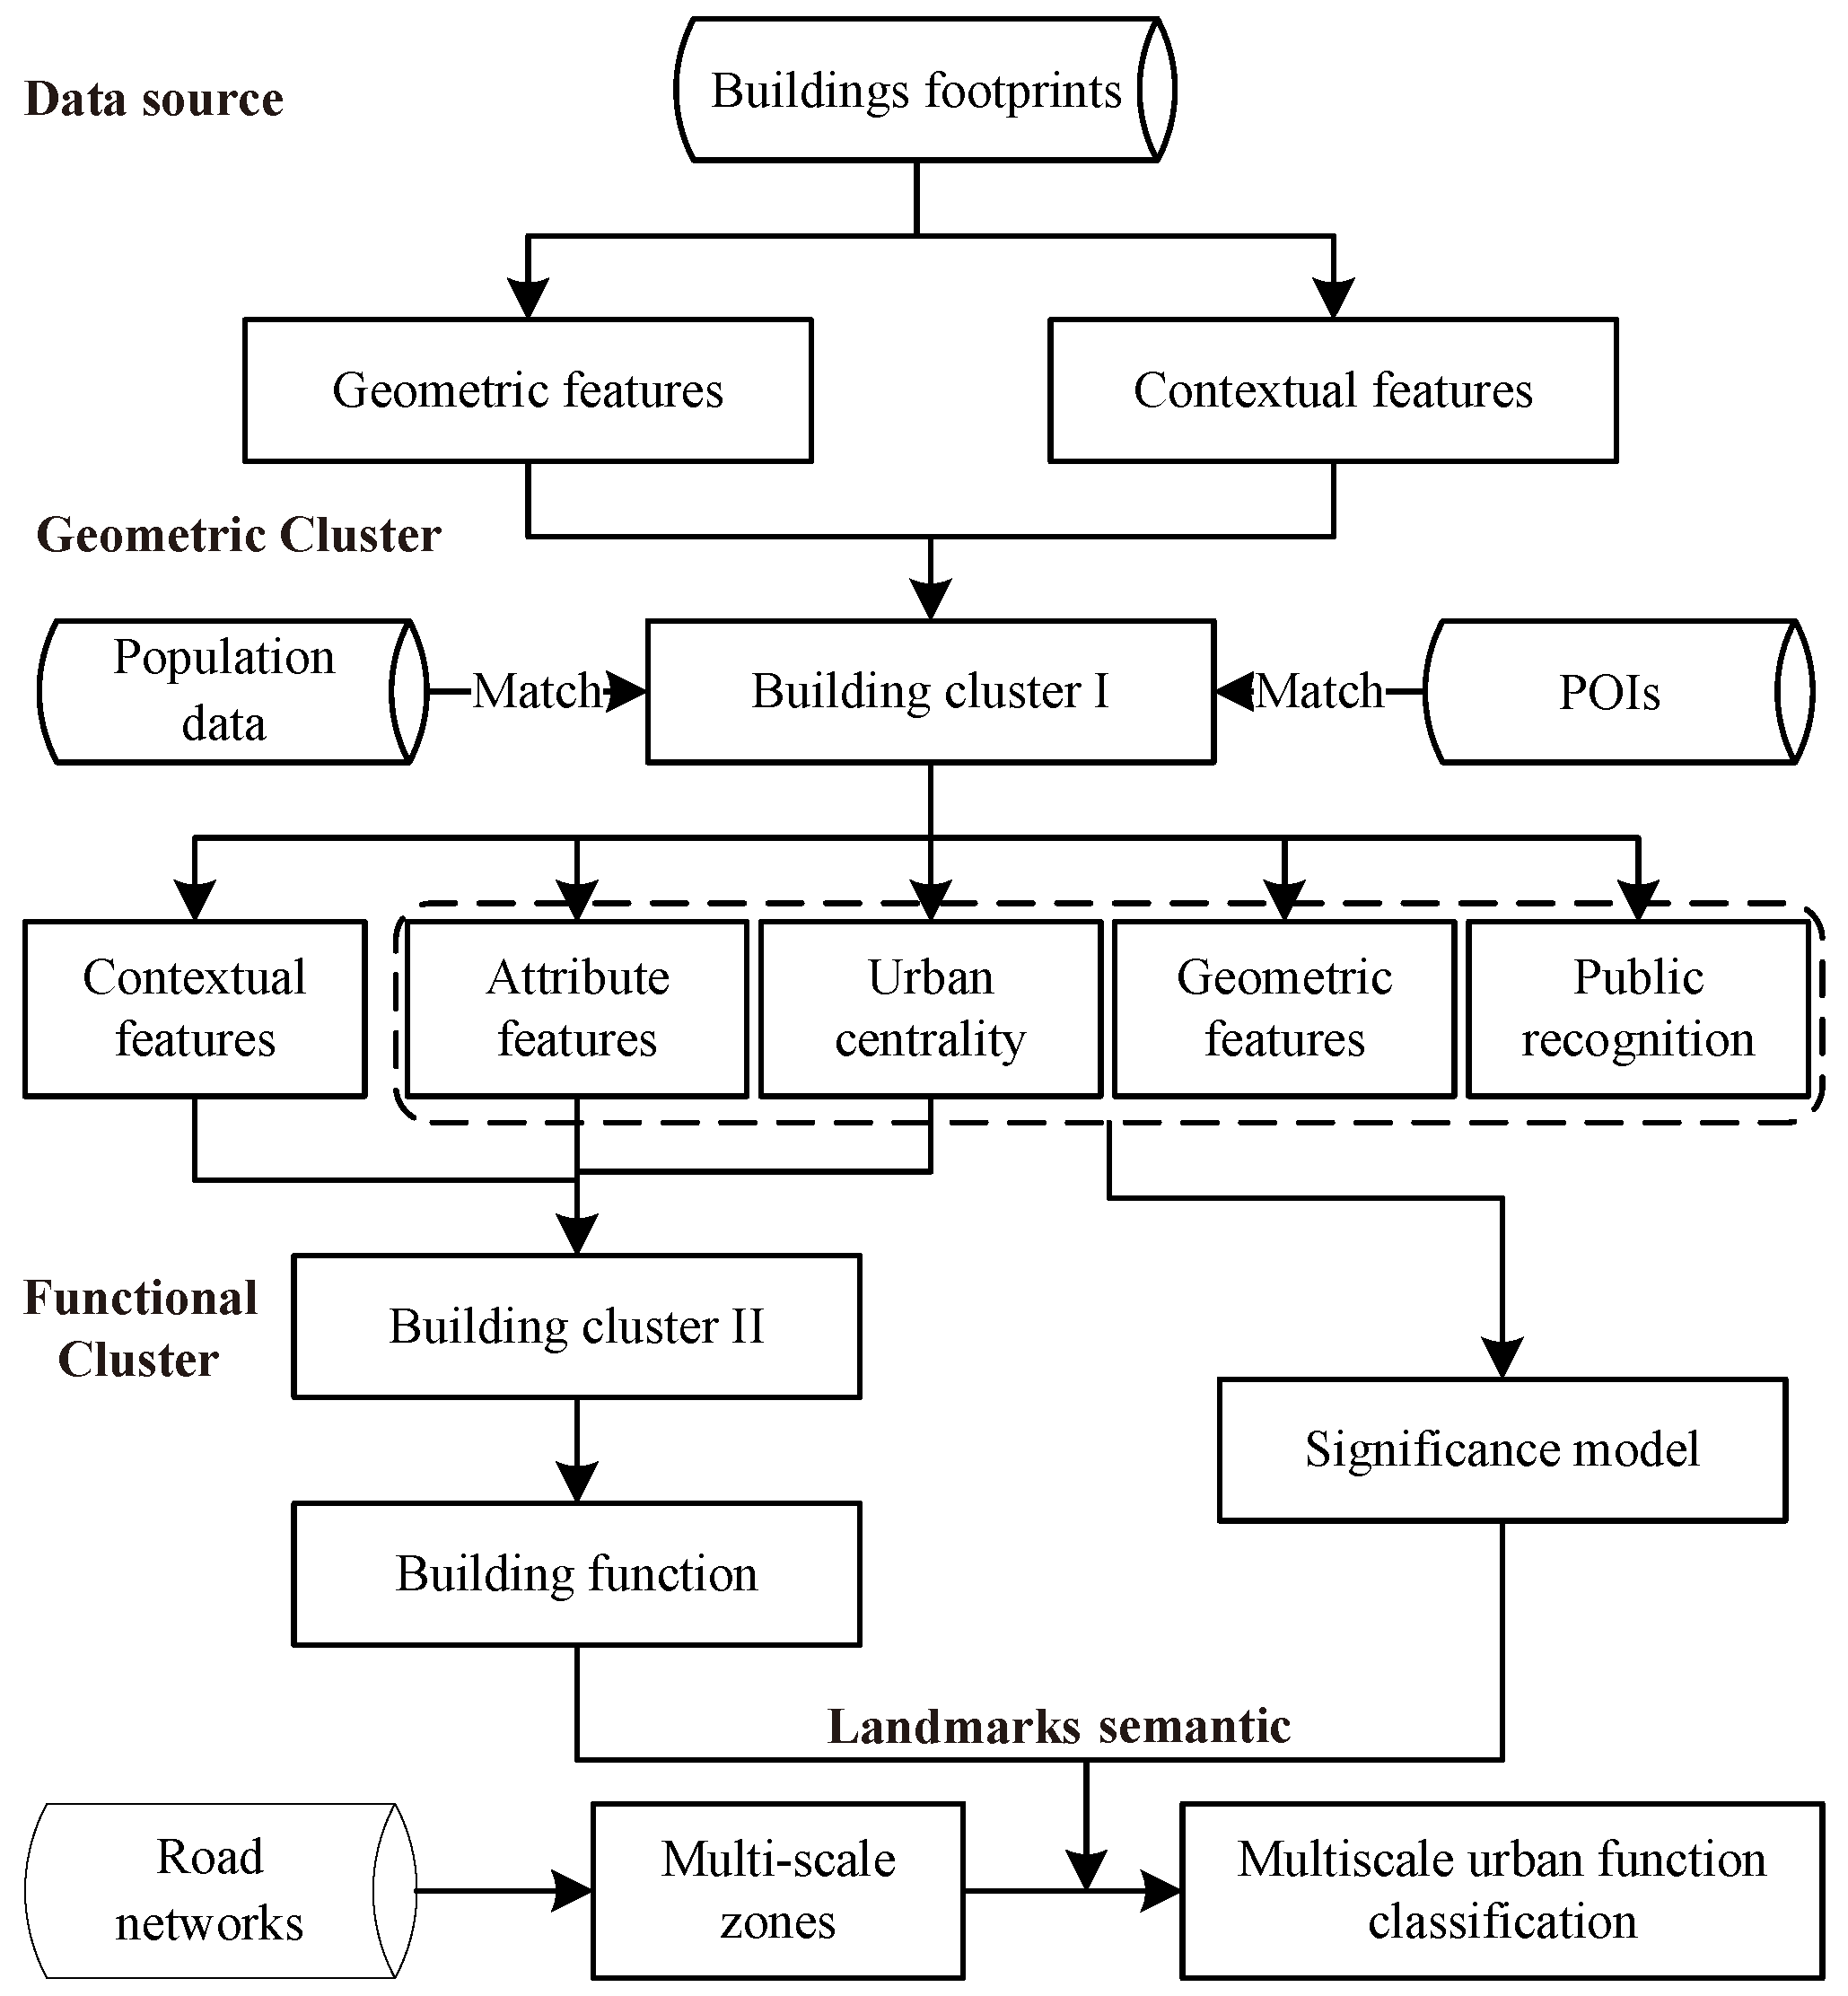
2. Materials and Methods

This paper recognizes multiscale urban functional zones based on landmark semantic constraints (as shown in Figure 2). Firstly, in the process of clustering based on geometric features, the Delaunay triangle network is used to extract the contextual features of buildings. The clusters I of buildings with similar geometric structures are obtained after clustering. Secondly, in the process of functional feature clustering, Delaunay triangulation is used to describe the context features of spatial targets (building cluster I), and the functional feature description of buildings is constructed by the attribute features and urban centrality. Building cluster iI is obtained via functional feature similarity clustering, so that the building function can be recognized by the two-level clustering model. Next, this study constructs the significance model of spatial objectives (building cluster I) through geometric features, attribute features, urban centrality, and public cognition. After that, the building cluster iI area and the constructed building significance are combined to achieve landmark extraction and functional area identification under a single scale. Finally, landmarks’ semantics are correlated across scales, based on which the significance and area of spatial targets are used to achieve mapping of urban functional areas at multiple scales.

2.1. Extracting Object Features

Buildings in urban zones of the same functional type exhibit similarities in geometric characteristics, functional structure, and spatial relationships. In the present study, geometric characteristics include shape, size, and orientation, while the functional structure is reflected in the criteria employed for the classification of POIs, and spatial relationships involve the topology, orientation, and distance.

2.1.1. Geometric Features

Different functional buildings often exhibit distinct geometric characteristics [21]. The parameters utilized for geometric characterization are height, perimeter, area, area concavity, perimeter concavity, sphericity, shape parameter, aspect ratio, and orientation angle (as shown in Table 1). These geometric features have been proven helpful for building function recognition [6,21,36,37]. To eliminate the impact of extreme values and ensure stability and sensitivity, data for all factors are normalized.
The geometric features of a spatial object can be described using an M-dimensional vector expressed as follows:
F g e o = [ u 1 , u 2 , u k , , u M ]
where u k is the k-th normalized geometric characteristic factor of the spatial object. Henceforth, M = 9 indicates that all nine geometric factors are utilized.

2.1.2. Functional Structure Features

POIs have been wildly used in geospatial data mining; in this study, they are used to describe the functional features of buildings. Considering that some positions associated with the POI data involve some deviation compared with reality, this study intends to conduct matching between POIs and buildings using a multi-stage buffer. The first stage involved the creation of a buffer involving constructed buildings, and this is followed by the matching of POIs within the buffer. Regarding areas around buildings without POIs, a secondary buffer is constructed and the associated POIs are then matched. If parts of the secondary buffer also lack POIs, matching of buildings and POIs is performed based on proximity. This research describes the functional structure features by attribute scores and urban centrality.
In the extraction of attribute scores, a rating criterion is introduced in the present study. Considering that the focus is on urban functional areas, the rating scores for community and living-related services are improved based on previous studies [35]. Concurrently, attributes of the POI types are categorized according to the report [38], including residential, public service, business services and facilities, green space and tourist attractions, traffic facilities, and others. Moreover, the attribute scores are also influenced by the number of buffers, and this can be calculated as follows:
F a t t = x a N b
where x a is the value of an attribute of various POIs as Table 2, which is set according to the previous studies [35]; N b is the number of buffers when the POI is matched with the building.
In the present study, the urban centrality is calculated using the Ordering Point to Identify the Cluster Structure (OPTICS), a multi-density spatial clustering algorithm [39]. Based on the OPTICS algorithm, the urban centrality is determined primarily via transformation of the reachable distance. Accordingly, the urban centrality ( F c e n ) is obtained as follows:
F c e n = ( 1 / d r ) a ( 1 / d m a x ) a ( 1 / d m i n ) a ( 1 / d m a x ) a / N b
where d r is the reachable distance for a POI while clustering, d m a x and d m i n are the maximum and minimum reachable distances for all POIs, respectively; a is the exponent involved in the transformation and N b is the number of buffers when the POI is matched with the building.
Thus, the value of the functional characteristic for building based on attribute scores F a t t and an urban centrality F c e n can be calculated as follows:
F f u n = [ F 1 , F 2 , F k , , F N ]
where N is set to 6 considering that six types of functional areas are identified in the present study (Table 2). F k is the maximum value of the functional characteristic of the k-th type of POI that matches the building, and it can be calculated as follows:
F k = w × ( w 1 × F k a t t + w 2 × F k c e n )
where w is a Gaussian function, and w 1 and w 2 are weights; F k a t t and F k c e n are the attribute scores and urban centrality for the k-th type of POI, calculated via Equations (2) and (3).

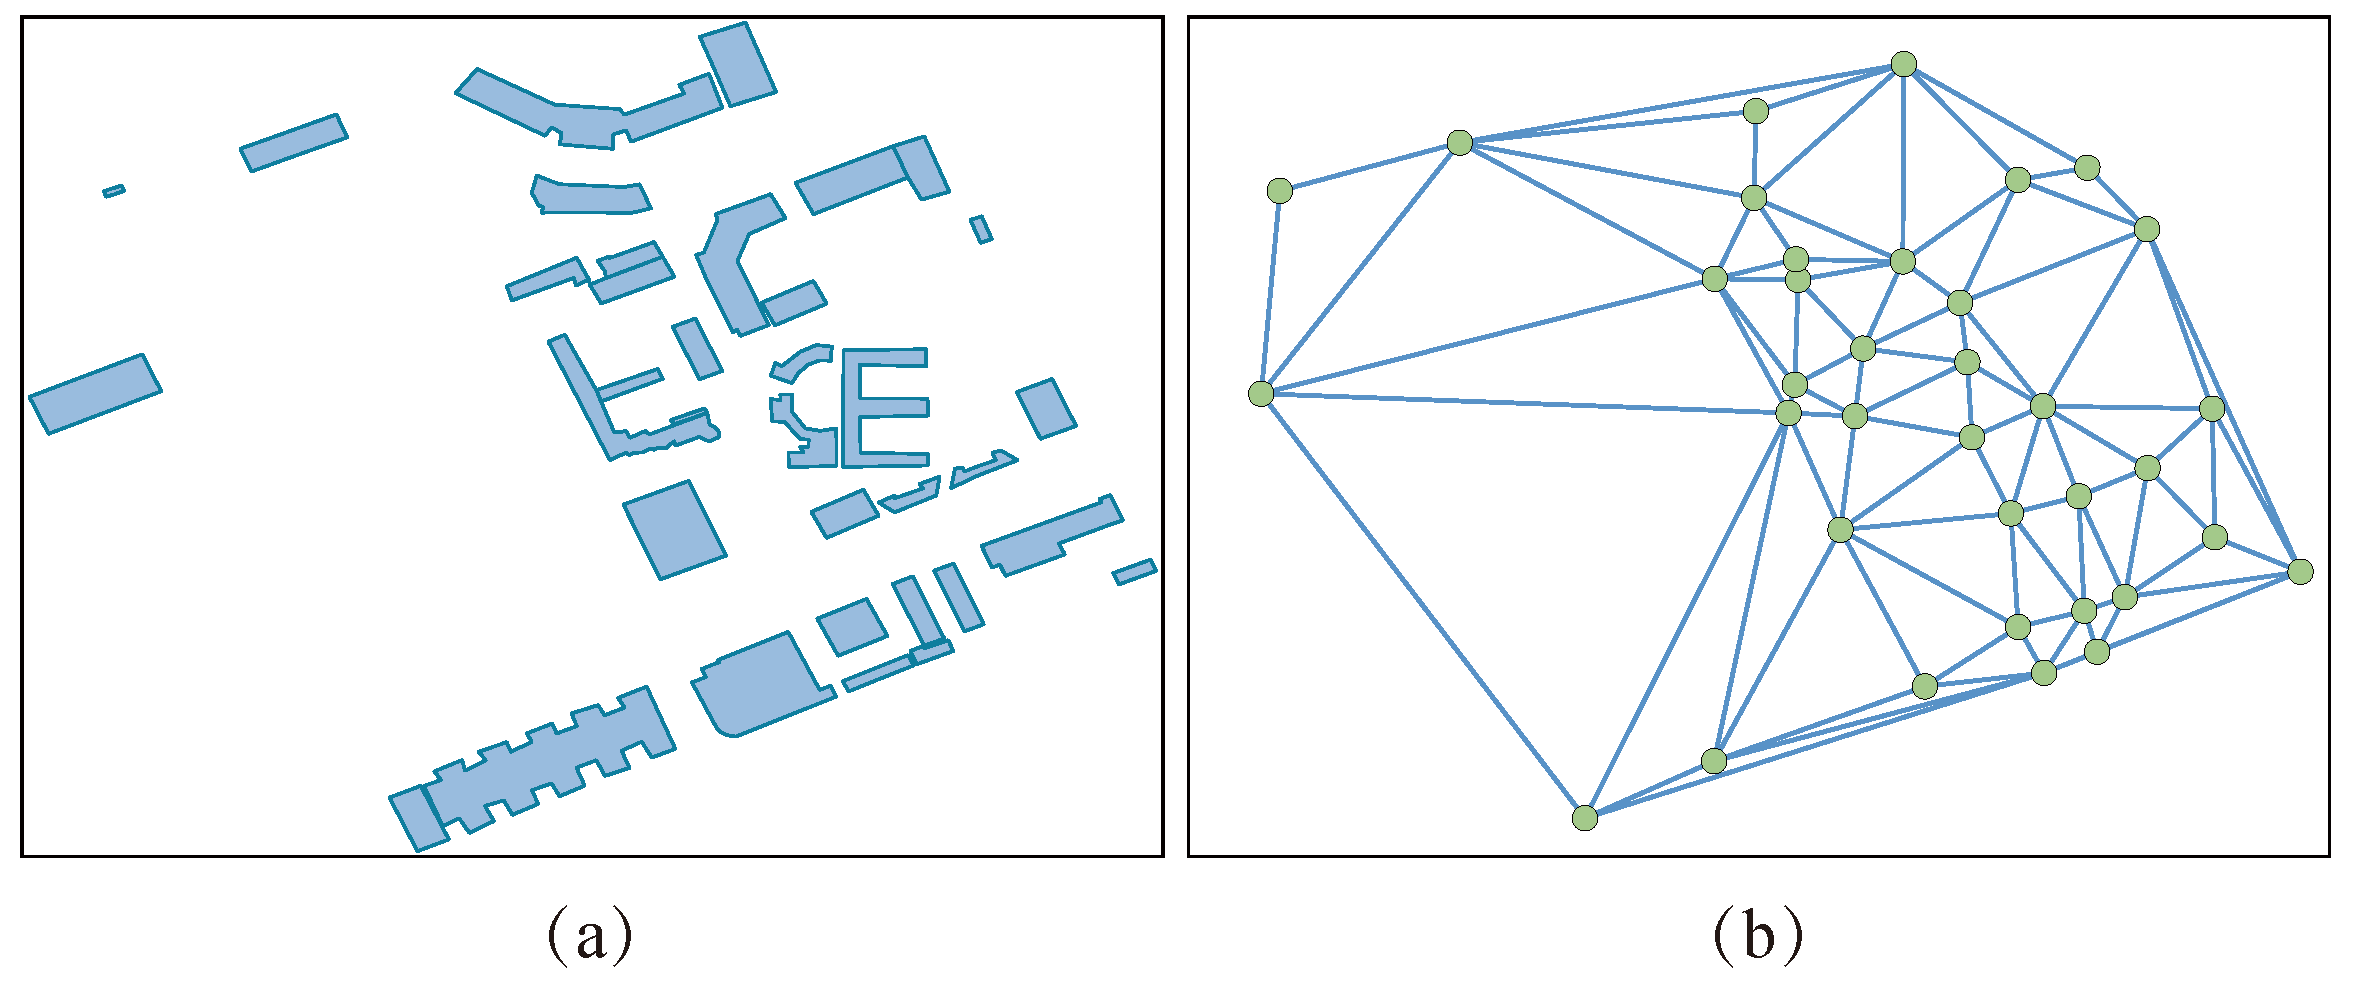
2.1.3. Spatial Relationship Features

A spatial relationship highlights the constraint between spatial data [40], and this is an important feature for the description of a spatial object. In the present study, the direction and topography relationships of a building are used to describe the spatial relationships. The direction relationship is characterized by the orientation of the long side for the minimum area rectangle of the building. The spatial topography relationships are described via the construction of a Delaunay triangulation network (DTN), as shown in Figure 3. The DTN was generated using the central points of the building footprints, and the road network was employed to constrain it through the deletion of unqualified edges. In this research, the Euclidean distance between two buildings is used to express the edge of the DTN.

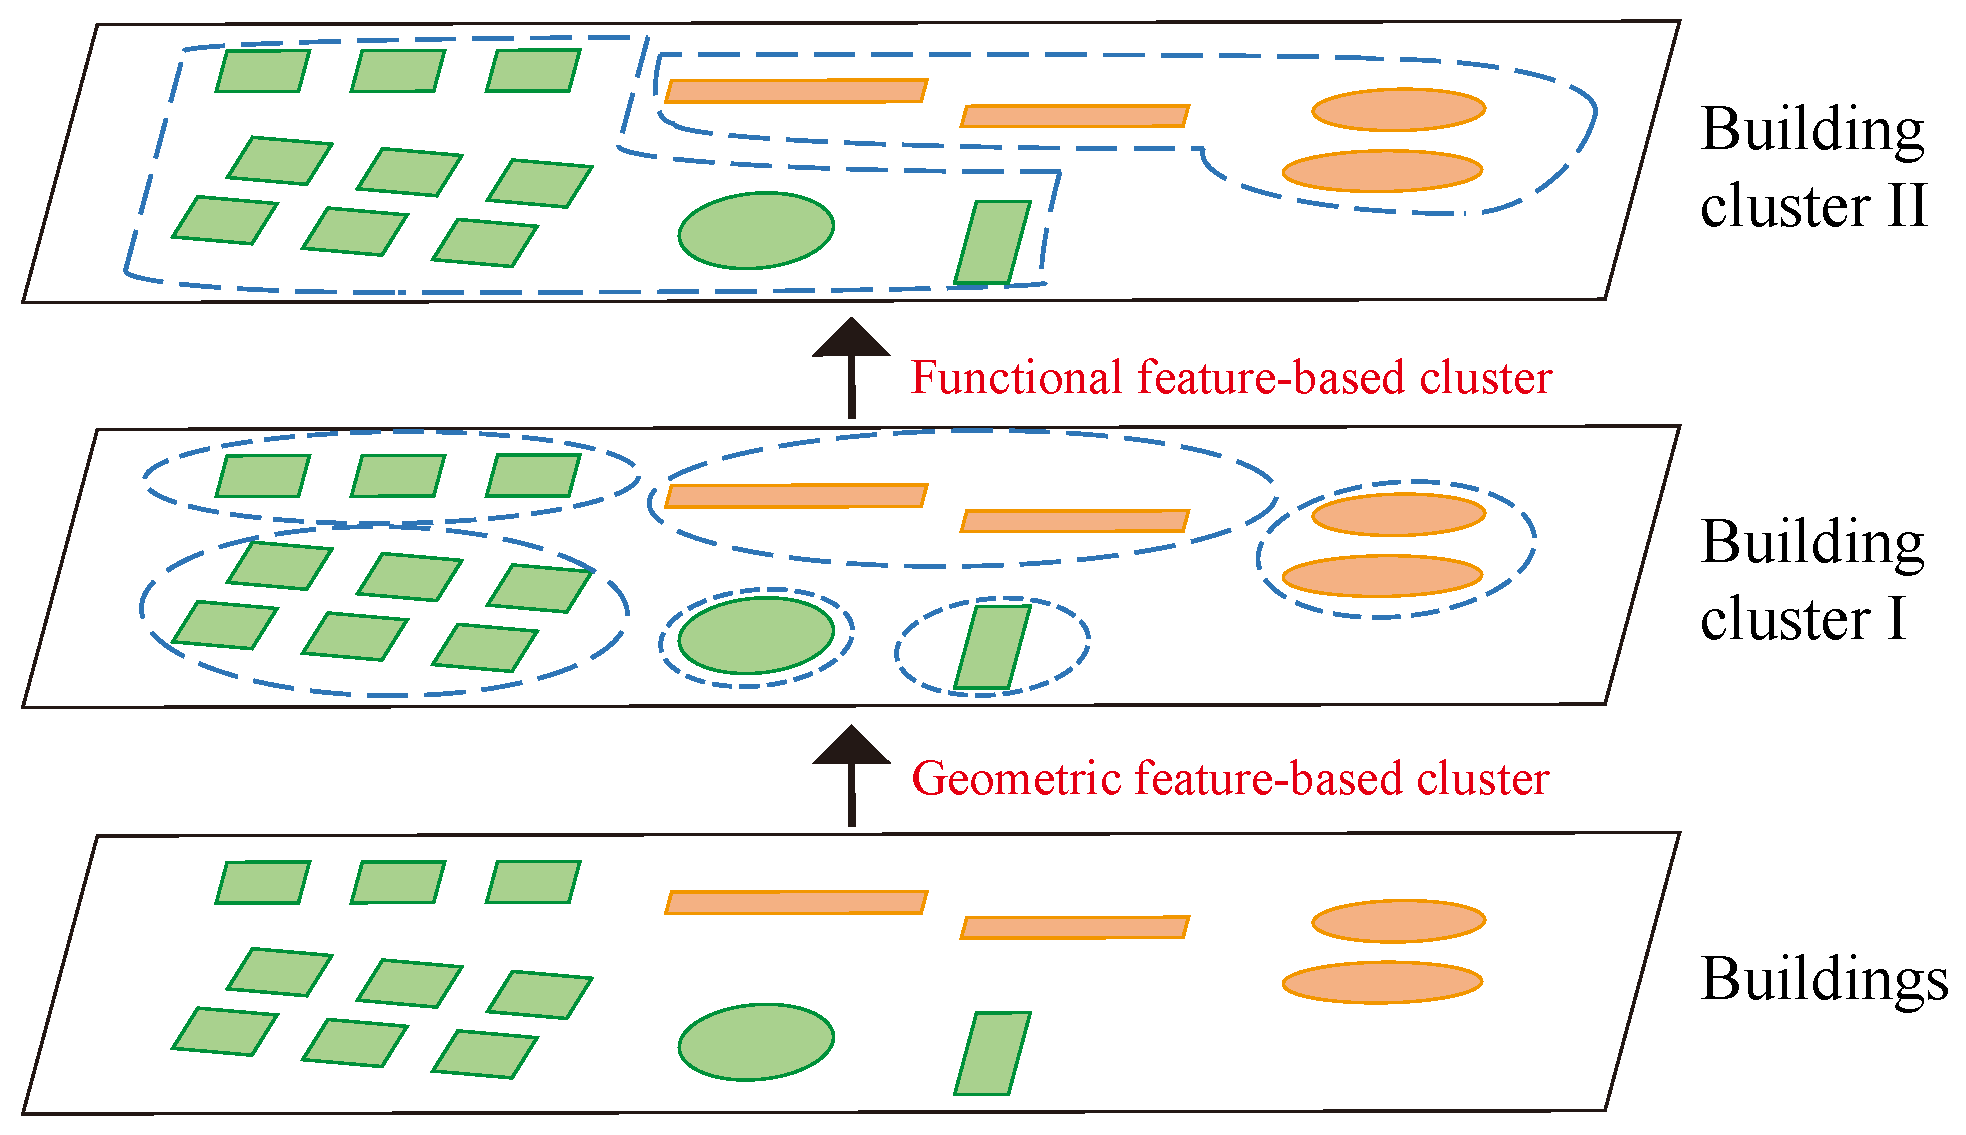
2.2. Recognizing Building Function Based on Hierarchical Clustering

To optimize urban building function recognition, a two-layer clustering model based on geometric and functional features is created (as Figure 4). First, buildings are clustered based on geometric features and contextual features. Then, the functional features are constructed using the matching relationships between POIs and buildings. The first layer for building clustering is achieved using the geometric similarities and contextual relationships, which can be executed using Algorithm 1.
Algorithm 1 Clustering of buildings
Require: Central points of the building footprints N = { n 1 , n 2 , , n 5 } and the contextual relationships e = { e 1 , e 2 , , e 7 }
Ensure: The cluster to which each building belongs C
    k = 0;
    Set n i { n 1 , n 2 , n N } and e i { e 1 , e 2 , e M } as unmarked;
    for  n i { n 1 , n 2 , n N } and n i is unmarked do
        Set new clustering C k = { n i } ;
        Search all unmarked edges connected in C k and add them to the neighborhood set NE;
        for  e i N E  do
            if  n p in C k connected with n q outside C k by e j , S i m ( n p , n q ) > λ 1 and S i m ( C k , n q ) > λ 2 ,
            where S i m ( ) is defined as the cosine similarity; then
               Merge the n q into C k and recompute the geometric features of C k ;
               Mark all edges of connected nodes in C k ;
               Search for edges between nodes inside and outside C k and add these to the neighborhood edge NE;
               Delete the marked edges in the edge neighborhood NE
            else
               Delete edge e j in NE
            end if
        end for
         k = k + 1
    end for

2.3. Classifying Urban Functional Zones Based on the Landmark Semantic Constrictions

2.3.1. Extracting Landmarks via Significance Model

In the present study, a building significance model is defined to extract landmarks based on the following factors: geometric features, attribute scores, urban centrality, and public cognition. The determination of geometric features, attribute scores, and urban centrality is described in Section 2.1. Public cognition is defined to describe the awareness or impacts of an object for the public. This research hypothesis that the population is a display of the public cognition and public cognition ( F c o g n ) for a building can be calculated using the following formulas:
F c o g n = X c o g n a C m a x a C m a x a C m i n a
and
X c o g n = 1 2 × ( s u m w e e k d a y S b + s u m w e e k e n d S b )
where s u m w e e k d a y is the sum of thermal values for all working days associated with the building groups; s u m w e e k e n d represents the sum of thermal values for all non-working days in the building groups. All of them are cumulative over a certain period. S b denotes the area occupied by the building groups, and a is the transformation coefficient; C m a x and C m i n are the maximum and minimum public cognition for all buildings, respectively.
The significance model for the landmarks can then be constructed via the summation of weights of all influencing factors as follows:
S i g n = w 1 × F g e o + w 2 × F f u n + w 3 × F u c + w 4 × F c o g n .
The weights of factors utilized in the present study can be set as in [35], where w 1 = 1.25, w 2 = 1.5, w 3 = 0.75, and w 4 = 1.5.

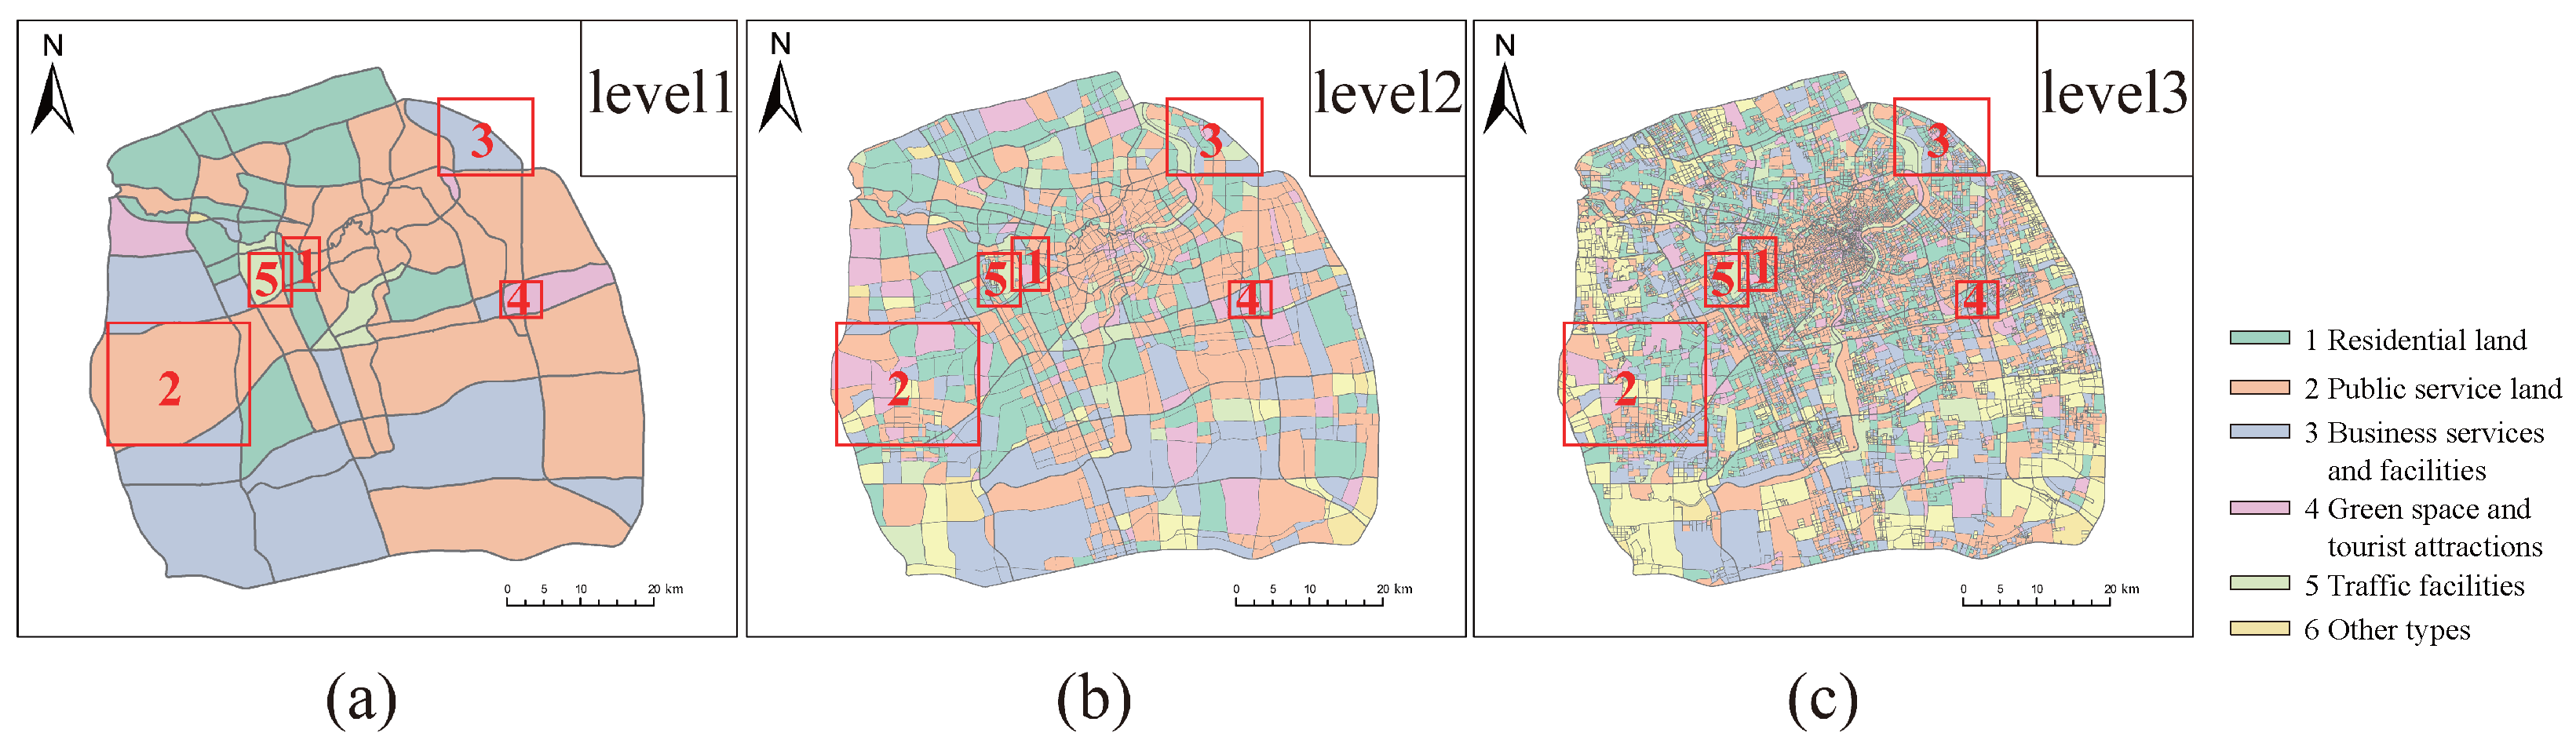
2.3.2. Classifying Urban Functional Zones in Multiple Scales

Multiscale zones are examined in the present study using varying levels of road networks. The urban function classification model in multiscale based on landmark semantic constraints can be expressed as follows:
F i = w j l × max ( S i g n ) + w j a × a i
where Sign is the normalized description of the significance calculated using Equation (7), max ( s i g n ) denotes the maximum significance of all the objects, that is, the extracted landmark; a i corresponds to the normalized value of the total area occupied by function type i, w is the weight, i = { 1 , 2 , 3 , 4 , 5 , 6 } represents the six types of functional zones, and j = 1 , 2 , 3 reflects the three road network levels. Thus, the hierarchical semantic cognition for urban functional zones can be expressed as F = max ( F i ) .

3. Results

3.1. Study Area and Data Processing

In this research, Shanghai is treated as the study area. Shanghai is a municipality in the People’s Republic of China which covers approximately 6340.5 km2 and comprises 16 districts, with a population of approximately 24.3 million. The study area is surrounded by suburban and outer ring roads. The geodata utilized in the present study included POIs, population, building footprints, and road network.
POI data: The POI dataset involved 622,627 points, and these are differentiated based on the following attributes: name, address, category, latitude, and longitude. To enhance the understanding of features for the identification of urban functional zones, the POIs are reclassified, and the results are presented in Table 3.
Road network data: These data were provided by the OpenStreetMap (OSM) in 2019. Moreover, the Huangpu and Suzhou rivers, which are two major rivers in Shanghai, are incorporated into the road network data to generate the study unit. The road network data are divided into three levels. Road network level 1 mainly included elevated roads and expressways, the Huangpu River, and the Suzhou River. Road network level 2 involved urban trunk roads, and road network 3 represented urban secondary trunk roads and branches. The types and levels of roads are listed in Table 4, while the road levels are also shown in Figure 5.
Population data: The population data were provided by Tencent in May 2019. They are utilized to display the spatial distribution of the population with a spatial resolution of 25 m. The population data are characterized based on the following: count (thermal intensity of population), longitude, latitude, and acquisition time.
Building footprints: Building footprints are obtained based on the Baidu maps of 2019. Building footprints involves the coordinates and building height, where height is represented by the number of floors. These amounted to 558,567 building footprints.

3.2. Analysis and Evaluation of Results

In the present study, the urban function classification was conducted at multiple scale units and the results are displayed in Figure 6, where multiple scale units were built via different levels of road networks. Moreover, to the show the proportion of types of functional zones in different scales, functional zone distribution of regional units at different scales is shown in Figure 7. In detail, in a classification at the finest levels (considering each building as a unit), the proportion of residential land to individual buildings is approximately 1:2, while that of business services to facilities is nearly 1:4. Therefore, although these two components are associated with low recognition, these can affect classification at multiple scales because of their occupying a large area. However, if urban function classification at multiple scales is conducted using the proposed method, the interference associated with the overall spatial cognition decreases because of the feature association and landmark constraints rules. It is a coincidence that as urbanization continues, concentrated communities are increasingly becoming multi-core and decentralized, and thus people require short displacements within core areas to obtain daily services.
As living circles expand, the cognition of individuals for the building functional classification can evolve. Therefore, considering the introduction of the multiscale spatial feature association rules (association and transmission of features) and landmark constraints, the interferences of the poorly recognized and widely distributed functional type components on the overall spatial cognition decreases. This explains the significant increases in the proportion of transportation facilities at all road network levels in different areas, followed by public service land and green space and touristic attractions. However, among the needs of people, transportation is the most important avenue to enhance the social circle, followed by education and medical treatment. Therefore, in urban areas, as the social circles of inhabitants expand, awareness concerning transportation facilities is the highest, followed by public service lands, while awareness concerning residential lands and business services and facilities decreases.
To enhance the utility of the proposed approach for classification involving multiscale urban functional zones, five regions representing different functional types were investigated (as marked in Figure 6). From the results (as shown in Figure 8), we can see the residential land and business services and facilities (zones 1 and 3) are characterized by features which facilitate classification. Conversely, for the public service land, for example, the college town in Songjiang District, Shanghai (zone 2), involves many residential buildings. Thus, relying simply on quantity or area constraint can cause misclassification of this zone as residential land. The green space and touristic attraction unit (zone 4) is similar to the public service land, and this caused its incorrect classification as a residential land. The most significant landmark among transportation facilities is the Hongqiao Airport (zone 5), but its classification based on the multiscale urban zone is affected by nearby functional types because the large area hosting it contains few buildings. However, after introducing the landmark semantic constraints, the identification results are consistent with the cognition of people. Moreover, it enables the mapping of functions from the buildings to the level 3 road network scale, which optimize urban function classification in multiple scales.
To verify the effectiveness of the landmark semantic constraints approach for multilscale urban function classification, comparative experiments have were conducted in five different functional areas with the area-based method. From the results (Figure 9), we can see these areas were recognized as public service, residential, business service, and facilities bia the area-based method, while they were recognized as residential, business service and facilities, business service, green space and tourist attractions, traffic facilities via the proposed method. In detail, for example, zones 1 and 5, the functional radiation energy values of residential land, and transportation facilities in this region were significantly enhanced, benefiting from the landmarks, including the Huaxuanli and Madang Road subway stations. Moreover, for zones 2 to 4, Shanghai University, the shopping district of Shanghai old street, and St. Joseph’s Church in Yangjingbin were extracted as landmarks. In these zones, it is more reasonable for classification as public service land, business services and facilities, and green space and touristic attractions because the extraction of the three landmark buildings differentiated the residential land. Therefore, compared with the area-based method, the proposed landmark-constraint method incorporates the cognitive differences between humans in the identification of special regions. This approach improves the availability and transmission efficiency of geographic information, enhances spatial identification and decision-making, and is consistent with human spatial cognition.

4. Discussion

Thanks to the POIs and building footprints being obtained from different sources, there is some offset between POIs and building footprints. Matching POIs and building footprints for extracting the functional features is an important steps. To rationally and accurately match the buildings and POIs, buildings were initially clustered based on geometric features to produce building cluster I. Subsequently, the multi-stage buffer was utilized to resolve the offset and uneven distribution of POIs. To validate this approach, the results obtained were compared with those associated with the kernel density matching (KDM) and frequency density matching (FDM) methods. A quantitative indicator requires labeling all the functional types at all scale regions. It is subjective except for obtaining the official data. Therefore, qualitative compared results were executed. Differences are obvious between the adequacy of the three methods for the matching from the results (Figure 10). In detail, the KDM method produced a patchy distribution characterized by poor heterogeneity because of its proneness to agglomeration. In particular, the identification of residential land (zone 1 in Figure 10) and other types (zone 6 in Figure 10) misses patchy areas, whereas the green space and tourist attractions (Zone 4 in Figure 10) are hyper-clustered, with a poor contrast between building types in the central area of the cluster. Conversely, the FDM method inadequately distinguishes building types characterized by significant cognitive differences, and thus the abundance of other types of matches associated with low cognitive buildings can largely interfere with matches for types 1–5. Evidently, the proposed method produced the best results for the matching of residential land and other types, and these results are significantly better relative to those linked to the KDM and FDM methods. Therefore, groups of buildings in residential lands can be accurately identified. Simultaneously, the matching of buildings relative to data for neighboring areas displays a potential order because of the inclusion of a functional feature for rating POIs, and this is valuable for the recognition of insignificant data. The matching performance for public service land (zone 2 in Figure 10) and green space and touristic attractions (zone 4 in Figure 10) is second. Prominent schools, hospitals, and other groups of buildings are adequately matched (the Fudan University and Shanghai Foreign Studies University marked in the middle and the lower left corner of Zone 2 in Figure 10). The performances for the matching of business services and facilities (zone 3 in Figure 10) and transportation facilities (zone 5 in Figure 10) were subordinate.
From the results (Figure 10), we can see there are obvious differences between these methods. The comparison of the three methods revealed that spatial heterogeneity is poorly considered in the KDM method, while the distance between the two matched data points and characteristics of the data are neglected in the FDM method. Therefore, in these two methods, buildings in an organization can be matched to different functional features or POIs with low semantic cognition and a high density may match most buildings. This eventually affects the functional type recognition results of buildings and scene areas. According to the comparison results, the proposed matching method eliminates these limitations, and thus the matching performance is significantly improved. Here, only qualitatively compared results were executed. It may be difficult to have a deep impression of these areas for readers who are not familiar with Shanghai. Quantitative indicators and deep learning models will be introduced to the research, making the process more intelligent and efficient.
The thresholds (the λ 1 and λ 2 mentioned in Algorithm 1) of the functional similarity during clustering are critical for the classification results. In the present study, the silhouette coefficient (SC) and Calinski–Harabaz (CH) were employed to evaluate the performance of clusters. The SC can be obtained from the following expression:
S C i = b i a i max ( a i , b i )
where a i is the average distance from sample i to another sample in the cluster, b i represents the average distance from sample i to another sample in the nearest cluster, and S C i denotes the contour coefficient of sample i, with the average contour coefficient based on all samples taking the values [−1,1]. Relatedly, the CH index can be calculated as follows:
C H k = B k W k × N k k 1
where B k is the variance for intra-clusters and W k the variance for inter-cluster, N indicates the number of samples, and k is the number of clusters.
Both evaluation metrics combine separation and tightness, and in the present investigation, the thresholds for λ 1 and λ 2 were identical and between 0.8 and 0.99. According to the results shown in Figure 11, SC displays a linear increase, while CH exhibits local maxima at 0.82, 0.86, 0.88, 0.91, with 0.91 as the global maximum. Therefore, considering the results from both metrics, 0.91 was set as the threshold for the functional clustering of building groups.

5. Conclusions

Classification of urban functional areas is vital for the establishment of smart cities. The expression of urban functions conveys urban information at varying scales. However, some methods that neglect cognitive differences amongst humans produce errors in the characterization of multiple scale regional function zones. Moreover, overcoming constraints and correlations of cross-scale characteristics in urban functional zones are also unresolved issues. To solve these problems, the multiscale urban function classification based on landmark constraints proposed in the present study integrated data from multiple sources to extract significant features of spatial objects, and designed a significance model for the extraction of landmarks to perform urban zones functional classification. The model incorporated visual, semantic, and spatial characteristics of geographic entities, and these improved the recognition of functional regions and prevented misidentification caused by single data sources. For the proposed model, different landmarks play the same roles in urban function classification, which may be inappropriate in some situations. The concept of a timescale can be introduced subsequently, such as the analysis of trajectory data for human and related activities. In the future, the time-based perspective will be researched to minimize the misclassification of buildings and to enhance assessment of the significance of different categories of landmarks. POIs are biased and their types are always biased toward commercial types. With the development of deep learning in urban functional zone recognition, future work will focus on how to solve this problem by learning the functions of a single building.

Author Contributions

Xuejing Xie, Yongyang Xu and Wenjun Wu collected and processed the data, performed analyses, and wrote the paper; Xuejing Xie, Bin Feng, and Yongyang Xu analyzed the results; Bin Feng contributed to the validation. All authors have read and agreed to the published version of the manuscript.

Funding

This study was funded by the National Natural Science Foundation of China [42371454, 42001340]; State Key Laboratory of Geo-Information Engineering [SKLGIE2021-M-4-1]; Ministry of Natural Resources High-level Science and Technology Innovation Talent Project Funding Program [121106000000180039-2207].

Data Availability Statement

The original contributions presented in the study are included in the article, further inquiries can be directed to the corresponding authors.

Conflicts of Interest

The authors declare no conflicts of interest.

References

  1. Long, Y.; Shen, Z.; Mao, Q. An urban containment planning support system for Beijing. Comput. Environ. Urban Syst. 2011, 35, 297–307. [Google Scholar] [CrossRef]
  2. Yang, G.; Han, Y.; Gong, H.; Zhang, T. Spatial-temporal response patterns of tourist flow under real-time tourist flow diversion scheme. Sustainability 2020, 12, 3478. [Google Scholar] [CrossRef]
  3. Wang, J.; Deng, Y.; Song, C.; Tian, D. Measuring time accessibility and its spatial characteristics in the urban areas of Beijing. J. Geogr. Sci. 2016, 26, 1754–1768. [Google Scholar] [CrossRef]
  4. Lucchi, E.; D’Alonzo, V.; Exner, D.; Zambelli, P.; Garegnani, G. A density-based spatial cluster analysis supporting the Building Stock Analysis in Historical Towns. In Proceedings of the Building Simulation, Rome, Italy, 2–4 September 2019; pp. 3831–3838. [Google Scholar]
  5. Zhang, K.; Ming, D.; Du, S.; Xu, L.; Ling, X.; Zeng, B.; Lv, X. Distance Weight-Graph Attention Model-Based High-Resolution Remote Sensing Urban Functional Zone Identification. IEEE Trans. Geosci. Remote. Sens. 2022, 60, 1–18. [Google Scholar] [CrossRef]
  6. Xu, S.; Qing, L.; Han, L.; Liu, M.; Peng, Y.; Shen, L. A new remote sensing images and point-of-interest fused (RPF) model for sensing urban functional regions. Remote Sens. 2020, 12, 1032. [Google Scholar] [CrossRef]
  7. Oliva, A.; Torralba, A. Modeling the shape of the scene: A holistic representation of the spatial envelope. Int. J. Comput. Vis. 2001, 42, 145–175. [Google Scholar] [CrossRef]
  8. Serrano, N.; Savakis, A.E.; Luo, J. Improved scene classification using efficient low-level features and semantic cues. Pattern Recognit. 2004, 37, 1773–1784. [Google Scholar] [CrossRef]
  9. Liu, X.; Long, Y. Automated identification and characterization of parcels with OpenStreetMap and points of interest. Environ. Plan. B Plan. Des. 2016, 43, 341–360. [Google Scholar] [CrossRef]
  10. Zhao, B.; Zhong, Y.; Xia, G.S.; Zhang, L. Dirichlet-derived multiple topic scene classification model for high spatial resolution remote sensing imagery. IEEE Trans. Geosci. Remote Sens. 2015, 54, 2108–2123. [Google Scholar] [CrossRef]
  11. Zhao, B.; Zhong, Y.; Zhang, L.; Huang, B. The Fisher kernel coding framework for high spatial resolution scene classification. Remote Sens. 2016, 8, 157. [Google Scholar] [CrossRef]
  12. Huang, W.; Zhang, D.; Mai, G.; Guo, X.; Cui, L. Learning urban region representations with POIs and hierarchical graph infomax. ISPRS J. Photogramm. Remote Sens. 2023, 196, 134–145. [Google Scholar] [CrossRef]
  13. Zhang, F.; Du, B.; Zhang, L. Scene classification via a gradient boosting random convolutional network framework. IEEE Trans. Geosci. Remote Sens. 2015, 54, 1793–1802. [Google Scholar] [CrossRef]
  14. Zhang, F.; Du, B.; Zhang, L. A multi-task convolutional neural network for mega-city analysis using very high resolution satellite imagery and geospatial data. arXiv 2017, arXiv:1702.07985. [Google Scholar]
  15. Xu, Y.; He, Z.; Xie, X.; Xie, Z.; Luo, J.; Xie, H. Building function classification in Nanjing, China, using deep learning. Trans. GIS 2022, 26, 2145–2165. [Google Scholar] [CrossRef]
  16. Xu, Y.; Jin, S.; Chen, Z.; Xie, X.; Hu, S.; Xie, Z. Application of a graph convolutional network with visual and semantic features to classify urban scenes. Int. J. Geogr. Inf. Sci. 2022, 36, 2009–2034. [Google Scholar] [CrossRef]
  17. Xu, Y.; Zhou, B.; Jin, S.; Xie, X.; Chen, Z.; Hu, S.; He, N. A framework for urban land use classification by integrating the spatial context of points of interest and graph convolutional neural network method. Comput. Environ. Urban Syst. 2022, 95, 101807. [Google Scholar] [CrossRef]
  18. Li, F.; Perona, P. A bayesian hierarchical model for learning natural scene categories. In Proceedings of the 2005 IEEE Computer Society Conference on Computer Vision and Pattern Recognition (CVPR’05), San Diego, CA, USA, 20–25 June 2005; IEEE: Piscataway, NJ, USA, 2005; Volume 2, pp. 524–531. [Google Scholar]
  19. Porway, J.; Wang, Q.; Zhu, S.C. A hierarchical and contextual model for aerial image parsing. Int. J. Comput. Vis. 2010, 88, 254–283. [Google Scholar] [CrossRef]
  20. Tang, H.; Shen, L.; Qi, Y.; Chen, Y.; Shu, Y.; Li, J.; Clausi, D.A. A multiscale latent Dirichlet allocation model for object-oriented clustering of VHR panchromatic satellite images. IEEE Trans. Geosci. Remote Sens. 2012, 51, 1680–1692. [Google Scholar] [CrossRef]
  21. Du, S.; Zheng, M.; Guo, L.; Wu, Y.; Li, Z.; Liu, P. Urban building function classification based on multisource geospatial data: A two-stage method combining unsupervised and supervised algorithms. Earth Sci. Inform. 2024, 1–23. [Google Scholar] [CrossRef]
  22. Zhang, Y.; Li, Q.; Huang, H.; Wu, W.; Du, X.; Wang, H. The combined use of remote sensing and social sensing data in fine-grained urban land use mapping: A case study in Beijing, China. Remote Sens. 2017, 9, 865. [Google Scholar] [CrossRef]
  23. Cheng, J.; Jia, S.; Ying, L.; Liu, Y.; Wang, S.; Zhu, Y.; Li, Y.; Zou, C.; Liu, X.; Liang, D. Improved parallel image reconstruction using feature refinement. Magn. Reson. Med. 2018, 80, 211–223. [Google Scholar] [CrossRef] [PubMed]
  24. Liu, X.; Tian, Y.; Zhang, X.; Wan, Z. Identification of urban functional regions in chengdu based on taxi trajectory time series data. ISPRS Int. J. Geo-Inf. 2020, 9, 158. [Google Scholar] [CrossRef]
  25. Miao, R.; Wang, Y.; Li, S. Analyzing urban spatial patterns and functional zones using sina Weibo POI data: A case study of Beijing. Sustainability 2021, 13, 647. [Google Scholar] [CrossRef]
  26. Xue, B.; Xiao, X.; Li, J.; Zhao, B.; Fu, B. Multi-source data-driven identification of urban functional areas: A case of Shenyang, China. Chin. Geogr. Sci. 2023, 33, 21–35. [Google Scholar] [CrossRef]
  27. Hu, S.; Xing, H.; Luo, W.; Wu, L.; Xu, Y.; Huang, W.; Liu, W.; Li, T. Uncovering the association between traffic crashes and street-level built-environment features using street view images. Int. J. Geogr. Inf. Sci. 2023, 37, 2367–2391. [Google Scholar] [CrossRef]
  28. Lynch, K. The image of the environment. In The Image of the City; The MIT Press: Cambridge, MA, USA, 1960; Volume 11, pp. 1–13. [Google Scholar]
  29. Lovelace, K.L.; Hegarty, M.; Montello, D.R. Elements of good route directions in familiar and unfamiliar environments. In Proceedings of the Spatial Information Theory. Cognitive and Computational Foundations of Geographic Information Science: International Conference COSIT’99, Stade, Germany, 25–29 August 1999; Springer: Berlin/Heidelberg, Germany, 1999; pp. 65–82. [Google Scholar]
  30. Duckham, M.; Winter, S.; Robinson, M. Including landmarks in routing instructions. J. Locat. Based Serv. 2010, 4, 28–52. [Google Scholar] [CrossRef]
  31. Sorrows, M.E.; Hirtle, S.C. The nature of landmarks for real and electronic spaces. In Proceedings of the Spatial Information Theory. Cognitive and Computational Foundations of Geographic Information Science: International Conference COSIT’99, Stade, Germany, 25–29 August 1999; Springer: Berlin/Heidelberg, Germany, 1999; pp. 37–50. [Google Scholar]
  32. Raubal, M.; Winter, S. Enriching wayfinding instructions with local landmarks. In Proceedings of the International Conference on Geographic Information Science, Boulder, CO, USA, 25–28 September 2002; Springer: Berlin/Heidelberg, Germany, 2002; pp. 243–259. [Google Scholar]
  33. Klippel, A.; Winter, S. Structural salience of landmarks for route directions. In Proceedings of the International Conference on Spatial Information Theory, Ellicottville, NY, USA, 14–18 September 2005; Springer: Berlin/Heidelberg, Germany, 2005; pp. 347–362. [Google Scholar]
  34. Caduff, D.; Timpf, S. On the assessment of landmark salience for human navigation. Cogn. Process. 2008, 9, 249–267. [Google Scholar] [CrossRef]
  35. Zhao, W.; Li, Q.; Li, B. Extracting hierarchical landmarks from urban POI data. Yaogan Xuebao J. Remote Sens. 2011, 15, 973–988. [Google Scholar]
  36. Xie, X.; Liu, Y.; Xu, Y.; He, Z.; Chen, X.; Zheng, X.; Xie, Z. Building Function Recognition Using the Semi-Supervised Classification. Appl. Sci. 2022, 12, 9900. [Google Scholar] [CrossRef]
  37. He, X.; Deng, M.; Luo, G. Recognizing building group patterns in topographic maps by integrating building functional and geometric information. ISPRS Int. J. Geo-Inf. 2022, 11, 332. [Google Scholar] [CrossRef]
  38. Xue, H.; Zhang, W.; Chen, H.; Chi, S. Comparative Analysis of New and Old “Code for Classification of Urban Land Use and Planning Standards of Development Land”. Modern Urban Res. 2015, 11, 69–75. [Google Scholar]
  39. Ankerst, M.; Breunig, M.M.; Kriegel, H.P.; Sander, J. OPTICS: Ordering points to identify the clustering structure. ACM SIGMOD Rec. 1999, 28, 49–60. [Google Scholar] [CrossRef]
  40. Egenhofer, M.J. Pre-Processing queries with spatial constraints. Photogramm. Eng. Remote Sens. 1994, 60, 783–790. [Google Scholar]
Figure 1. Urban function classification of a certain area without (a) and with (b) the landmark semantic constraints.
Ijgi 13 00095 g001
Figure 2. Technical flow chart.
Ijgi 13 00095 g002
Figure 3. The description of topography relationships via DTN. (a) Original buildings and (b) buildings associated with the DTN.
Ijgi 13 00095 g003
Figure 4. Clustering model based on geometric and functional features.
Ijgi 13 00095 g004
Figure 5. Map displaying the levels of roads in the study area.
Ijgi 13 00095 g005
Figure 6. Urban function classification of the study area under different scales. (a) for level 1, (b) for level 2, and (c) for level 3.
Ijgi 13 00095 g006
Figure 7. The functional distribution of regional units at different levels.
Ijgi 13 00095 g007
Figure 8. Maps exhibiting the landmark extraction and functional area classification associated with the multiscales. (a,d,g,j,m) Urban function classification maps based on single buildings; (b,e,h,k,n) results derived from the level 2 road network. (c,f,i,l,o) Urban function classification associated with the level 1 road network.
Ijgi 13 00095 g008
Figure 9. Illustration of the comparison of functions recognized based on the area-based sub-figures (a,c,e,g,i) and the proposed landmark constraints method sub-figures (b,d,f,h,j).
Ijgi 13 00095 g009
Figure 10. The matching performances for the KDM as sub-figures (a,d,g,j,m,p), FDM as sub-figures (b,e,h,k,n,q), and the proposed multi-stage buffer as sub-figures (c,f,i,l,o,r).
Ijgi 13 00095 g010
Figure 11. The evaluation of the functional clustering of building groups.
Ijgi 13 00095 g011
Table 1. Geometric factors, associated interpretation, and determination expression.
Geometric FactorImplicationSymbols and Formulas
HeightHeight of a buildingH
PerimeterPerimeter of a building footprintP
AreaArea of a building footprintA
Area concavityRatio of area for a building footprint (A) and its responding convex hull ( A c o n ) C o n A = A A c o n
Perimeter concavity ( C o n P )Ratio of perimeter for a building footprint (P) and its responding convex hull ( P c o n ) C o n P = P P c o n
Spherical shape ( F l a t s h p )Flattening ratio of a building footprint F l a t s h p = P c o n 2 π A
ShapeShape of a building footprint S h p = P 2 π A
Aspect ratio ( A r )Ratio of the long side ( L M A B ) to the short side ( W M A B ) of the minimum area rectangle for a building footprint A r = L M A B W M A B
Orientation angleThe orientation for long side of the minimum area rectangle for a building footprint α M A B
Table 2. Summary of ratings for the attributes of POIs and reclassification.
Functional TypeAttribute TypeAttribute Value
ResidentialNeighborhood0.6548
Living services0.2
Public serviceCultural education0.6706
Hospital0.5069
Important institutions0.355
Business services and facilitiesShopping malls0.8146
High-class hotel0.5562
Leisure venues0.501
Mansions0.3057
Green space and tourist attractionsFamous places0.8245
Traffic facilitiesTransportation hub1
OthersOther0
Table 3. Categories of POIs and reclassification results.
IDPOI CategoriesReclassified Results
1Transportation hubTerminal, (Airport) Departure, (Airport) Arrival, (Train Station) Entrance, Exit (Train Station)
Transportation facilities services: port terminals, ferry stations, bus stations, subway stations, train stations, airport related, airports, terminals
2Famous placesScenic spots
Place name address information: natural place names, hotspot names, landmarks
3Shopping mallsShopping services: shopping malls, special shopping streets
4Cultural educationScience, education and culture services
5NeighborhoodBusiness residence
Place name address information: house number information, common place name
6High-class hotelAccommodation services
7HospitalHealth care services
8Leisure venuesSports leisure service, catering service
Shopping service: Supermarket
9Important institutionsGovernment agencies and social organizations, financial and insurance services
Life service: business hall, post office
10MansionsCompany and enterprise
Business residence: building, industrial park
Life service: talent market, intermediary agency, firm
11Living servicesAutomobile maintenance, automobile sales, automobile service, motorcycle service, shopping service, life service
12OtherAccess facilities, road ancillary facilities, place names and address information, transportation facilities, public facilities, parking lots, ticket offices, doors
Financial and insurance services: ATM
Table 4. The types and levels of roads utilized.
LevelTypeClassDescription
1Elevated roads, expressways and riverMotorwayExpressway, river crossing tunnel
Motorway_linkExpressways, ramps
TrunkElevated expressways, airport approach expressways, river crossings, over-bridge expressways
Trunk_linkInterchanges, ramps, approach roads on bridges, airport inbound expressways, national highway diversions
RiverRivers
2Urban trunk roadsSecondaryUrban secondary roadways, airport peripheral roadways
Secondary_linkUrban secondary carriageway interchanges, ramps, and a few other roads
PrimaryMajor urban carriageway
Primary_linkMajor urban carriageway interchanges, ramps, and a few other roads
3Urban secondary trunk, roads and branchesTertiaryUrban feeder roads
Tertiary_linkAirport collector roads and a few other roads
ResidentialResidential area carriageway
UnclassifiedResidential carriageways, waterfront carriageways, airport carriageways
Disclaimer/Publisher’s Note: The statements, opinions and data contained in all publications are solely those of the individual author(s) and contributor(s) and not of MDPI and/or the editor(s). MDPI and/or the editor(s) disclaim responsibility for any injury to people or property resulting from any ideas, methods, instructions or products referred to in the content.

