Article

Target Localization Method Based on Image Degradation Suppression and Multi-Similarity Fusion in Low-Illumination Environments

1
Department of Electronic and Communication Engineering, Heilongjiang University, Harbin 150080, China
2
National Mobile Communications Research Laboratory, Southeast University, Nanjing 210096, China
3
Department of Electronics and Information Engineering, Harbin Institute of Technology, Harbin 150080, China
*
Author to whom correspondence should be addressed.
ISPRS Int. J. Geo-Inf. 2023, 12(8), 300; https://doi.org/10.3390/ijgi12080300
Submission received: 16 May 2023 / Revised: 3 July 2023 / Accepted: 26 July 2023 / Published: 27 July 2023
(This article belongs to the Special Issue Urban Geospatial Analytics Based on Crowdsourced Data)

Abstract

:
Frame buildings as important nodes of urban space. The include high-speed railway stations, airports, residences, and office buildings, which carry various activities and functions. Due to illumination irrationality and mutual occlusion between complex objects, low illumination situations frequently develop in these architectural environments. In this case, the location information of the target is difficult to determine. At the same time, the change in the indoor electromagnetic environment also affects the location information of the target. Therefore, this paper adopts the vision method to achieve target localization in low-illumination environments by feature matching of images collected in the offline state. However, the acquired images have serious quality degradation problems in low-illumination conditions, such as low brightness, low contrast, color distortion, and noise interference. These problems mean that the local features in the collected images are missing, meaning that they fail to achieve a match with the offline database images; as a result, the location information of the target cannot be determined. Therefore, a Visual Localization with Multiple-Similarity Fusions (VLMSF) is proposed based on the Nonlinear Enhancement And Local Mean Filtering (NEALMF) preprocessing enhancement. The NEALMF method solves the problem of missing local features by improving the quality of the acquired images, thus improving the robustness of the visual positioning system. The VLMSF method solves the problem of low matching accuracy in similarity retrieval methods by effectively extracting and matching feature information. Experiments show that the average localization error of the VLMSF method is only 8 cm, which is 33.33% lower than that of the Kears-based VGG-16 similarity retrieval method. Meanwhile, the localization error is reduced by 75.76% compared with the Perceptual hash (Phash) retrieval method. The results show that the method proposed in this paper greatly alleviates the influence of low illumination on visual methods, thus helping city managers accurately grasp the location information of targets under complex illumination conditions.

1. Introduction

With the rapid development of urbanization and the continuous advancement of technology, the demand for location services is increasing. In the outdoor environment, satellite navigation systems such as GPS [1] and Beidou [2] can relatively accurately determine the location information of the target. However, the transmission quality of the satellite signal is poor in the frame building space, thus making it impossible to determine the location information of the target. In contrast, vision-based methods [3] have been widely used in indoor positioning and navigation because of their rich visual image information, convenient access, and wide range of applications.
Visual positioning determines the position information of the target by extracting the feature information of the target image and matching the extracted feature information with the image collected in the offline state. As a result, the precision of image matching determines whether target location information can be accurately determined in visual positioning. However, images captured in the frame building space with insufficient illumination feature problems such as low contrast, low brightness, color distortion, and noise interference. Because of these problems, the feature extraction method is unable to extract enough feature points, which results in low matching accuracy between the target image and the offline database image, and hence leading to visual positioning failure. Therefore, it is of great research value to obtain the location information of the target through visual methods in the frame building space under low-illumination conditions.
In order to improve the robustness of visual localization systems in low-illumination environments, researchers continue to study and improve image enhancement methods based on distributed mapping, model optimization, and deep learning, so as to improve the quality of the collected low-illumination images, thus solving the problem that visual positioning cannot be achieved because of missing feature points. Histogram equalization [4] and the approach based on an S-shaped curve [5] are two typical works of methods based on distribution mapping. However, the method based on distributed mapping lacks the recognition and utilization of semantic information, which makes the enhanced image still have color distortion. The image enhancement method based on Retinex [6] is the most widely used method based on model optimization. However, the enhanced image still has missing edge details and color distortion, thereby reducing the accuracy of feature extraction and matching. In the methods based on deep learning, references [7,8] propose the Low-light Image Enhancement (LIME) algorithm and the Bio-Inspired Multi-Exposure Fusion (BIMEF) algorithm, respectively. Though these two algorithms greatly enhance the local features of low-illumination images, there are still artifacts in the enhanced images, thus reducing the accuracy of feature extraction.
The above image enhancement method improves the visual effect of low-illumination images to a certain extent and highlights the overall contour and local details of the image. However, the image enhanced using the above method still has quality degradation issues such as noise interference and color distortion. These issues reduce the precision of feature point extraction and matching, thus making it difficult to meet the objectives of visual positioning. Therefore, a Visual Localization with Multiple-Similarity Fusions (VLMSF) is proposed based on the Nonlinear Enhancement And Local Mean Filtering (NEALMF) preprocessing enhancement.
For how to determine the location information of the target in the frame building space under low-illumination conditions, the main contributions of this paper are shown in Figure 1:
As shown in Figure 1, the location information of the target is determined in two stages: offline and online. In the offline stage, the monocular vision camera (DJI Pocket 2 in DJI equipment) is used to collect images and the location information of the corresponding images is recorded, thus forming the low-illumination image database. The low-illumination image database includes two types of images: global low-brightness images and local low-brightness images. Then, NEALMF is used to preprocess the collected images, thus obtaining the degradation-suppressed image database. The feature description algorithm is then used to classify the global and local features of the degraded suppression image, thus generating the corresponding feature descriptors. Finally, the feature descriptors of the degraded suppression images are stored in pairs with the coordinates of the corresponding images, thus constructing the offline feature library. In the online phase, the user first uses the smartphone to take images in the selected frame building space. The captured images are then preprocessed using NEALMF to obtain the corresponding degradation-suppressed images. Then, the feature extraction algorithm is used to extract features from the degraded suppression image, thus forming feature descriptors. Finally, VLMSF is used to compare the generated feature descriptors with the image feature descriptors in the offline feature database, so as to obtain the most similar database image. The location information of this database image is the location information of the image taken by the user.
The main contributions of this paper can be summarized in two points:
(1)
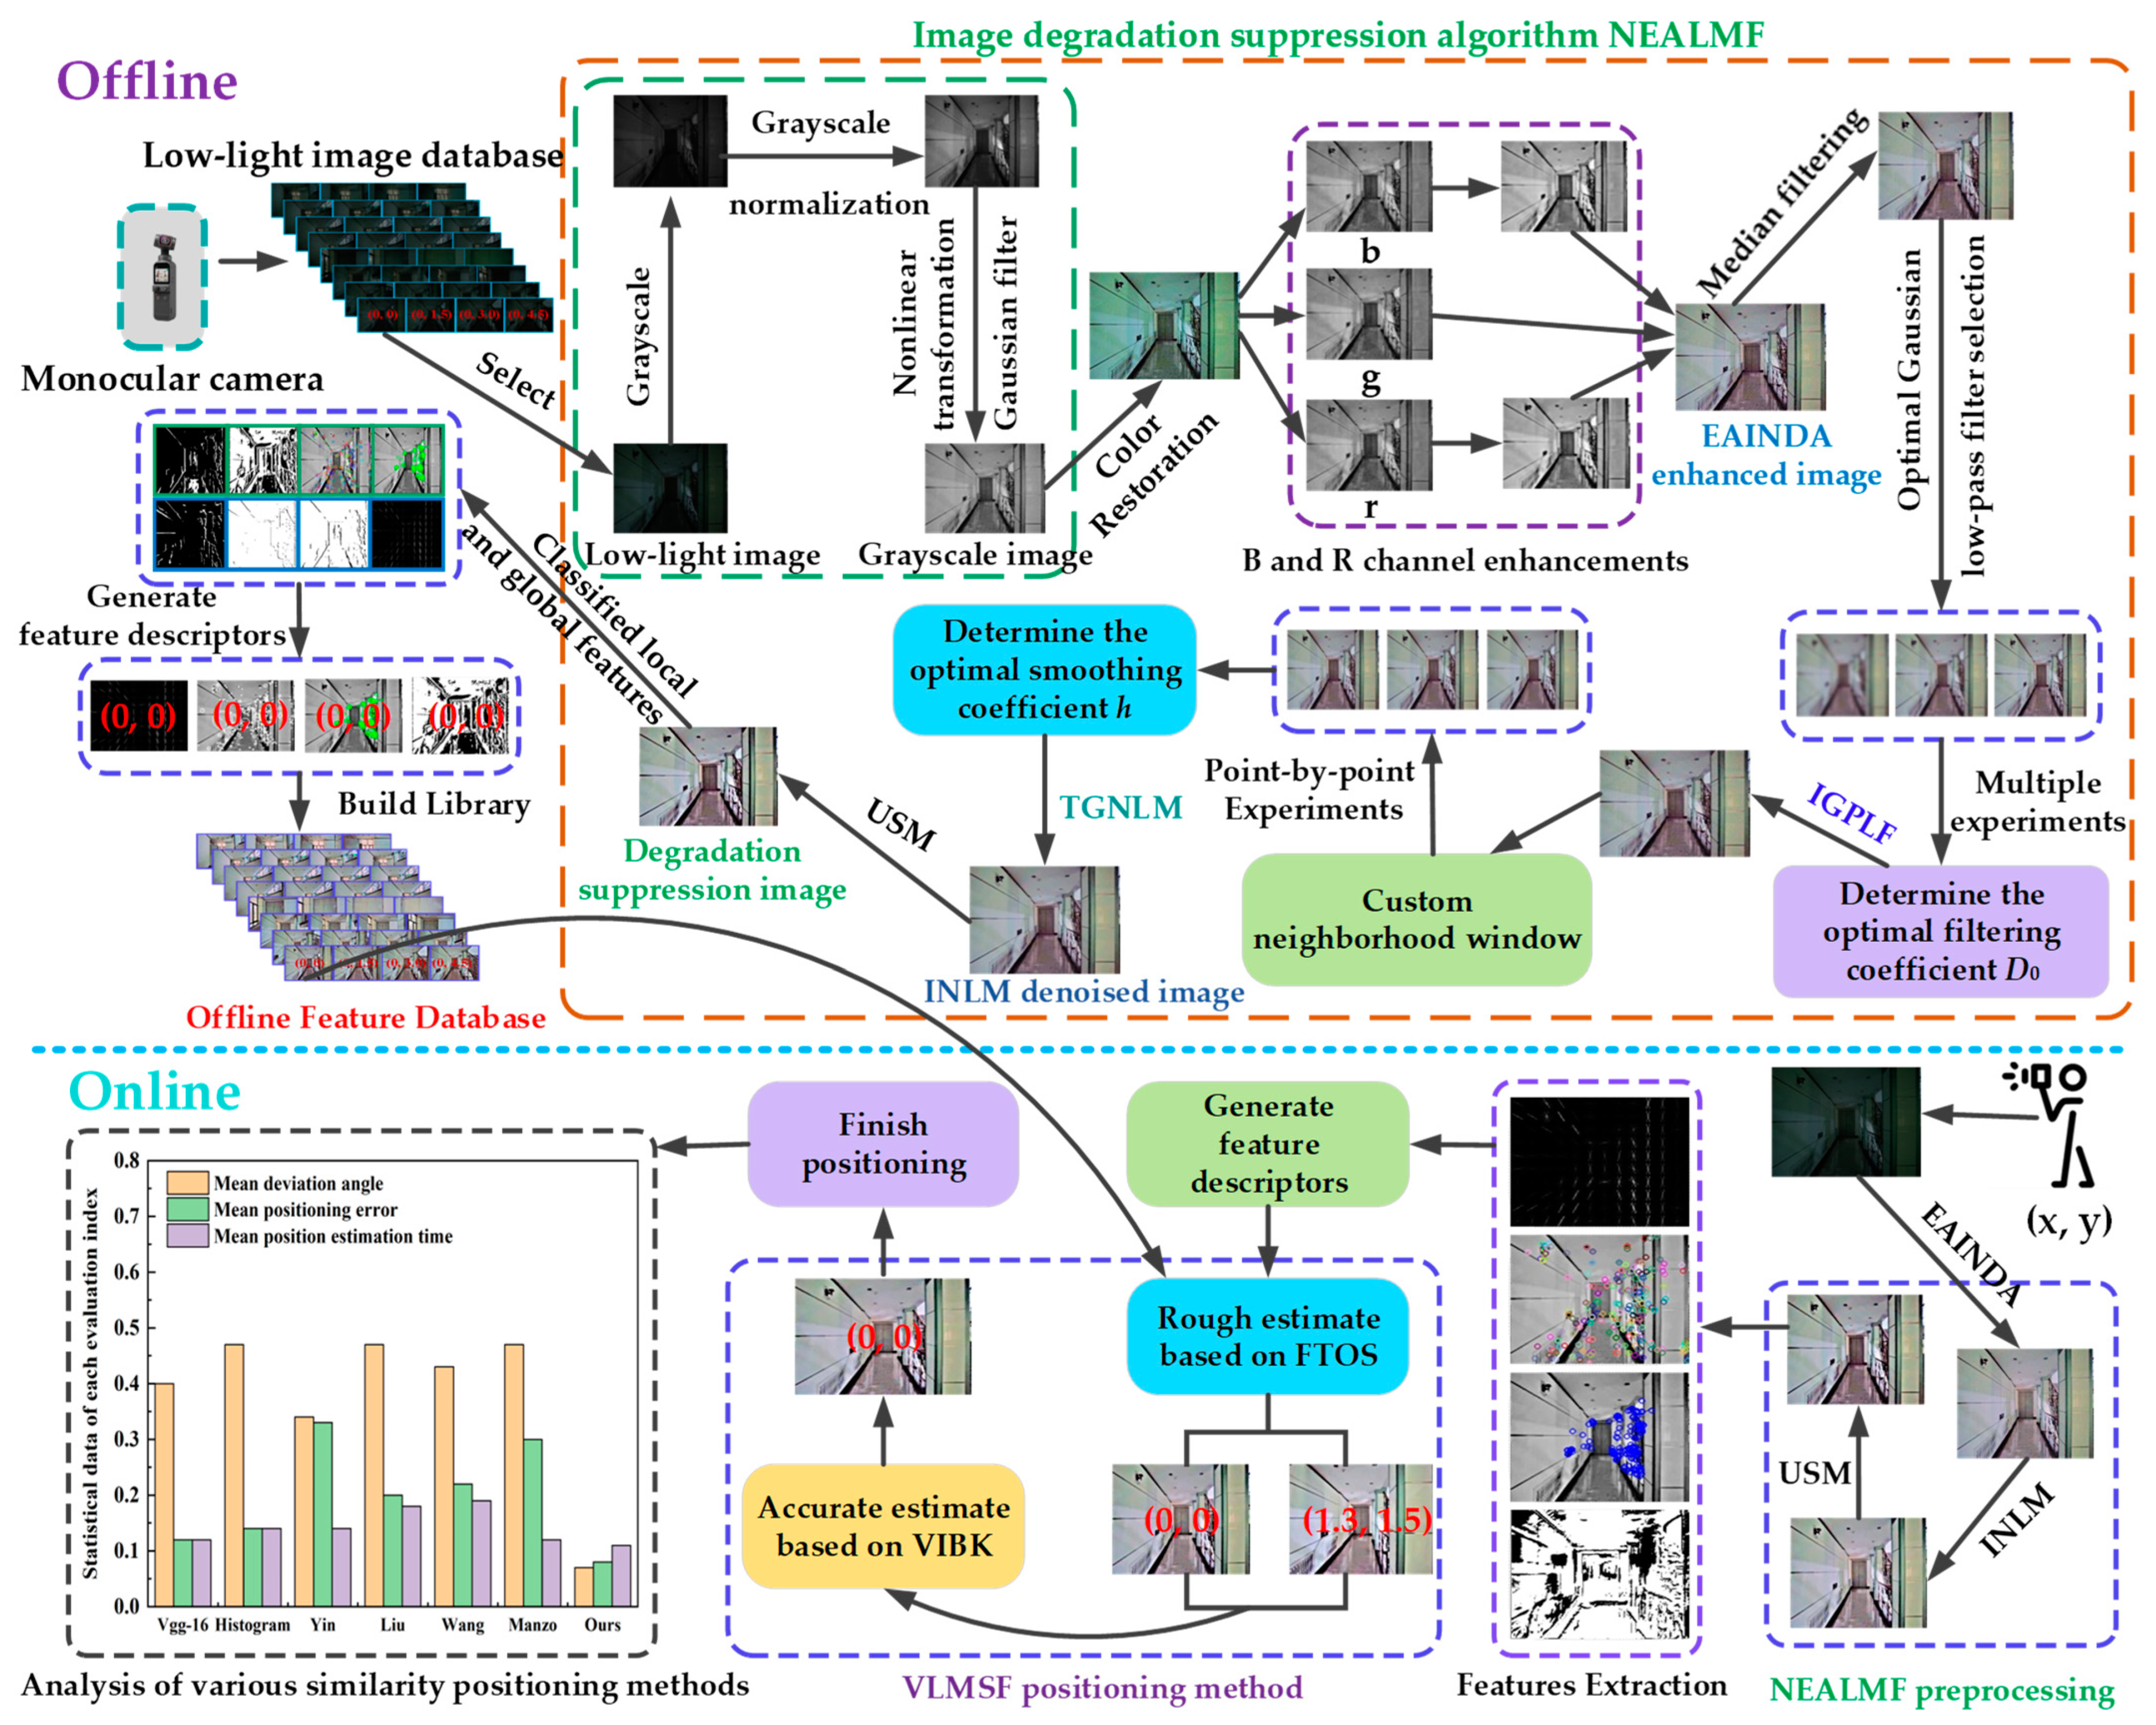
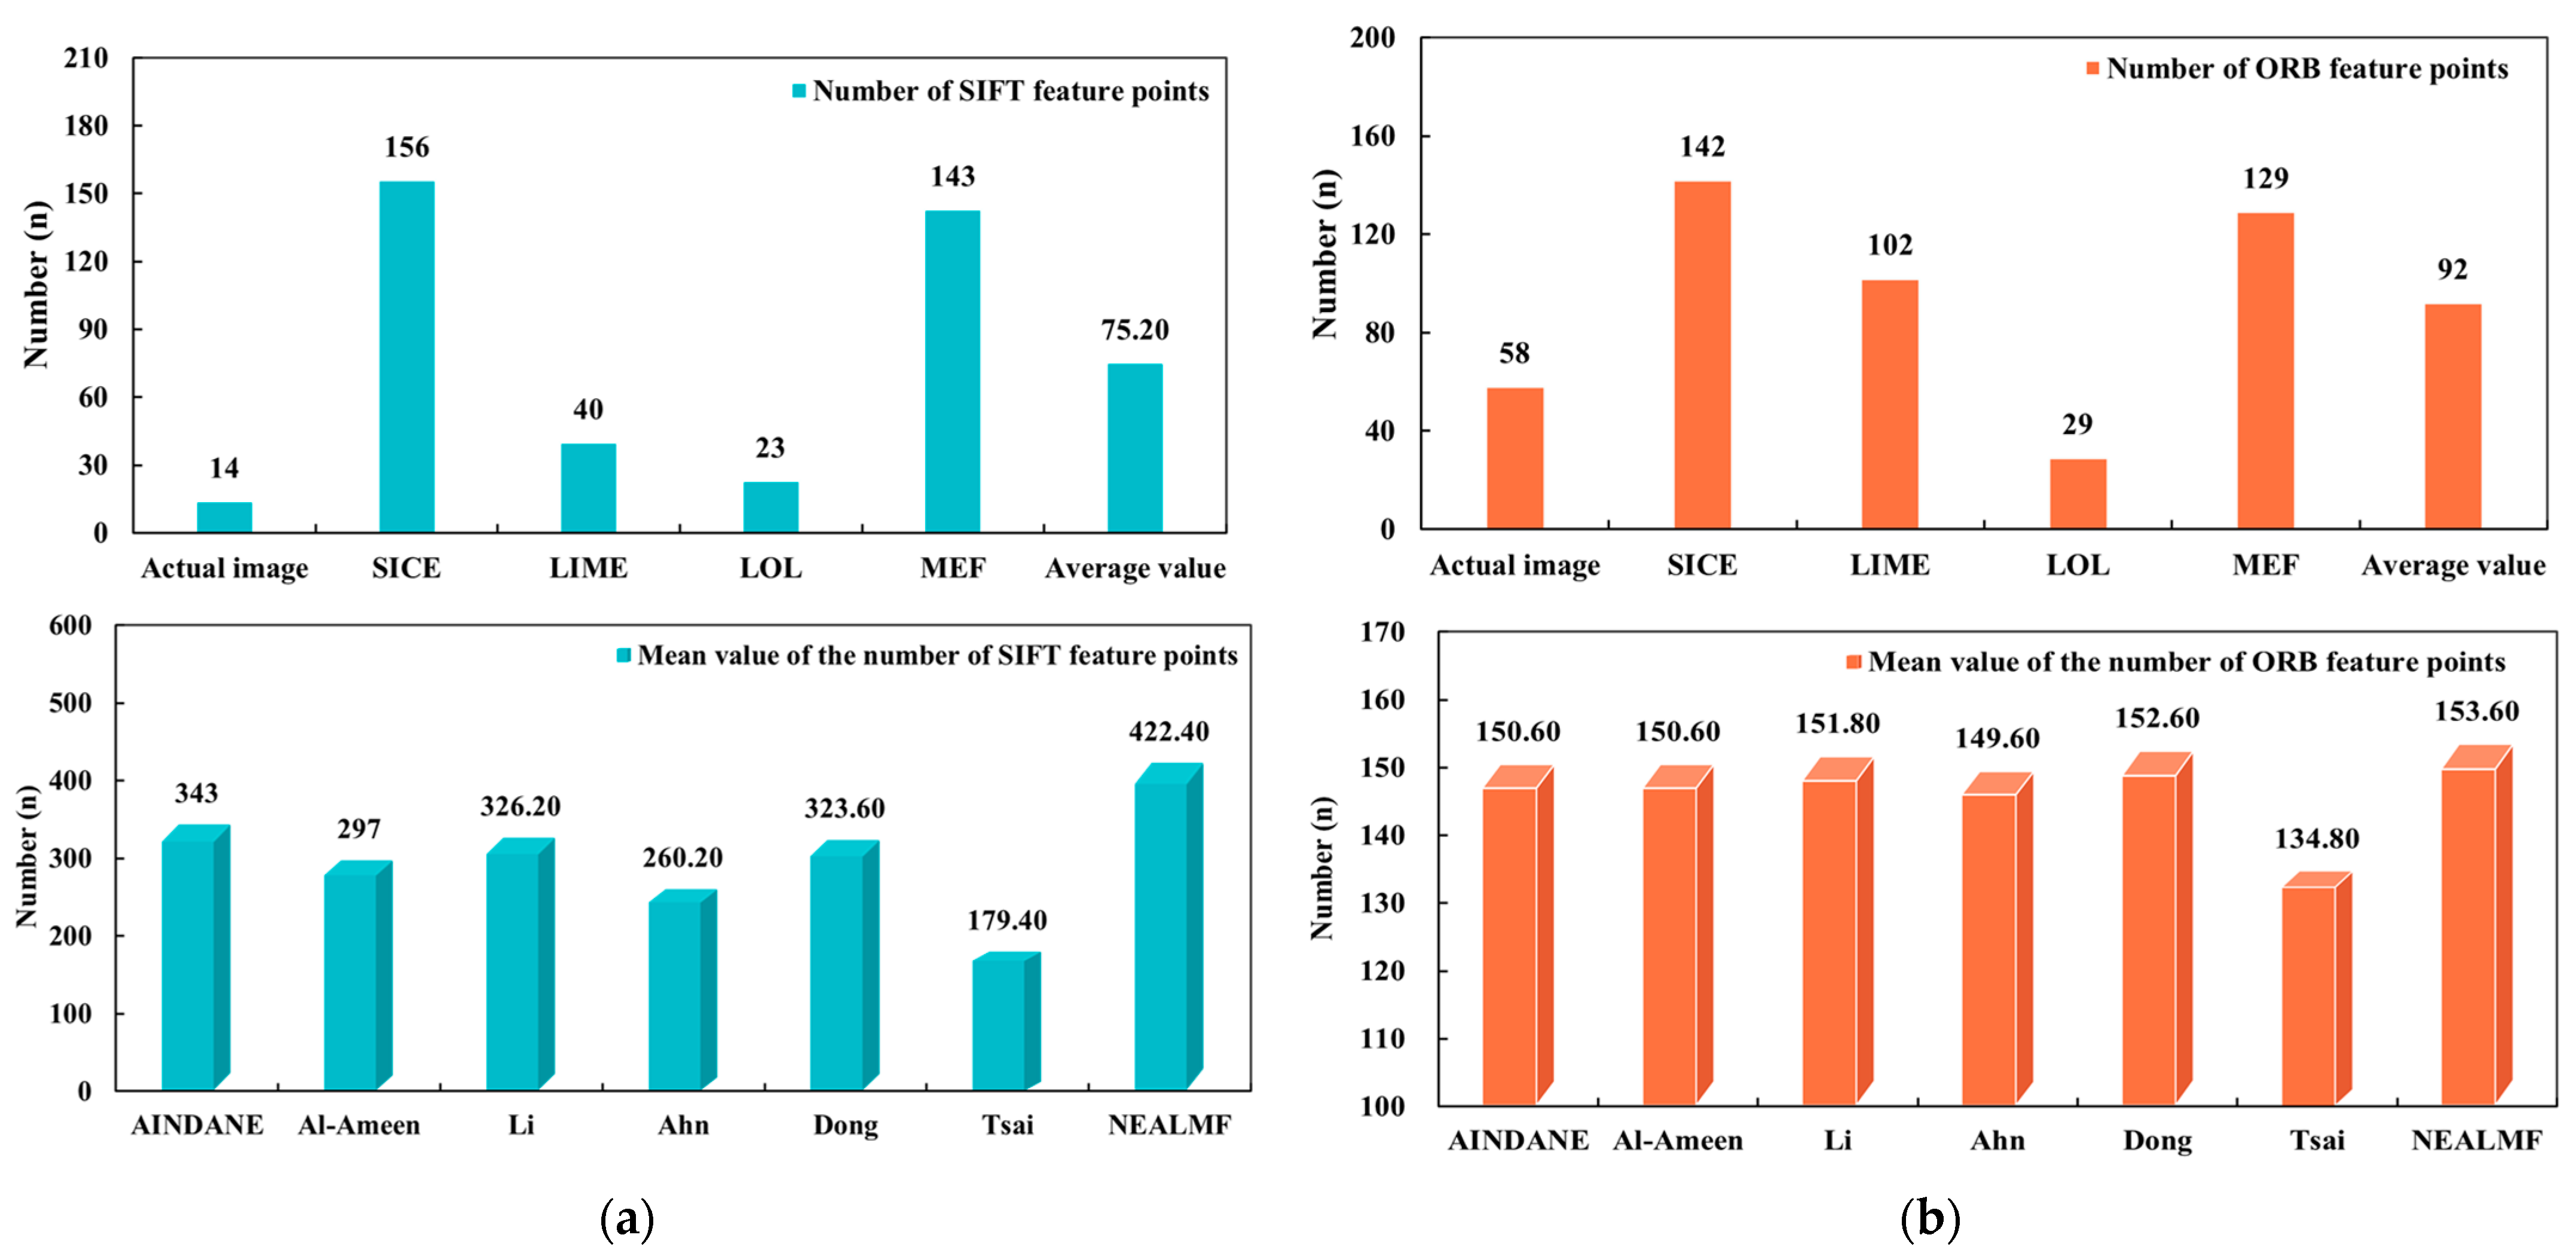
Aiming at the problem that localization accuracy is reduced or even unable to be located due to the local feature loss of images, the NEALMF image degradation suppression method is proposed, thus providing sufficient feature points for feature matching in visual localization by enhancing image quality.
(2)
To address the problem of poor localization accuracy caused by existing similarity retrieval methods, the VLMSF method is constructed, thereby accurately determining the location information of the target by improving the accuracy of feature matching.
The key points of the subsequent paper are outlined as follows. Section 2 covers the related works. Section 3 shows the simulation and analysis of the proposed image degradation suppression method (NEALMF). Section 4 presents the proposed visual localization method (VLMSF). Section 5 displays the simulation and analysis of the visual localization method (VLMSF). Section 6 discusses the application scope of the proposed method. Section 7 summarizes the proposed method.

2. Related Works

This section is divided into two parts, as follows: (1) existing image enhancement methods are discussed, which solve the problem of missing feature points by improving image quality, and (2) mainstream similarity calculation methods are discussed, which achieve the problem of accurate target localization by improving the matching accuracy of images.

2.1. Image Enhancement

Whether the location information of the target can be accurately determined depends on the quality of the visual data obtained in the frame building space. However, images acquired under low illumination conditions suffer from quality degradation, such as low brightness and low contrast, which obscure the local feature information in the images, thus preventing computer vision systems from recognizing and extracting them. As such, improving the quality of the acquired image before positioning is a challenging task. Li [9] and Ahn [10] improved the multi-scale Retinex algorithm [11] to enhance the brightness and contrast of low-illumination images. However, the enhanced image still has color distortion and halo phenomena, which reduce the accuracy of feature matching. Al-Aminen [12] enhanced low-illumination images by improving the LIP algorithm [13], thus highlighting the local features of the images and improving the brightness of the images. However, the local brightness of the enhanced image is excessively enhanced, which reduces the accuracy of feature matching. Dong [14] and Tsai [15] proposed the dark channel dehazing algorithm and the adaptive power-law transform algorithm, respectively. These two algorithms solve the problem of missing local features in low-illumination images. However, there is still noise interference in the enhanced image, which reduces the accuracy of feature matching. Considering these problems, this paper proposes NEALMF in order to solve the difficult problem of feature point extraction in visual localization.

2.2. Visual Localization Based on Image Retrieval

At present, the mainstream visual localization methods are divided into direct 2D-3D matching methods [16,17], image retrieval methods [18], and learning-based regression methods [19]. However, the direct 2D-3D matching method is susceptible to changes in light and angle, while the learning-based regression method requires a large amount of data and extensive computation. When compared to these two visual localization approaches, the image retrieval method offers better scalability, faster speed, and is more resistant to environmental changes. As a result, image retrieval methods are commonly used for visual localization in complex settings. In visual localization methods based on image retrieval, the localization of targets is ultimately translated into the matching of target images, while image retrieval is the key technology for image matching. Therefore, the accuracy of visual positioning depends on the accuracy of image retrieval. The visual localization method based on image retrieval extracts features from the database images. Therefore, the localization performance is closely related to the feature extraction, feature selection, and similarity metric of the matched images. Among them, feature extraction and selection are the most important factors in characterizing the semantic content of images. These features can be divided into global features and local features. The former describes the features of the whole image, such as color, texture, and shape. The latter describes the features of the local part of the image, such as edges, corners, and lines. When using the above low-level features for image retrieval, however, the retrieval accuracy is poor. In addition, these low-level features cannot adequately describe the rich semantic information in the images, thus increasing the error rate of image retrieval. On the other hand, the deep learning-based image retrieval method extracts the image’s high-level semantic information through the neural network algorithm, which can obtain more accurate retrieval precision. As a result, when using image retrieval based on deep learning to complete visual positioning, the positioning accuracy is higher. However, the accuracy of visual localization methods based on image retrieval is dependent on the extracted image characteristics and the image similarity calculation approach. Therefore, selecting the appropriate similarity for image retrieval is a key step in visual localization. The existing image similarity calculation formulas include histogram distance, perceptual hash algorithm, average hash algorithm, difference hash algorithm, and so on. However, the accuracy of image retrieval based on the above similarity is poor, which leads to poor localization accuracy. Alternative similarity methods include perceptual hash (Phash) similarity-based localization methods [20], grayscale histogram similarity-based localization methods, and image similarity-based K-Nearest-Neighbors (KNN) algorithms [21]. Due to the poor accuracy of the existing similarity retrieval methods, it is impossible to achieve accurate visual positioning. Therefore, this paper proposes a Visual Localization with Multiple-Similarity Fusions (VLMSF) method based on image retrieval. This method combines the low-level features of the image with the high-level features to improve the accuracy of feature matching, thus precisely estimating the position information of the target.

3. Framework of the Proposed Method NEALMF

This section describes the image degradation suppression method NEALMF in detail and simulates and analyzes the method.
Aiming at the problem that the degradation of low-illumination image quality leads to the difficulty of extracting visual positioning feature points, the NEALMF method proposed in this paper is divided into three parts: (1) by proposing the Enhanced An Integrated Neighborhood Dependent Approach (EAINDA) method and an Improved Non-Local Mean filter (INLM), the problem of serious loss of feature points is solved; (2) considering the problem of blurred image texture and edge details, the UnSharp Masking (USM) algorithm is used to obtain higher-quality visual data. The specific content of the image degradation suppression algorithm NEALMF is as follows.

3.1. Low-Illumination Image Enhancement Based on the EAINDA

For the problems of missing local features and color distortion in low-illumination images, this paper proposes the EAINDA method based on AINDANE [22], thus enhancing the local feature information in images and solving the color distortion problem. The specific steps of the EAINDA method are as follows:
First, a color image Ld in the RGB color space is converted to a grayscale image H. At the same time, Equation (1) is used to normalize the gray image H to obtain Nd and Equation (2) is used to transform the normalized image, thus obtaining the brightness-enhanced image Ned.
N d   ( y ) = H ( y ) M i n M a x M i n ,
where y represents any pixel in the image. Nd(y) represents the pixel value after normalization and H(y) represents the pixel value before normalization. Max and Min are the maximum and minimum values of gray in image H, respectively.
N e d = ( N d 0.24 + 1 N d ) × 0.5 + N d 2 2 ,
After the processing of Equation (2), the brightness of the dark region in the image Nd is improved to a certain extent, and the brightness of the bright region is kept unchanged.
Second, 2D discrete convolution on the grayscale image H(x, y) is performed by using the Gaussian function G(x, y), which is expressed is:
G   ( x ,   y ) = K × e x 2 + y 2 c 2 ,
where K is determined by Equation (4):
K × e x 2 + y 2 c 2 d x d y = 1 ,
C is the scale of the Gaussian function. The convolution can be expressed as:
F   ( x ,   y ) = H ( x , y ) G ( x , y ) ,
where (x, y) represents the coordinates of any pixel. Through two-dimensional Gaussian convolution of the gray picture H(x, y), the blurred image F(x, y) is produced. The convolution nuclei C of G(x, y) are 5, 20, and 240, respectively. After Equation (5) transforms the gray image H(x, y), three blurred images F(x, y) with different convolutions can be generated.
The contrast enhancement coefficient I is obtained by using Equation (6).
I x , y = 255 × N e d ( x , y ) i ( x , y ) ,
where (x, y) represents the coordinates of any pixel in the image. The index i ( x , y ) = F ( x , y ) /   H ( x , y ) .
In order to obtain the best image enhancement effect, multiple convolution results from three different scales are used for contrast enhancement. The final output is a linear combination of contrast enhancement results based on multiple scales, which can be expressed by Equation (7):
I ( x , y ) = i W i × I i ( x , y ) ,
where i = 1, 2, and 3 represent different scales and Wi is the weighting factor for each contrast enhancement result Ii(x, y). Studies have shown that when Wi = 1/3 (i = 1, 2, 3), it can be widely used in low-illumination image enhancement, and the operation is simple.
Then, based on the enhanced gray image I(x, y), the enhanced color image C j x ,   y is obtained through the linear color restoration process of Equation (8).
C j ( x , y ) = I ( x , y ) × H j ( x , y ) H ( x ,   y ) ,
where, j = r, g, and b represent the r, g, and b color channels, respectively. Meanwhile, Cr, Cg, and Cb are the enhanced RGB values of the enhanced color image.
Finally, the color image C j x ,   y is corrected by Equation (9) in order to obtain a more “real” color image Z(x, y).
Z i x , y = δ   C i 2 x ,   y + γ   C i x ,   y ,
where, i = r and b represent the r and b color channels, respectively. δ and γ are the correction coefficients of channel R. At the same time, δ and γ are also the correction coefficients of the B channel. Furthermore, Equation (9) needs to satisfy the conditions of Equations (10) and (11) [23].
x = 1 M y = 1 N Z i ( x ,   y ) = x = 1 M y = 1 N C g ( x ,   y ) ,
max x , y Z i ( x ,   y ) = max x , y C g ( x ,   y ) ,
Equation (9) is substituted into Equations (10) and (11), respectively, thereby obtaining Equations (12) and (13).
δ   x = 1 M y = 1 N C i 2 ( x , y ) + γ   x = 1 M y = 1 N C i ( x , y ) = x = 1 M y = 1 N C g x , y ,
δ max x , y { C i 2 ( x ,   y ) } + γ   max x , y { C i ( x ,   y ) } = max x , y C g ( x ,   y ) ,
For the convenience of calculation, Equations (12) and (13) are rewritten into matrix form, as shown in Equation (14):
C i 2 x ,   y C i x ,   y max C i 2 x ,   y m a x C i x ,   y   δ γ = C g x ,   y m a x C g x ,   y ,
where (x, y) represents the coordinates of image pixels. The correction coefficients δ and γ of the channel can be obtained by using Equation (14). The color correction coefficients δ and γ are used to correct the color of R channel and B channel pixel by pixel, respectively. At the same time, channel G remains unchanged. The enhanced R, B, and G channels are merged to obtain the corrected image Z(x, y).

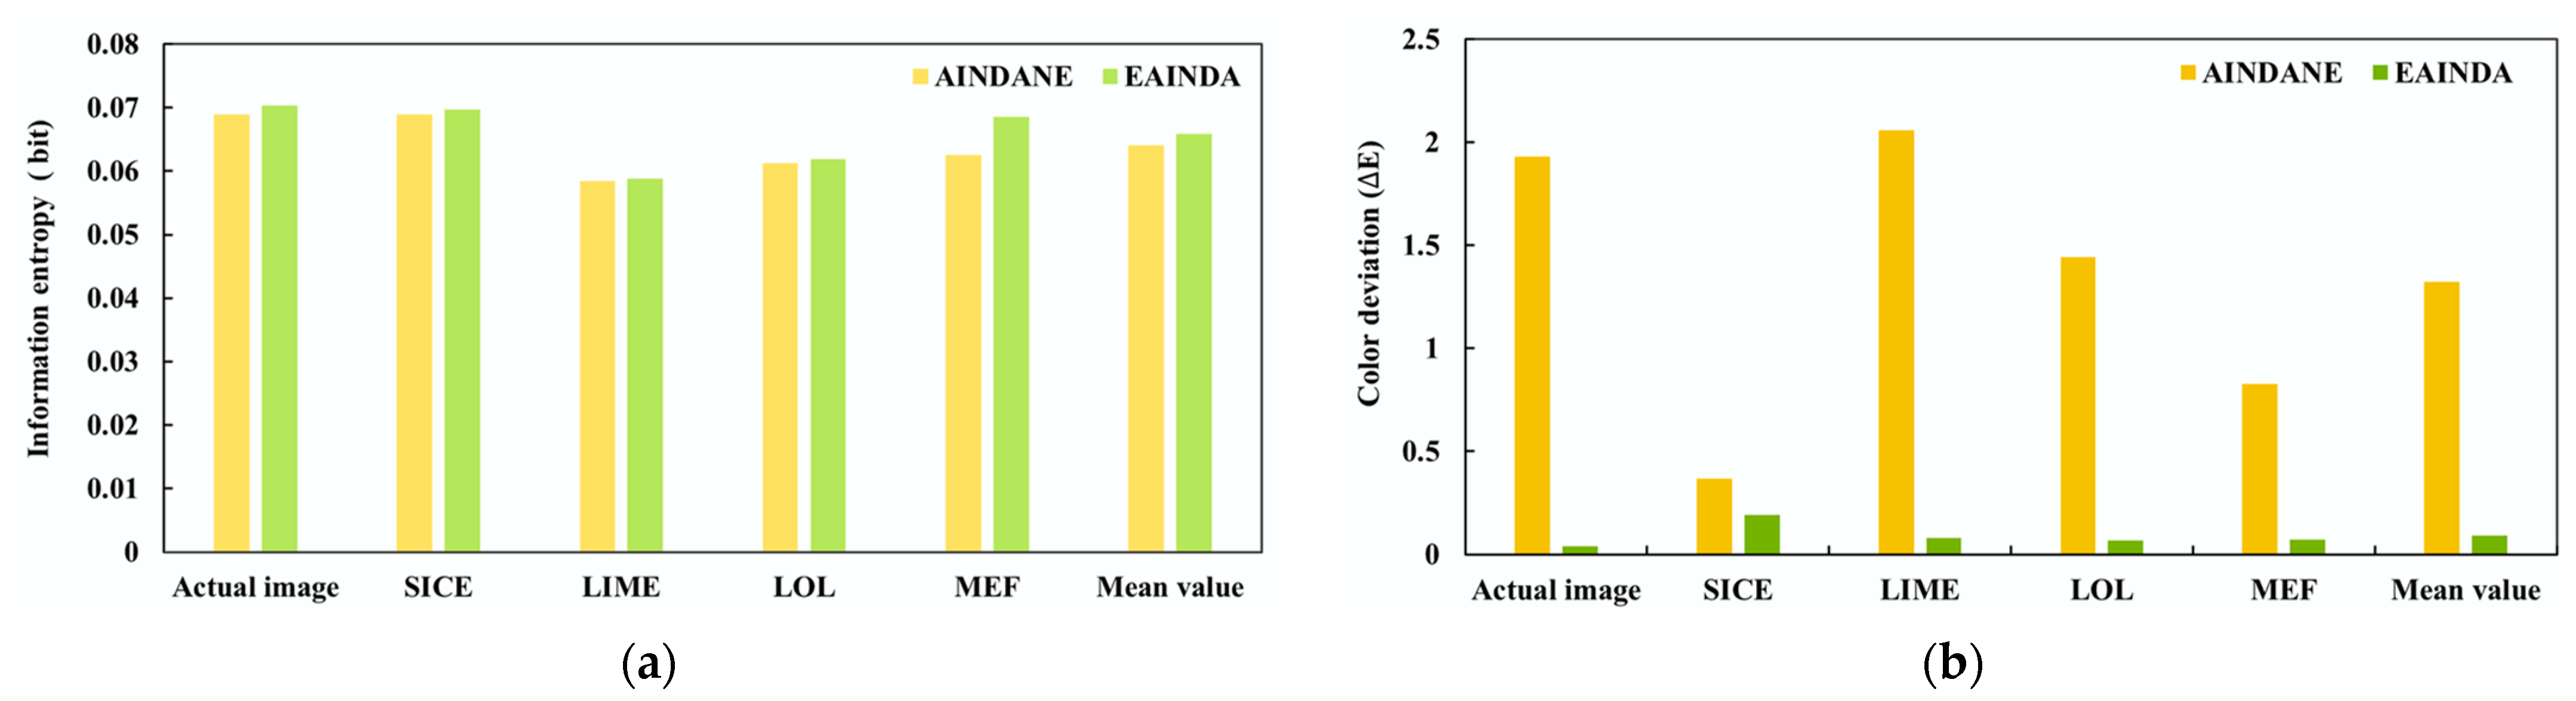
3.2. Experiment and Result Analysis of the EAINDA Method

In order to scientifically evaluate the image enhancement effect of the AINDANE and EAINDA algorithms, information entropy and color deviation are introduced as evaluation indexes. Five images are selected from different low-illumination datasets and the selected images are processed by AINDANE and EAINDA. The image enhancement effect of the two algorithms is shown in Table 1, and the comparison result of the evaluation index is shown in Figure 2.
From Table 1, when compared with AINDANE-enhanced images, EAINDA-enhanced images have moderate brightness, more detailed information, and more “normal” colors.
From Figure 2, when compared with the AINDANE algorithm, the images processed by the EAINDA algorithm have higher average information entropy, thus they contain more detailed information. At the same time, the color bias value is smaller, indicating that the color is closer to the “real” image. Therefore, the EAINDA method solves the problem of image detail information loss and color distortion to a certain extent.

3.3. Low-Illumination Image Denoising Based on INLM

When enhancing the quality of low-illumination images, EAINDA also enhances noise interference, thereby increasing the probability of mismatching and reducing the positioning accuracy of the target. Therefore, it is necessary to denoise the EAINDA-enhanced image. At present, Non-Local Mean filtering (NLM) [24] and 3D Block Matching filtering (BM3D) [25] are mainly adopted for image denoising. The former is denoised by calculating similarity weight in pixel neighborhood space. However, the noise in the image interferes with the accuracy of the similarity weight, thus resulting in detail blur and artifacts in the de-noised image. The image processed by the latter can easily cause it to lose edge texture information. In order to balance the relationship between denoising effect and detail loss, the Improved Non-Local Mean filtering (INLM) quadratic denoising method is proposed based on the NLM algorithm, which is composed of the Improved Gaussian Low-Pass Filter (IGLPF) and the Ti Gao Non-Local Mean filtering (TGNLM). The details of the INLM algorithm are as follows:

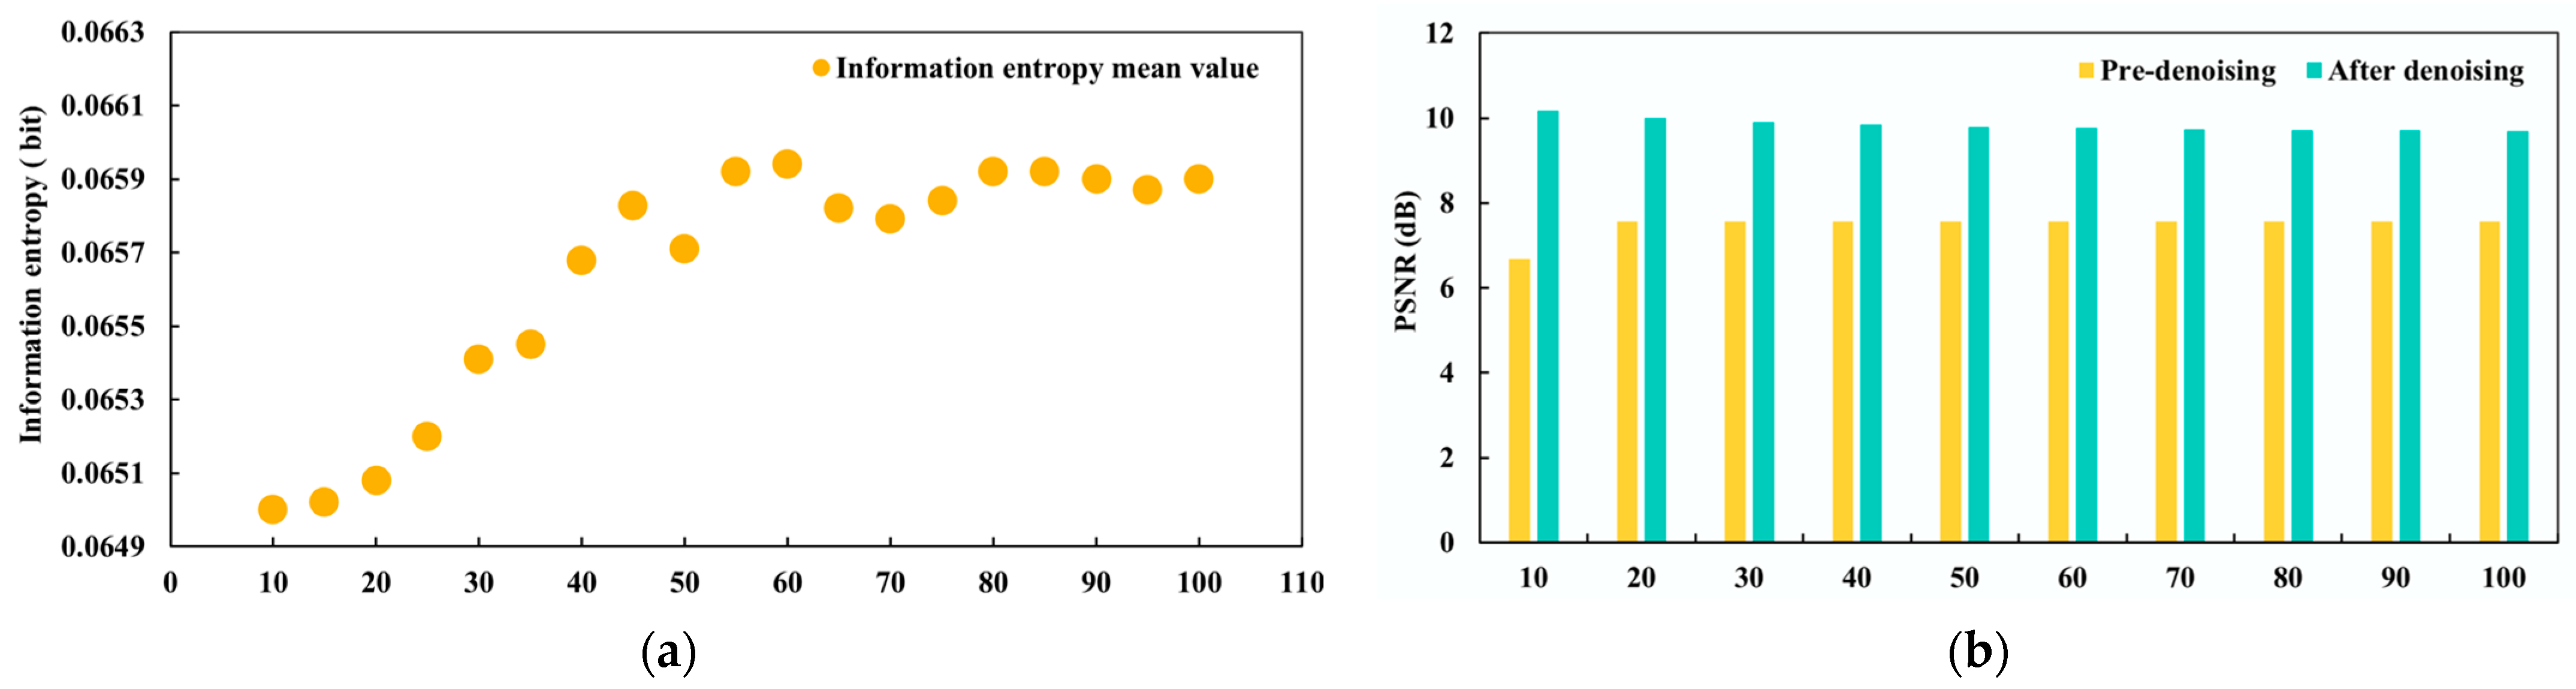
3.3.1. Primary Denoising Based on IGLPF

Under low illumination conditions, the acquired image contains Gaussian and Poisson noise. In the image frequency domain, noise belongs to the high frequency range. Therefore, the frequency-domain low-pass filter can reduce the influence of noise. Frequency domain low-pass filters are divided into ideal low-pass filters, Butterworth low-pass filters, and Gaussian low-pass filters. The image processed by the first two low-pass filters has the phenomenon of detail blurring and “ringing”. The latter has a better denoising effect, but its denoising effect is limited by the filtering parameter D0. Therefore, this paper proposes the IGLPF method based on the Gaussian low-pass filter. The details of the IGLPF are as follows:
The function of Gaussian Low-Pass Filter (GLPF) is:
H ( u , v ) = e D 2 ( u ,   v ) / 2 D 0 2 ,
where D0 is the cut-off frequency. The larger the D0, the better the denoising effect, but the less detailed the information. D(u,v) is the distance to the center of the frequency rectangle.
When the D0 value is lower, the valid information in the image is removed as noise. In order to construct the IGLPF method suitable for processing low illumination images, this paper approximates the optimal filtering parameter D0 through several experiments. The specific experimental steps are as follows: first, 20 images are randomly selected from different low-illumination datasets for the experiment, and the selected images are enhanced by using EAINDA. Then, D0 is valued at intervals of 5 in the range of 10–100, thus forming the corresponding Gaussian low-pass filter. Finally, these filters are used to process the EAINDA-enhanced image.
In the primary denoising stage, information entropy and Peak Signal-to-Noise Ratio (PSNR) are introduced as the evaluation indexes of denoising. For Gaussian low-pass filters composed of different filtering parameters D0, the corresponding information entropy and PSNR of the denoised images are shown in Figure 3a,b, respectively.
When D0 is 60, the average information entropy of the image is the highest and the PSNR value is also large, which means that the image contains the most information and the noise interference is smaller. In the primary denoising, this paper selects D0 = 60 to construct the IGLPF method.

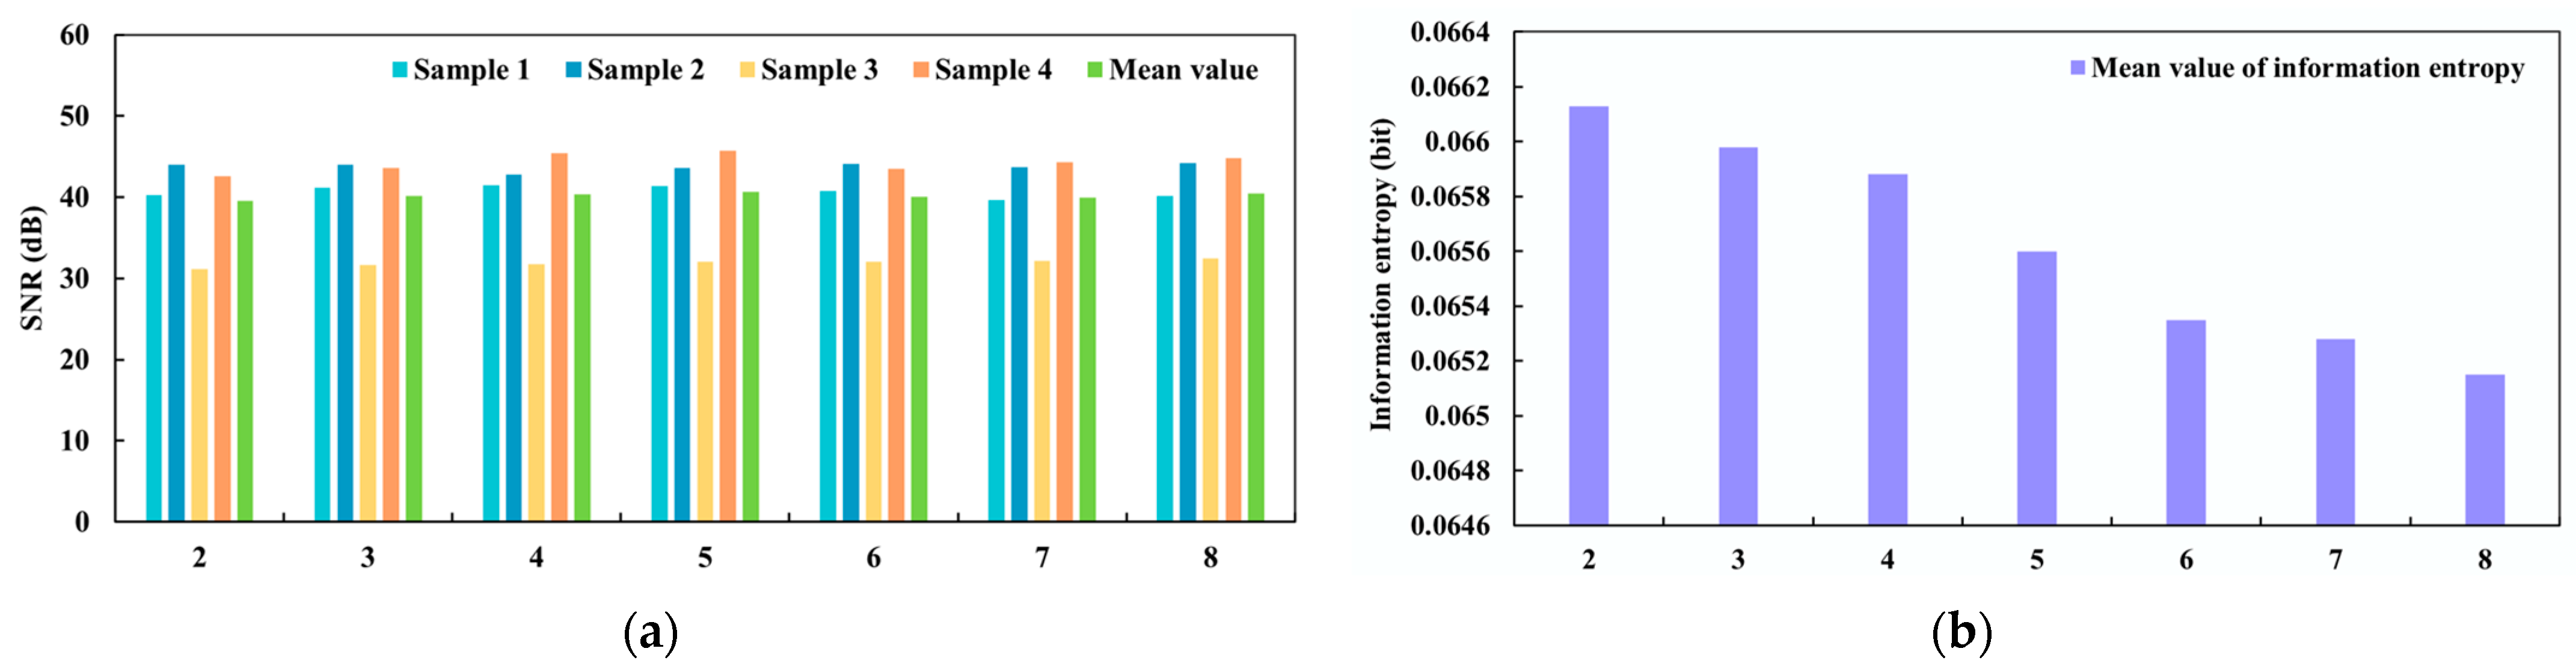
3.3.2. Secondary Denoising Based on TGNLM

As can be seen from Figure 3b, residual noise still exists in the image after IGPLF processing. In order to further remove the residual noise in the image and maintain the integrity of the structural information, this paper constructs TGNLM on the basis of NLM in the secondary denoising stage. The details of TGNLM are as follows:
Let the IGLPF denoised image be v and the TGNLM denoised image be u.
v = { v x | x I } ,
I denotes the coordinate domain of the image v. For one of the pixels x, the weighted average of the remaining pixels in the image is calculated using NLM, and then the estimated value of that pixel point is calculated.
u ( x ) = y   Ω W x ,   y × v y ,
where weight W(x, y) in the formula is obtained by the similarity between the pixel x and the pixel y, and the conditions 0 ≤ W(x, y) ≤ 1 and y W x , y = 1 are satisfied.
W ( x , y ) = e x p   | | N x N y | | 2 ,   a 2 h 2 Z x
The similarity between pixel x and pixel y is determined by the similarity of their gray value vectors N(x) and N(y). N(x), N(y) denote the neighborhood matrices with pixel x and y as centers, respectively. The similarity between the two is measured by the Gaussian-weighted Euclidean distance N ( x ) N ( y ) 2 ,   a 2 . a > 0 is the standard deviation of the Gaussian kernel.
The smaller the Euclidean distance, the more similar the gray value vectors of the neighborhood, and the greater the weight obtained by the corresponding pixels in the weighted average. The weight is defined as follows:
Z x = y e x p | | N x N y | | 2 ,   a 2 h 2 ,
where Z(x) is the sum of all weights and a normalized factor. h is the coefficient that controls the denoising degree. The h is larger, and the denoising degree is higher, but the image is more blurred. The experiment to determine the smoothing coefficient h is as follows.
In order to balance the relationship between the de-noising effect and detail information, this paper approximates the optimal smoothing parameter h by point-by-point experiment. The specific steps are as follows: first, four images are randomly selected among the actual images. Then, h is valued at intervals of 1 in the interval of 2–8, thus forming the corresponding NLM method. Finally, these NLM methods are used to process the IGLPF denoised image. In order to objectively evaluate the denoising effect of NLM methods composed of different h, Signal-to-Noise Ratio (SNR) and information entropy are introduced as evaluation indexes. The results of the two evaluation indicators are shown in Figure 4a,b, respectively:
When h = 3, 4, 5, or 8, the SNR of the image is larger, and the noise is smaller. When h = 3, the information entropy of the image is higher, second only to the information entropy when h = 2. The larger the h, the more blurred the image. Therefore, h = 3 is selected to form the TGNLM method in the secondary denoising stage. Combining the analysis results of Figure 3 and Figure 4, the parameters of the INLM denoising algorithm are D0 = 60 and h = 3.

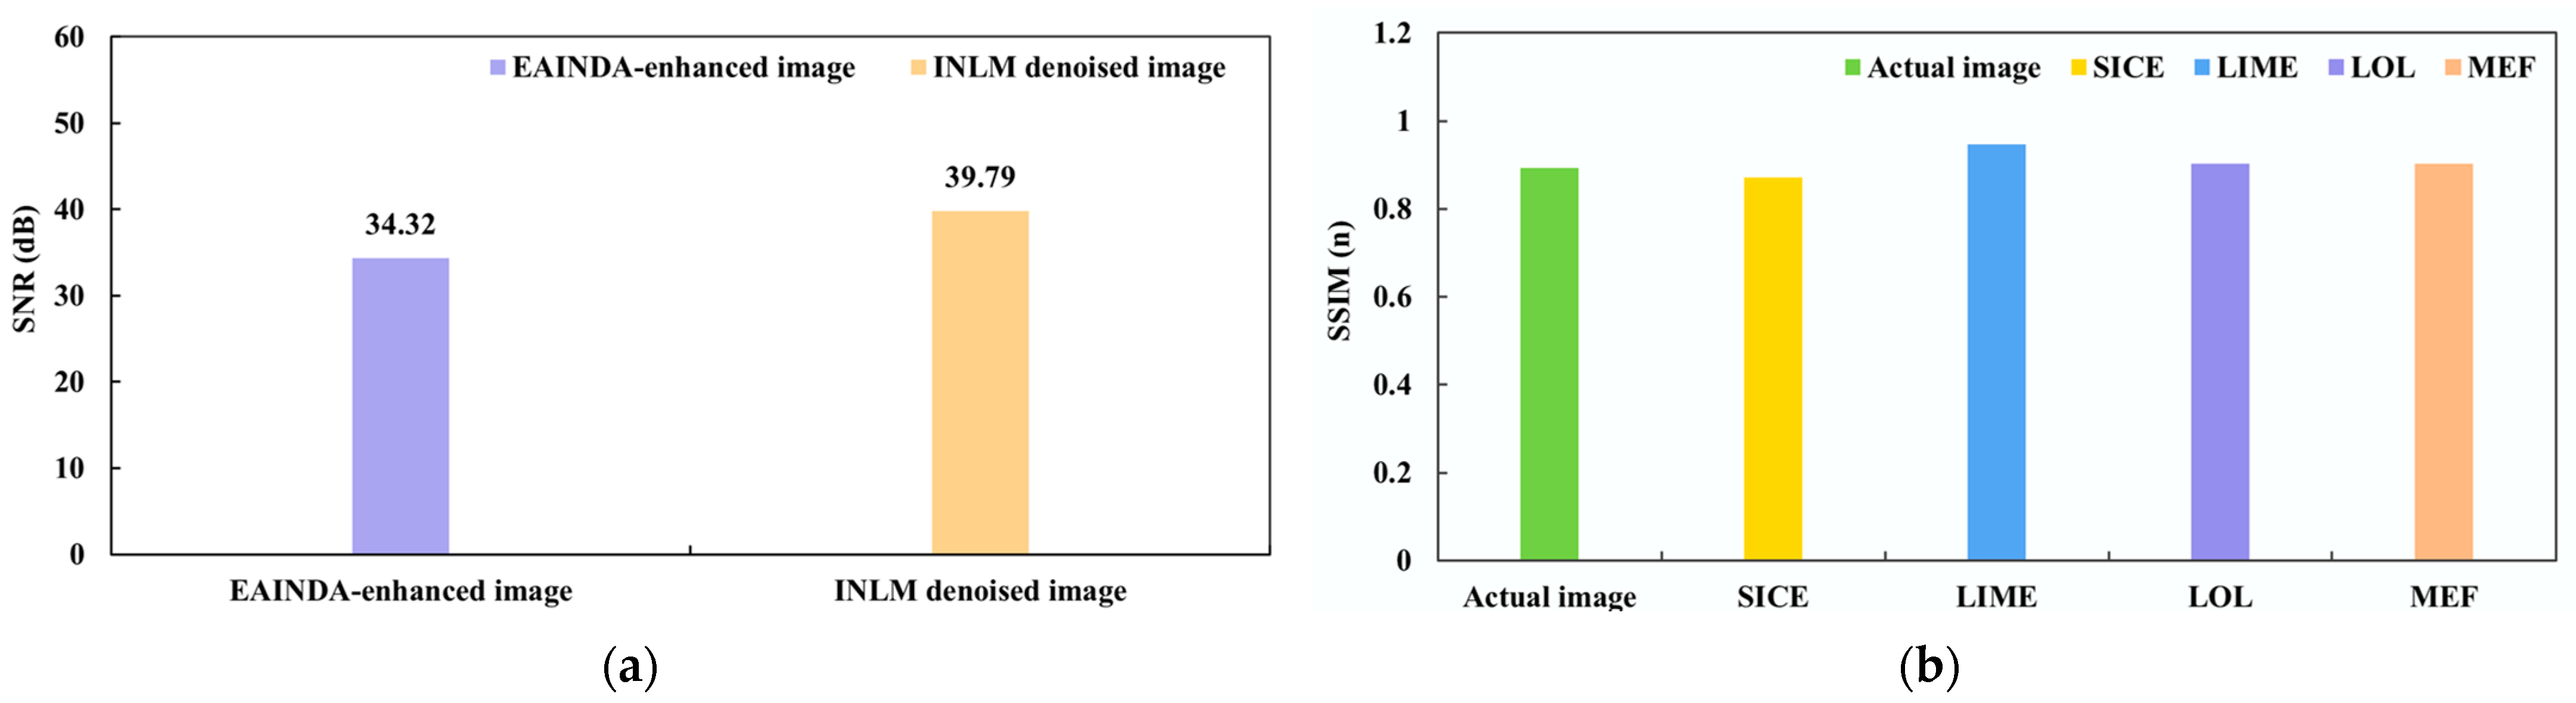
3.3.3. Evaluation of Denoising Effect Based on INLM

In order to scientifically evaluate the denoising effect of INLM, SNR and Structural Similarity Image Measurement (SSIM) are introduced as evaluation indexes. The steps are as follows: first, five images are randomly selected from different low-illumination datasets, and the selected images are enhanced by using EAINDA. Then, INLM is used to denoise the enhanced image. For EAINDA-enhanced images, the evaluation metrics after denoising are shown in Figure 5.
After INLM processing, the image SNR increases, and the average SNR increases by 15.94%. Meanwhile, the SSIM value of the denoised image is close to 1. Therefore, the INLM method still retains the structural information of the original image after denoising, which makes up for the shortcomings of the existing denoising algorithms to a certain extent.

3.4. Sharpness Enhancement Based on Unsharp Mask

The clarity of the image depends on the amount of high-frequency information. However, the small amount of edge detail will be treated as noise and removed in the process of denoising, thus resulting in a blurred image. Therefore, this paper uses the USM algorithm to sharpen the denoised image, so as to further improve the clarity and visual effect of the image. The specific steps of the USM algorithm are as follows:
First, low-pass filtering is used to process the INLM denoised image. Then, the difference between the processed image and the INLM denoised image is calculated point by point. Finally, the result of the difference calculation is multiplied by a correction factor k and added to the image denoised by INLM, thus obtaining the NEALMF degradation suppression image. The mathematical expression of USM is shown in Equation (20).
g x , y = f ( x , y ) + k { f ( x , y ) L i   x , y }
where g ( x , y ) represents the sharpened image, f ( x , y ) represents the INLM-denoised, Li is the low-pass filter, and k is the gain coefficient.
In order to compare the sharpness of the images after USM sharpening, variance is introduced as an objective evaluation index. First, five images are randomly selected from different low-illumination datasets, and EAINDA is used to enhance the selected images. Then, the EAINDA-enhanced image is denoised using INLM. Finally, the USM is used to sharpen the INLM denoised image. After USM sharpening, the clarity of INLM denoised images is shown in Table 2.
As can be seen from Table 2, the variance of the sharpened image becomes larger, and the average variance value increases by 20.92%. Therefore, USM improves the clarity of the denoised image to a certain extent.

3.5. Experiment and Result Analysis of NEALMF Method

In visual positioning, whether the location information of the target can be accurately determined depends on the accuracy of image matching. However, the accuracy of feature matching depends on the number of feature points carrying image information. Therefore, the accuracy of the target location depends on the number of feature points in the image.
In order to verify the scientificity and effectiveness of NEALMF, SIFT, and ORB local feature points are introduced as objective evaluation indicators. First, five images are randomly selected from different low-illumination datasets. Then, the seven methods shown in Table 3 are used to enhance the selected images. After processing by different algorithms, the visualization effect of low-illumination images is shown in Table 3, and the evaluation index of image enhancement effects is shown in Figure 6.
From a subjective point of view, when compared with the other six algorithms, the low-illumination images processed by the NEALMF algorithm have moderate brightness, richer local details, and more “real” colors.
From an objective point of view, when compared with the images enhanced by the other six algorithms, the NEALMF-enhanced image has the largest number of feature points extracted. Compared with low-illumination images, the average number of SIFT feature points in NEALMF-enhanced images increased by 4.62 times, and the average number of ORB feature points increased by 66.96%.
Experiments show that the NEALMF method improves the quality of low-illumination images through four aspects: local feature enhancement, color correction, denoising, and sharpening, thus providing better visual data for visual positioning.

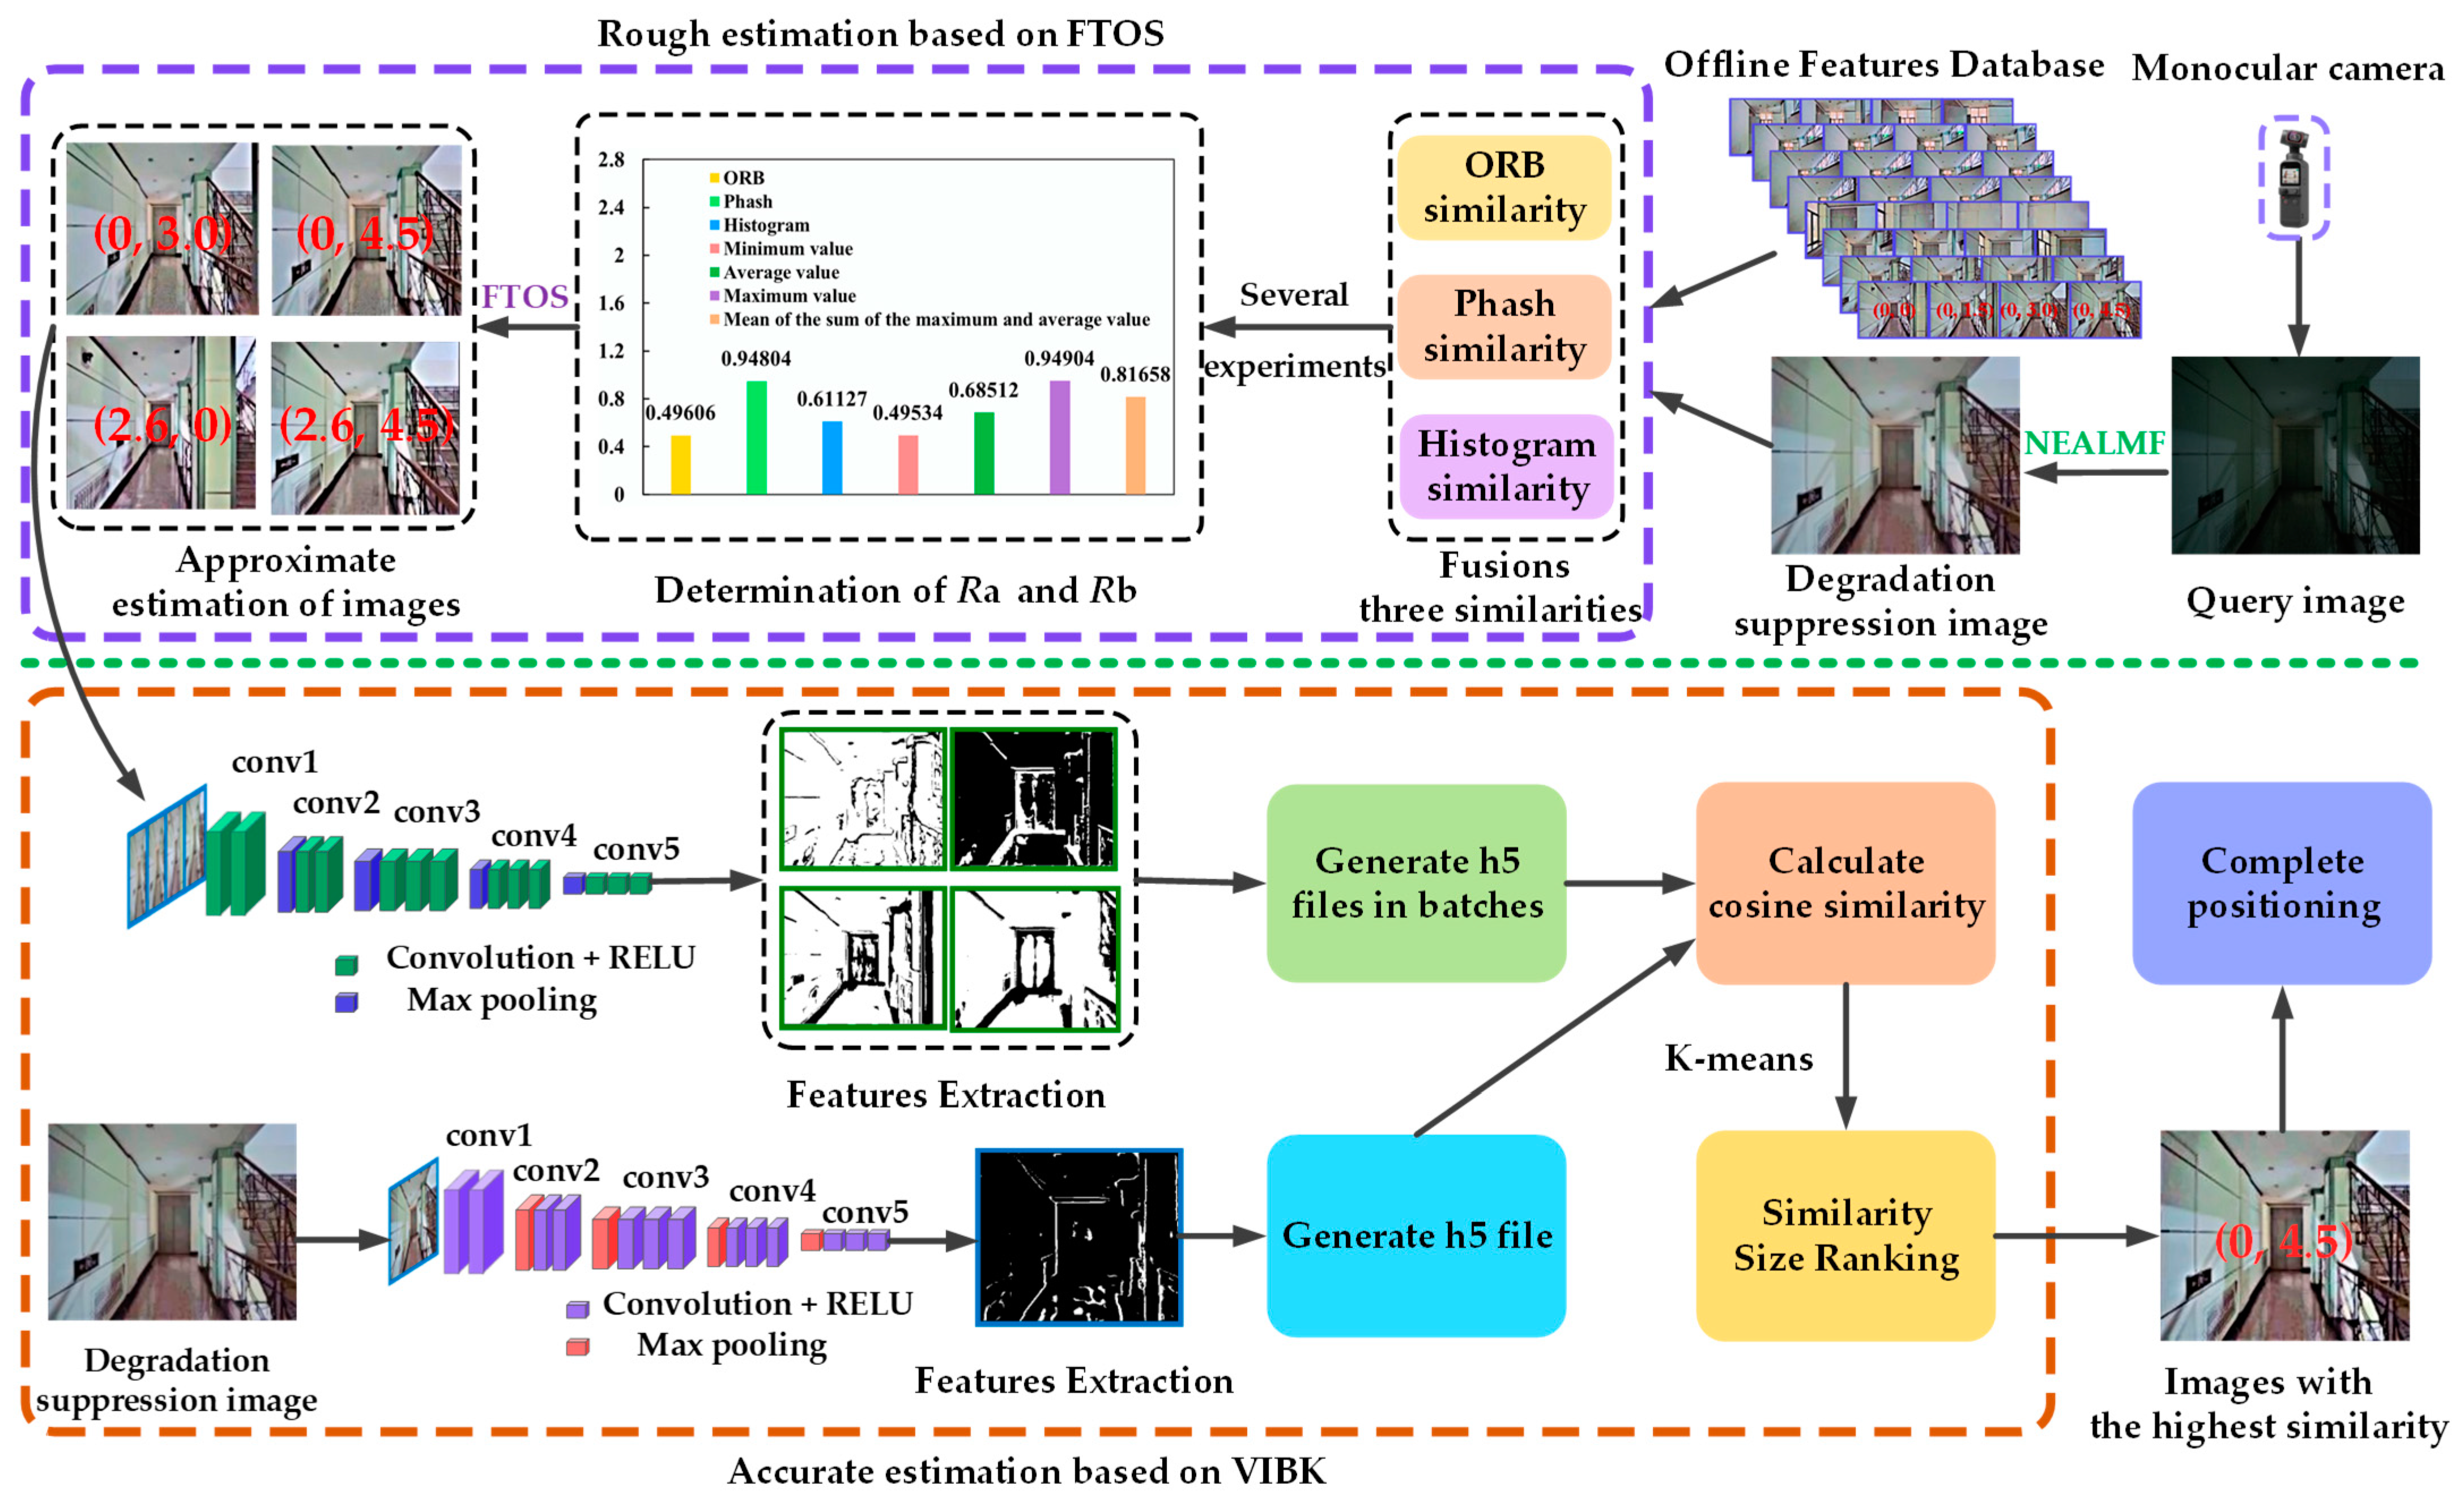
4. Framework of the Proposed Positioning Method VLMSF

In this section, the details of the proposed visual localization method VLMSF are highlighted, including the basic principles of the VLMSF method, the construction of the offline database, and the similarity construction of the VLMSF method. Among them, the specific process of VLMSF method is shown in Algorithm 1:
Algorithm 1 VLMSF
Input: unpositioned image Iq, offline feature database image Id, fusion threshold Ra, final similarity threshold Rb;
Output: geographical position of the image to be positioned (x, y);
Begin:
1.  Iq is preprocessed by the NEALMF to obtain Ii;
2.  The similarity Rc of Ii and Id by the FTOS method;
3.  If Rc   Rb or Rc   Ra, then obtain rough images Is (s = 1,2,3...);
4.       If S = 1, then obtain the most similar image Is;
5.       Else S > 1, obtain the most similar image Is to Ii by using the VIBK;
6.  End If
7.  The location information (x,y) of Iq is the coordinate information carried by Is;
End

4.1. Visual Localization Based on Multi-Similarity Fusions

Aiming at the problem of poor positioning accuracy caused by existing similarity retrieval methods, a Visual Localization with Multiple-Similarity Fusions (VLMSF) method is proposed in this paper based on image retrieval. The method is divided into two parts: Fusions Of Three Similarities (FOTS) image retrieval and Vgg-16 Image retrieval Based on Kears (VIBK). The specific steps of the VLMSF positioning method are shown in Figure 7:
As can be seen from Figure 7, the target image needs to be preprocessed with NEALMF before positioning in order to obtain the corresponding degradation suppression image. Second, the FTOS method is used to select rough images with high similarity to degradation suppression images from database images. Then, VIBK is used to extract the last layer of semantic features of the rough images and the degraded suppressed image, respectively, in order to generate the corresponding h5 feature vector. Finally, the cosine similarity is used to calculate the similarity between each rough image and the h5 corresponding to the degradation suppression image, and the K-means clustering method is used to sort the obtained similarity, thus obtaining the rough image corresponding to the highest similarity. The location information carried by this rough image is the location information of the target image, thus enabling precise positioning of the target.

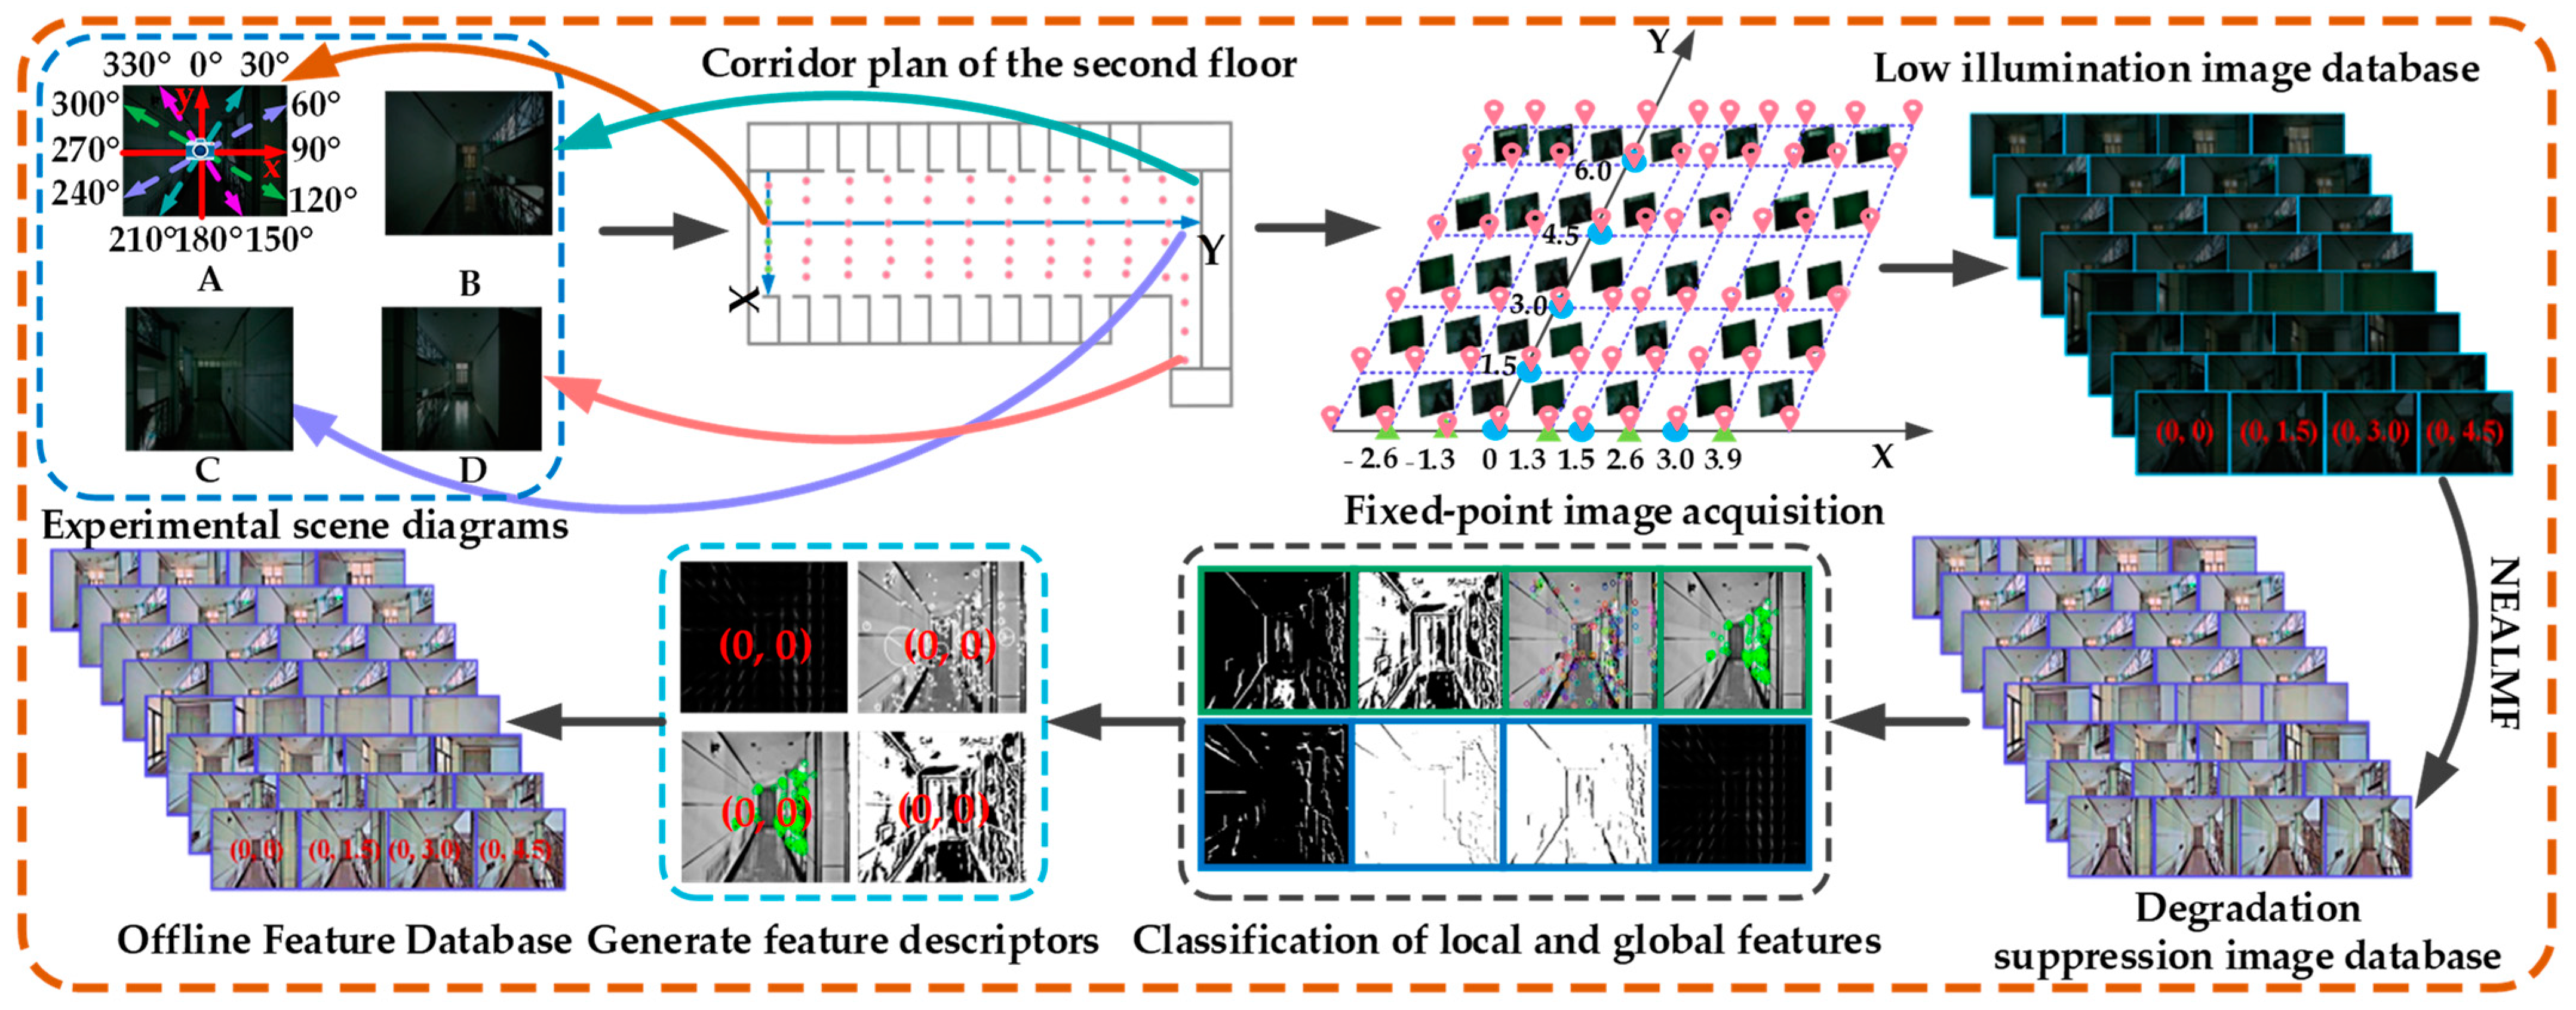
4.2. Construction of the Offline Feature Database

In order to facilitate the collection of images for positioning experiments, this paper chooses the second floor of the office building as the experimental site. As shown in Figure 8, the intersection of the two rectangular coordinate systems in the middle of Figure A is taken as the coordinate origin in the world coordinate system. Among them, the horizontal direction represents the x-axis of the world coordinate system, and the vertical direction represents the y-axis of the world coordinate system. There are two categories of image acquisition for monocular cameras: video stream acquisition and fixed point acquisition. Though the former offers the advantage of simple sampling, image redundancy or image loss might occur in some regions because of the uneven motion of the vision sensor. In order to improve the quality of the collected image, this paper uses the fixed-point method to collect the image. First, a collection point is taken at an interval of 1.3 m on the x axis and 1.5 m on the y axis, thus completing the collection of images on the whole experimental site. Then, images are taken at each acquisition point with the y-axis direction at 0 degrees, starting clockwise at 30-degree intervals, and a total of 12 images are taken at each acquisition point. At the same time, the position information of each acquisition point is recorded, thus constructing the low-illumination database.
In order to improve the image quality of visual data, it is necessary to preprocess the low illumination image database in order to form the offline feature database. The specific steps are as follows: first, NEALMF is used to process the images in the low illumination database in order to obtain the degradation suppression image database. Then, the feature extraction algorithm is used to classify the global and local features in the degradation suppression image database in order to generate feature descriptors. Finally, the feature descriptor of the degradation suppression image is stored in pairs with the location information of the corresponding image, thereby constructing the offline feature database, as shown in Figure 8.

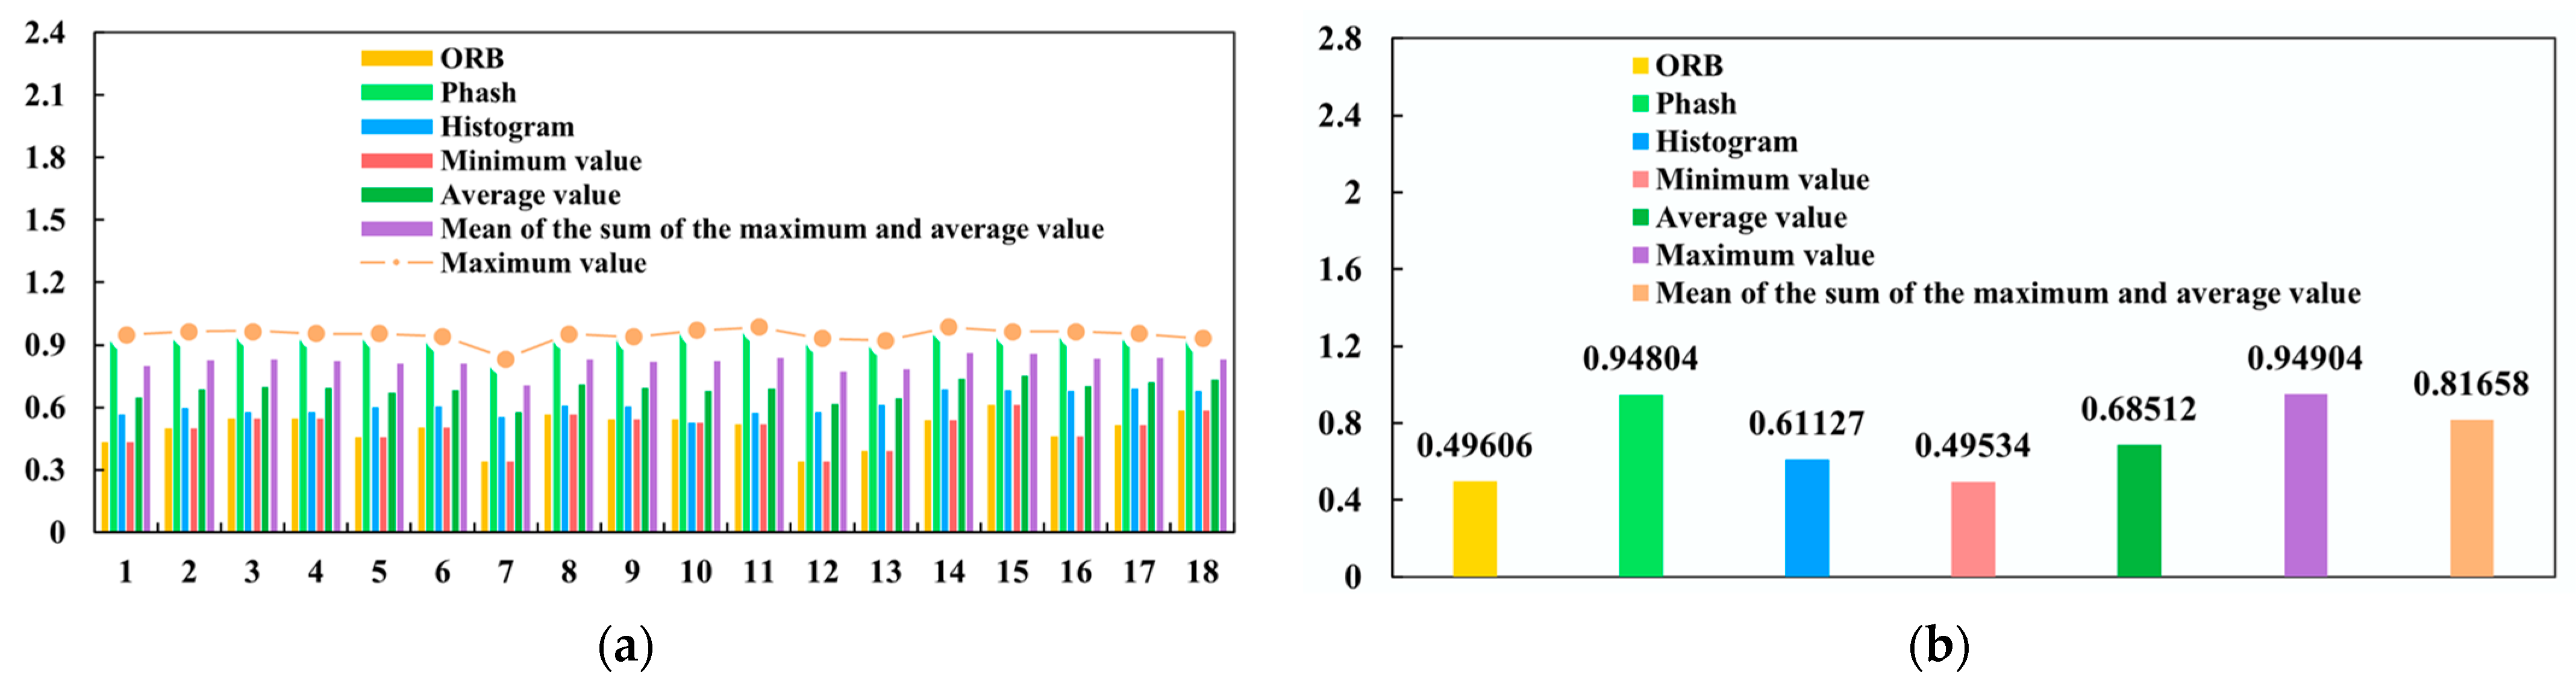
4.3. Similarity Calculation Based on the VLMSF

The VLMSF method, constructed by multi-similarity fusion, is divided into two parts: FTOS similarity for rough estimation and cosine similarity for accurate estimation. FTOS consists of ORB similarity, Perceptual Hash (Phash) similarity, and histogram similarity. The steps to implement FOTS similarity are as follows:
(1)
For the two selected images, if the maximum similarity calculated by the three similarity algorithms is greater than or equal to the fusion threshold, the maximum value is the similarity Ra after the fusion algorithm. Otherwise, the minimum value of similarity calculated by the three algorithms is taken as the subsequent similarity Ra of the fusion algorithm.
(2)
Define the final threshold as Rb. If Ra reaches the final threshold, the two images are considered to be very similar.
In order to improve the accuracy of rough estimation, appropriate Ra and Rb should be set for rough screening of database images. In this paper, multiple experiments are used to approximate the optimal thresholds Ra and Rb. The specific steps are as follows: first, 20 images are randomly selected from the degradation suppression database. Second, 20 images of the same angle are taken at the same position as the selected image. Then, NEALMF is used to preprocess the collected images to obtain the corresponding degradation suppression images, thus designing 20 sets of threshold determination experiments. Finally, the evaluation indexes of 20 groups of experiments are counted, including the values of the three similarities, the minimum value, the maximum value, the average value, and the mean of the sum of the maximum value and the average value, in order to determine Ra and Rb. The statistical results of each evaluation index and their average values are shown in Figure 9.
In order to screen out images with high similarity and to ensure that the number of rough estimated images is at least 1, this paper selects the average value as the basis for the selection of the fusion threshold, and the mean of the sum of the maximum value and the average value as the basis for the final threshold selection. According to Figure 9, the fusion threshold Ra is 0.68, and the final threshold Rb is 0.82.
In the accurate estimation, VIBK uses the cosine similarity algorithm to calculate the cosine value of the angle between the two h5 vectors in the inner product space in order to obtain the similarity between the two images. The closer the cosine is to 1, the more similar the two images are. Given vectors a(x1, x2, , xn) and b(y1, y2, , yn), the angle cosine of the vector is:
cos a , b = x 1   y 1 + x 2   y 1 + + x n   y n x 1 + x 2 + + x n y 1 + y 2 + + y n ,

4.4. Location Estimation Based on the VLMSF

In order to accurately estimate the location information of the target and reduce the estimation time, the VLMSF method divides the location estimation of the target into two parts: coarse and precise estimation. The details are as follows:
First, the monocular camera collects images by the fixed-point method and uses NEALMF to preprocess the collected images, thus obtaining the corresponding degradation suppression images. Then, the FTOS method is used to roughly screen the database images with high similarity to the degradation suppression images. Finally, the VIBK method is used to extract the last layer of convolutional features from rough images and the degradation suppression image, respectively, thus forming the corresponding h5 feature vector. The database image corresponding to the vector is the location information of the target image.

5. Simulation and Analysis of the Proposed Method VLMSF

In this section, the main content includes two parts: (1) localization results of the proposed method VLMSF for different types of low-illumination images, and (2) localization results of different visual methods.

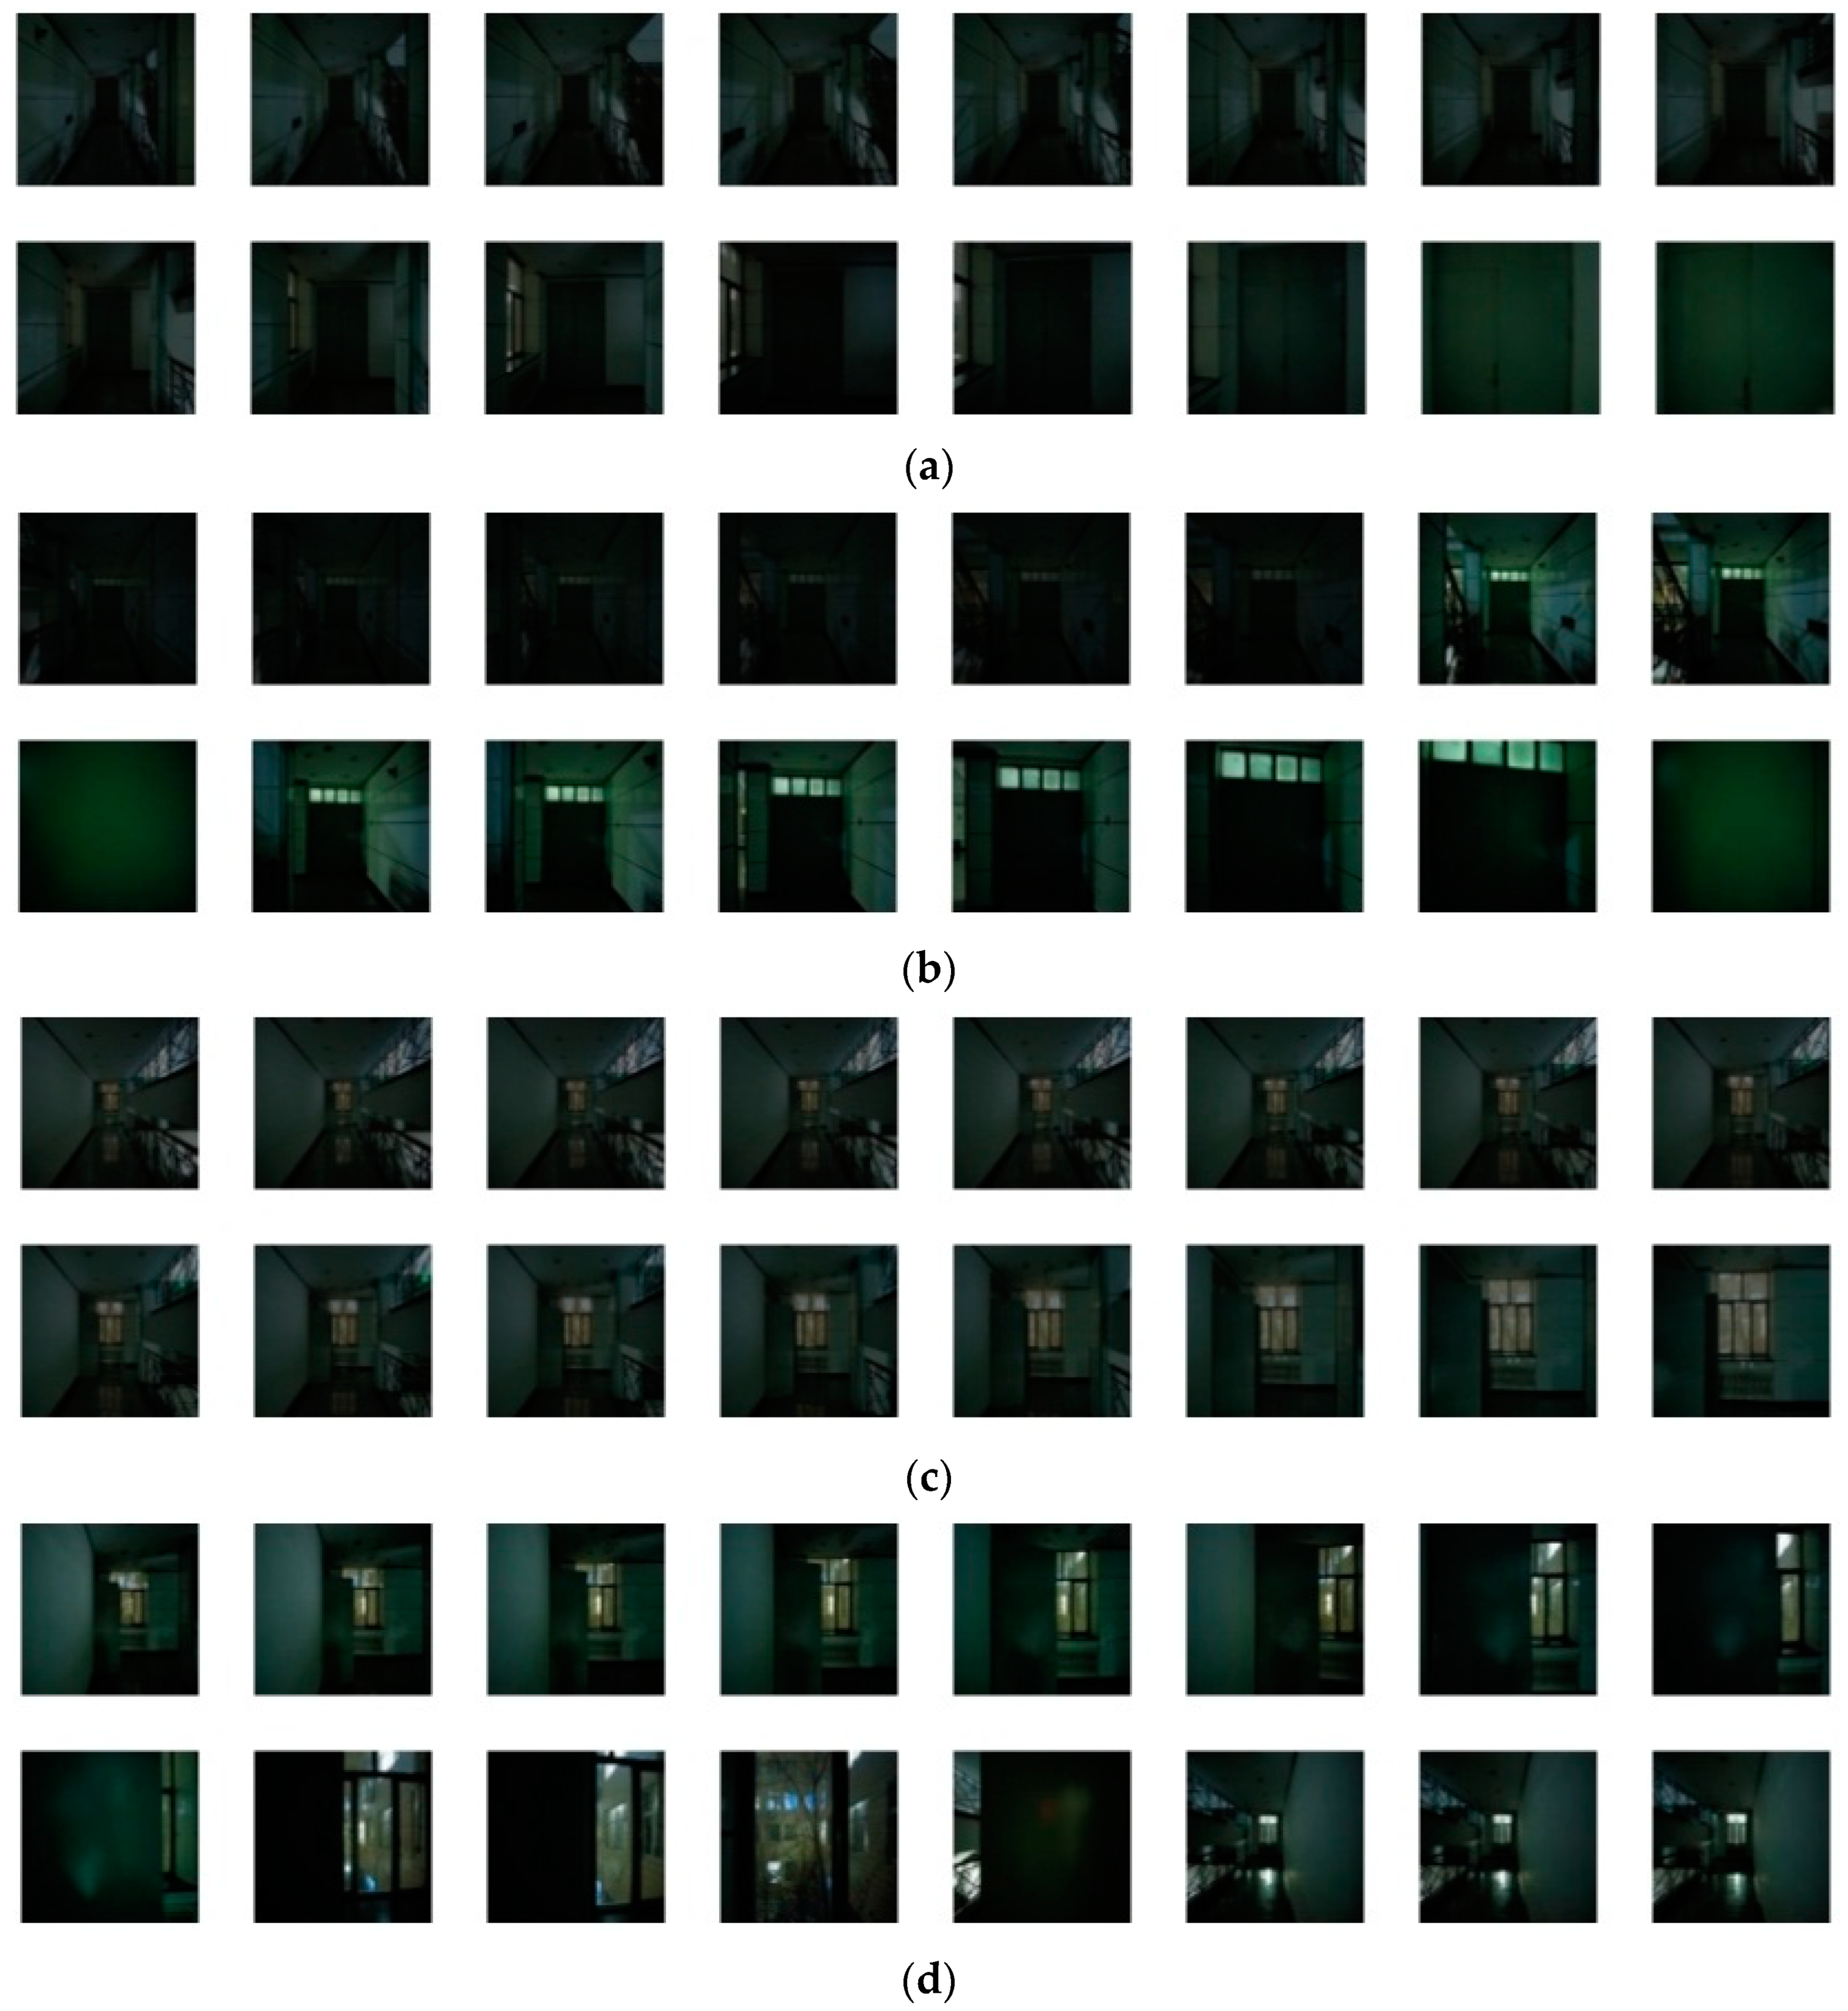
5.1. Visual Positioning Effects of Different Types for Low-Illumination Images

In engineering applications, the loss of feature points mostly reflects the impact of changing illumination intensity on the image. Under indoor low-illumination conditions, different illumination intensities cause the loss of image feature points in two main categories: global feature point loss and local feature point loss. The former is the image with low overall luminance, which makes the global detail information in the image obscured, thus making it difficult to be effectively identified and extracted by computer vision technology, as shown in Figure 10a. The latter is the image with low local luminance, which makes the local feature information in the image obscured, thereby resulting in the loss of local detail information in the image, as shown in Figure 10b.
To scientifically assess the suggested VLMSF method in this paper, the gathered low-illumination images are separated into two types for localization testing: global low luminance and local low luminance. The details are as follows: first, 32 images with low global luminance and 32 images with low local luminance are selected as the target images for localization experiments. The images selected for the localization experiments are shown in Figure 11. Among them, Figure 11a,b represent images with low global luminance, and Figure 11c,d represent images with low local luminance. Next, the NEALMF method is used to enhance the two types of low-illumination images, thereby obtaining the corresponding degradation-suppressed images. Then, the VLMSF localization method is used to match the degradation suppression image with the image in the offline database in order to select the database image that is most similar to the target image. The location information of this database image is the location information of the target image.
For the two types of low-illumination images, the results of the positioning experiment are shown in Table 4 and Table 5.
As can be seen from the experimental results in Table 4 and Table 5, the positioning error of the proposed method VLMSF in this paper is at most 2.6 m and at least 1.5 m for two types of low-illumination images.
For both types of low-illumination images, among the 32 sets of localization experiments with global low-luminance images, only one set of localization experiments showed errors in the localization results. Similarly, among the 32 sets of localization experiments with low local-luminance images, only one set showed errors in the localization results. As a result, the localization accuracy of the proposed VLMSF method in this paper is 96.88% for both types of low-illumination images.
The following conclusions can be drawn from the above analysis results: for different brightness conditions in indoor low-illumination environments, the proposed localization method VLMSF can significantly improve the localization accuracy of the target.

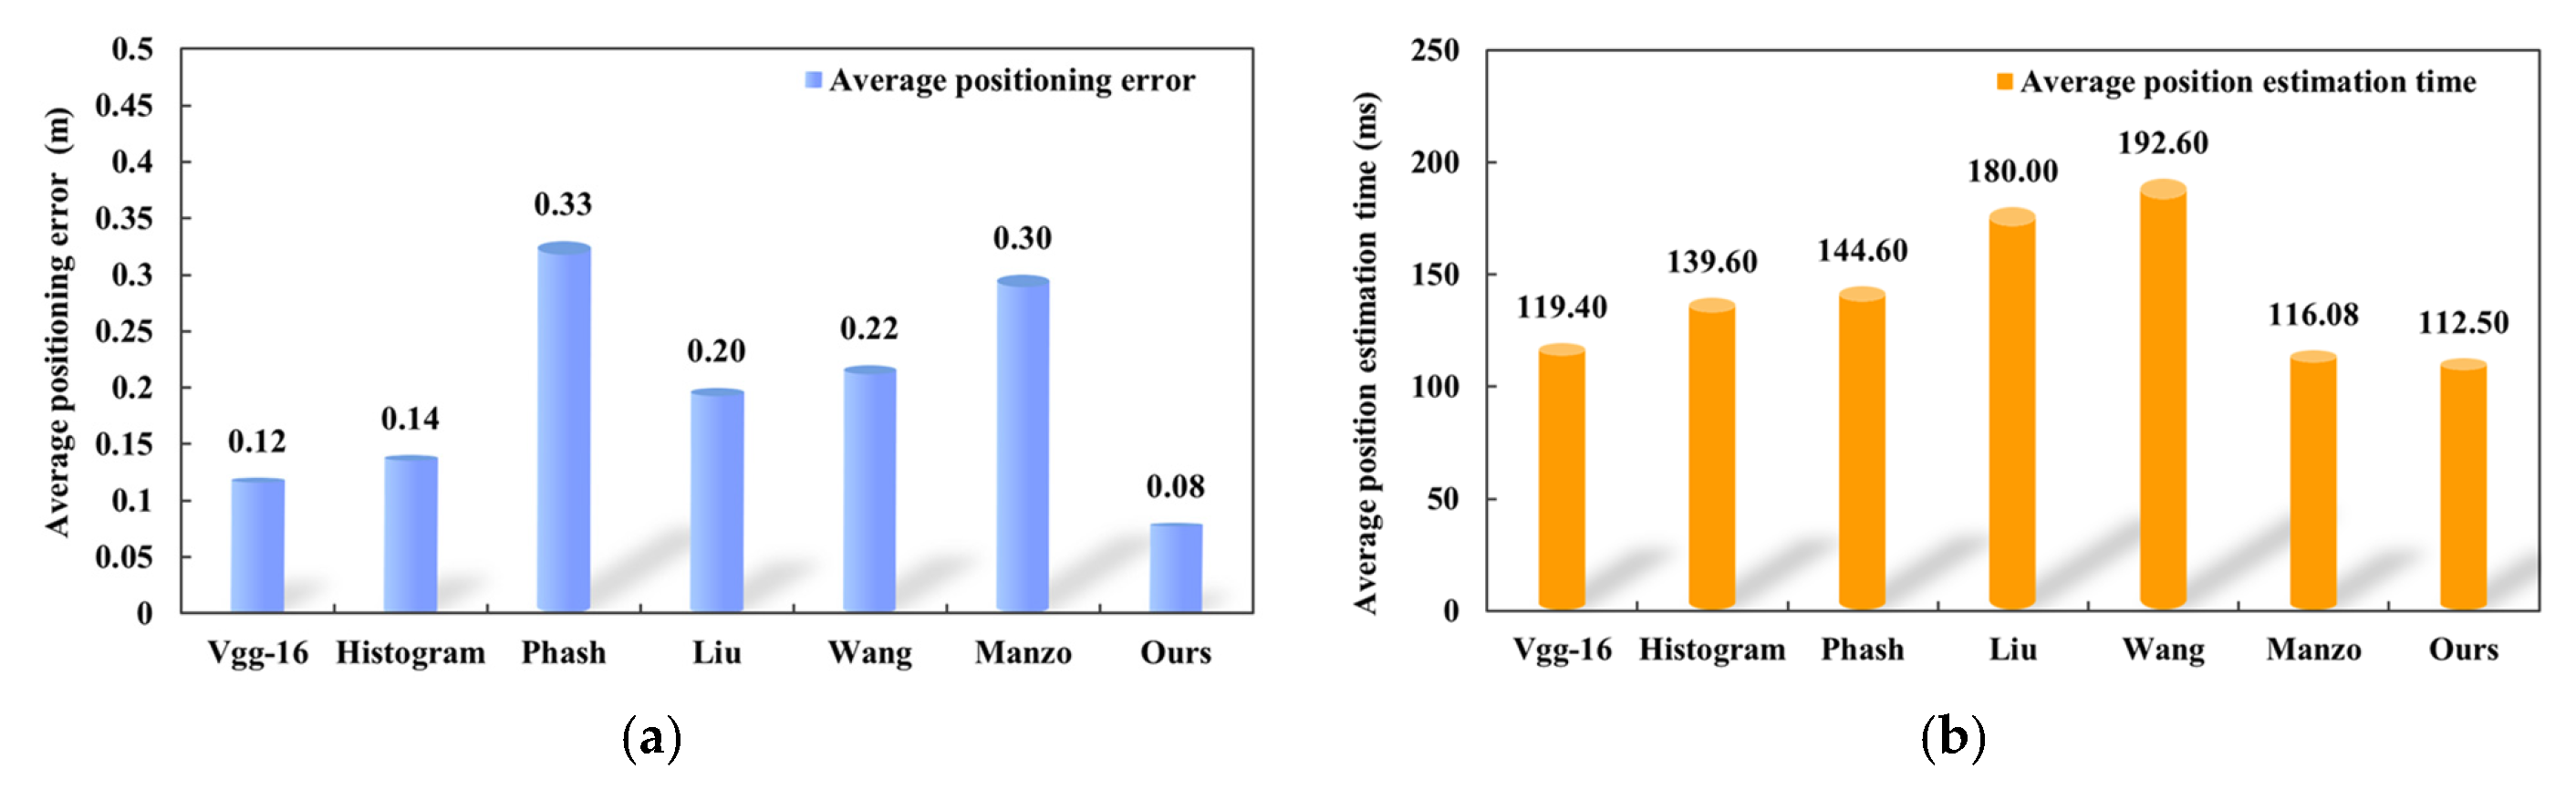
5.2. Simulation and Result Analysis of Different Vision Methods

At the selected experimental site, a monocular camera is used to take 180 target images at any position. Then, 180 sets of positioning experiments are performed using the VLMSF method. The specific steps are as follows: first, NEALMF is used to preprocess the target image, thus obtaining the corresponding degradation suppression image. Then, VLMSF is used to match the degradation suppression image with the image in the offline feature database, thereby selecting the most similar database image. The location information corresponding to this database image is the location information of the target image.
In the localization experiments, the actual positions of the target images and the positions estimated by VLMSF are shown in Table 6. In 180 sets of experiments, the VLMSF method accurately estimated 176 positions with an accuracy of 97.78%.
In order to verify the effectiveness and scientificity of VLMSF, the Kears-based VGG-16 similarity retrieval method, the image retrieval method based on color image histogram [26], Phash [27], Liu [28], Wang [29], Manzo [30], and VLMSF are used to experiment on 180 target images. Before determining the location information of the target image, this paper uses NEALMF to preprocess the target image in order to obtain better visual data. The average running time of each phase of the method in NEALMF is shown in Table 7. The location estimation results of the seven algorithms are shown in Table 8.
Compared to other methods, the VLMSF method reduces the average positioning error by a maximum of 75.76% and a minimum of 33.33%. In terms of average position estimation time, the method proposed in this paper achieved a maximum reduction of 41.59% and a minimum reduction of 3.08%.
The comparison results for each similarity method are shown in Figure 12.
As can be seen from Figure 12, the average positioning error of the proposed method is only 0.08 m. That is about 8 cm, and the average position estimation time is only 112.50 ms. Compared with the other six methods, the proposed method improves the accuracy of position estimation and shortens the time of position estimation.

6. Discussion

In this paper, we select the frame building space under morning and evening illumination conditions as the experimental scene. Due to insufficient illumination, the images taken in these scenes have serious quality degradation problems, such as low brightness, low contrast, color distortion, and noise interference. These problems make it difficult to match the target image with the image in the offline feature database, so the location information of the target cannot be determined. Therefore, this paper proposes a VLMSF target localization method based on the NEALMF preprocessing enhancement. This method reduces the influence of low illumination on the visual positioning system by improving the image quality in order to accurately determine the location information of the target. When we take images in low-illumination environments with uneven illumination, such as closed and semi-closed environments with point light sources, we find that the acquired images have more background noise. At this time, the image processed by the denoising algorithm in NEALMF still has a small amount of residual noise. How to more accurately and comprehensively remove the noise contained in the uneven illumination image is one of our subsequent research directions.

7. Conclusions

The method in this paper aims to address how to use visual methods to accurately detect the target’s location information in the frame building space under low-illumination conditions. Images obtained in this environment have serious quality degradation problems, such as local feature loss and noise interference, which result in vision methods failing to determine the location of the target. Therefore, this paper designs a VLMSF visual positioning method based on NEALMF preprocessing enhancement. It mainly carried out the following work:
Firstly, a NEALMF quality degradation suppression method is proposed, which solves the problem of difficult feature point extraction by improving the quality of the image. Then, the VLMSF localization method is constructed, which improves the accuracy of feature matching by combining the underlying features of the image with the high-level features, thus accurately estimating the location information of the target.
Experiments show that compared with low-illumination images, the number of image feature points processed by the NEALMF algorithm increases by at least 66.96% and at most 4.62 times. Therefore, NEALMF largely solves the problem of the difficult extraction of feature points in visual localization. In the location estimation stage, compared with other similarity methods, the positioning error of the proposed method is only 8 cm, and the positioning time is 112.5 ms. Therefore, the VLMSF visual localization method based on NEALMF preprocessing enhancement can accurately estimate the location of the target and shorten the time of location estimation. After comprehensive analysis, the VLMSF target location method based on NEALMF preprocessing enhancement can solve the influence of low illumination on visual methods to a certain extent, so as to accurately obtain the location information of the target.

Author Contributions

Methodology, software, writing—original draft preparation and writing—review and editing, Huapeng Tang; formal analysis, Huapeng Tang and Danyang Qin; resources and project administration, Danyang Qin; supervision, Danyang Qin, Jiaqiang Yang, Haoze Bie, Mengying Yan, Gengxin Zhang and Lin Ma. All authors have read and agreed to the published version of the manuscript.

Funding

This research was funded by the Open Research Fund of National Mobile Communications Research Laboratory, Southeast University (No. 2023D07), Outstanding Youth Program of Natural Science Foundation of Heilongjiang Province (YQ2020F012), National Natural Science Foundation of China (61971162, 61771186) and Fundamental Scientific Research Funds of Heilongjiang Province (2022-KYYWF-1050).

Data Availability Statement

The data presented in this study are available upon request from the corresponding authors. The data cannot be made public for privacy reasons.

Acknowledgments

We thank Heilongjiang University for supporting the experimental scenes. We also gratefully thank the reviewers for their thorough review and are extraordinarily appreciative of their comments and suggestions, which have significantly improved the quality of the publication.

Conflicts of Interest

The authors declare no conflict of interest.

References

  1. Pinem, M.; Zardika, A.; Siregar, Y. Location Misplacement Analysis on Global Positioning System. In Proceedings of the 2020 4rd International Conference on Electrical, Telecommunication and Computer Engineering (ELTICOM), Medan, Indonesia, 3–4 September 2020; pp. 246–249. [Google Scholar]
  2. Li, F.; Tu, R.; Hong, J.; Zhang, S.; Zhang, P.; Lu, X. Combined positioning algorithm based on BeiDou navigation satellite system and raw 5G observations. Measurement 2022, 190, 110763. [Google Scholar] [CrossRef]
  3. Agarwal, S.; Lazarus, S.B.; Savvaris, A. Monocular vision based navigation and localisation in indoor environments. IFAC Proc. Vol. 2012, 45, 97–102. [Google Scholar] [CrossRef]
  4. Tan, S.F.; Isa, N.A.M. Exposure based multi-histogram equalization contrast enhancement for non-uniform illumination images. IEEE Access 2019, 7, 70842–70861. [Google Scholar] [CrossRef]
  5. Gu, K.; Zhai, G.; Liu, M.; Min, X.; Yang, X.; Zhang, W. Brightness preserving video contrast enhancement using S-shaped transfer function. In Proceedings of the 2013 Visual Communications and Image Processing (VCIP), Kuching, Malaysia, 17–20 November 2013; pp. 1–6. [Google Scholar]
  6. Tian, H.; Cai, M.; Guan, T.; Hu, Y. Low-light image enhancement method using retinex method based on YCbCr color space. Acta Photonica Sin. 2020, 49, 173–184. [Google Scholar]
  7. Guo, X.; Li, Y.; Ling, H. LIME: Low-light image enhancement via illumination map estimation. IEEE Trans. Image Process. 2016, 26, 982–993. [Google Scholar] [CrossRef] [PubMed]
  8. Ying, Z.; Li, G.; Gao, W. A bio-inspired multi-exposure fusion framework for low-light image enhancement. arXiv 2017, arXiv:1711.00591. [Google Scholar]
  9. Li, Y. Research and Implementation of Low Illumination image Enhancement Algorithm Based on Retinex Theory. Master’s Thesis, Xidian University, Xi’an, China, 2018. [Google Scholar]
  10. Ahn, H.; Keum, B.; Kim, D.; Lee, H.S. Adaptive local tone mapping based on retinex for high dynamic range images. In Proceedings of the 2013 IEEE International Conference on Consumer Electronics (ICCE), Las Vegas, NV, USA, 11–14 January 2013; pp. 153–156. [Google Scholar]
  11. Sun, Y.; Zhao, Z.; Jiang, D.; Tong, X.; Tao, B.; Jiang, G.; Kong, J.; Yun, J.; Liu, Y.; Liu, X.; et al. Low-illumination image enhancement algorithm based on improved multi-scale Retinex and ABC algorithm optimization. Front. Bioeng. Biotechnol. 2022, 10, 865820. [Google Scholar] [CrossRef] [PubMed]
  12. Al-Ameen, Z. Nighttime image enhancement using a new illumination boost algorithm. IET Image Process. 2019, 13, 1314–1320. [Google Scholar] [CrossRef]
  13. Noyel, G.; Jourlin, M. Functional Asplund metrics for pattern matching, robust to variable lighting conditions. arXiv 2019, arXiv:1909.01585. [Google Scholar] [CrossRef]
  14. Dong, X.; Pang, Y.; Wen, J. Fast efficient algorithm for enhancement of low lighting video. In ACM SIGGRAPH 2010 Posters; Association for Computing Machinery: New York, NY, USA, 2010; p. 1. [Google Scholar]
  15. Tsai, C.M. Adaptive local power-law transformation for color image enhancement. Appl. Math. Inf. Sci. 2013, 7, 2019. [Google Scholar] [CrossRef] [Green Version]
  16. Cheng, R.; Hu, W.; Chen, H.; Fang, Y.; Wang, K.; Xu, Z.; Bai, J. Hierarchical visual localization for visually impaired people using multimodal images. Expert Syst. Appl. 2021, 165, 113743. [Google Scholar] [CrossRef]
  17. Toft, C.; Stenborg, E.; Hammarstrand, L.; Brynte, L.; Pollefeys, M.; Sattler, T.; Kahl, F. Semantic match consistency for long-term visual localization. In Proceedings of the European Conference on Computer Vision (ECCV); Springer: Cham, Switzerland, 2018; pp. 383–399. [Google Scholar]
  18. Feng, G.; Jiang, Z.; Tan, X.; Cheng, F. Hierarchical Clustering-Based Image Retrieval for Indoor Visual Localization. Electronics 2022, 11, 3609. [Google Scholar] [CrossRef]
  19. Weinzaepfel, P.; Csurka, G.; Cabon, Y.; Humenberger, M. Visual localization by learning objects-of-interest dense match regression. In Proceedings of the IEEE/CVF Conference on Computer Vision and Pattern Recognition, Long Beach, CA, USA, 15–20 June 2019; pp. 5634–5643. [Google Scholar]
  20. Yu, S.; Jiang, Z. Visual tracking via perceptual image hash from a mobile robot. In Proceedings of the 2015 IEEE International Conference on Information and Automation, Lijiang, China, 8–10 August 2015; pp. 1612–1616. [Google Scholar]
  21. Bi, J.; Zhen, J.; Wang, Y.; Liu, X. Improved KNN indoor positioning method with Gaussian function fixed weight. Bull. Surv. Mapp. 2017, 06, 9–12+35. [Google Scholar]
  22. Tao, L.; Asari, V. An integrated neighborhood dependent approach for nonlinear enhancement of color images. In Proceedings of the International Conference on Information Technology: Coding and Computing, Las Vegas, NV, USA, 5–7 April 2004; Proceedings. ITCC 2004. IEEE: Washington, DC, USA, 2004; Volume 2, pp. 138–139. [Google Scholar]
  23. Xu, X.; Cai, Y.; Liu, C.; Jia, K.; Shen, L. Color deviation detection and color correction method based on image analysis. Meas. Control. Technol. 2008, 27, 10–12. [Google Scholar]
  24. Zhang, X. Center pixel weight based on Wiener filter for non-local means image denoising. Optik 2021, 244, 167557. [Google Scholar] [CrossRef]
  25. Xu, P.; Chen, B.; Zhang, J.; Xue, L.; Zhu, L. A new HSI denoising method via interpolated block matching 3D and guided filter. PeerJ 2021, 9, e11642. [Google Scholar] [CrossRef] [PubMed]
  26. Liu, G.H.; Wei, Z. Image retrieval using the fused perceptual color histogram. Comput. Intell. Neurosci. 2020, 2020, 8876480. [Google Scholar] [CrossRef] [PubMed]
  27. Yin, Y. Research on Image Similarity Retrieval Algorithm Based on Perceptual Hashing. Master’s Thesis, Kunming University of Science and Technology, Kunming, China, 2020. [Google Scholar]
  28. Liu, X.; Huang, H.; Hu, B. Indoor Visual Positioning Method Based on Image Features. Sens. Mater. 2022, 34, 337. [Google Scholar] [CrossRef]
  29. Wang, Y.; Wang, Y.; Bi, J.; Cao, H. An indoor positioning method based on image gray histogram similarity calculation. Bull. Surv. Mapp. 2018, 4, 63–67. [Google Scholar]
  30. Manzo, M. Graph-based image matching for indoor localization. Mach. Learn. Knowl. Extr. 2019, 1, 46. [Google Scholar] [CrossRef] [Green Version]
Figure 1. Determine the location information of the target.
Ijgi 12 00300 g001
Figure 2. Evaluation index of the image processed by the two algorithms: (a) Information entropy of images in different datasets; (b) Color deviation values of images in different datasets.
Ijgi 12 00300 g002
Figure 3. Evaluation indexes corresponding to different D0: (a) Mean value of information entropy; (b) Mean value of PSNR.
Ijgi 12 00300 g003
Figure 4. Evaluation indexes corresponding to different h: (a) SNR statistical results; (b) Mean value of Information entropy.
Ijgi 12 00300 g004
Figure 5. Comparison results of each evaluation index: (a) Average SNR of images in different datasets; (b) SSIM of images from different datasets.
Ijgi 12 00300 g005
Figure 6. Mean value of the number of local feature points: (a) Number of SIFT feature points before and after image enhancement in different datasets; (b) Number of ORB feature points before and after image enhancement in different datasets.
Ijgi 12 00300 g006
Figure 7. Determine the location information of the target using VLMSF.
Ijgi 12 00300 g007
Figure 8. Construction of the offline feature database.
Ijgi 12 00300 g008
Figure 9. Determination of similarity thresholds Ra and Rb: (a) Statistical results of each evaluation index; (b) Mean value of each evaluation index.
Ijgi 12 00300 g009
Figure 10. Two types of low-illumination images in indoor environments: (a) Global low-luminance images; (b) Local-low luminance images.
Ijgi 12 00300 g010
Figure 11. Two types of positioning experiment images: (a,b) Global low-luminance images; (c,d) Local low-luminance images.
Ijgi 12 00300 g011
Figure 12. Comparison of similarity position estimation methods, they are listed as: (a) Average positioning error of different methods; (b) Average position estimation time of different methods.
Ijgi 12 00300 g012
Table 1. Image enhancement effects of two algorithms.
Different
Image Datasets
Actual ImageSICELIMELOLMEF
Original imagesIjgi 12 00300 i001Ijgi 12 00300 i002Ijgi 12 00300 i003Ijgi 12 00300 i004Ijgi 12 00300 i005
AINDANEIjgi 12 00300 i006Ijgi 12 00300 i007Ijgi 12 00300 i008Ijgi 12 00300 i009Ijgi 12 00300 i010
EAINDAIjgi 12 00300 i011Ijgi 12 00300 i012Ijgi 12 00300 i013Ijgi 12 00300 i014Ijgi 12 00300 i015
Table 2. Variance of INLM-denoised images before and after sharpening.
Different
Image Datasets
Actual
Image
SICELIMELOLMEFMean Value
Before41.7248.4459.1642.1762.3750.77
After50.6358.2873.3350.9873.7561.39
Table 3. Low-illumination images processed by different algorithms.
Different
Image Datasets
Actual ImageSICELIMELOLMEF
Original ImagesIjgi 12 00300 i016Ijgi 12 00300 i017Ijgi 12 00300 i018Ijgi 12 00300 i019Ijgi 12 00300 i020
AINDANEIjgi 12 00300 i021Ijgi 12 00300 i022Ijgi 12 00300 i023Ijgi 12 00300 i024Ijgi 12 00300 i025
Al-AmeenIjgi 12 00300 i026Ijgi 12 00300 i027Ijgi 12 00300 i028Ijgi 12 00300 i029Ijgi 12 00300 i030
LiIjgi 12 00300 i031Ijgi 12 00300 i032Ijgi 12 00300 i033Ijgi 12 00300 i034Ijgi 12 00300 i035
AhnIjgi 12 00300 i036Ijgi 12 00300 i037Ijgi 12 00300 i038Ijgi 12 00300 i039Ijgi 12 00300 i040
DongIjgi 12 00300 i041Ijgi 12 00300 i042Ijgi 12 00300 i043Ijgi 12 00300 i044Ijgi 12 00300 i045
TsaiIjgi 12 00300 i046Ijgi 12 00300 i047Ijgi 12 00300 i048Ijgi 12 00300 i049Ijgi 12 00300 i050
NEALMFIjgi 12 00300 i051Ijgi 12 00300 i052Ijgi 12 00300 i053Ijgi 12 00300 i054Ijgi 12 00300 i055
Table 4. Location error statistics of the proposed method VLMSF in this paper.
Location InformationCorrect Location InformationEstimated Location Information
Global
low-luminance images
(3.90, 6.00)(1.30, 6.00)
Local
low-luminance images
(30.00, 24.00)(31.50, 2.40)
Table 5. Statistical results of positioning experiments.
Types
of Low-Illumination Images
Global
Low-Luminance Images
Local
Low-Luminance Images
Positioning accuracy/%96.88%96.88%
Total positioning error/m2.601.50
Average positioning error/m0.080.05
Table 6. Statistics of positioning deviation of test images.
No.Actual PositionCalculated ResultsLocation Error/mDeviation Angle/°
1(3.9, 6.0)(1.3, 6.0)2.600
2(3.9, 1.5)(−2.6, 3.0)6.6712.99
3(30, 24.0)(31.5, 24.0)1.500
4(10.5, 25.5)(10.5, 21.0)4.500
Table 7. Average running time of each phase method in the NEALMF.
Each Phase
Method in the NEALMF
EAINDAINLMUSMTotal Time
Average
preprocessing time/ms
14.0086.004.00104.00
Table 8. Performance comparison of each similarity positioning method.
MethodVgg-16HistogramPhashLiuWangManzoOurs
Total deviation angle/°72.0384.5662.0884.5277.0083.8212.99
Total positioning error/m20.8224.3160.0635.9439.6754.2615.27
Average deviation angle/°0.400.470.340.470.430.470.07
Average positioning error/m0.120.140.330.200.220.300.08
Average position
estimation time/ms
119.40139.60144.60180.00192.60116.08112.50
Disclaimer/Publisher’s Note: The statements, opinions and data contained in all publications are solely those of the individual author(s) and contributor(s) and not of MDPI and/or the editor(s). MDPI and/or the editor(s) disclaim responsibility for any injury to people or property resulting from any ideas, methods, instructions or products referred to in the content.

