
Is Ride-Hailing an Effective Tool for Improving Transportation Services in Suburban New Towns in China? Evidence from Wuhan Unicom Users’ Mobile Phone Usage Big Data

Abstract
:1. Introduction
2. Literature Review
3. Data and Methods
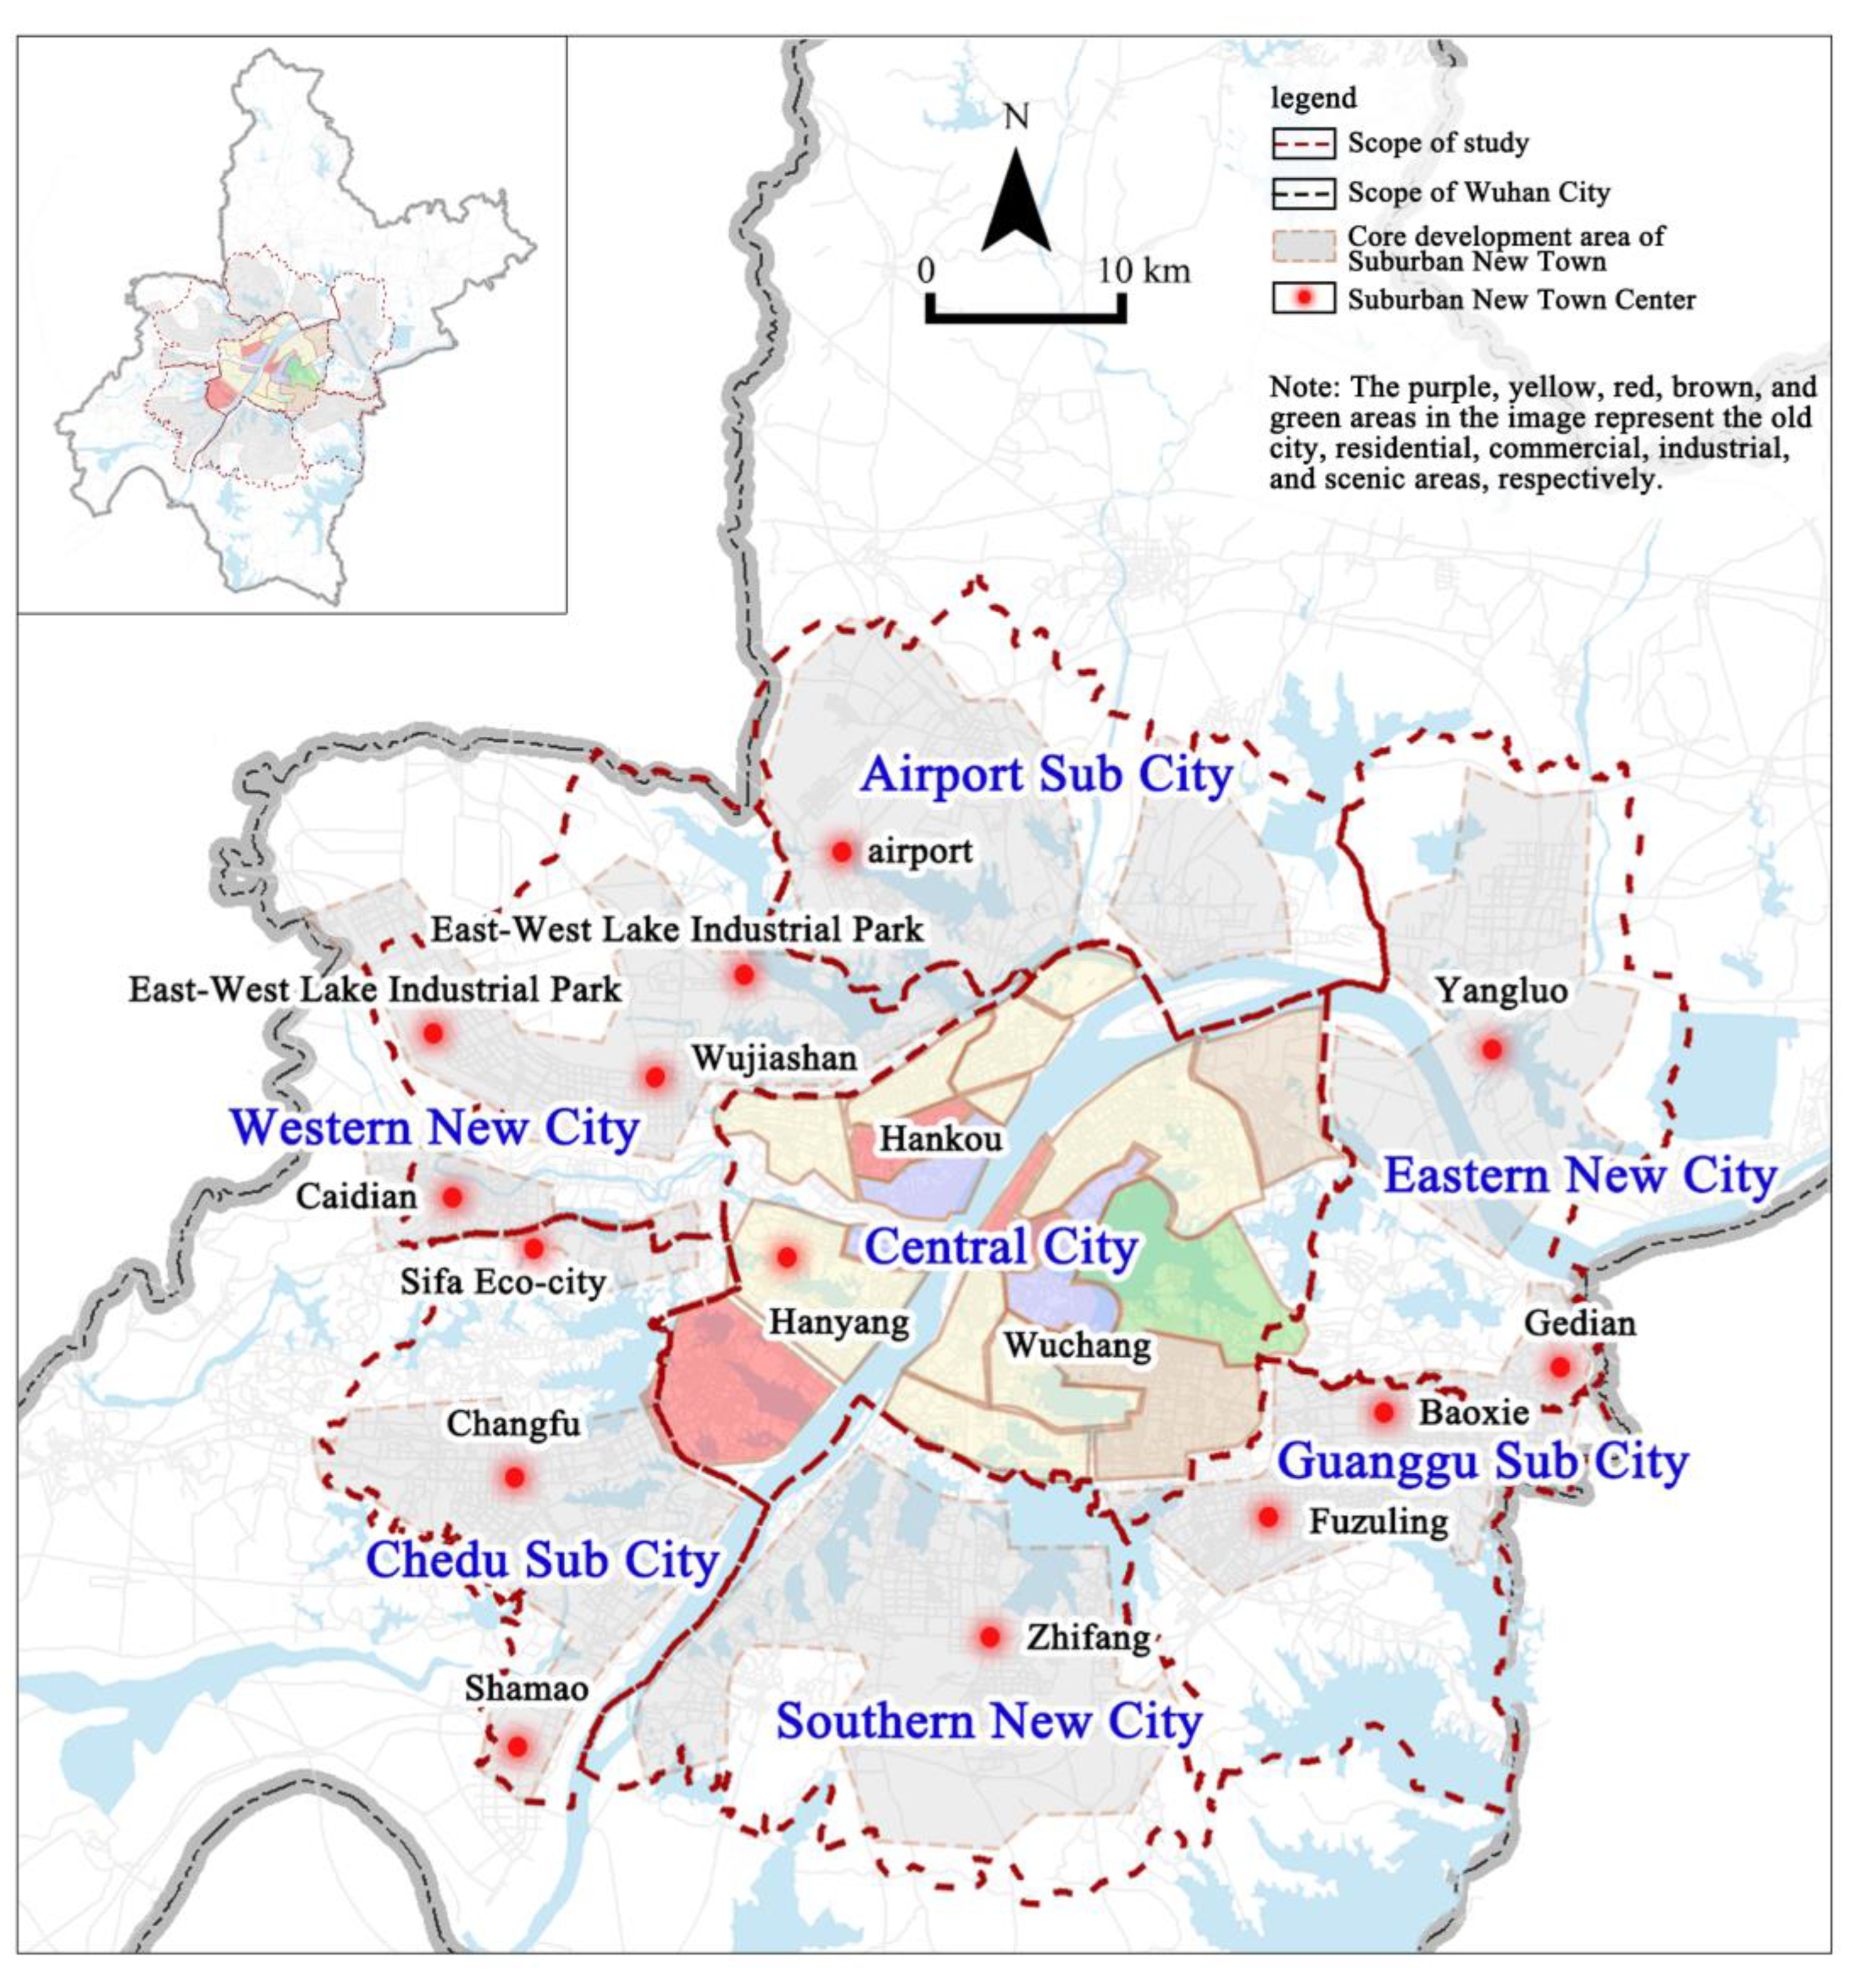
3.1. Study Area
3.2. Research Data
3.2.1. Mobile Phone Usage Big Data
3.2.2. Research Unit
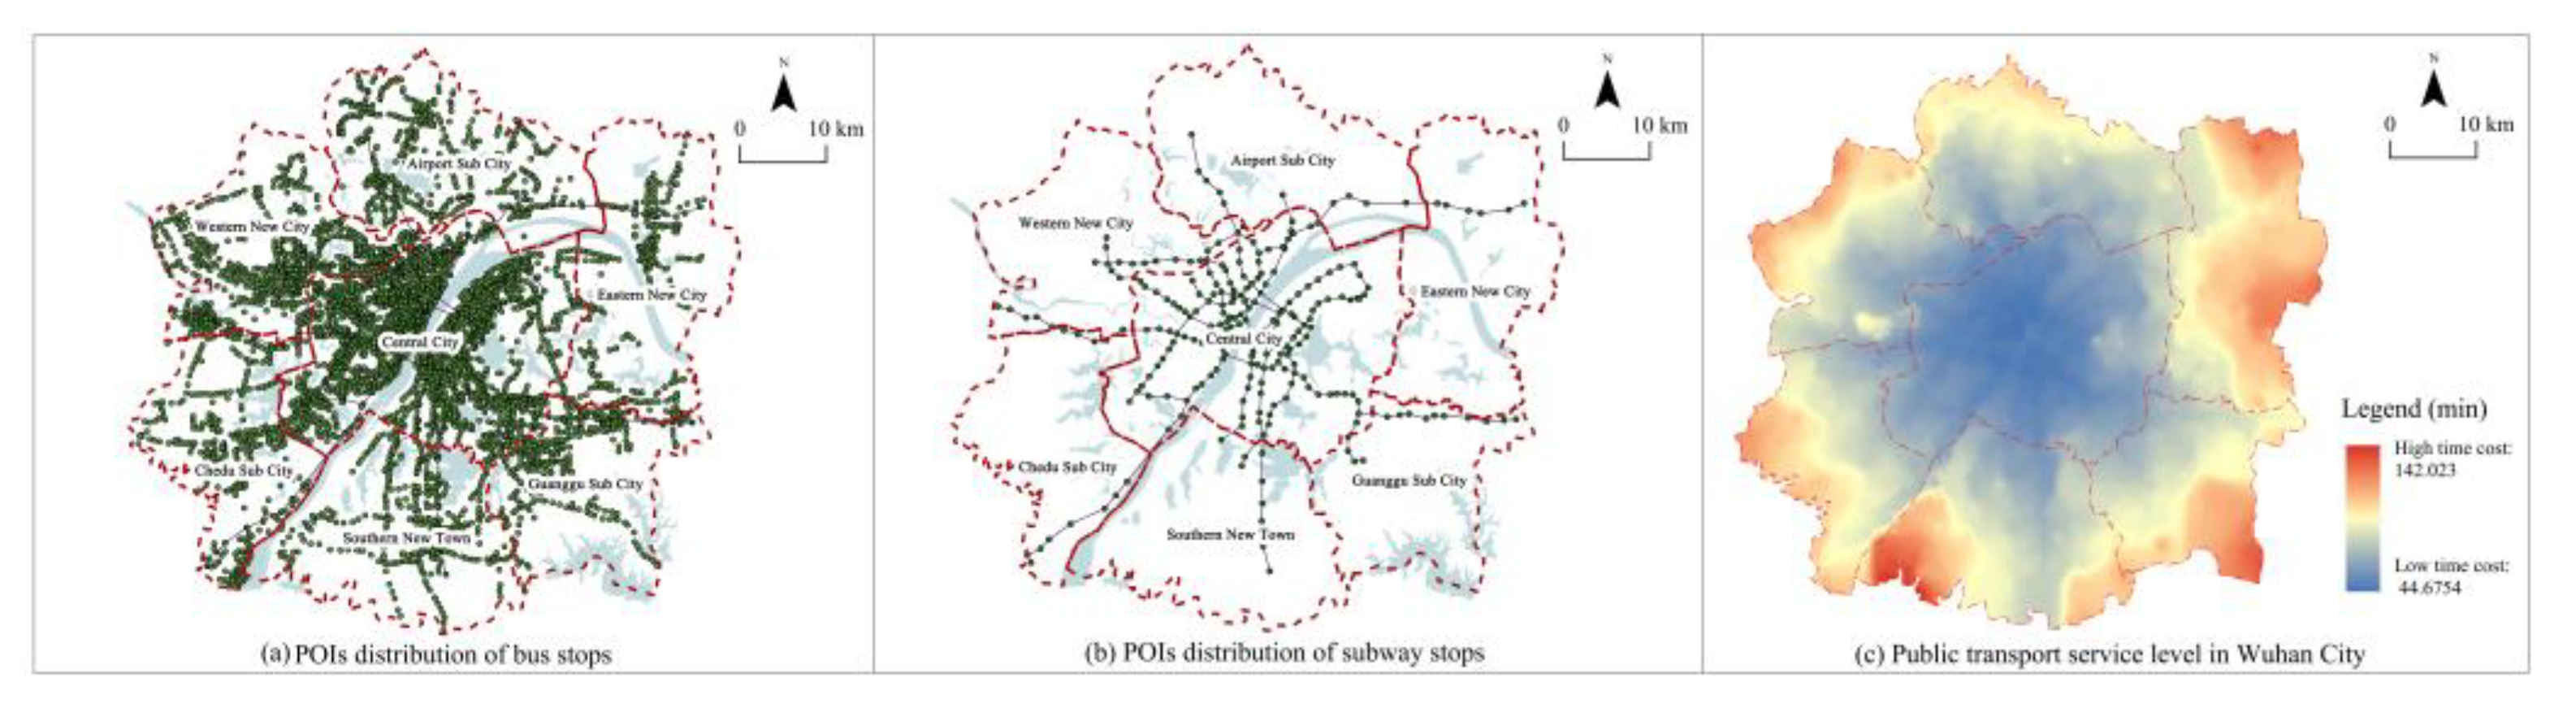
3.2.3. Measurement of Public Transportation Services Level (PTSL)
3.3. Research Methods
3.3.1. Spatial Autocorrelation
3.3.2. Geographically Weighted Regression
4. Results
4.1. Spatial Distribution Characteristics of Ride-Hailing
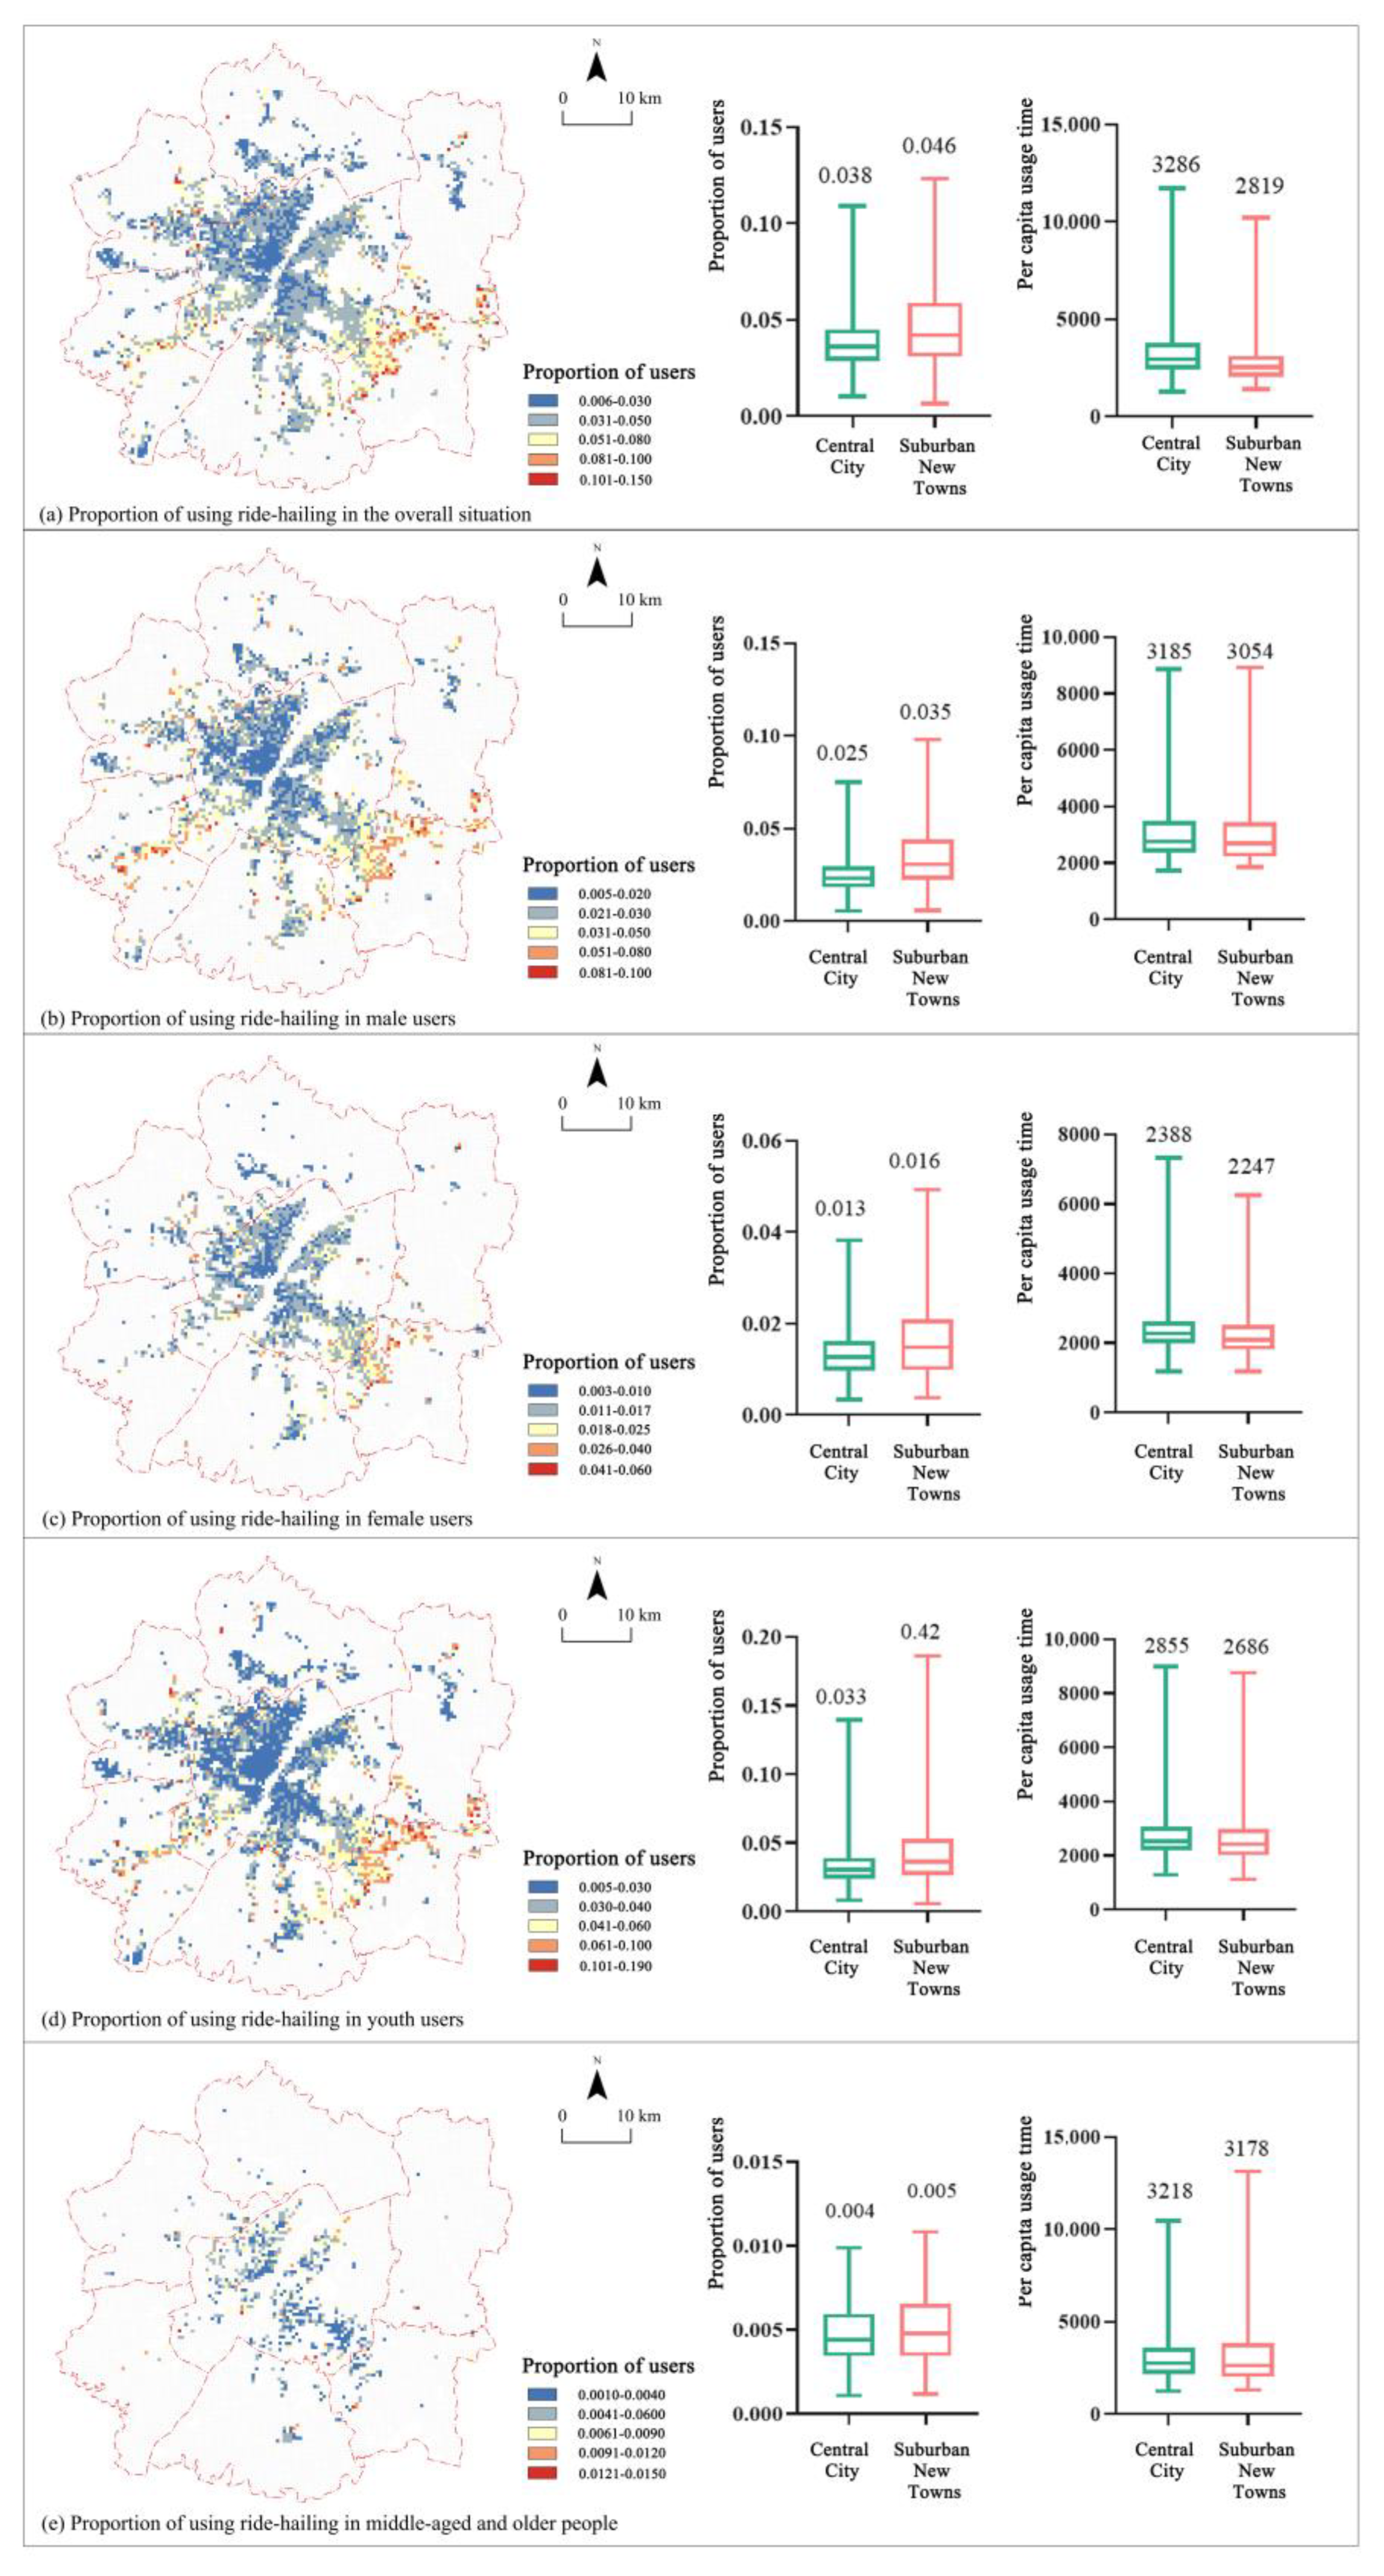
4.1.1. Spatial Difference in the Number and Duration of Ride-Hailing Users
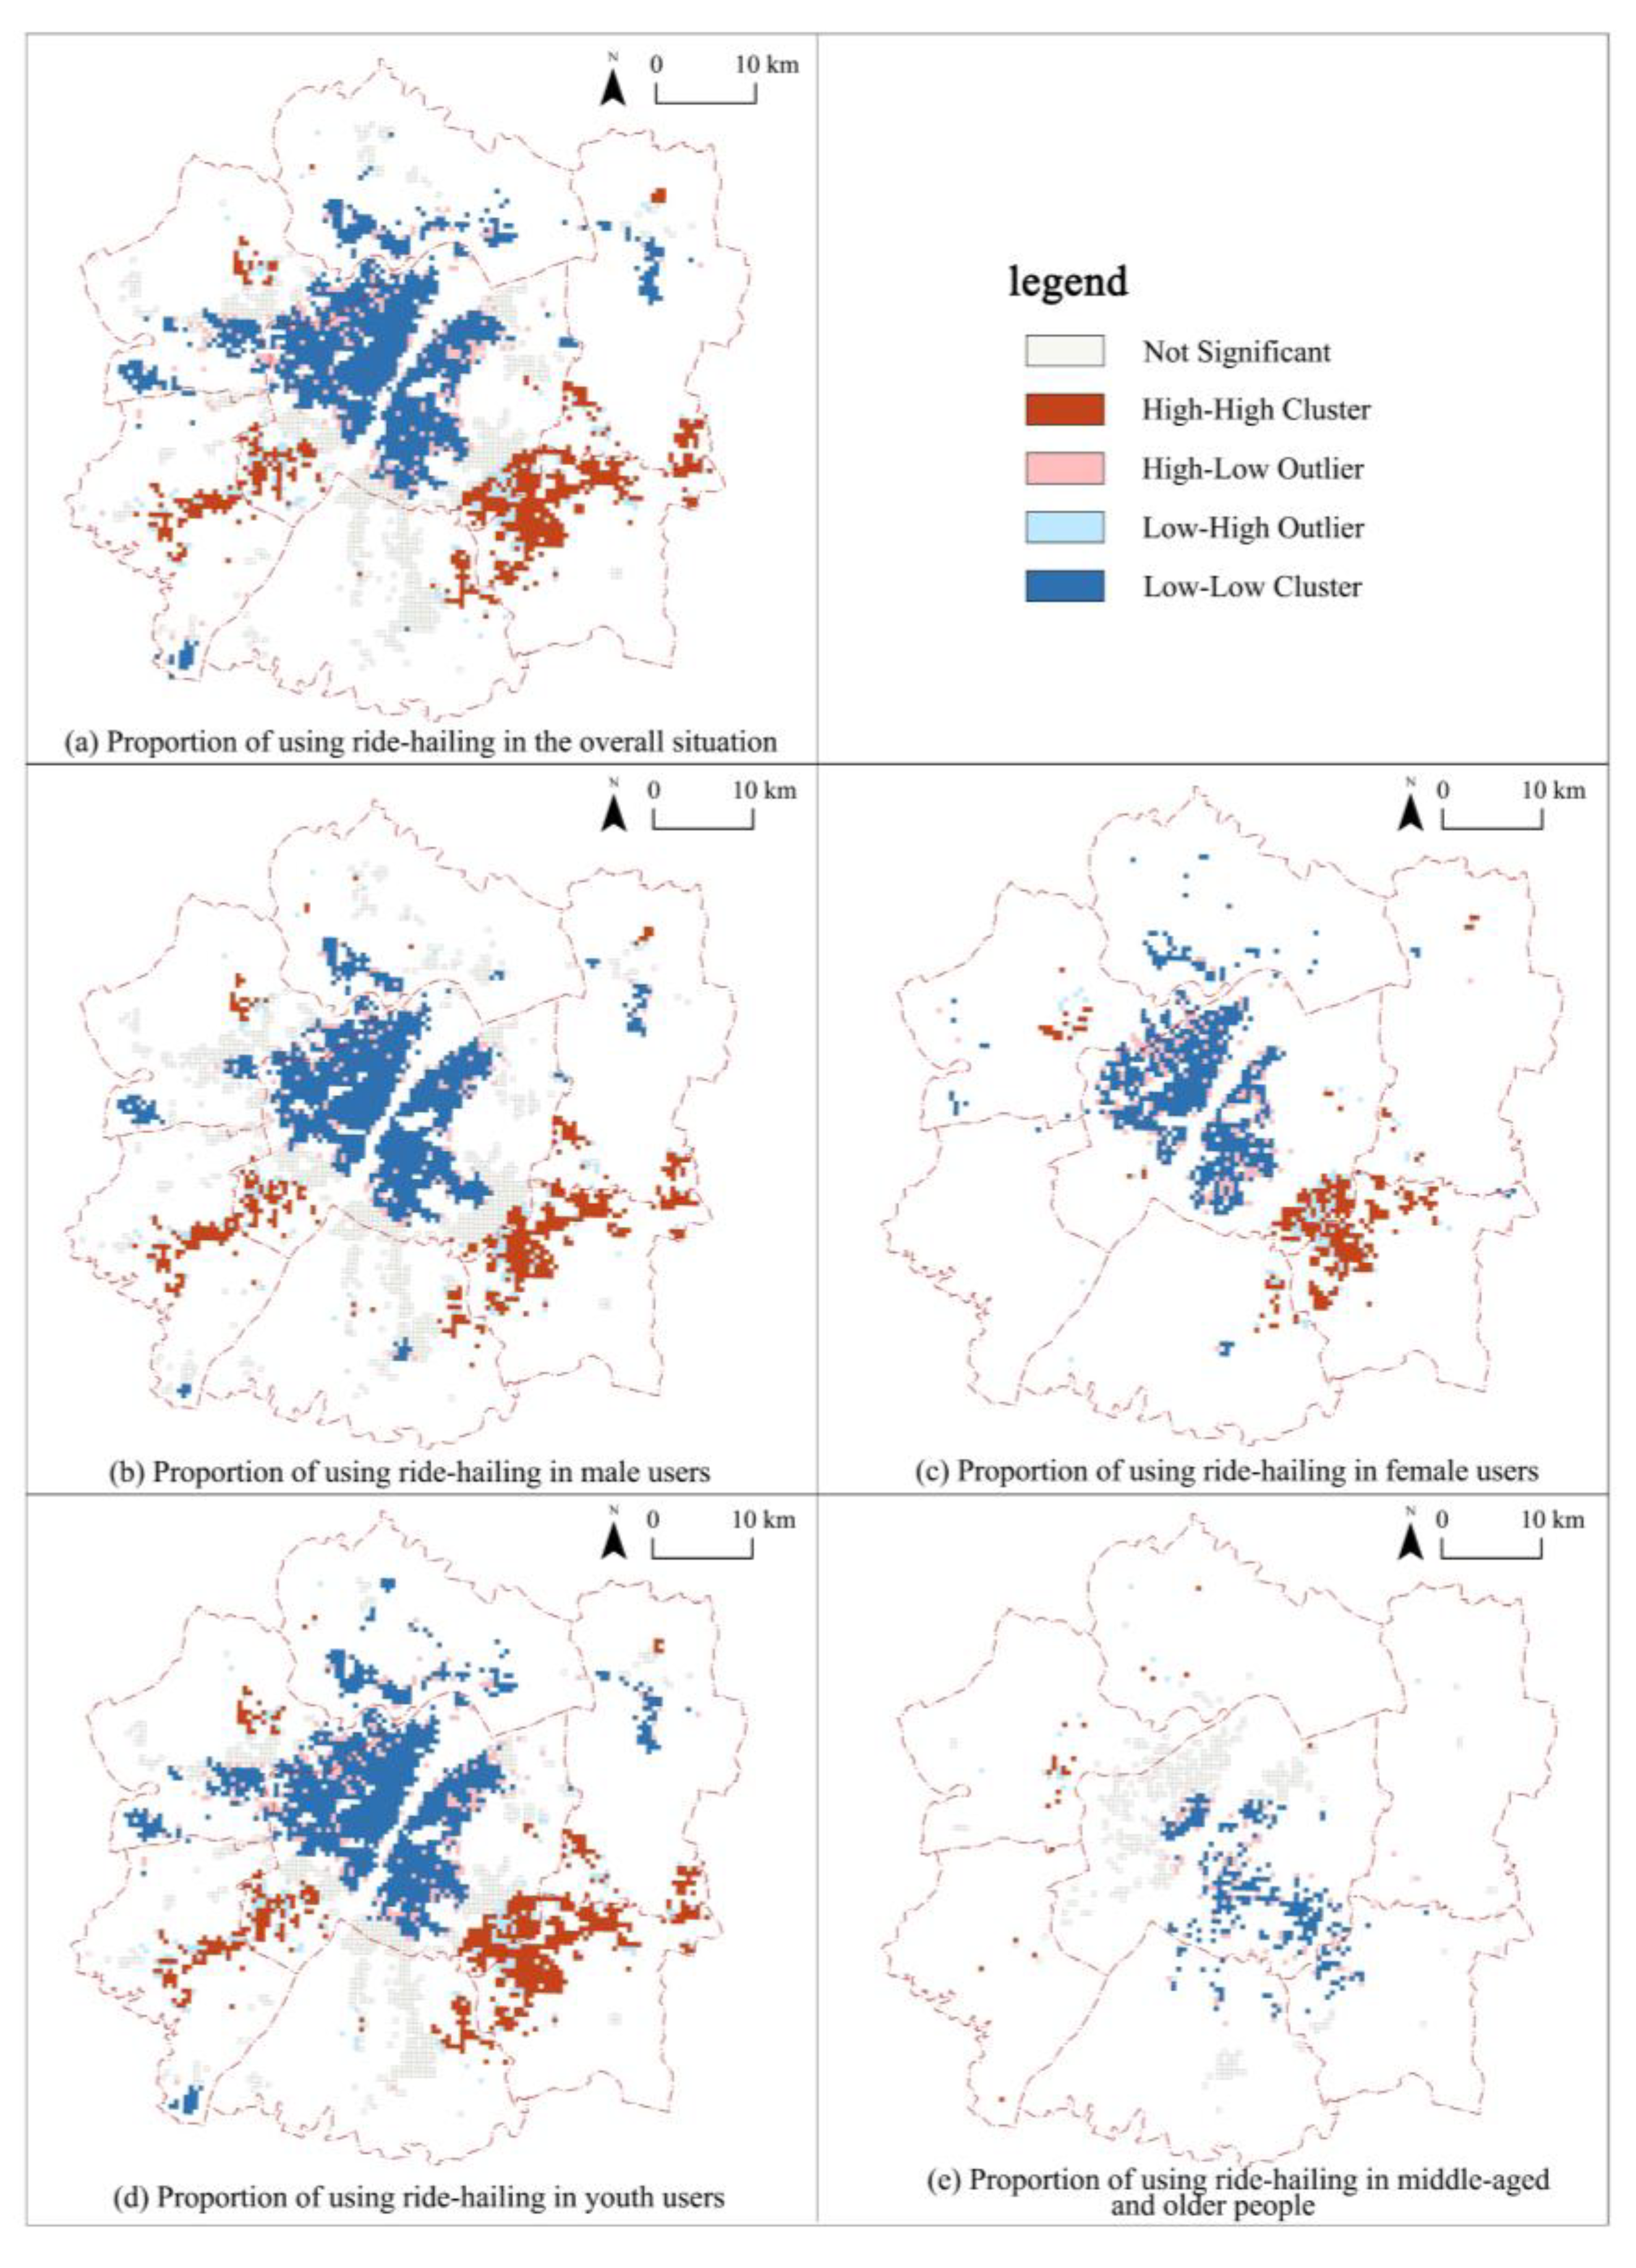
4.1.2. The Spatial Agglomeration Characteristics of Ride-Hailing Usage
4.2. The Relationship between Ride-Hailing and PTS and Its Differences
4.2.1. Impact of Regional Differences
4.2.2. Impact of Population Attribute Differences
5. Conclusions and Discussion
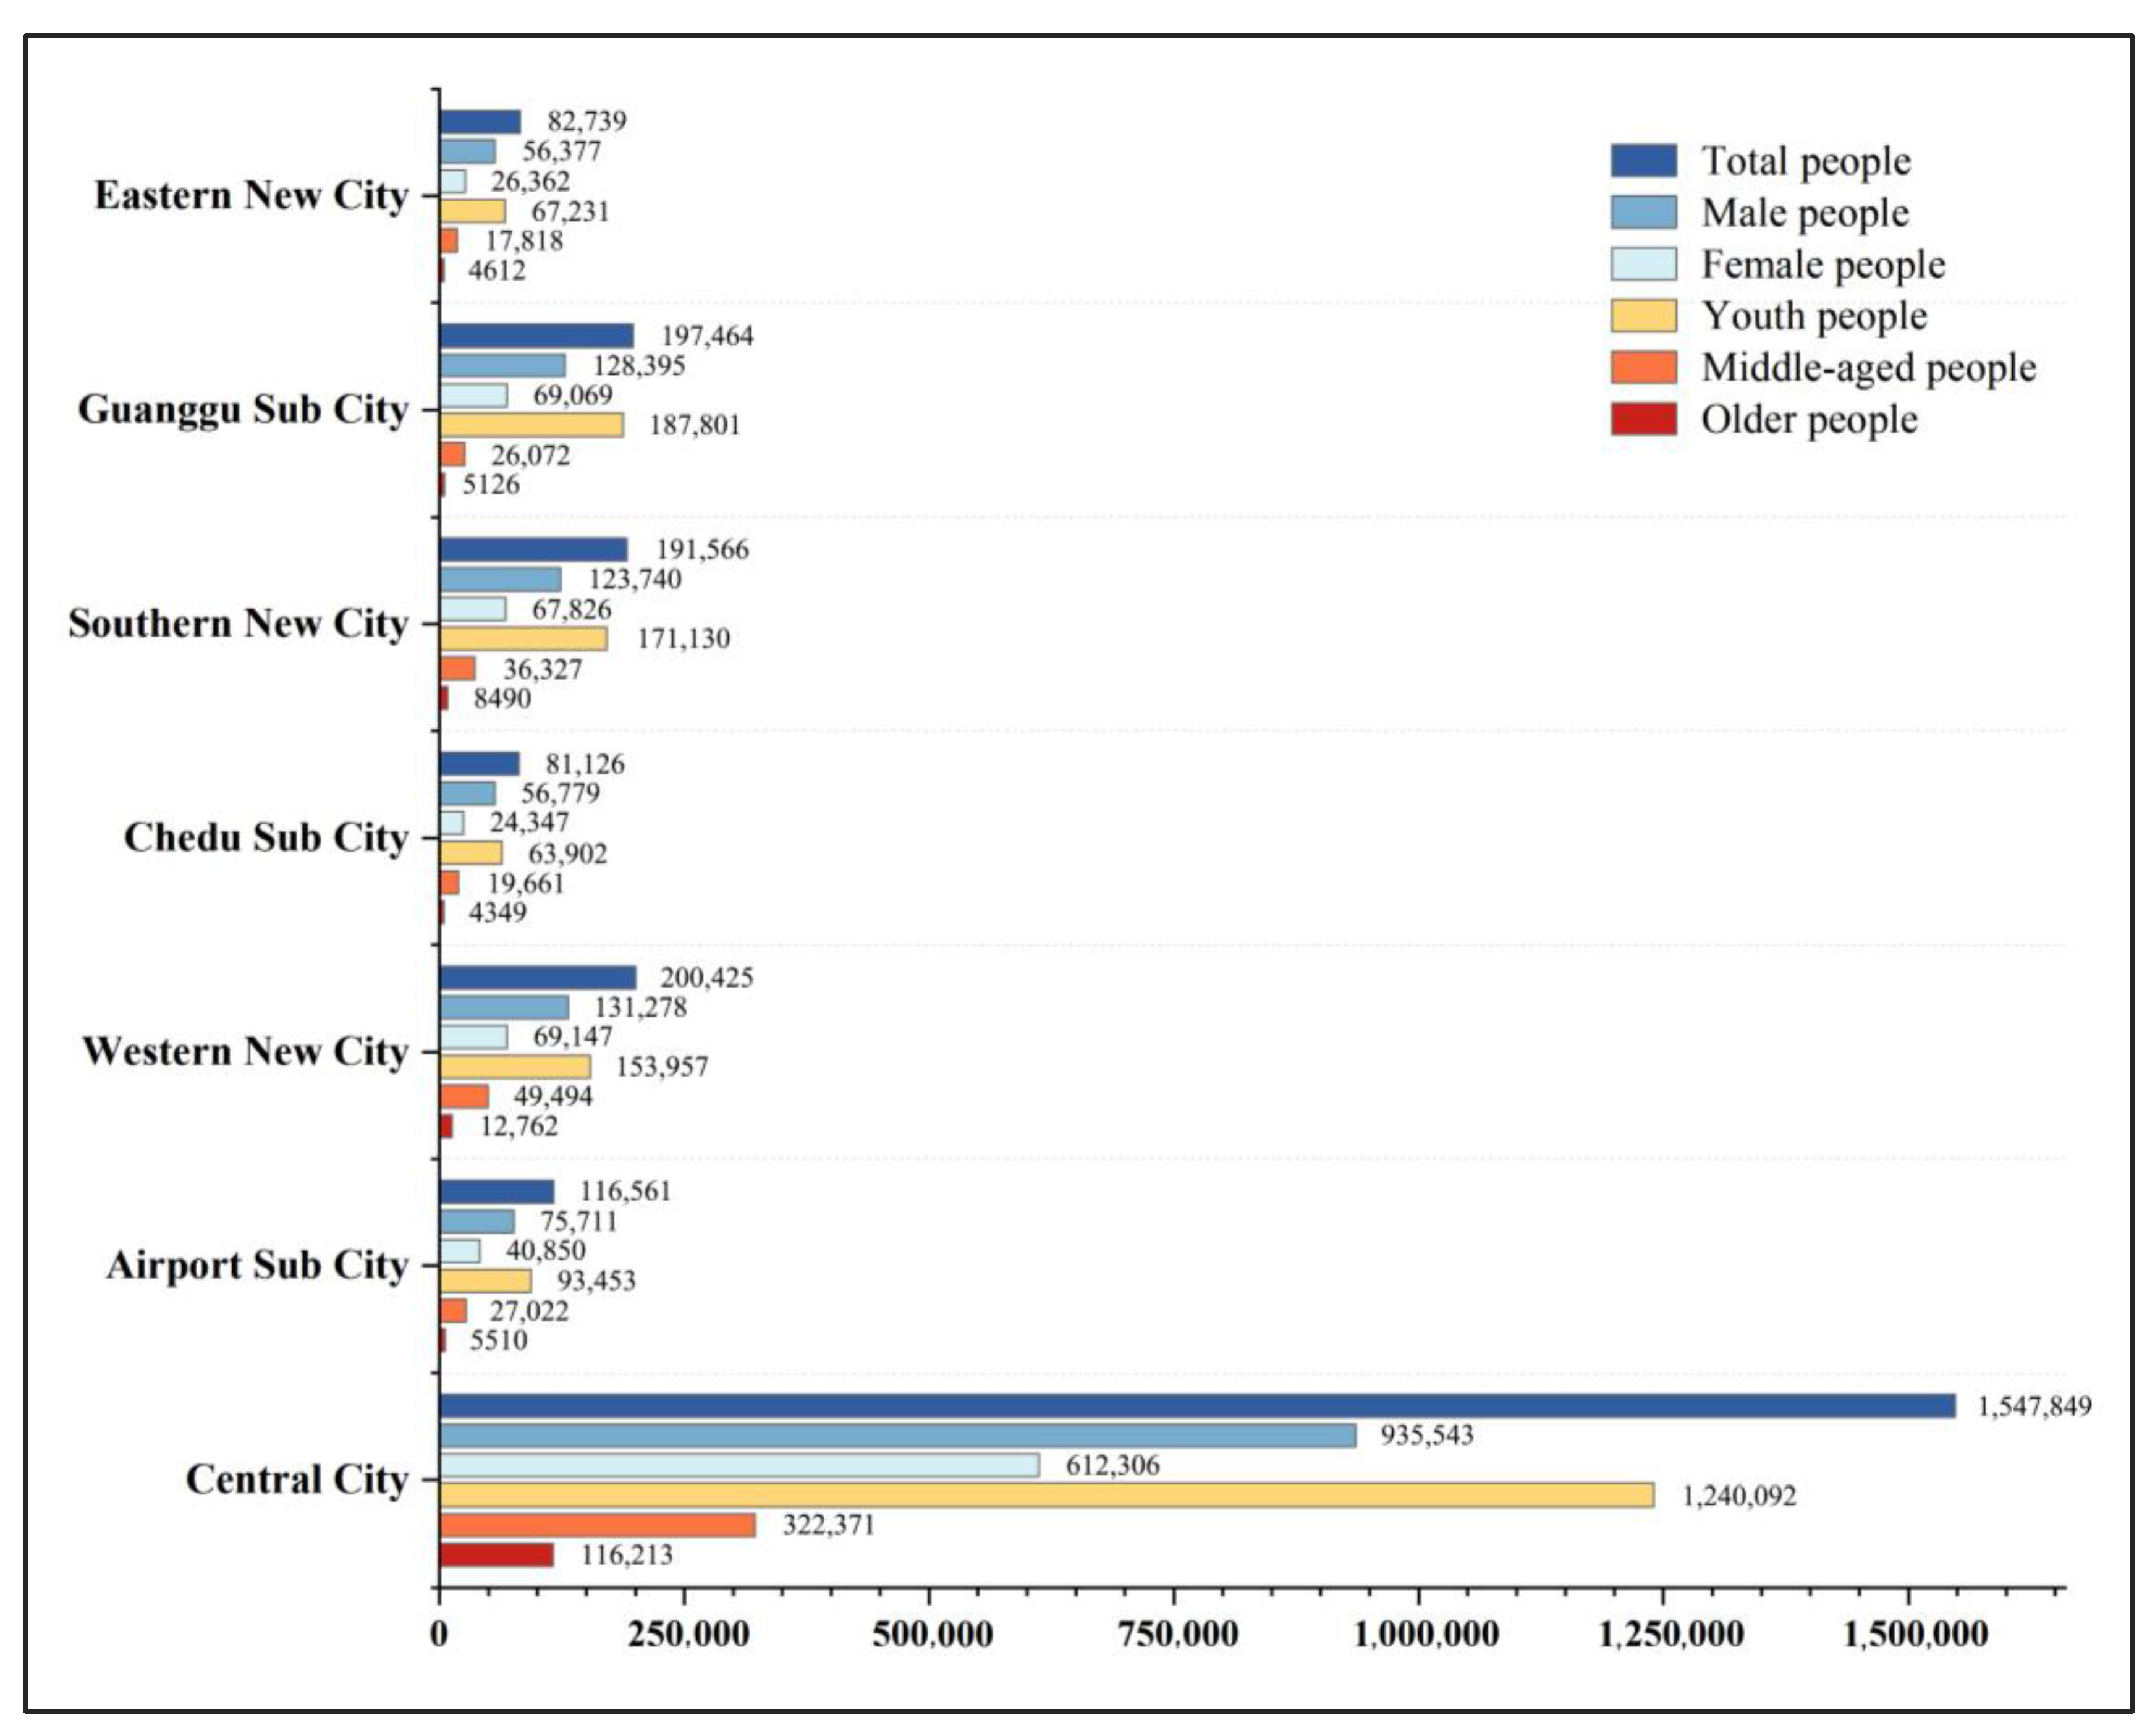
- Compared to the central city, many areas in the suburbs have more users and longer usage periods of ride-hailing, and residents of suburban new towns used ride-hailing more than those in the central city. More males, females, and youths in suburban new towns use ride-hailing than in central urban areas, while more middle-aged and elderly people in central urban areas use ride-hailing than in suburban new towns.
- In terms of spatial distribution characteristics, the number of people using ride-hailing apps under different circumstances shows a small clustering characteristic distribution in suburban areas. The hot spots of clustering are mainly distributed in suburban new towns and areas close to new towns, while the cold spots are mostly distributed in central urban areas, indicating that residents in suburban new towns are more inclined to use ride-hailing to complete their travel activities.
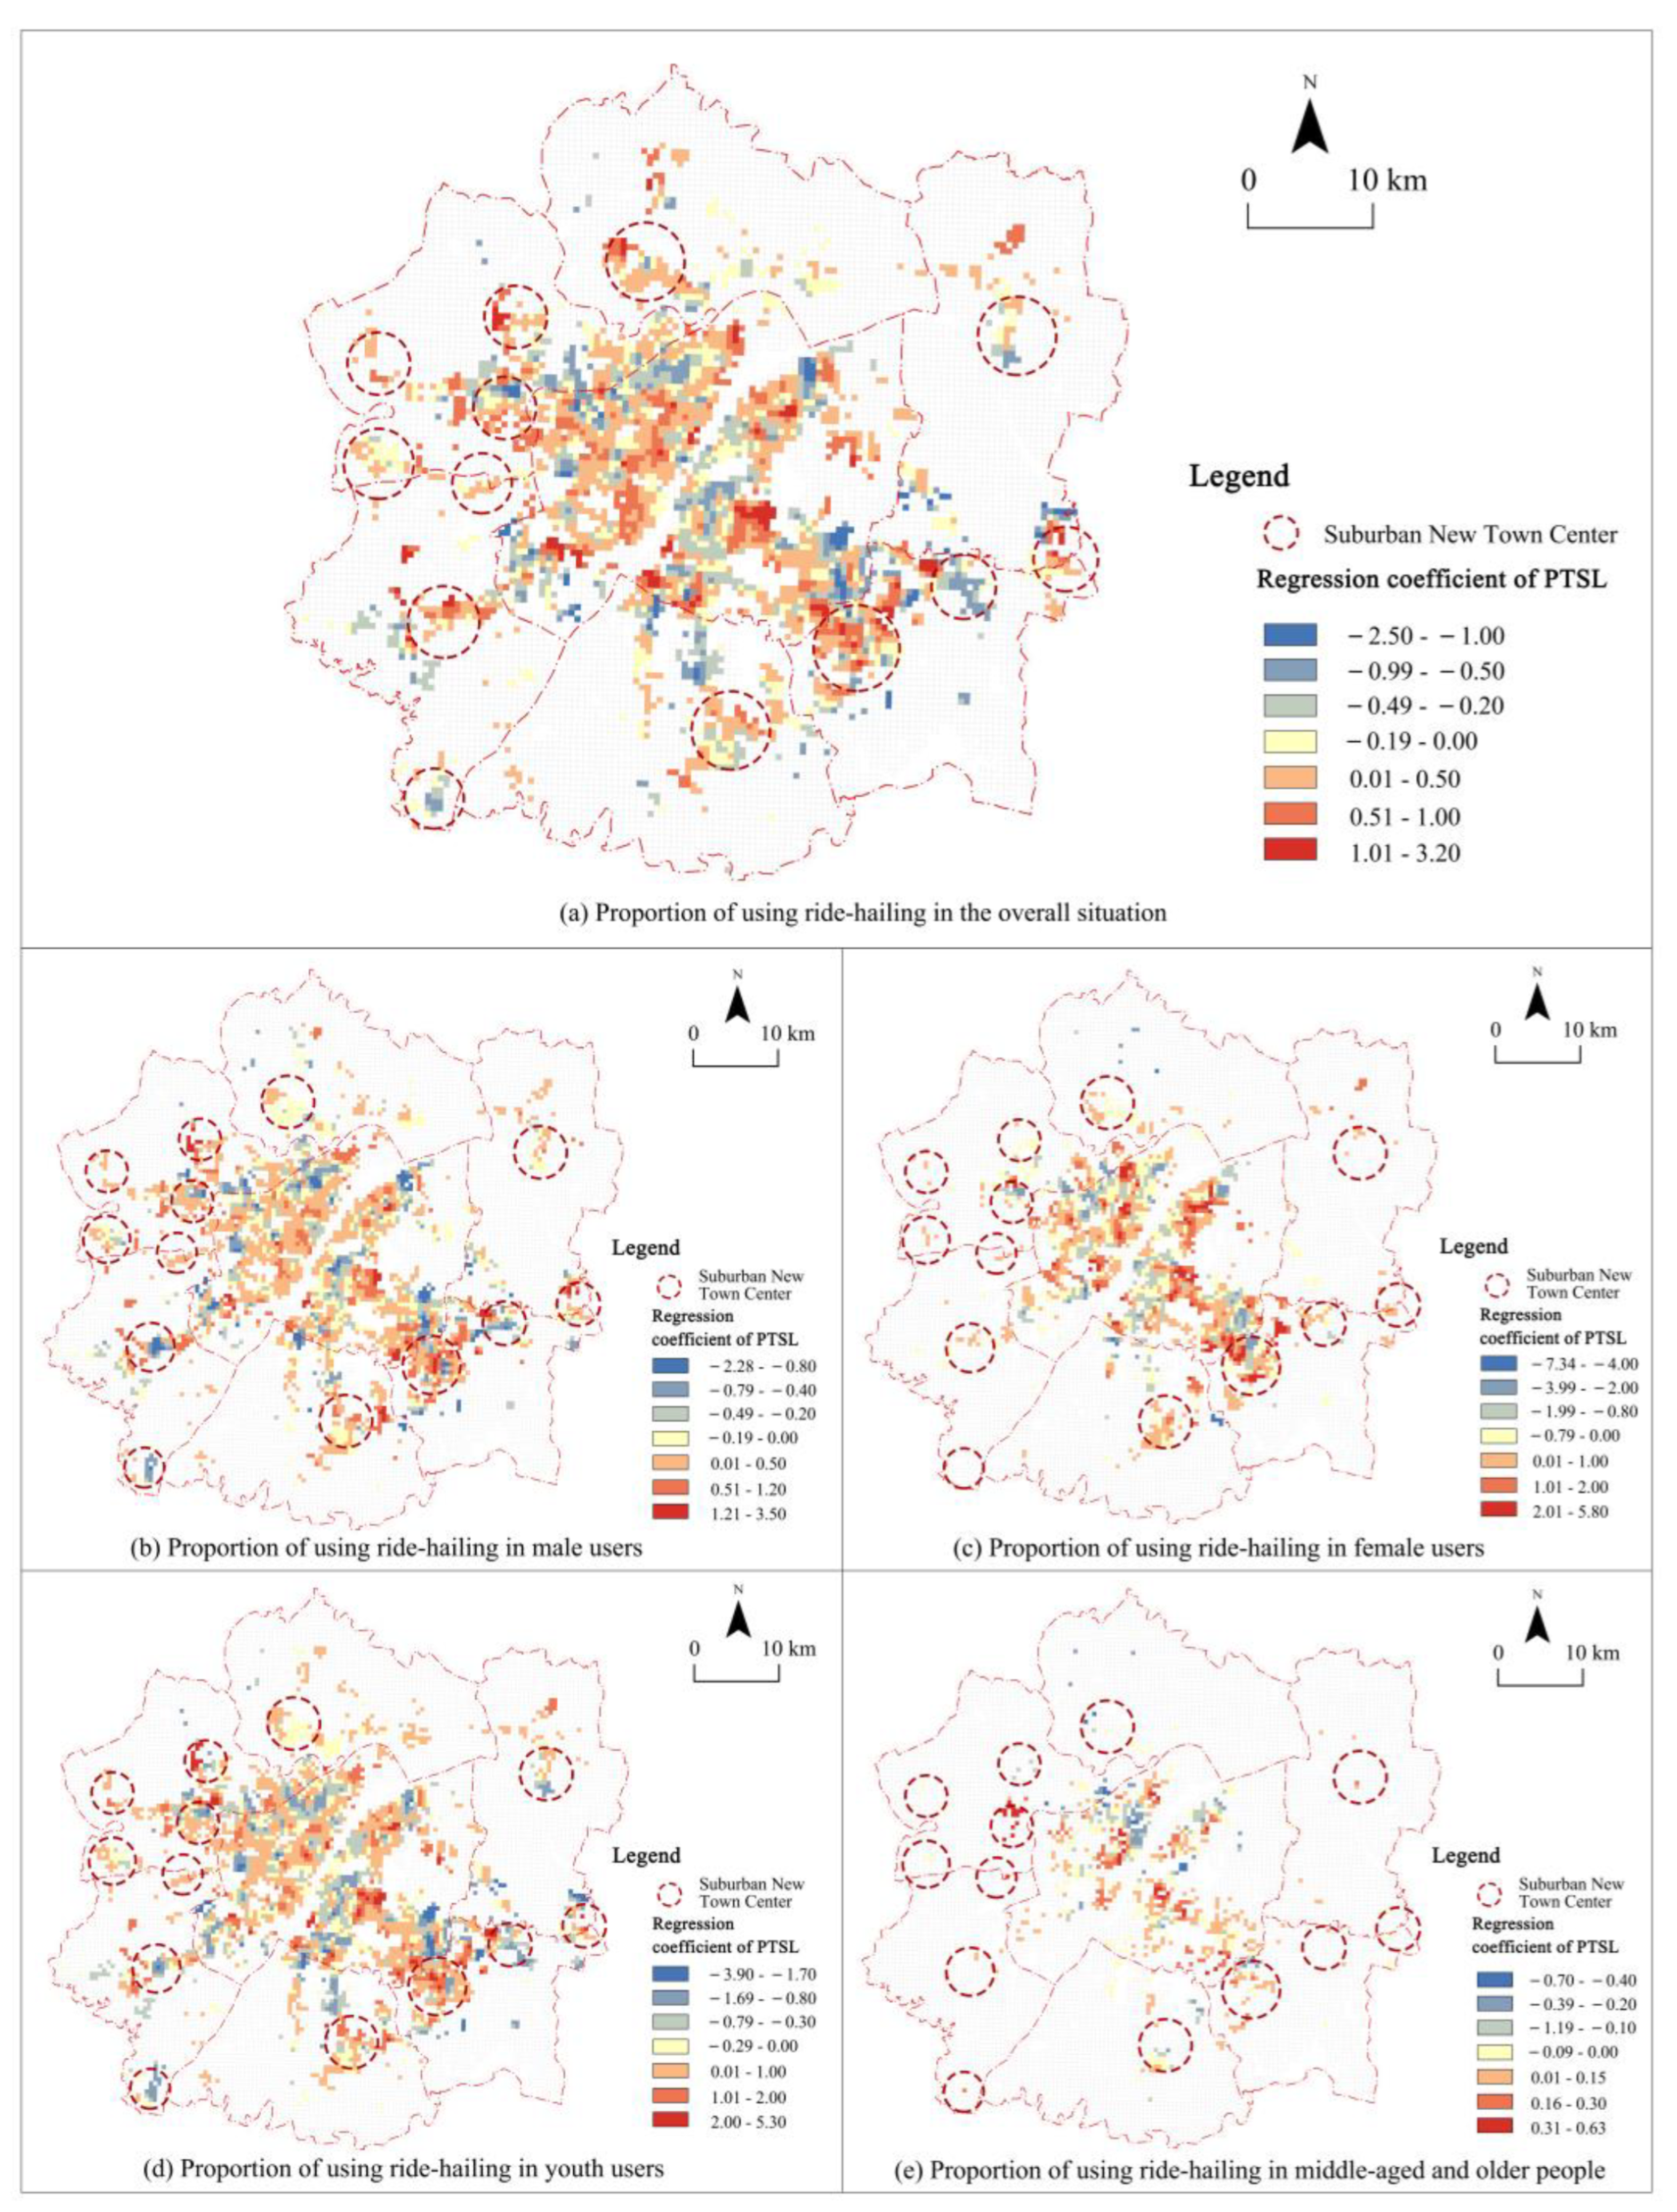
- The regression results show that in suburban areas, higher public transportation time cost consumption is positively correlated with more use of ride-hailing, which means that residents in suburban areas with lower PTSL are more likely to use ride-hailing, and when PTS is lacking, ride-hailing plays a complementary role. There are regional differences in this complementary effect, which is more prominent in high-tech industrial areas and less pronounced in traditional industrial and old residential areas. It also has gender and age differences, with a greater effect on female users than male users, and a greater complementary effect on young users than middle-aged and older users.
Author Contributions
Funding
Data Availability Statement
Conflicts of Interest
References
- Polzin, S.E. Transportation/Land-Use Relationship: Public Transit’s Impact on Land Use. J. Urban Plan. Dev. 1999, 125, 135–151. [Google Scholar] [CrossRef]
- Su, H.; Wu, J.H.; Tan, Y.; Bao, Y.; Song, B.; He, X. A land use and transportation integration method for land use allocation and transportation strategies in China. Transp. Res. Part A Policy Pract. 2014, 69, 329–353. [Google Scholar] [CrossRef]
- Governa, F.; Sampieri, A. Urbanisation processes and new towns in contemporary China: A critical understanding from a decentred view. Urban Stud. 2020, 57, 366–382. [Google Scholar] [CrossRef]
- Long Ying, W.k. Several Realistic Problems of China’s Urbanization: Spatial Expansion, Population Shrinkage, Low Density Human Activity, and Urban Scope Definition. Urban Plan. Forum 2016, 2, 72–77. [Google Scholar] [CrossRef]
- Krugman, P. Urban concentration: The role of increasing returns and transport costs. Int. Reg. Sci. Rev. 1996, 19, 5–30. [Google Scholar] [CrossRef]
- Ahmed, Q.I.; Lu, H.; Ye, S. Urban transportation and equity: A case study of Beijing and Karachi. Transp. Res. Part A Policy Pract. 2008, 42, 125–139. [Google Scholar] [CrossRef]
- Zhao, P. The determinants of the commuting burden of low-income workers: Evidence from Beijing. Environ. Plan. A Econ. Space 2015, 47, 1736–1755. [Google Scholar] [CrossRef]
- Das, S.; Boruah, A.; Banerjee, A.; Raoniar, R.; Nama, S.; Maurya, A.K. Impact of COVID-19: A radical modal shift from public to private transport mode. Transp. Policy 2021, 109, 1–11. [Google Scholar] [CrossRef]
- Mashrur, S.M.; Wang, K.; Habib, K.N. Will COVID-19 be the end for the public transit? Investigating the impacts of public health crisis on transit mode choice. Transp. Res. Part A Policy Pract. 2022, 164, 352–378. [Google Scholar] [CrossRef]
- Brown, A. Redefining Car Access Ride-Hail Travel and Use in Los Angeles. J. Am. Plan. Assoc. 2019, 85, 83–95. [Google Scholar] [CrossRef]
- Tang, B.J.; Li, X.Y.; Yu, B.Y.; Wei, Y.M. How app-based ride-hailing services influence travel behavior: An empirical study from China. Int. J. Sustain. Transp. 2020, 14, 554–568. [Google Scholar] [CrossRef]
- Anderson, D.N. “Not just a taxi”? For-profit ridesharing, driver strategies, and VMT. Transportation 2014, 41, 1099–1117. [Google Scholar] [CrossRef] [Green Version]
- Gloss, M.; McGregor, M.; Brown, B. Designing for Labour: Uber and the On-Demand Mobile Workforce. In Proceedings of the 34th Annual CHI Conference on Human Factors in Computing Systems (CHI4GOOD), San Jose, CA, USA, 7–12 May 2016; pp. 1632–1643. [Google Scholar]
- Rayle, L.; Dai, D.; Chan, N.; Cervero, R.; Shaheen, S. Just a better taxi? A survey-based comparison of taxis, transit, and ridesourcing services in San Francisco. Transp. Policy 2016, 45, 168–178. [Google Scholar] [CrossRef] [Green Version]
- Jin, S.T.; Kong, H.; Wu, R.; Sui, D.Z. Ridesourcing, the sharing economy, and the future of cities. Cities 2018, 76, 96–104. [Google Scholar] [CrossRef]
- Kong, H.; Zhang, X.; Zhao, J. How does ridesourcing substitute for public transit? A geospatial perspective in Chengdu, China. J. Transp. Geogr. 2020, 86, 102769. [Google Scholar] [CrossRef]
- Shen, J.; Wu, F.L. Moving to the suburbs: Demand-side driving forces of suburban growth in China. Environ. Plan. A Econ. Space 2013, 45, 1823–1844. [Google Scholar] [CrossRef]
- Song, Y.; Chen, B.; Kwan, M.-P. How does urban expansion impact people’s exposure to green environments? A comparative study of 290 Chinese cities. J. Clean. Prod. 2020, 246, 119018. [Google Scholar] [CrossRef]
- Wirth, L. Urbanism as a Way of Life. Am. J. Sociol. 1938, 44, 1–24. [Google Scholar] [CrossRef] [Green Version]
- Mieszkowski, P.; Mills, E.S. The Causes of Metropolitan Suburbanization. J. Econ. Perspect. 1993, 7, 135–147. [Google Scholar] [CrossRef] [Green Version]
- Long, Y. Urban Spatial Development, Quality and Vibrancy of New Areas. Urban Plan. Int. 2017, 32, 6–9. [Google Scholar] [CrossRef]
- Zou, Y.; Zhao, W. Making a new area in Xiong’an: Incentives and challenges of China’s “Millennium Plan”. Geoforum 2018, 88, 45–48. [Google Scholar] [CrossRef]
- Shen, J.; Wu, F.L. The Suburb as a Space of Capital Accumulation: The Development of New Towns in Shanghai, China. Antipode 2017, 49, 761–780. [Google Scholar] [CrossRef]
- Li, Z.G.; Chen, Y.Y.; Wu, R. The assemblage and making of suburbs in post-reform China: The case of Guangzhou. Urban Geogr. 2020, 41, 990–1009. [Google Scholar] [CrossRef]
- Qiao, S.; Yeh, A.G.O. Is ride-hailing a valuable means of transport in newly developed areas under TOD-oriented urbanization in China? Evidence from Chengdu City. J. Transp. Geogr. 2021, 96, 103183. [Google Scholar] [CrossRef]
- Wu, W. Urban Amenity, Quality of Life and Urban Development. Urban Plan. Forum 2010, 2010, 71–75. [Google Scholar]
- Yang, H.; Huo, J.; Pan, R.; Xie, K.; Zhang, W.; Luo, X. Exploring built environment factors that influence the market share of ridesourcing service. Appl. Geogr. 2022, 142, 102699. [Google Scholar] [CrossRef]
- Sabogal-Cardona, O.; Oviedo, D.; Scholl, L.; Crotte, A.; Bedoya-Maya, F. Not my usual trip: Ride-hailing characterization in Mexico City. Travel Behav. Soc. 2021, 25, 233–245. [Google Scholar] [CrossRef]
- Wright, S.; Nelson, J.D.; Cottrill, C.D. MaaS for the suburban market: Incorporating carpooling in the mix. Transp. Res. Part A Policy Pract. 2020, 131, 206–218. [Google Scholar] [CrossRef]
- Acheampong, R.A.; Siiba, A.; Okyere, D.K.; Tuffour, J.P. Mobility-on-demand: An empirical study of internet-based ride-hailing adoption factors, travel characteristics and mode substitution effects. Transp. Res. Part C Emerg. Technol. 2020, 115, 102638. [Google Scholar] [CrossRef]
- Lee, Y.; Chen, G.Y.-H.; Circella, G.; Mokhtarian, P.L. Substitution or complementarity? A latent-class cluster analysis of ridehailing impacts on the use of other travel modes in three southern U.S. cities. Transp. Res. Part D Transp. Environ. 2022, 104, 103167. [Google Scholar] [CrossRef]
- Clewlow, R.R.; Mishra, G.S. Disruptive Transportation: The Adoption, Utilization, and Impacts of Ride-Hailing in the United States. Institute of Transportation Studies, University of California, Davis, Research Report UCD-ITS-RR-17-0. 2017. Available online: https://escholarship.org/uc/item/82w2z91j (accessed on 20 January 2023).
- Yandex. Carsharing in Moscow. Available online: https://yandex.ru/company/researches/2021/drive (accessed on 1 February 2023).
- Murphy, C. Shared Mobility and the Transformation of Public Transit. Available online: https://www.apta.com/resources/reportsandpublications/Documents/APTA-Shared-Mobility.pdf (accessed on 1 February 2023).
- Azimi, G.; Rahimi, A.; Jin, X. Exploring the attitudes of Millennials and Generation Xers toward ridesourcing services. Transportation 2022, 49, 1765–1799. [Google Scholar] [CrossRef]
- Conway, M.W.; Salon, D.; King, D.A. Trends in Taxi Use and the Advent of Ridehailing, 1995–2017: Evidence from the US National Household Travel Survey. Urban Sci. 2018, 2, 79. [Google Scholar] [CrossRef] [Green Version]
- Tirachini, A.; del Rio, M. Ride-hailing in Santiago de Chile: Users’ characterization and effects on travel behavior. Transp. Policy 2019, 82, 46–57. [Google Scholar] [CrossRef]
- Niu, Q.; Zhang, H.; Wu, L.; Zou, W. Urban-suburban heterogeneity of mobile office development in recent years: Based on mobile office app usage big data of China Unicom users in Wuhan in 2019 and 2021. Prog. Geogr. 2022, 41, 1428–1439. [Google Scholar] [CrossRef]
- Wang, S.; Noland, R.B. Variation in ride-hailing trips in Chengdu, China. Transp. Res. Part D Transp. Environ. 2021, 90, 102596. [Google Scholar] [CrossRef]
- Yu, H.; Peng, Z.-R. Exploring the spatial variation of ridesourcing demand and its relationship to build environment and socioeconomic factors with the geographically weighted Poisson regression. J. Transp. Geogr. 2019, 75, 147–163. [Google Scholar] [CrossRef]
- Li, X.; Xu, J.; Du, M.; Liu, D.; Kwan, M.-P. Understanding the spatiotemporal variation of ride-hailing orders under different travel distances. Travel Behav. Soc. 2023, 32, 100581. [Google Scholar] [CrossRef]
- Zheng, Z.; Zhang, J.; Zhang, L.; Li, M.; Rong, P.; Qin, Y. Understanding the impact of the built environment on ride-hailing from a spatio-temporal perspective: A fine-scale empirical study from China. Cities 2022, 126, 103706. [Google Scholar] [CrossRef]
- Jing, P.; Chen, Y.; Wang, X.; Pan, K.; Yuan, D. Evaluating the effectiveness of Didi ride-hailing security measures: An integration model. Transp. Res. Part F Traffic Psychol. Behav. 2021, 76, 139–166. [Google Scholar] [CrossRef]
- Liu, Y.; Gao, Q.; Rau, P.-L.P. Chinese passengers’ security perceptions of ride-hailing services: An integrated approach combining general and situational perspectives. Travel Behav. Soc. 2022, 26, 250–269. [Google Scholar] [CrossRef]
- Niehaves, B.; Plattfaut, R. Internet adoption by the elderly: Employing IS technology acceptance theories for understanding the age-related digital divide. Eur. J. Inf. Syst. 2014, 23, 708–726. [Google Scholar] [CrossRef] [Green Version]
- Yang, J.H.; Du, P. Gender, capital endowment and digital exclusion of older people in China. Ageing Soc. 2021, 41, 2502–2526. [Google Scholar] [CrossRef]
- Cheng, L.; Chen, X.W.; Yang, S.; Wu, J.X.; Yang, M. Structural equation models to analyze activity participation, trip generation, and mode choice of low-income commuters. Transp. Lett. 2019, 11, 341–349. [Google Scholar] [CrossRef]
- Jittrapirom, P.; Marchau, V.; van der Heijden, R.; Meurs, H. Future implementation of mobility as a service (MaaS): Results of an international Delphi study. Travel Behav. Soc. 2020, 21, 281–294. [Google Scholar] [CrossRef] [Green Version]


| Name of Ride-Hailing Apps | Release Date | Number of App Users Recorded by the Platform (Person) |
|---|---|---|
| DiDi Chuxing | 2012.9 | 1,117,432 |
| T3 Chuxing | 2019.7 | 165,349 |
| Huaxiaozhu | 2020.3 | 34,127 |
| CaoCao Chuxing | 2015.11 | 22,499 |
| CaoCao Private car | 2015.11 | 17,867 |
| Wanshun Calling | 2017.3 | 17,727 |
| Shouyue | 2015.9 | 5924 |
| Shenzhou Private car | 2015.1 | 4518 |
| Xiangdao Chuxing | 2018.11 | 940 |
| RuQi Chuxing | 2019.6 | 435 |
| Variable Name | Moran’s I | Z-Score | Value p |
|---|---|---|---|
| in the overall situation | 0.269929 | 112.215563 | *** |
| in male users | 0.299457 | 91.932719 | *** |
| in female users | 0.192515 | 67.568236 | *** |
| in youth users | 0.310721 | 130.811306 | *** |
| in middle-aged and older people | 0.019787 | 8.033488 | *** |
| Models | Regression Coefficient | AICc | Sigma | R2 | R2 Adjusted | ||
|---|---|---|---|---|---|---|---|
| PTSL | Per Capita Road Length | Number of Commercial Facilities Per Capita | |||||
| OLS (The overall situation) | 0.076 *** | 0.003 *** | −0.006 | −7578.59 | 0.071 | 0.21 | 0.21 |
| OLS (Male users) | 0.108 *** | 0.003 *** | −0.007 | −7061.06 | 0.067 | 0.29 | 0.29 |
| OLS (Female users) | 0.180 *** | 0.009 *** | −0.038 *** | −2688.97 | 0.114 | 0.17 | 0.17 |
| OLS (Youth users) | 0.161 *** | 0.004 *** | −0.006 | −5277.31 | 0.098 | 0.25 | 0.24 |
| OLS (Middle-aged and older people) | 0.029 *** | 0.010 *** | −0.009 | −3280.33 | 0.026 | 0.63 | 0.63 |
| SDM (The overall situation) | 0.114 *** | 0.002 *** | - | −8456.16 | 0.057 | 0.45 | - |
| SDM (Male users) | 0.106 *** | 0.002 *** | - | −7462.63 | 0.059 | 0.43 | - |
| SEM (Female users) | 0.156 *** | 0.008 *** | −0.038 | −2997.11 | 0.100 | 0.32 | - |
| SDM (Youth users) | 0.140 *** | 0.003 *** | - | −5756.00 | 0.085 | 0.42 | - |
| SEM (Middle-aged and older people) | 0.031 *** | 0.207 *** | - | −3300.77 | 0.025 | 0.64 | - |
| GWR (The overall situation) | 0.057 *** (Average value) | 0.002 *** (Average value) | - | −5459.99 | 0.053 | 0.74 | 0.57 |
| GWR (Male users) | 0.072 *** (Average value) | 0.002 *** (Average value) | - | −5545.29 | 0.046 | 0.79 | 0.64 |
| GWR (Female users) | 0.090 *** (Average value) | 0.005 *** (Average value) | 0.039 *** (Average value) | −1789.12 | 0.089 | 0.71 | 0.43 |
| GWR (Youth users) | 0.102 *** (Average value) | 0.003 *** (Average value) | - | −4003.97 | 0.071 | 0.70 | 0.49 |
| GWR (Middle-aged and older people) | 0.014 *** (Average value) | 0.015 *** (Average value) | - | −2171.23 | 0.041 | 0.47 | 0.13 |
Disclaimer/Publisher’s Note: The statements, opinions and data contained in all publications are solely those of the individual author(s) and contributor(s) and not of MDPI and/or the editor(s). MDPI and/or the editor(s) disclaim responsibility for any injury to people or property resulting from any ideas, methods, instructions or products referred to in the content. |
© 2023 by the authors. Licensee MDPI, Basel, Switzerland. This article is an open access article distributed under the terms and conditions of the Creative Commons Attribution (CC BY) license (https://creativecommons.org/licenses/by/4.0/).
Share and Cite
Zou, W.; Wu, L.; Chang, Y.; Niu, Q. Is Ride-Hailing an Effective Tool for Improving Transportation Services in Suburban New Towns in China? Evidence from Wuhan Unicom Users’ Mobile Phone Usage Big Data. ISPRS Int. J. Geo-Inf. 2023, 12, 299. https://doi.org/10.3390/ijgi12080299
Zou W, Wu L, Chang Y, Niu Q. Is Ride-Hailing an Effective Tool for Improving Transportation Services in Suburban New Towns in China? Evidence from Wuhan Unicom Users’ Mobile Phone Usage Big Data. ISPRS International Journal of Geo-Information. 2023; 12(8):299. https://doi.org/10.3390/ijgi12080299
Chicago/Turabian StyleZou, Wenjun, Lei Wu, Yunrui Chang, and Qiang Niu. 2023. "Is Ride-Hailing an Effective Tool for Improving Transportation Services in Suburban New Towns in China? Evidence from Wuhan Unicom Users’ Mobile Phone Usage Big Data" ISPRS International Journal of Geo-Information 12, no. 8: 299. https://doi.org/10.3390/ijgi12080299