1. Introduction
The COVID-19 pandemic was declared a global pandemic in March 2020 [
1]. During the first wave, in March and April of 2020, Portugal entered a total lockdown. People were strongly encouraged to stay at home, curfews were put in place, and private and public facilities and workplaces were temporarily closed. The way of transmission of the virus has been close contact and contaminated surfaces, therefore, most governments decided to minimize social contact [
2]. With people’s mobility being a prerequisite for social interaction, the containment and mitigation measures focused on restricting mobility and spatial behavior [
3,
4]. The imposed restrictions reduced the movements of the population at a large scale and changed the existing flows of movements. In April 2020, after the first wave, the Portuguese Ministers approved a plan to release the containment measures. Some measures were dropped and with that, schools, private and public facilities, and workplaces started to open. In September 2020, people were encouraged to return to their normal lives with some limitations and, overall, with some special care [
5]. In 2021 Portugal and other countries started promoting vaccination. As of the end of the year, about 86% of the Portuguese population was fully vaccinated. Since then, the world has experienced several waves due to different variants of COVID-19 [
6].
While the world governments’ actions to overcome the pandemic’s initial waves played a crucial role in reducing the number of cases, they severely affected the global economy [
6]. The pandemic also dealt an extreme blow to the Portuguese economy. In the second quarter of 2020, companies’ activity significantly declined. However, the gradual easing of containment measures since the beginning of May, with a phased reopening in retail and services, led to a gradual and differentiated improvement across sectors [
7]. This crisis had and continues to have tremendous impacts on societies both in the short and long term, including lowering physical activities, increasing working from home, and reducing public transportation usage [
6]. Such changes might result in a revolution in the general economy and mobility.
Human mobility has become a prominent research field over the last decades, mostly due to the growing need to understand how people move and use urban space [
8]. The access to mobile phone datasets offers the possibility to predict and study mobility patterns [
9]. Overall, these ubiquitous data are often used for location analytics to characterize various aspects of human mobility [
10]. The data types can vary widely and be acquired by several means, including via Global System for Mobiles (GSM), Wi-Fi, Bluetooth, or Global Positioning System (GPS) [
11,
12]. In particular, Call Detail Records (CDRs) are a type of GSM data often collected by mobile operators and used to study human movements and social networks. This data type is generated every time a client interacts with the network, providing knowledge on the sent and received calls and text messages [
13]. Moreover, CDRs also give information on the antenna that received/transmitted the communication, enabling the inference of the client’s location at an antenna level. However, contextual information lack in mobile phone data and in some situations it is important to add to the general analysis information about the circumstances under which the movement or activity happened. As mobile phone data only provides locations at an antenna level, crowdsourced data can contain features of the geographical area providing a more meaningful way to understand the semantics of the places (land use or human use of land) and knowledge of the context of the activity [
14,
15]. This data is often collected through digital platforms from large groups to gain insights on multiple subjects. Such databases as Facebook Places or Foursquare contain Points of Interest (POIs) that can provide features for area classification and detect the semantic meaning of meaningful places (those that are frequently visited, such as home and work and other regularly visited places [
16]) [
8]. Compared with typical survey data, with this data, phenomena can be monitored continuously for a long time at a lower cost.
In this article we study human mobility patterns within Portugal, using mobile phone data and crowdsourced data. The goal is to compare mobility and lifestyle changes of the population that were most probably provoked by COVID-19, particularly after the pandemic’s first wave. Also, it is our goal to underline the advantages of using CDRs and crowdsourced data for this type of analysis. So, we compare mobility and routine dynamics in 2020, respectively in the following months after the lifting of the pandemic measures, with the dynamics in the same period of the next year (2021). Instead of using data collected explicitly for the purpose of analyzing mobility, including GPS data [
17,
18] or data from surveys [
7,
19], that demand a huge overhead in its collection, we use anonymized ubiquitous data collected by a leading Portuguese mobile phone operator. The mobile phone data correspond to CDRs obtained between September and October 2020 and between September and October 2021 and belong to nearly 5000 individuals that had registered their residence in the district of Coimbra, Portugal. To complement the analysis and understand some of the changes, we use POIs to interpret the semantics of the places.
As mentioned, the pandemic has caused a shift in the general mobility of the population. On the other hand, changes in the routine location counts may be caused by changes in three potential sources: the built environments, the business regulations, or the preferences of the population. The first one usually depends on the natural evolution of cities. The second one is often caused by situations such as COVID-19 which, for example, has brought a revolution in business regulation. And the third, the consumer preferences change, which could result in patronage changes among businesses that did remain open [
17]. The increase or decrease in the frequency of visits to routine locations may or may not influence the preferences related to the categories of the places visited. However, the combination of a decrease in mobility with a pandemic situation may be a determinant factor to change normal routines and preferences. So, in this article, we seek to understand some of the effects of the pandemic: Has COVID-19 altered the movements and the spatial behavior of the population? If so, has the pandemic altered the visitors’ preferences? How about the preferences related to the means of communication?
During the pandemic’s first waves, mobile phone data were highly used to track, monitor, and assist in modeling the geographical spread of the virus [
20,
21]. However, there is a gap in the literature regarding understanding the effects of the pandemic through the analysis of passively generated mobile phone data. While changes in mobility have been explored alongside changes in the visited routine locations, the two have rarely been studied using mobile phone data and seldom have been linked to offer a more comprehensive view of the changes caused by COVID-19 and to serve as a reference to infer the long-term effects of the pandemic.
This article is structured as follows:
Section 2 presents a brief review of the related work,
Section 3 presents some background and the effects of COVID-19 in Portugal,
Section 4 gives a presentation of the data and their analysis,
Section 5 presents and discusses the analysis made on mobility,
Section 6 gives an overview on the changes in routine locations in both periods analyzed, and
Section 7 presents the conclusions.
2. Literature Review
Planning and managing urban spaces are essential topics to promote smart cities, which depend on reliable and updated data [
22]. Mobile phone data have been used to sense urban dynamics, helping urban planners and designers to cope with urban growth [
14]. Furthermore, various social issues have been endorsed and resolved by analyzing mobile phone data, including CDRs, generated as a result of the pervasiveness of mobile phones. Although CDRs’ temporal density has increased due to the popularity of smartphones in the last decades, these data present some challenges, such as spatial and temporal sparseness, as they are only generated if the individual receives or makes a call or SMS. As a consequence, the amount of in-depth research conducted into mobility and behavior patterns is low compared to studies using GPS data [
23]. However, although GPS data can provide spatio-temporal information with higher frequency and accuracy than CDRs, the high power consumption and the collection and analysis of these detailed data can be overwhelming. Besides the overhead of the collection and analysis of CDRs being inferior, these data do not require any API, battery, memory, or permission of the individual to be collected and have the advantage of being available for all groups of the population [
8,
13].
Despite providing large amounts of spatial data, the limitation in the accuracy of the temporal and spatial dimensions raises some questions about the quality of the data. Although the problem of low sampling remains in CDRs, several authors proved that they can be used to identify patterns of human mobility [
24,
25]. An analysis from Ranjan et al. [
10] observed that CDRs allow the correct identification of meaningful places that account for 90% of the individual’s activity. Additionally, many researchers and institutions are aware of CDRs’ potential in reflecting human mobility and identifying important places [
10,
14]. In fact, multiple studies, such as from Rodrigues et al. [
13] and Zhang et al. [
26], proved that CDRs can be effective in the identification of meaningful places such as home, work, or second home locations.
However, to understand the movements, it is necessary to understand the reasons behind the visit. Certain types of crowdsourced data can be useful to understand how urban space is organized and used. These data are created voluntarily by users, most of the time through mobile applications to provide useful and powerful sources of data for multiple domains. Some types of data include POIs, social media data, taxi trajectories, cell phone usage, check-in activities from Location-Based Social Networks (LBSNs), and even text messages [
22]. Information such as the POIs are often used to give semantic meaning to the locations found. Nevertheless, the quality of the information provided by these data can be strongly influenced by who uses the platforms, APIs, and Social Media.
Graells-Garrido et al. [
14] used CDRs to identify citizens’ meaningful places and to understand land use, using floating population flows in Chile. CDRs were used to identify home and work locations and recreate the population distribution as well as commuting trips. To contextualize their findings, crowdsourced geographical information containing POIs was used to explain the daily rhythms, allowing them to cluster areas of the city from a land use perspective. Ferreira et al. [
8] also used CDRs to identify routine locations and a POIs dataset to explain and classify the locations found.
In a pandemic analysis context, several authors used mobile phone data to understand the short-term effects of the virus on mobility and vice-versa. Satamaria et al. [
27] presented a mobile indicator derived from mobile position data that captures information about mobility patterns of the European population, which can be used to analyze the impact of COVID-19 confinement measures. Results showed that the increase in the contact rate after lifting the lockdown, demonstrated by the increase in mobility, was not automatically reflected in an increase in the number of infections. Also, a study from Heiler et al. [
28] demonstrated the relevance of mobility data for epidemiological studies in real-time, as the usage of mobile phone data permit the moment-by-moment quantification of mobility behavior for a whole country. The results of the study showed that the announcement of restrictions led to a dramatic reduction in mobility and that between an infection in the region of study and the detection of the disease in a new area, 8 days passed.
Regarding the analysis of changes in both mobility and routine locations caused by the pandemic, Sevtsuk et al. [
17] used GPS positioning data from smartphone users to analyze the impact of COVID-19 on trips to urban amenities. The study traces the changes in amenity visits in Somerville, MA from before the pandemic to after the first wave of the pandemic (January 2019 to December 2020). Their findings suggest that amenity-visiting preferences significantly diverged from expected patterns in the first few months of the pandemic. Even though overall trip volumes remained lower than normal levels throughout the remainder of the year, preferences towards amenity-visiting preferences mostly returned to the expected levels by the end of 2020.
Sevtsuk et al. [
18] also examined changes in mobility between residents of the highest and lowest Socio-Economic Index (SEI) at the Census Block Group (CBG) during the COVID-19 pandemic, in the United States, using GPS positioning data. In general, low-SEI groups traveled shorter distances but visited more city-wide CBGs before the pandemic. Contrary, high-SEI residents universally reduced their mobility to a greater extent during the pandemic. Although high-SEI residents were making more trips to parks and healthcare providers and fewer subsistence trips to retail stores already before the pandemic, COVID-19 significantly widened these differences thereby exacerbating “mobility gaps” between low-SEI and high-SEI groups. In the same context, Huang et al. [
29] also studied the social inequality exposed by the pandemic using mobile phone data and the United States CBG. The study reflected how COVID-19 disproportionately affected vulnerable populations. The analysis revealed that lower income groups cannot afford to comply with lockdown orders. Results corroborate the findings of Sevtsuk et al. [
18], which used GPS data: the pandemic exposed social differences between high-SEI and low-SEI, revealing that poor communities tend to show less compliance, as evidenced by their lower levels of time at home and higher rates of mobility than wealthy communities.
Shamshiripour et al. [
19] used data from a survey to study how and to what extent people’s mobility-styles and habitual travel behaviors have changed during the COVID-19 pandemic in Chicago. They also examined whether these changes will persist afterward or will bounce back to the pre-pandemic situation. The survey incorporates a comprehensive set of questions associated with individuals’ travel behaviors, habits, and perceptions before and during the pandemic, as well as their expectations about the future. The analysis showed significant changes in various aspects of people’s mobility behavior, including habits, predispositions, and higher-level orientations towards online activities (i.e., shopping, meetings, and working from home, etc.) and travels (i.e., long-distance commutes and urban travel mode choice) during and after the COVID-19 pandemic.
3. COVID-19 Statistics in Portugal
According to the Portuguese National Statistics Institute [
30], the first deaths associated with the COVID-19 virus were registered in 2020. One year after the beginning of the pandemic, the number of deaths had increased, resulting in an excess of 1925 deaths on average monthly and a decrease of 4.8% of live births compared to the previous five years.
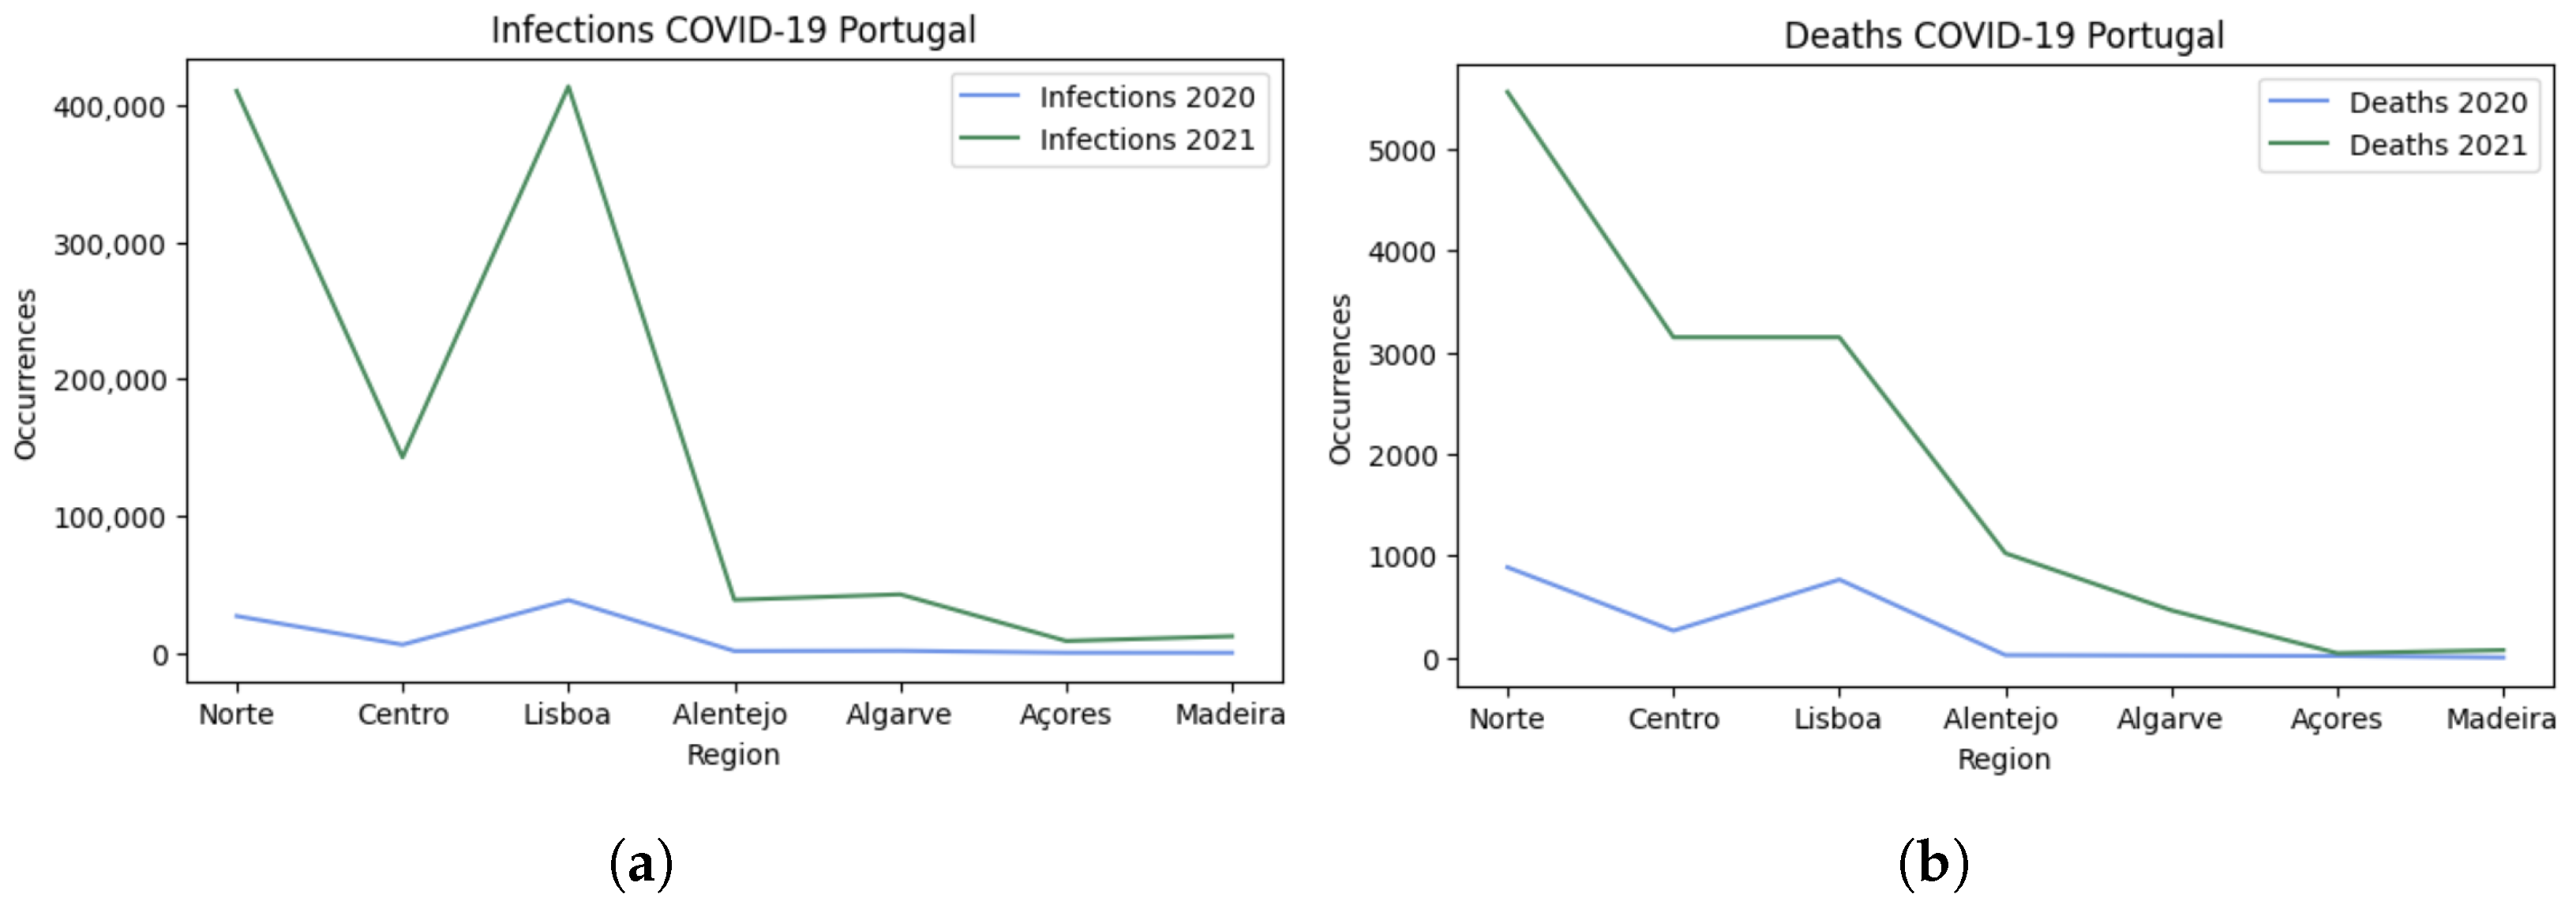
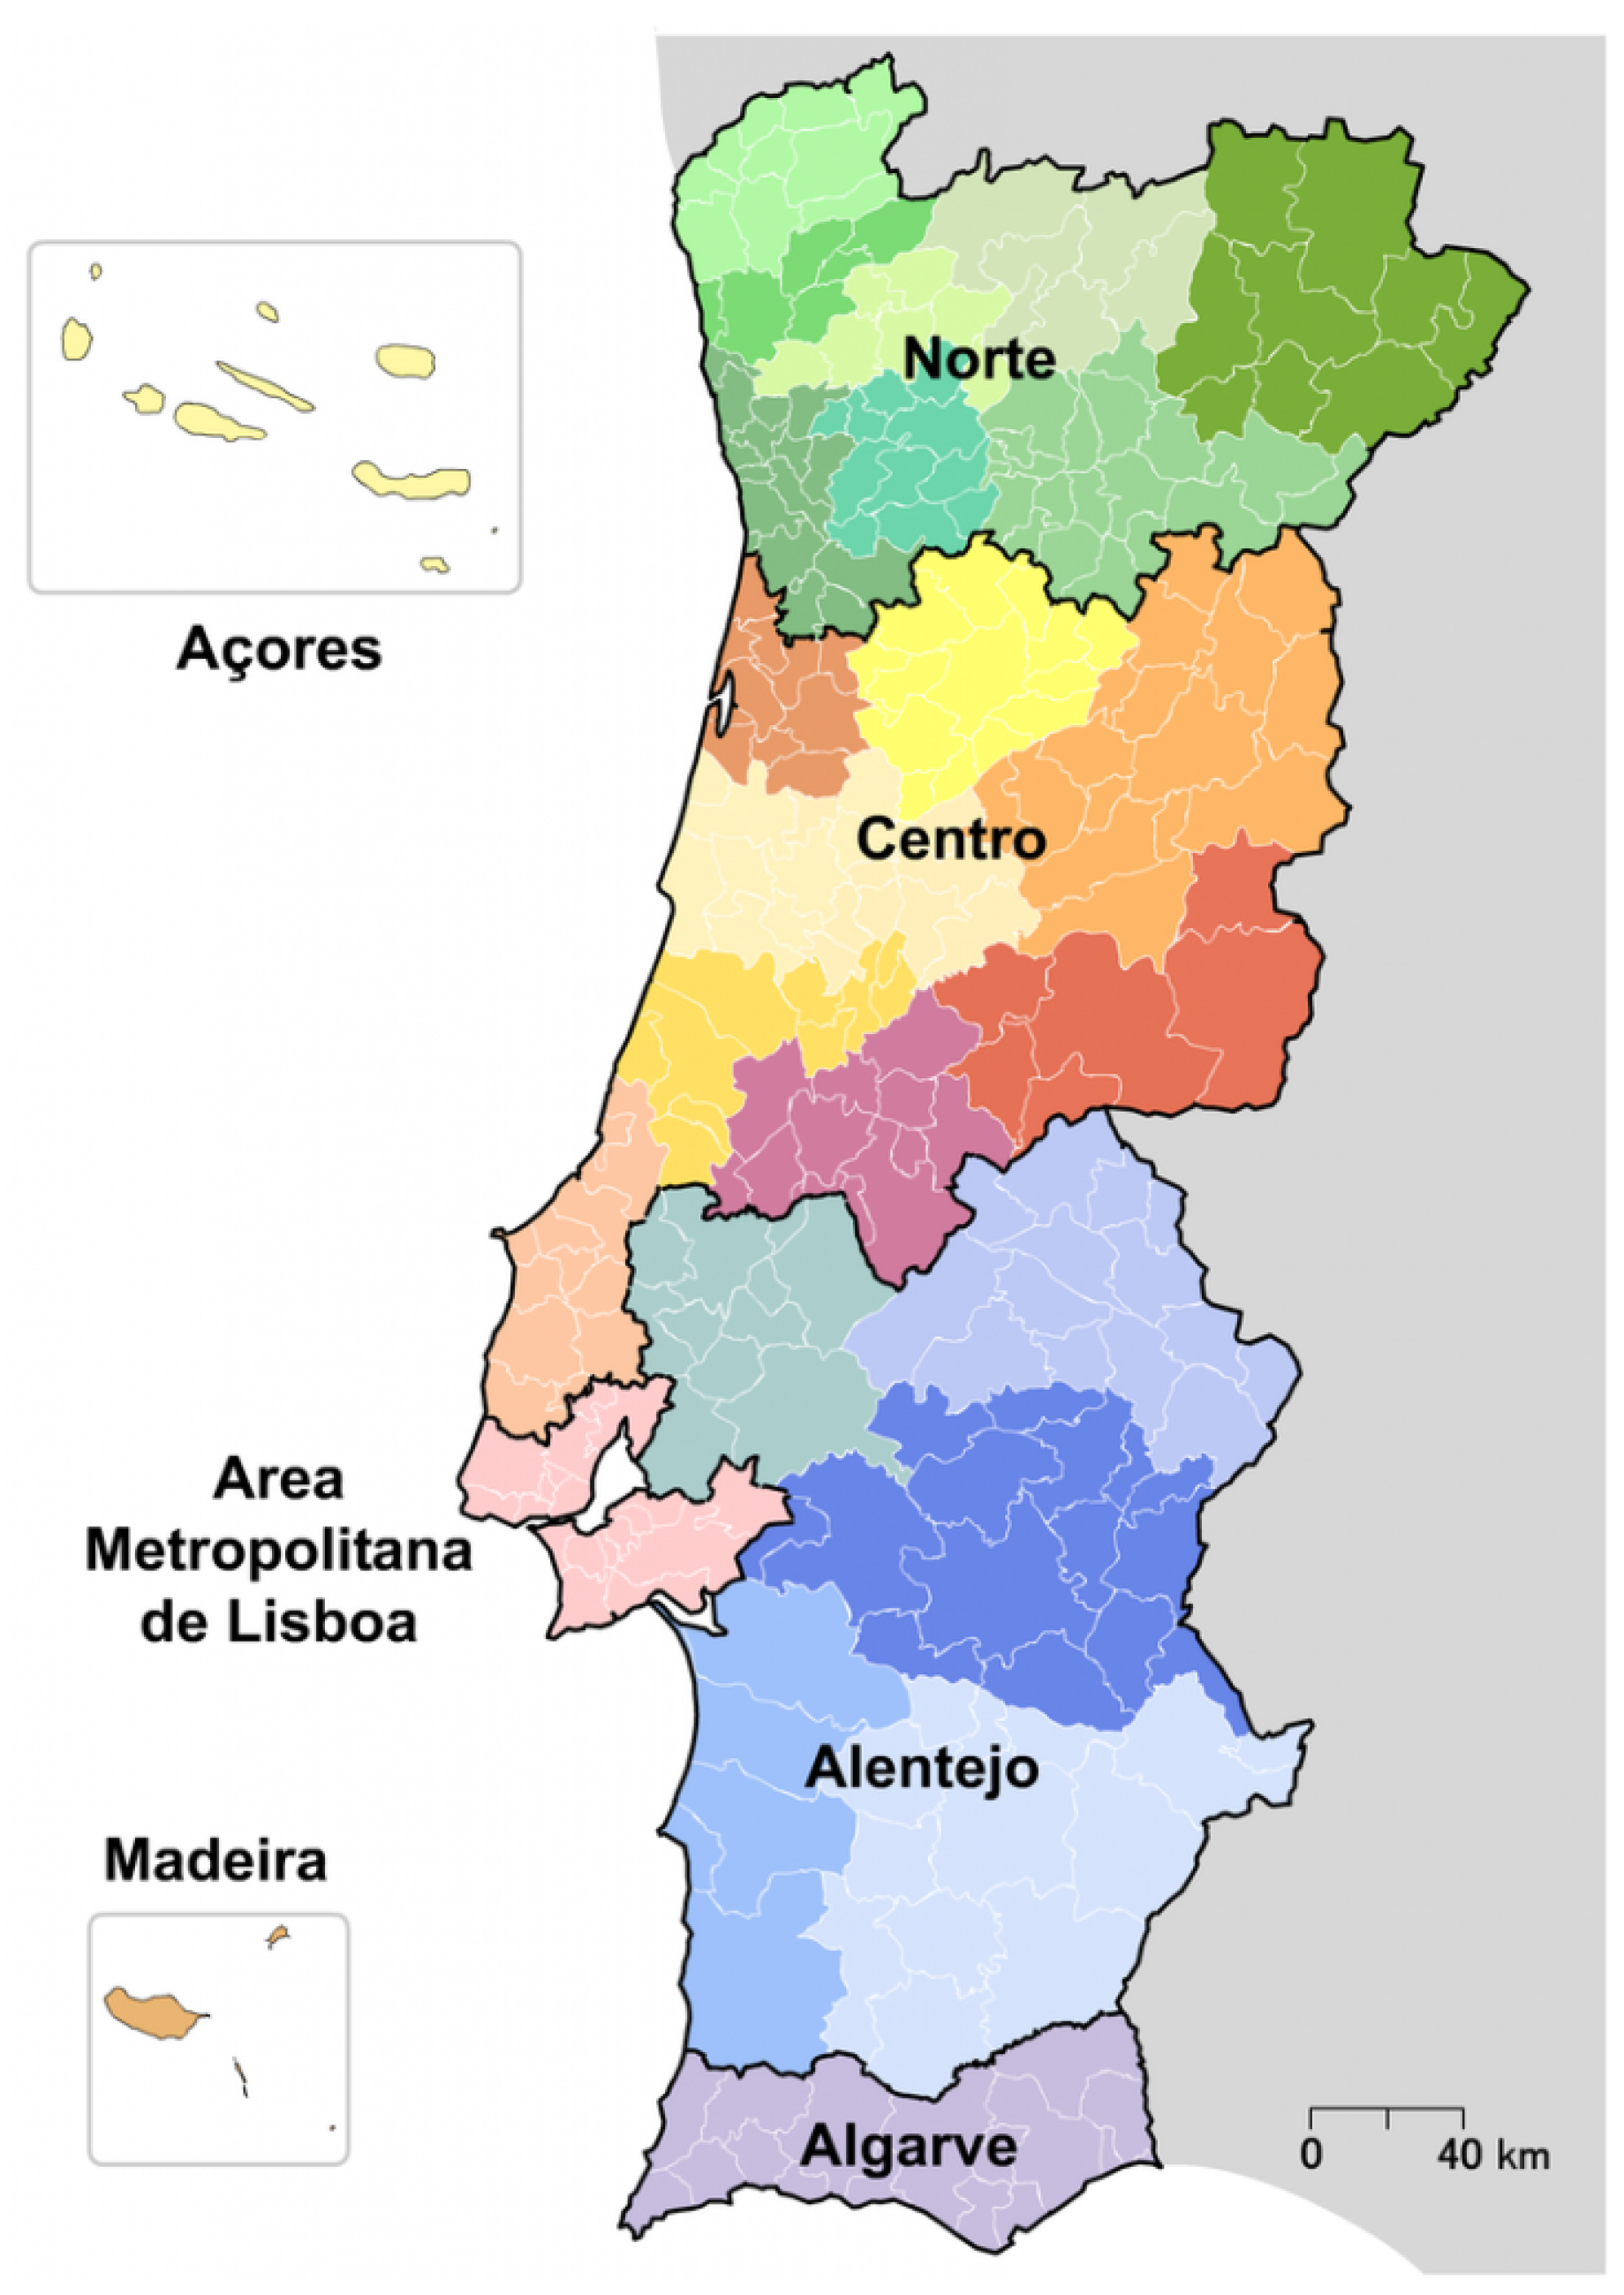
Figure 1 shows the numbers registered in the regions of Portugal (
Figure 2) in September 2020 (
a) and September 2021 (
b), presented by the Direção Geral de Saúde (DGS—Health Authority in Portugal). This institution launched a website with official and updated information on COVID-19 to inform citizens about the evolution of the virus.
The DGS [
31] institution reported that between March 2020 and February 2021, there were 11,170 deaths registered: an increase of 21.9% compared to the previous 12 months. The comparison between the two periods of 2020 and 2021 (
Figure 1) shows the effects of lifting the contingency measures: the number of infections and deaths registered in Portugal were augmented by 1316% and 582%, respectively. Specifically, in the central region, the number of infections increased 2220% and deaths 1096%.
In the labor market, there was a reduction of 2.1% of the employed population and a significant decrease in the hours worked in the economy. The employed population worked always or almost always from home. In general, the Portuguese Gross Domestic Product (GDP), or in other words, the market value of all the final goods and services produced and sold, contracted by 8.4% in volume throughout the first year of the pandemic; 1.3% more than in the previous 12 months [
30]. The industry turnover index registered an average annual reduction of 11.5%, which was reflected both in sales to the domestic and foreign markets [
30]. Accommodation and food were the most affected sectors. Although the impact on employment was relatively contained, there were marked declines in effectively working staff, albeit partially offset by remote work and alternate presence schemes in companies’ facilities [
7].
A study to measure the impact of COVID-19 on poverty and inequality in Portugal [
32] estimated, based on a simulation of annual incomes in scenarios with and without this crisis, that even when considering the policy response implemented in 2020, the pandemic led to a 25% increase in poverty (measured by the poverty rate) and a 9% increase in inequality (measured by the ratio between the 95th and the 5th income percentiles), when compared with a scenario of no-crisis. It was also projected that just the initial 8-week lockdown would have had about the same impact on poverty and inequality as estimated for an entire year.
4. Data Exploration
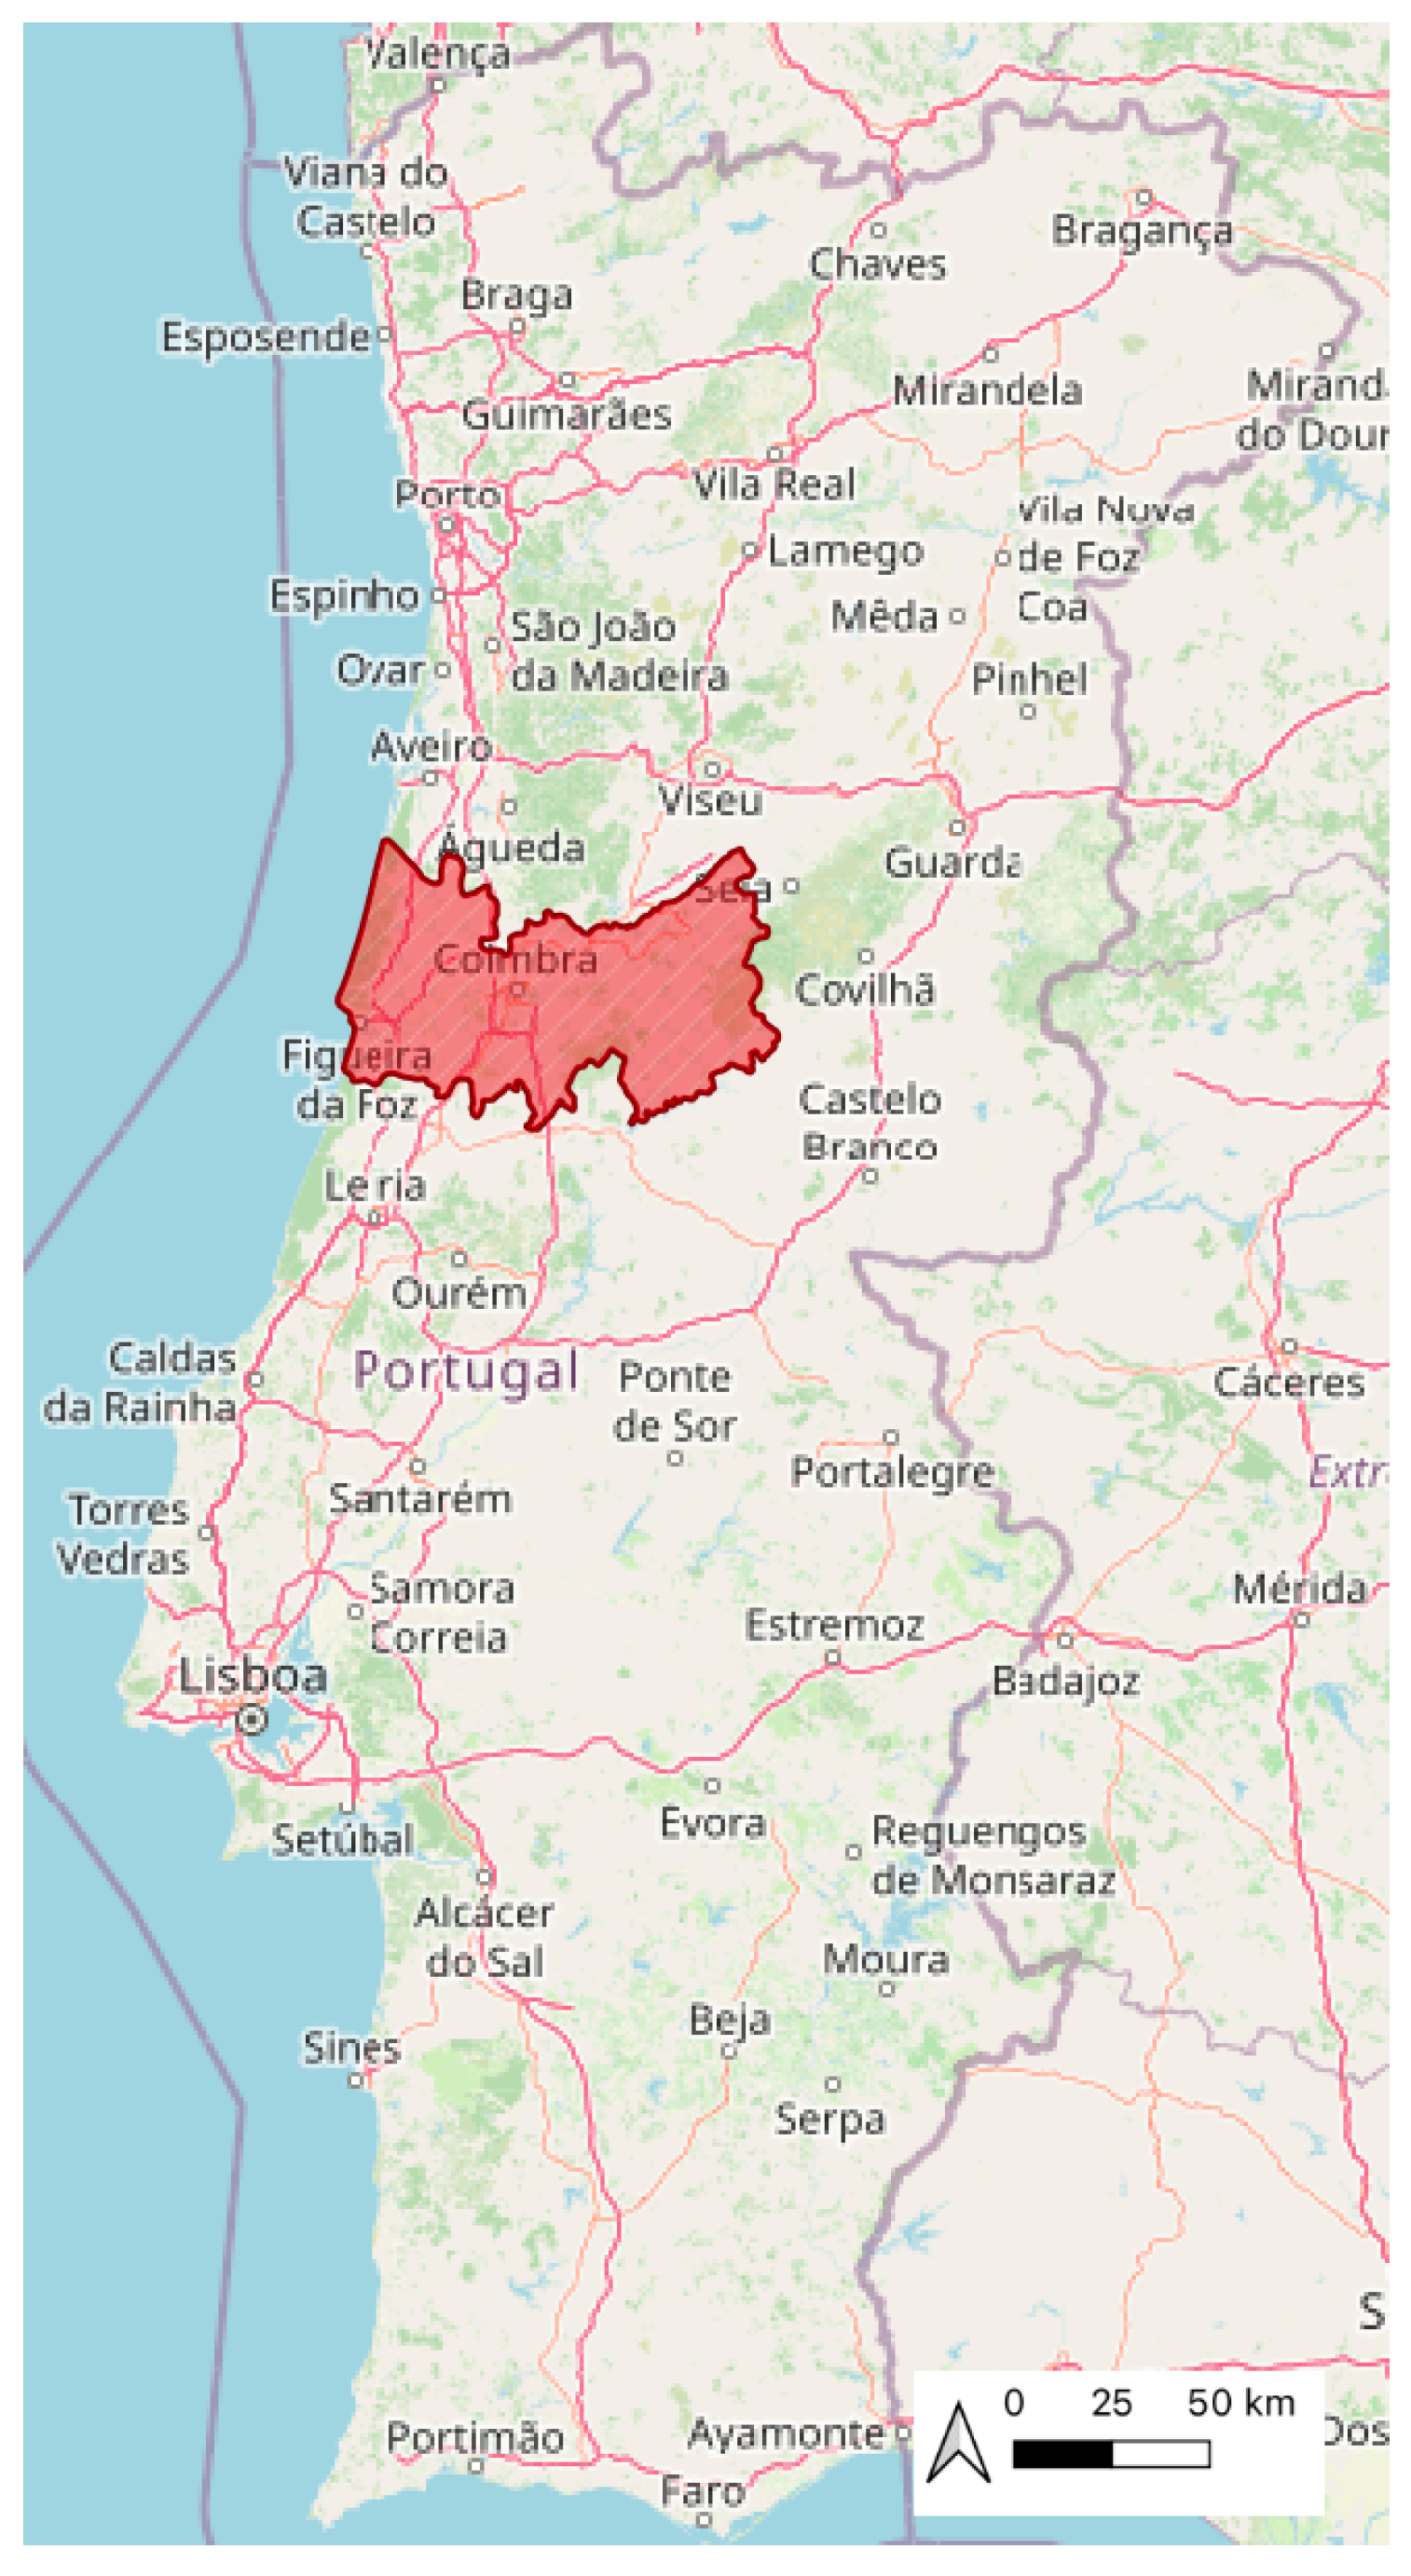
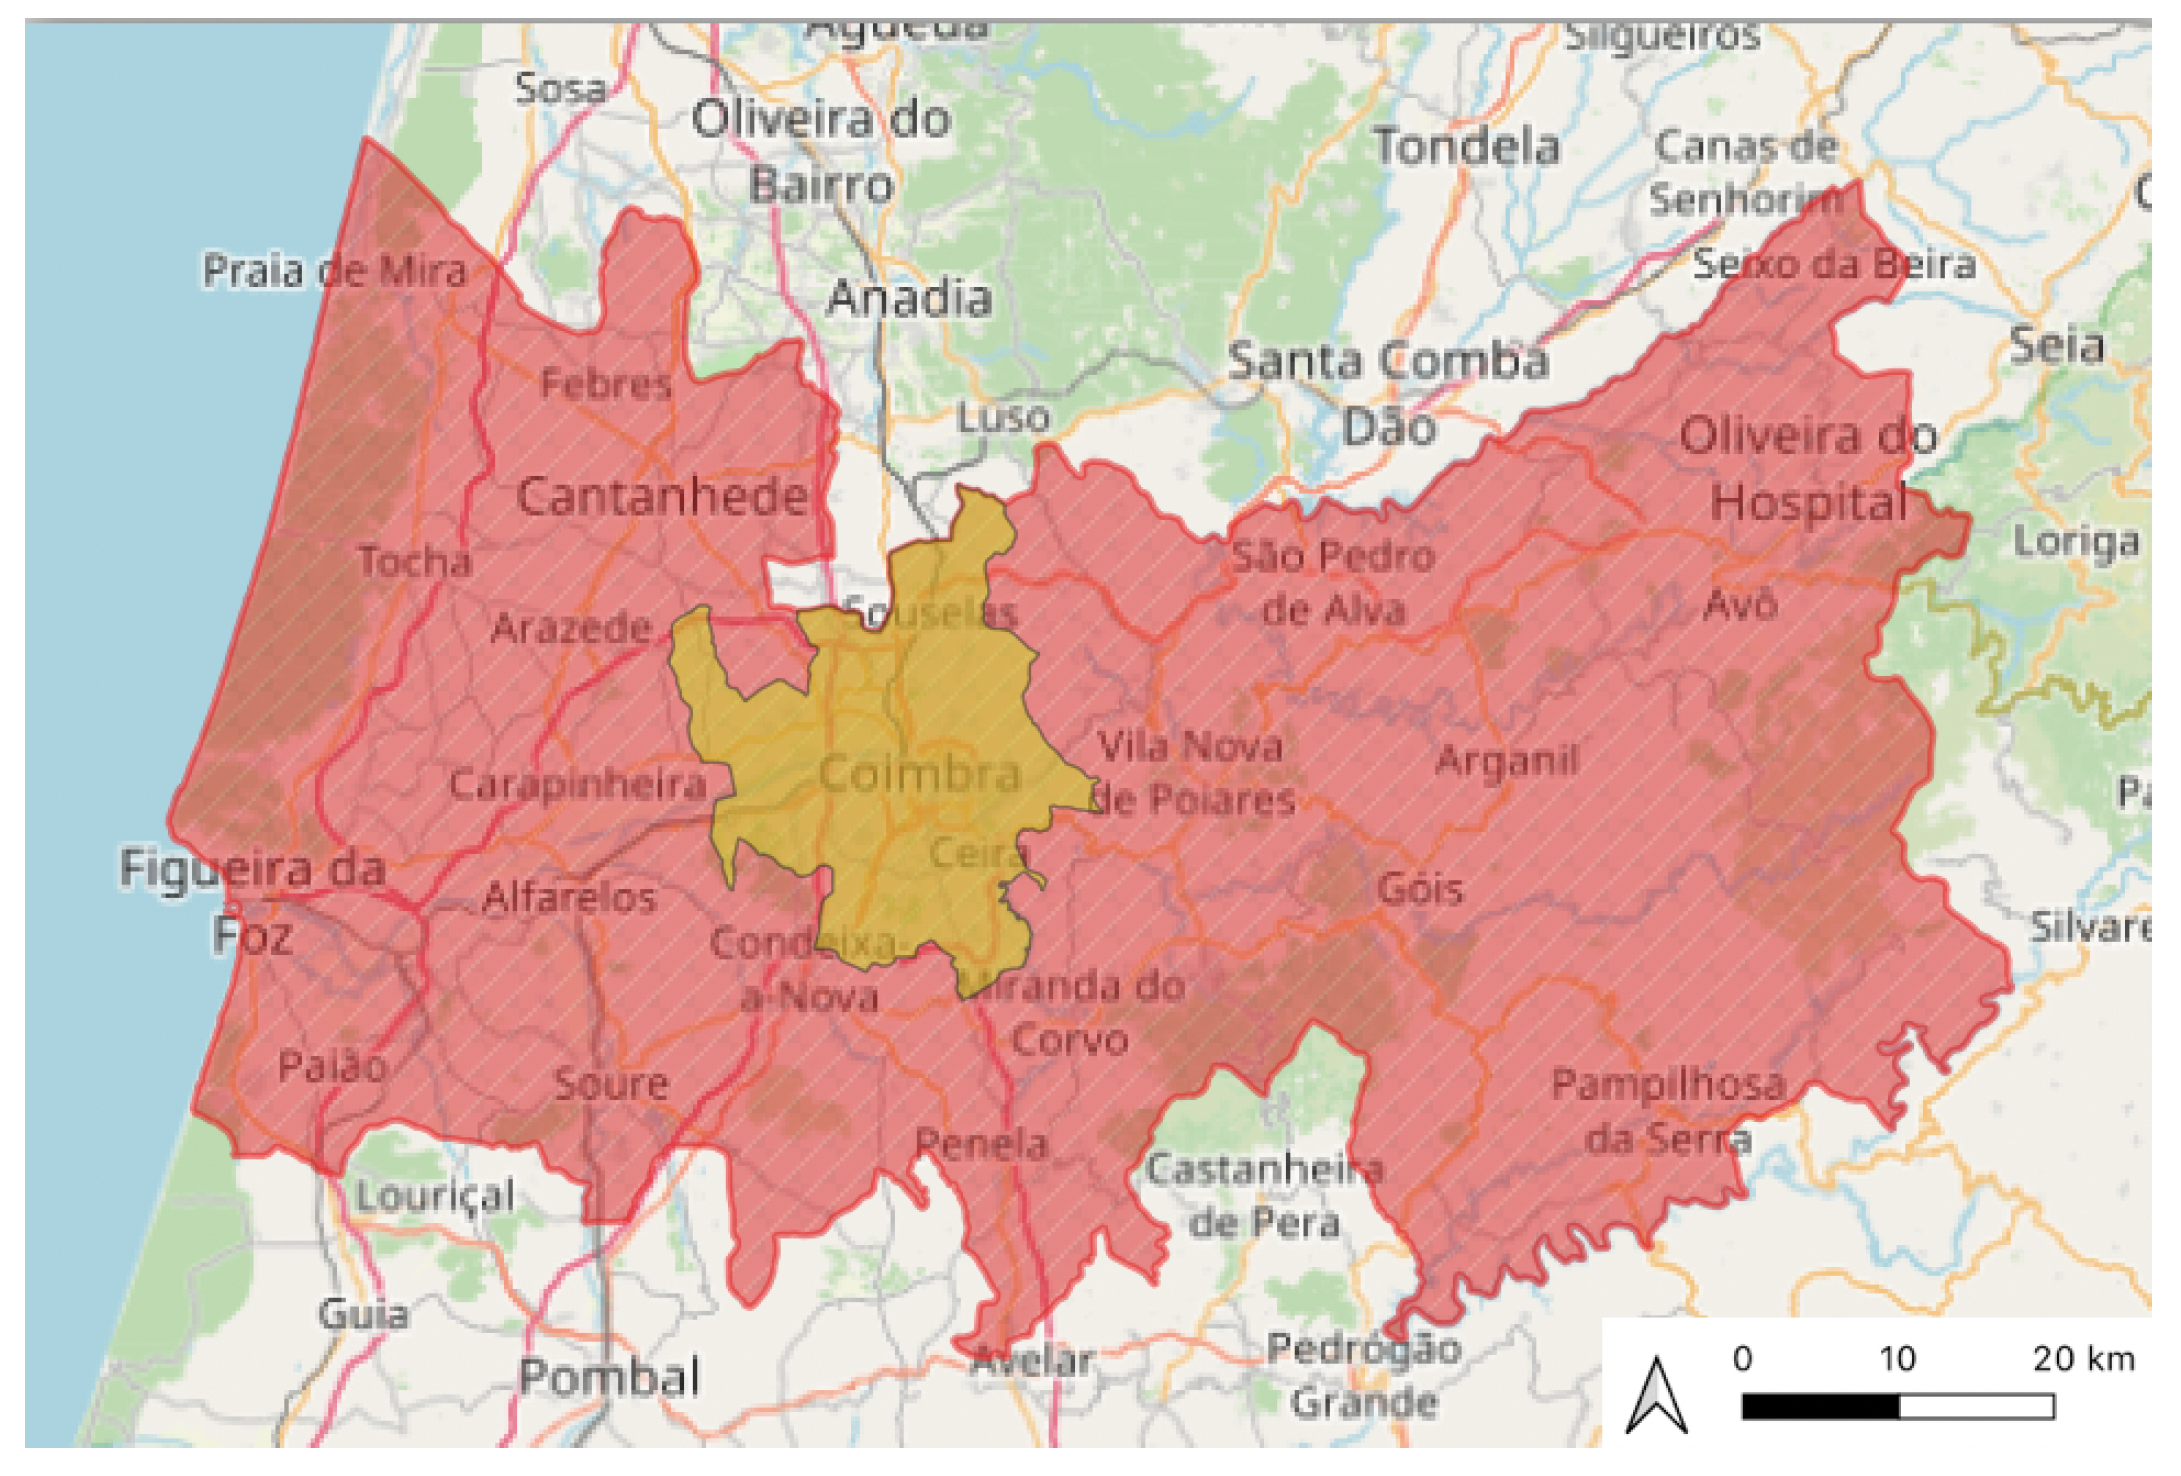
We considered Portugal the area of study, with specific attention to the District of Coimbra, which can be seen in
Figure 3 and
Figure 4. Coimbra is a district from the central region of Portugal with an area of 3974 km
and, according to the 2021 Census [
33], with 408,631 inhabitants. In terms of cities, its the largest city in the central region (
Figure 4) with an area of 319 km
and around 140,796 inhabitants. The data corresponds to anonymized CDRs that were generated by nearly 5000 individuals registered as residents in the city of Coimbra, throughout September and October of 2020 and in the same period of 2021. The individuals studied were randomly selected by the mobile operator.
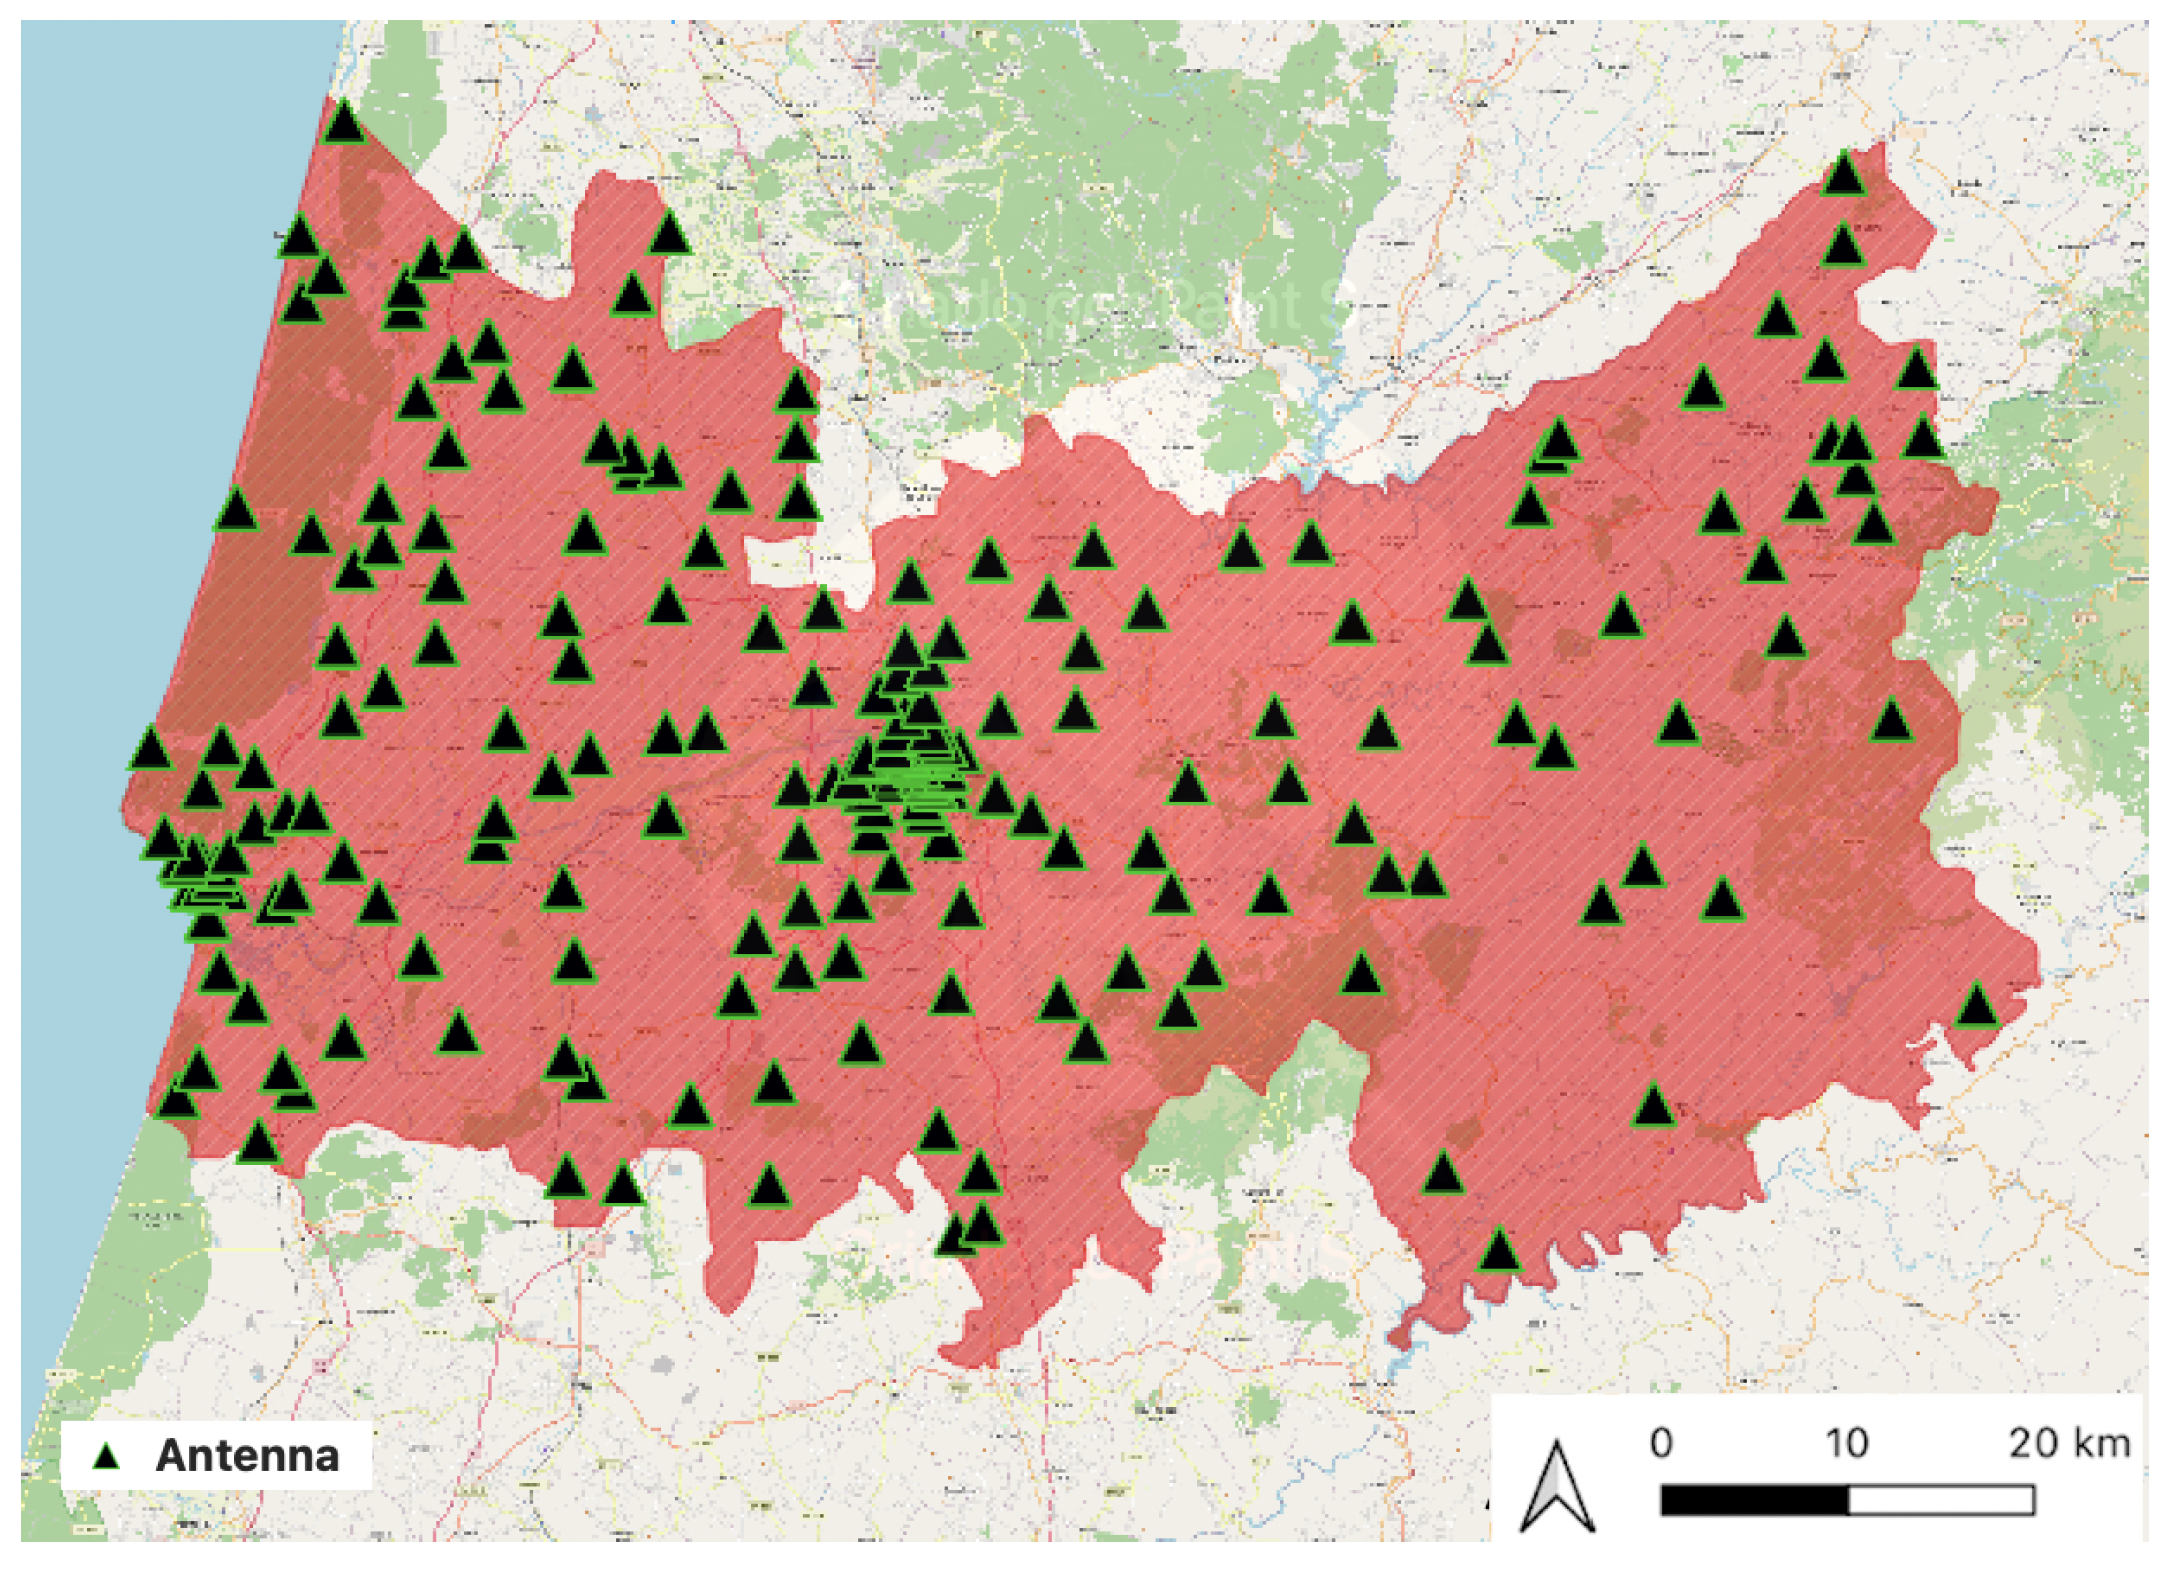
The telecommunication company owns more than 48,000 antennas in Portugal, 2093 of which are in the district of Coimbra.
Figure 5 highlights the geographical distribution and density of antennas/cell towers in the district. It is observed that there are areas of higher density of antennas. To analyze the antennas’ distribution, a density-based clustering algorithm, the Density-Based Spatial Clustering of Applications with Noise (DBSCAN), was used to separate areas with a high density of antennas from areas of low density. This algorithm can recognize areas with elevated density of events, defining that two points are in the same cluster if the distance between them is below the threshold epsilon (eps) [
34]. In addition, it is also capable of handling outliers.
In this algorithm, it is assumed that all points within a cluster are reachable among them and points across different clusters are not. Therefore, it groups together points that are close to each other based on a distance measurement. The idea is that the neighborhood of a given radius must contain at least a minimum number of points. For that, two input parameters are required: the maximum physical distance between two samples, for one to be considered a neighbor of the other (eps) and the minimum number of points, in the neighborhood, to form the cluster [
34]. Two areas with a high density of antennas were found, corresponding to urban areas, namely, the two major cities of the district (Coimbra and Figueira da Foz). It was also observed that in areas of high density where the antennas are closest (urban areas) the mean coverage area of the antennas is 2246 meters, and in areas of low density (rural areas) the mean coverage area of the antennas is 4062 meters.
Call Detail Records
A CDR documents how users interact with the cellular network. These records are generated in large quantities as a by-product of the billing by mobile operators and usually contain such information fields as the origin and destination antenna ID, the ID of the user, the time that the event started, and the duration of the communication. It is also usual that some telecommunication companies attach to these datasets information about the user or the location of the antenna [
35]. The geo-references presented in CDRs correspond to the locations of the antennas to which the individual’s phone is connected when interacting with the network to make/receive a phone call or SMS. Therefore, with this type of data, the location of the user is only known at an antenna level (obtaining an accurate location is impossible). Nevertheless, CDRs are a type of mobile phone data frequently adopted to study simultaneously individual movements and social interactions [
36].
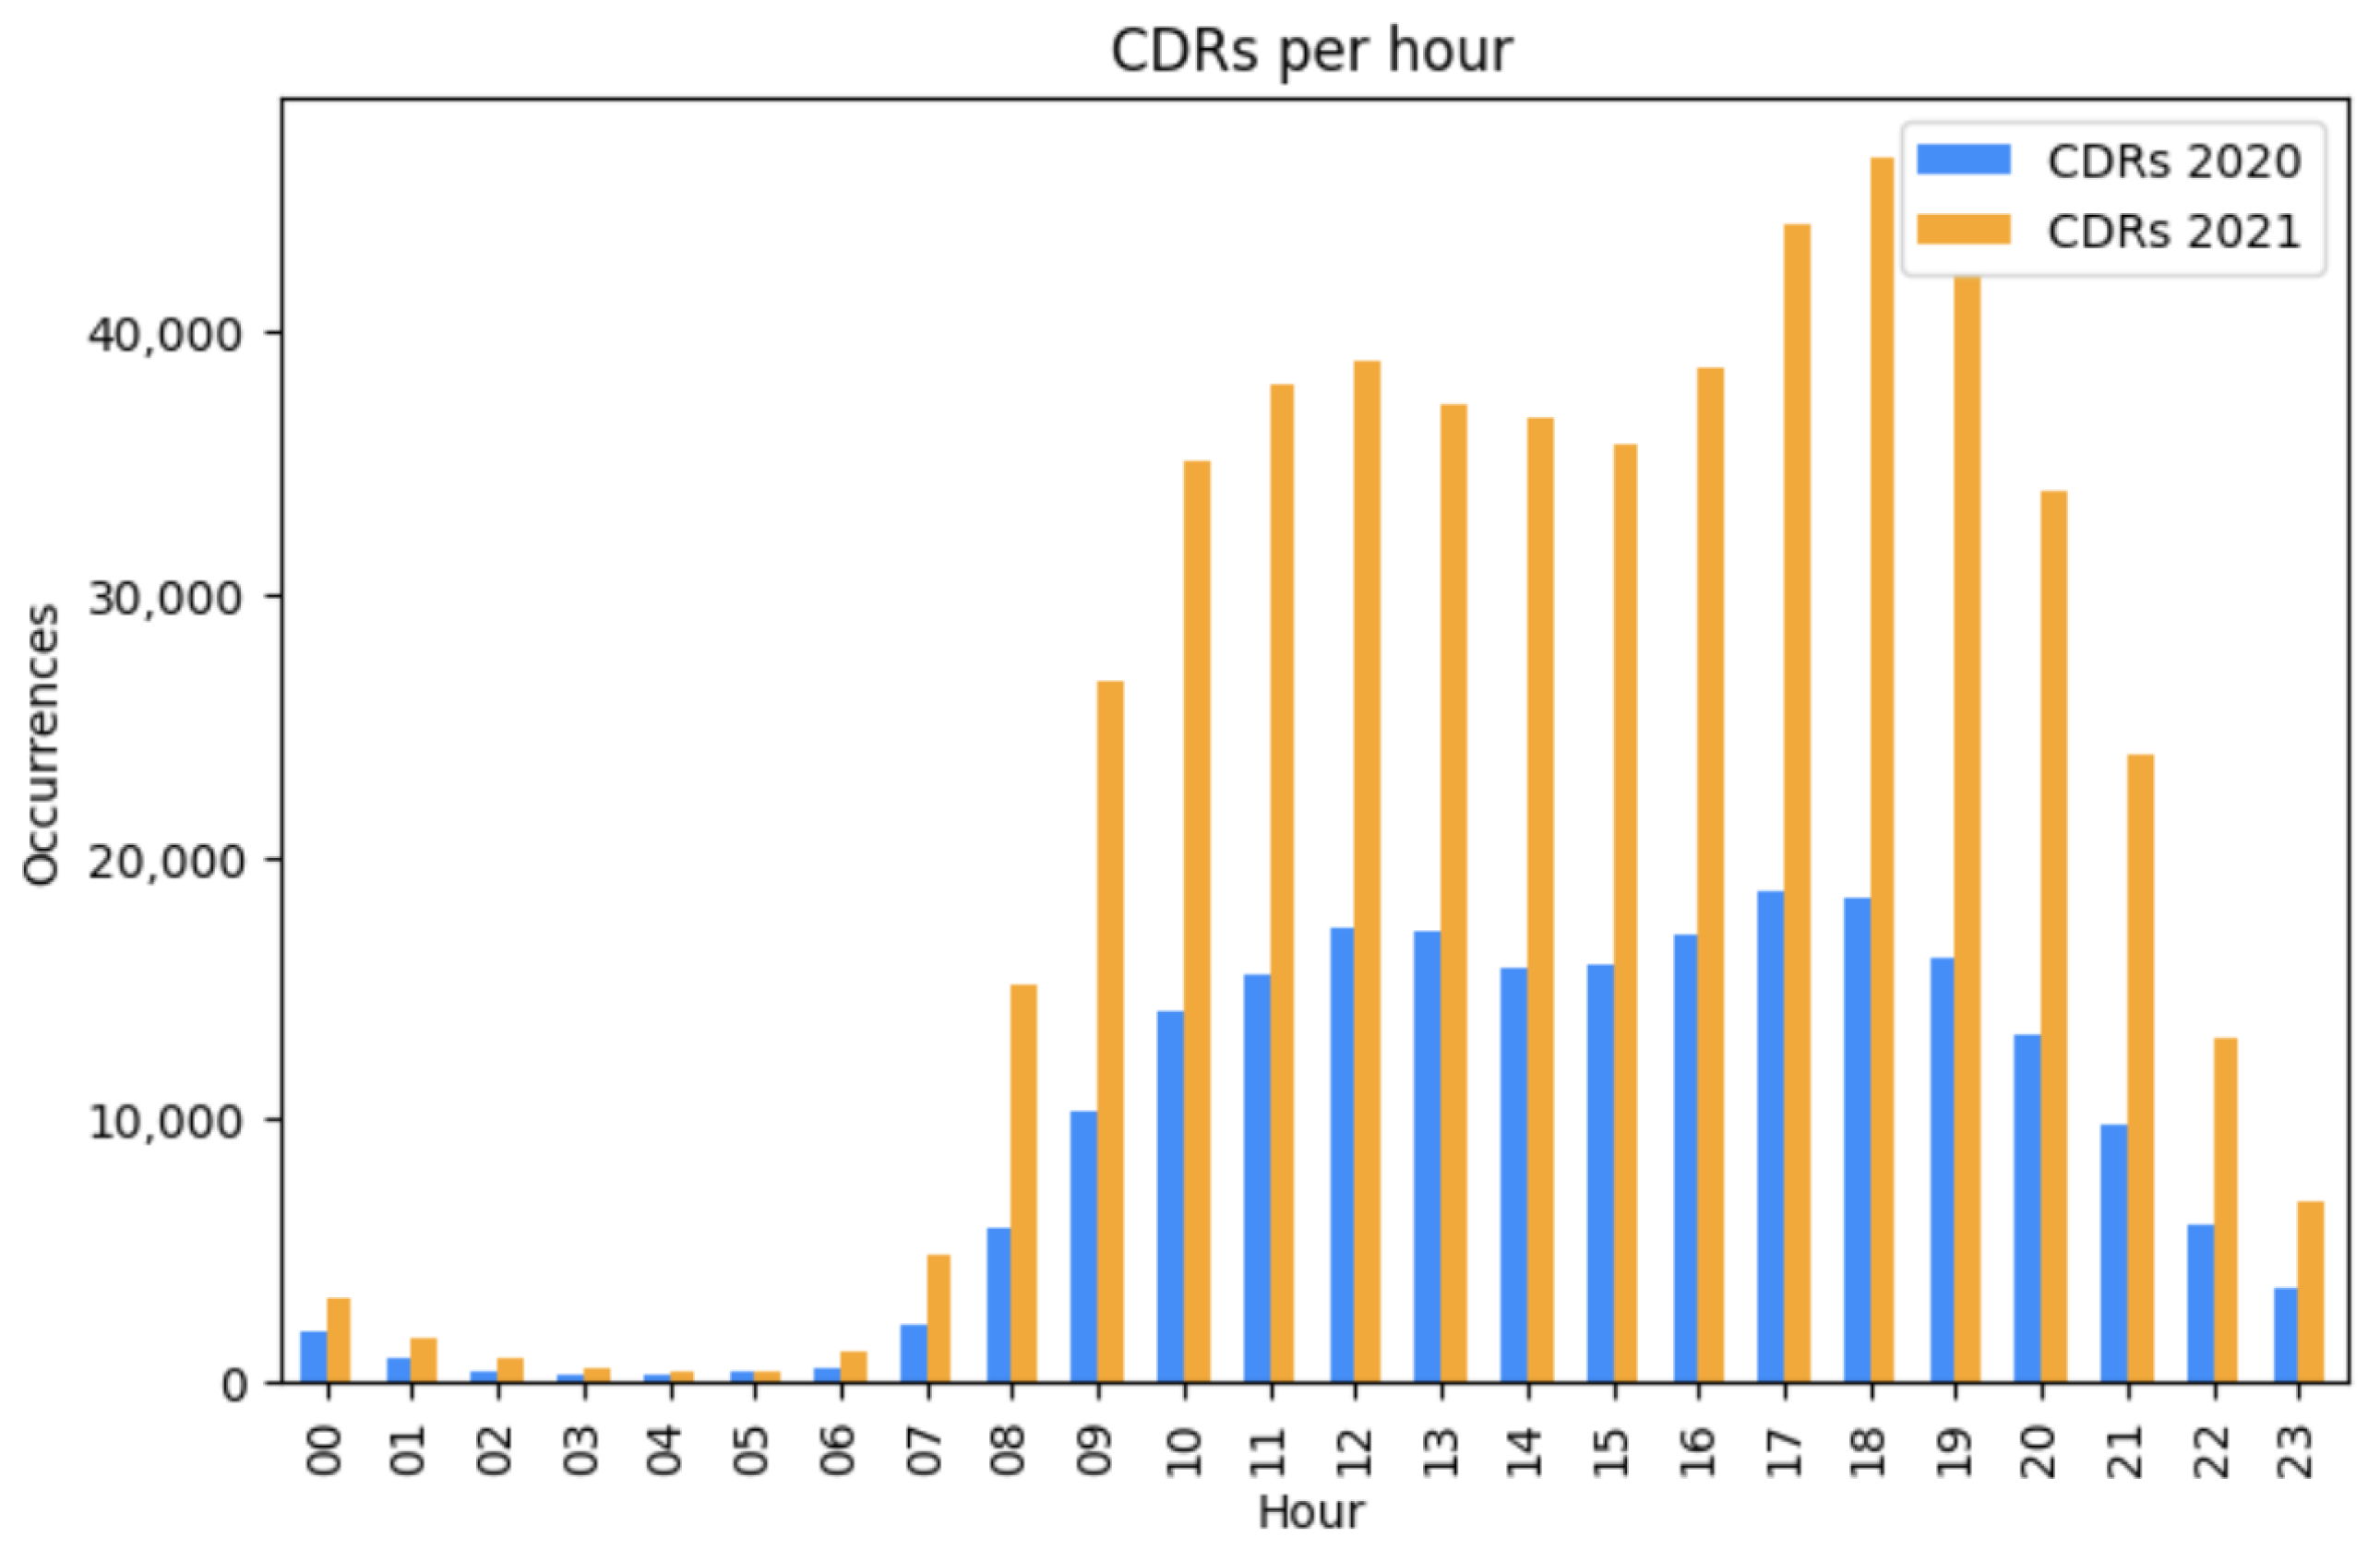
The datasets used in this analysis contain such information as the ID of the user that started the interaction, the ID of the antenna to which the user was connected when the event started, the time that the event started, and some information about the antenna. As presented in
Figure 6, most of the CDRs were registered during the daytime both in 2020 and 2021. This study is related to weekday usage. In the September and October of 2020, 221,400 CDRs were generated by the studied population. Regarding 2021, 526,033 CDRs were registered.
On average in 2020, an individual interacted with the network to make/receive a phone call or SMS approximately 2.93 times per day, and in the same period of 2021, 3.93 times per day. This indicates that people communicated less during the first year of the pandemic or used another channel to communicate, for example, VOIP (Voice-over-IP) connections. As 2020 was the first year of the pandemic, there was more population working from home or working in a hybrid system (home and workplace), which could explain the reduction in the CDRs and a probable augmentation of the VOIP communications. Despite the different numbers in 2020 and 2021, the generation of CDRs matches in terms of hours. Both rise at 7 a.m. and stay at a high level until 7 p.m., before dropping and reaching a low between 1 a.m. and 5 a.m.
5. Mobility Analysis
As mentioned, COVID-19 changed the population’s movement patterns, and massive mobility datasets have fostered a vast scientific production on various applications of pattern analysis, including urban planning and transportation engineering. To capture mobility and study the changes in movement patterns, we use Scikit-mobility. Scikit-mobility is a Python library that performs the analysis of mobility data. Among other qualities, this library has the capacity to load and represent mobility data, both at the individual and the collective level, and can clean and pre-process mobility data using techniques such as trajectory clustering, compression, segmentation, and filtering [
37].
5.1. Data Structures Using CDR Data
As this study is related to weekdays, CDRs registered on weekends were discarded from the dataset. Then, we started by creating the data structures. To analyze mobility in the two different years and compare the results, we created two data structures for each dataset: a trajectory dataframe and a flow dataframe. In the trajectory dataframe objects are ordered as a sequence of spatio-temporal events and each row represents a point of a trajectory. The trajectory dataframe may contain many trajectories. A flow dataframe describes an origin–destination matrix. A row in this type of dataframe represents a flow of objects between two locations. Normally, the territory is discretized, mapping the coordinates to a spatial tessellation that divides the space into a countable number of geometric shapes, called tiles, with no overlaps and no gaps.
So, to create the trajectory dataframes, the CDRs of each user were ordered by time and each CDR was associated with a point in a trajectory. Individuals with only one point in the trajectory were eliminated from the study. As each row represents a CDR/point of the trajectory, the first row associated with a trajectory represents the first place visited, and the following rows the next places visited. While in the trajectory dataframes, the trajectories refer to the movements of single individuals, in the flow dataframes, the flows refer to aggregated movements of individuals between a set of locations. In these structures, a row of the dataframe represents a flow of multiple users between two locations. Therefore, a spatial tessellation is used to aggregate flows of individuals moving among locations, or in this case, the tiles of the tessellation.
5.2. Stops’ Detection Using CDR Data
Once the data structures were created, we focused our analysis on the processing of the trajectory dataframes. We started by identifying the individuals’ “stops”. The stop points are points in a trajectory that can represent meaningful places [
37]. The function that detects the stops in Scikit-Mobility finds the stay points visited by an individual based on the time that was spent within a certain area. After the application of the function, a new column containing the time that the individual left the stop location is added to the dataframe. So, for each individual, we considered a stop, where more than 20 min were spent [
4] within a distance of 2246 m. These stops may correspond to one antenna that represents itself or represents multiple antennas that are located within a radius of 2246 m. The distance was chosen taking into account the mean coverage radius of the antennas in urban areas.
The coverage of the antennas overlaps most of the time and sometimes situations of load sharing may occur. In some cases of variations in cellular traffic, at certain areas or periods of time, the closest antenna is not always the one the user connects to. This phenomenon is often called load sharing and consists of the network transferring traffic from overloaded antennas to neighboring ones, as a way to provide service for all clients. So, to prevent errors provoked by this phenomenon, in a radius of 2246 m, if the cell phone switches between several antennas for brief moments, it is considered that the individual visited only one location.
5.3. Clustering of Stop Locations
Considering that the goal is not to study individual but collective patterns, to perform the analysis at a group level we use a clustering algorithm to cluster the stops of the individuals, meaning that the stops in the same group/cluster correspond to visits of several individuals to the same location at different times, based on spatial proximity. The clustering algorithm used was DBSCAN. After the processing, the stops that belong to the same cluster have the same label. To handle the varying densities of points in the different datasets, the parameters of the algorithm, the eps and minimum number of points, were applied based on the characteristics of the data. The elbow/knee method was used to identify the ideal eps parameter. In this process, the selection of the optimal values is made by looking at the distance from a point to its
kth closest neighbor (k-dist), resulting in a k-dist plot. All k-dists are computed for all data points for some
k. Next, the values of the distances are sorted in ascending order and plotted. In the k-dist plots, the sharp change at the k-dists value, corresponds to a suitable value of the eps [
38]. So, we measure the distance between the stops of users in each trajectory dataframe and use the optimal distances as parameters. The minimum points parameter was applied based on the average number of stops registered per user in each period.
5.4. Comparison and Discussion
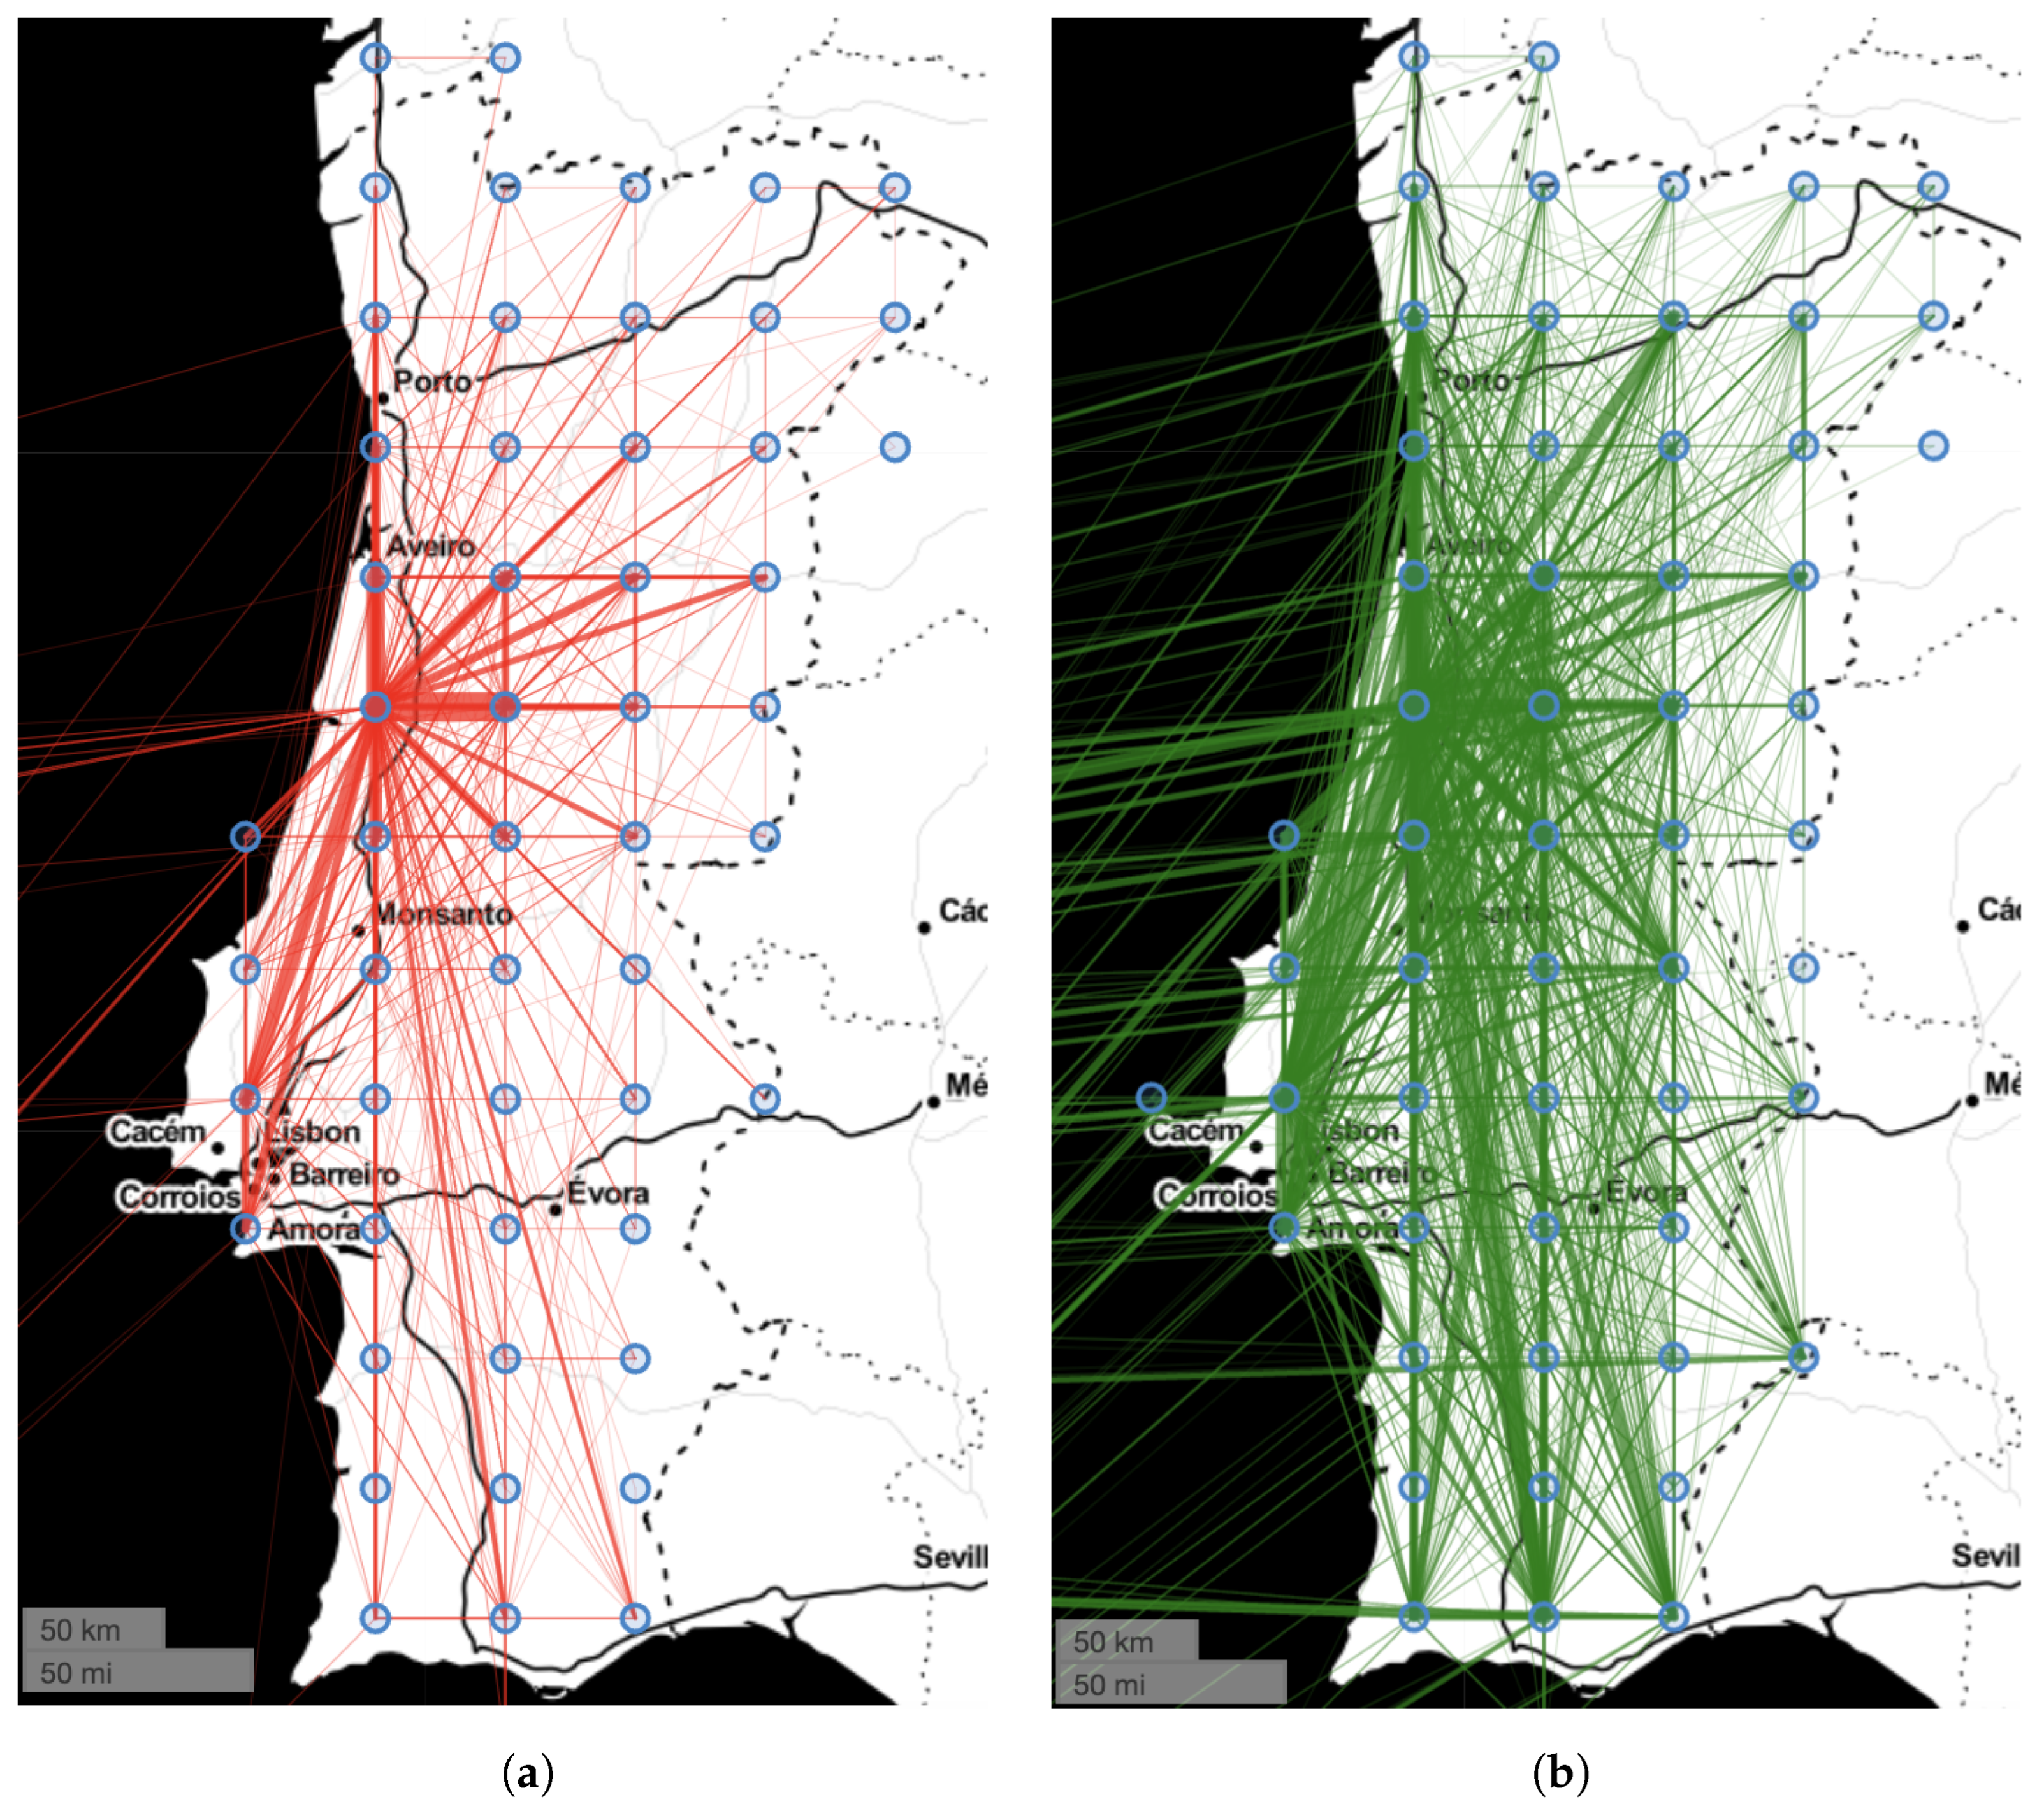
The analysis of the flow dataframes pointed out that in the first period, 640 flows with different directions were identified. In 2021 this number increased to 1670. The comparison of the maps generated from the flow dataframes, in
Figure 7, indicates that in 2020 most of the interregional flows were within the central region. On the contrary, in 2021 a higher number of flows can be observed from the central region to the other regions of the country, including the islands.
The analysis of the trajectories coincides with the observed in the maps from the flow dataframes (
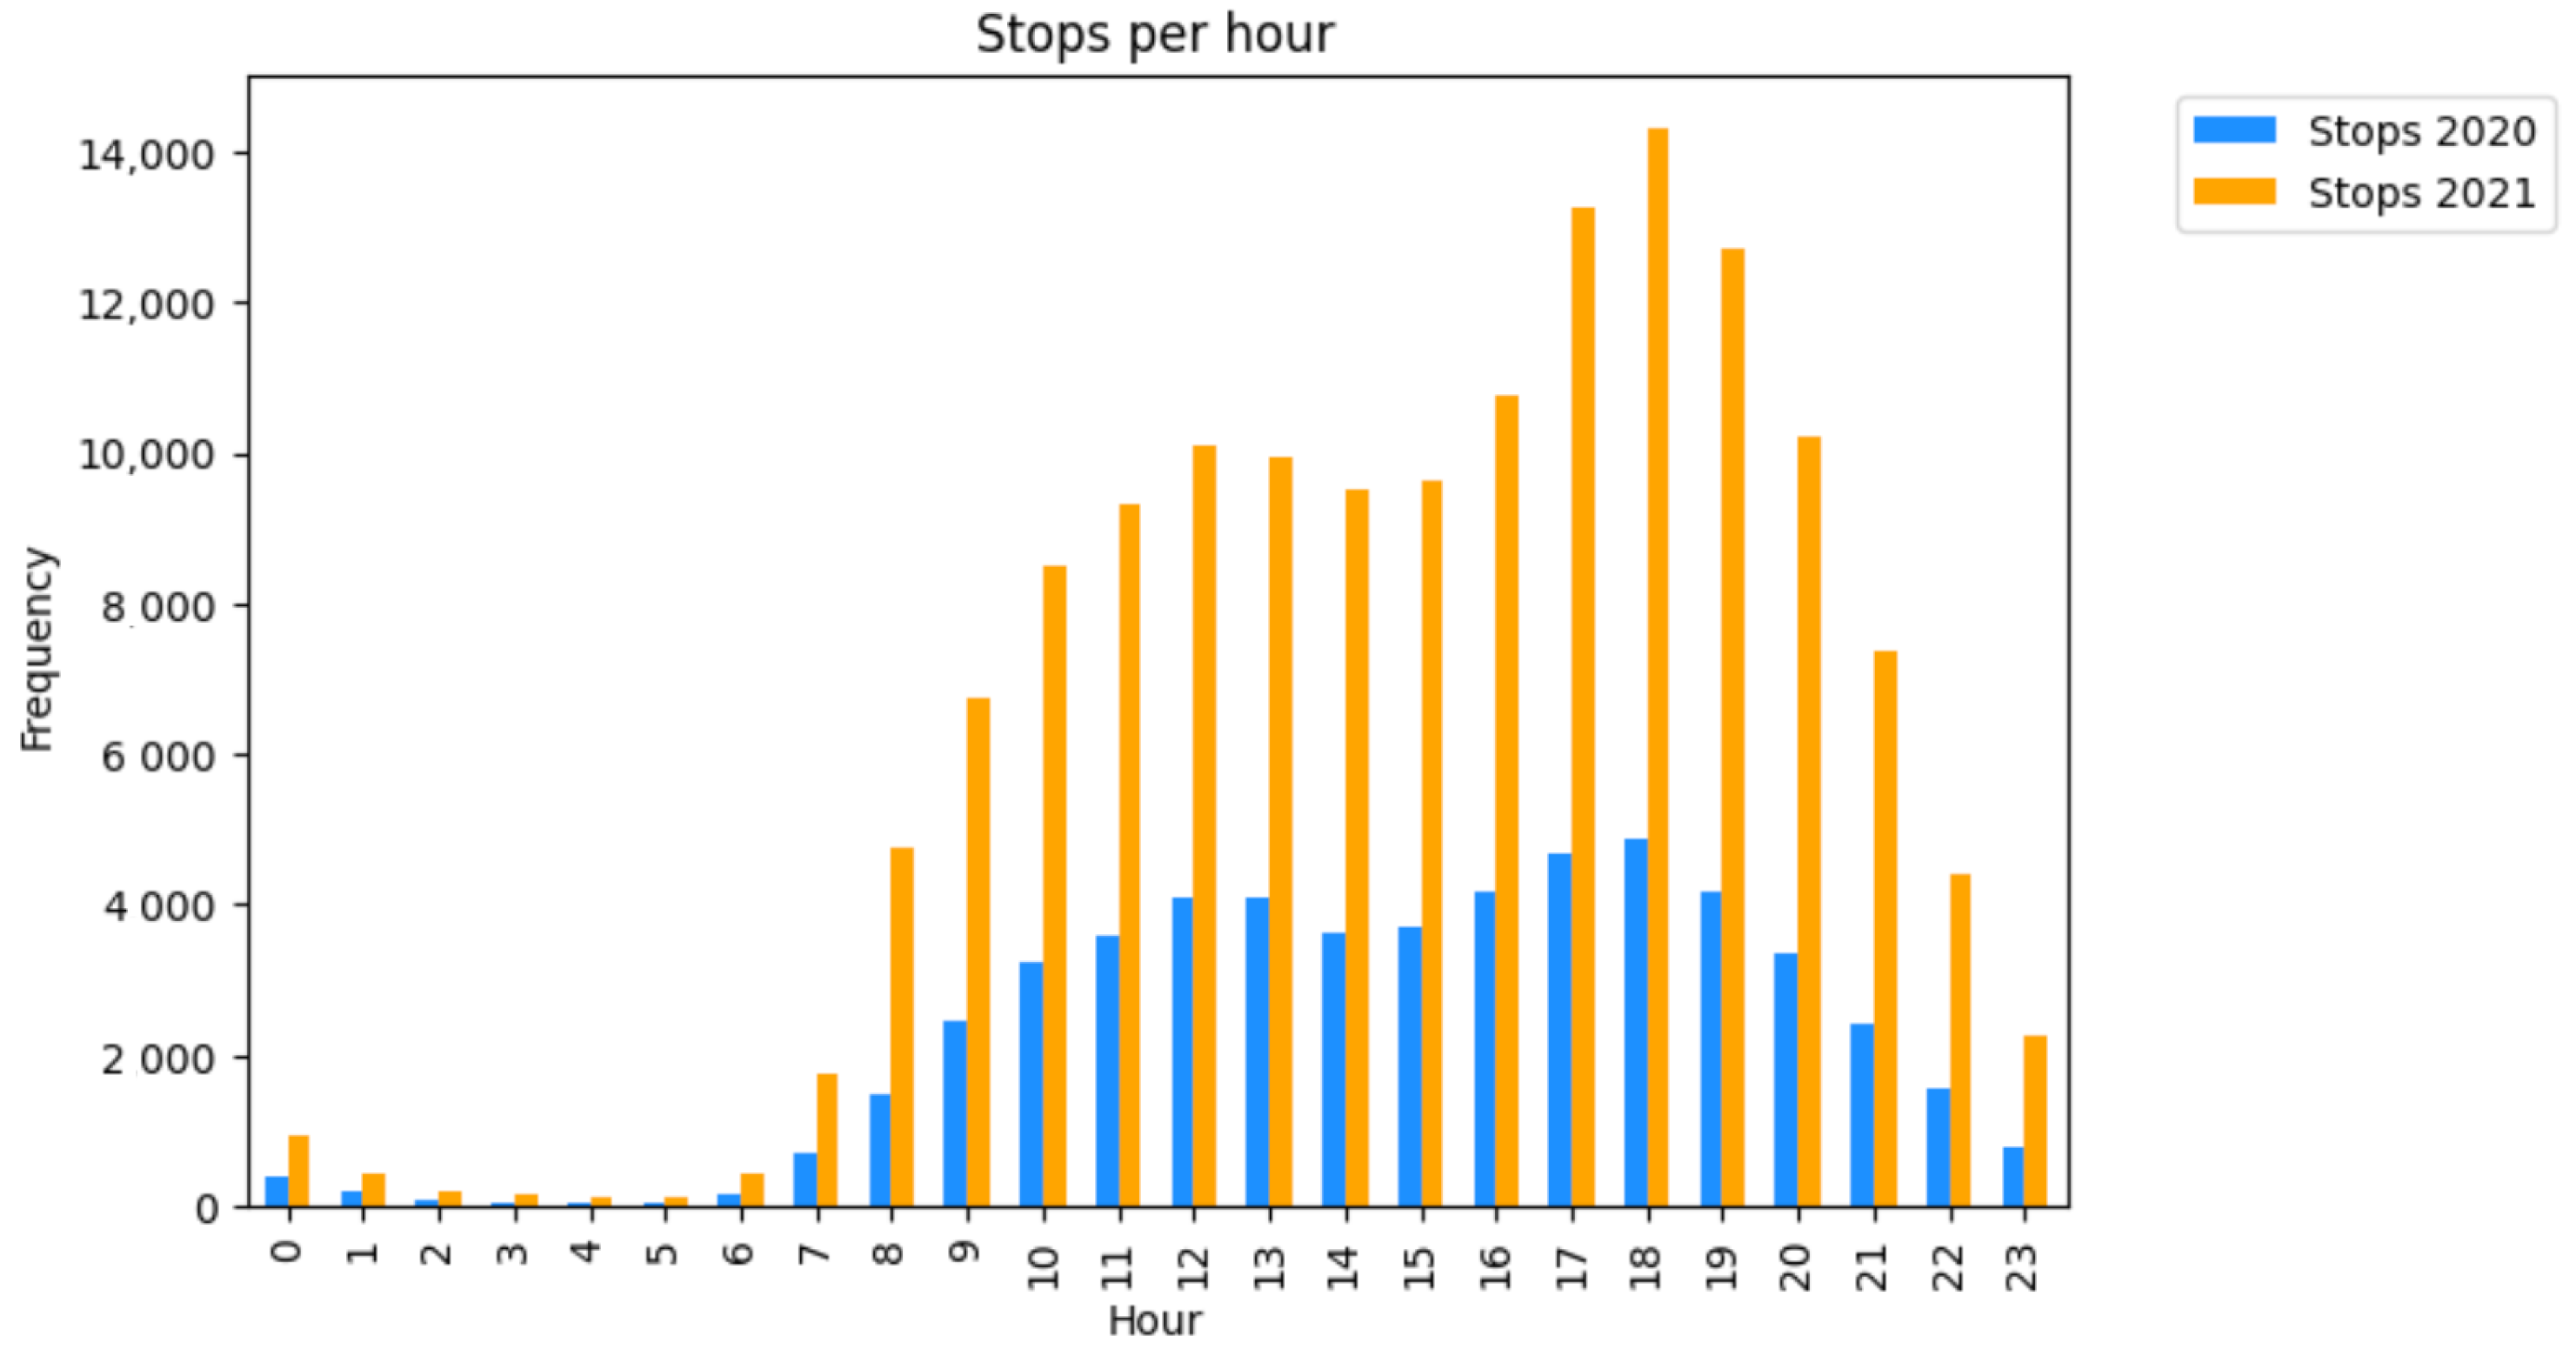
Figure 7). Although in both periods most of the events were registered in Coimbra, CDRs were registered in antennas all across the country. The original trajectory dataframe, containing the CDRs generated in 2020, contained 220,490 points. After the identification of stop locations, the points in the dataframe were reduced to 54,009. The 2021 original trajectory dataframe contained 525,978 points. With the pre-processing, 147,930 points were identified as stops. In 2020, each individual registered an average of 8.95 stops; in the same period of 2021, the average number of stops increased to 32.12 per user. However, besides the different number of stops in the two years, the quantity of stops is similar in both periods in terms of hours. As is observable in
Figure 8, just like in the CDRs, the number of stops rise at 7 a.m. with a slight difference that in 2020 stops during the early morning were more frequent. Then, the frequency stays at a high level until 7 p.m., before dropping and reaching a low between 1 a.m. and 5 a.m.
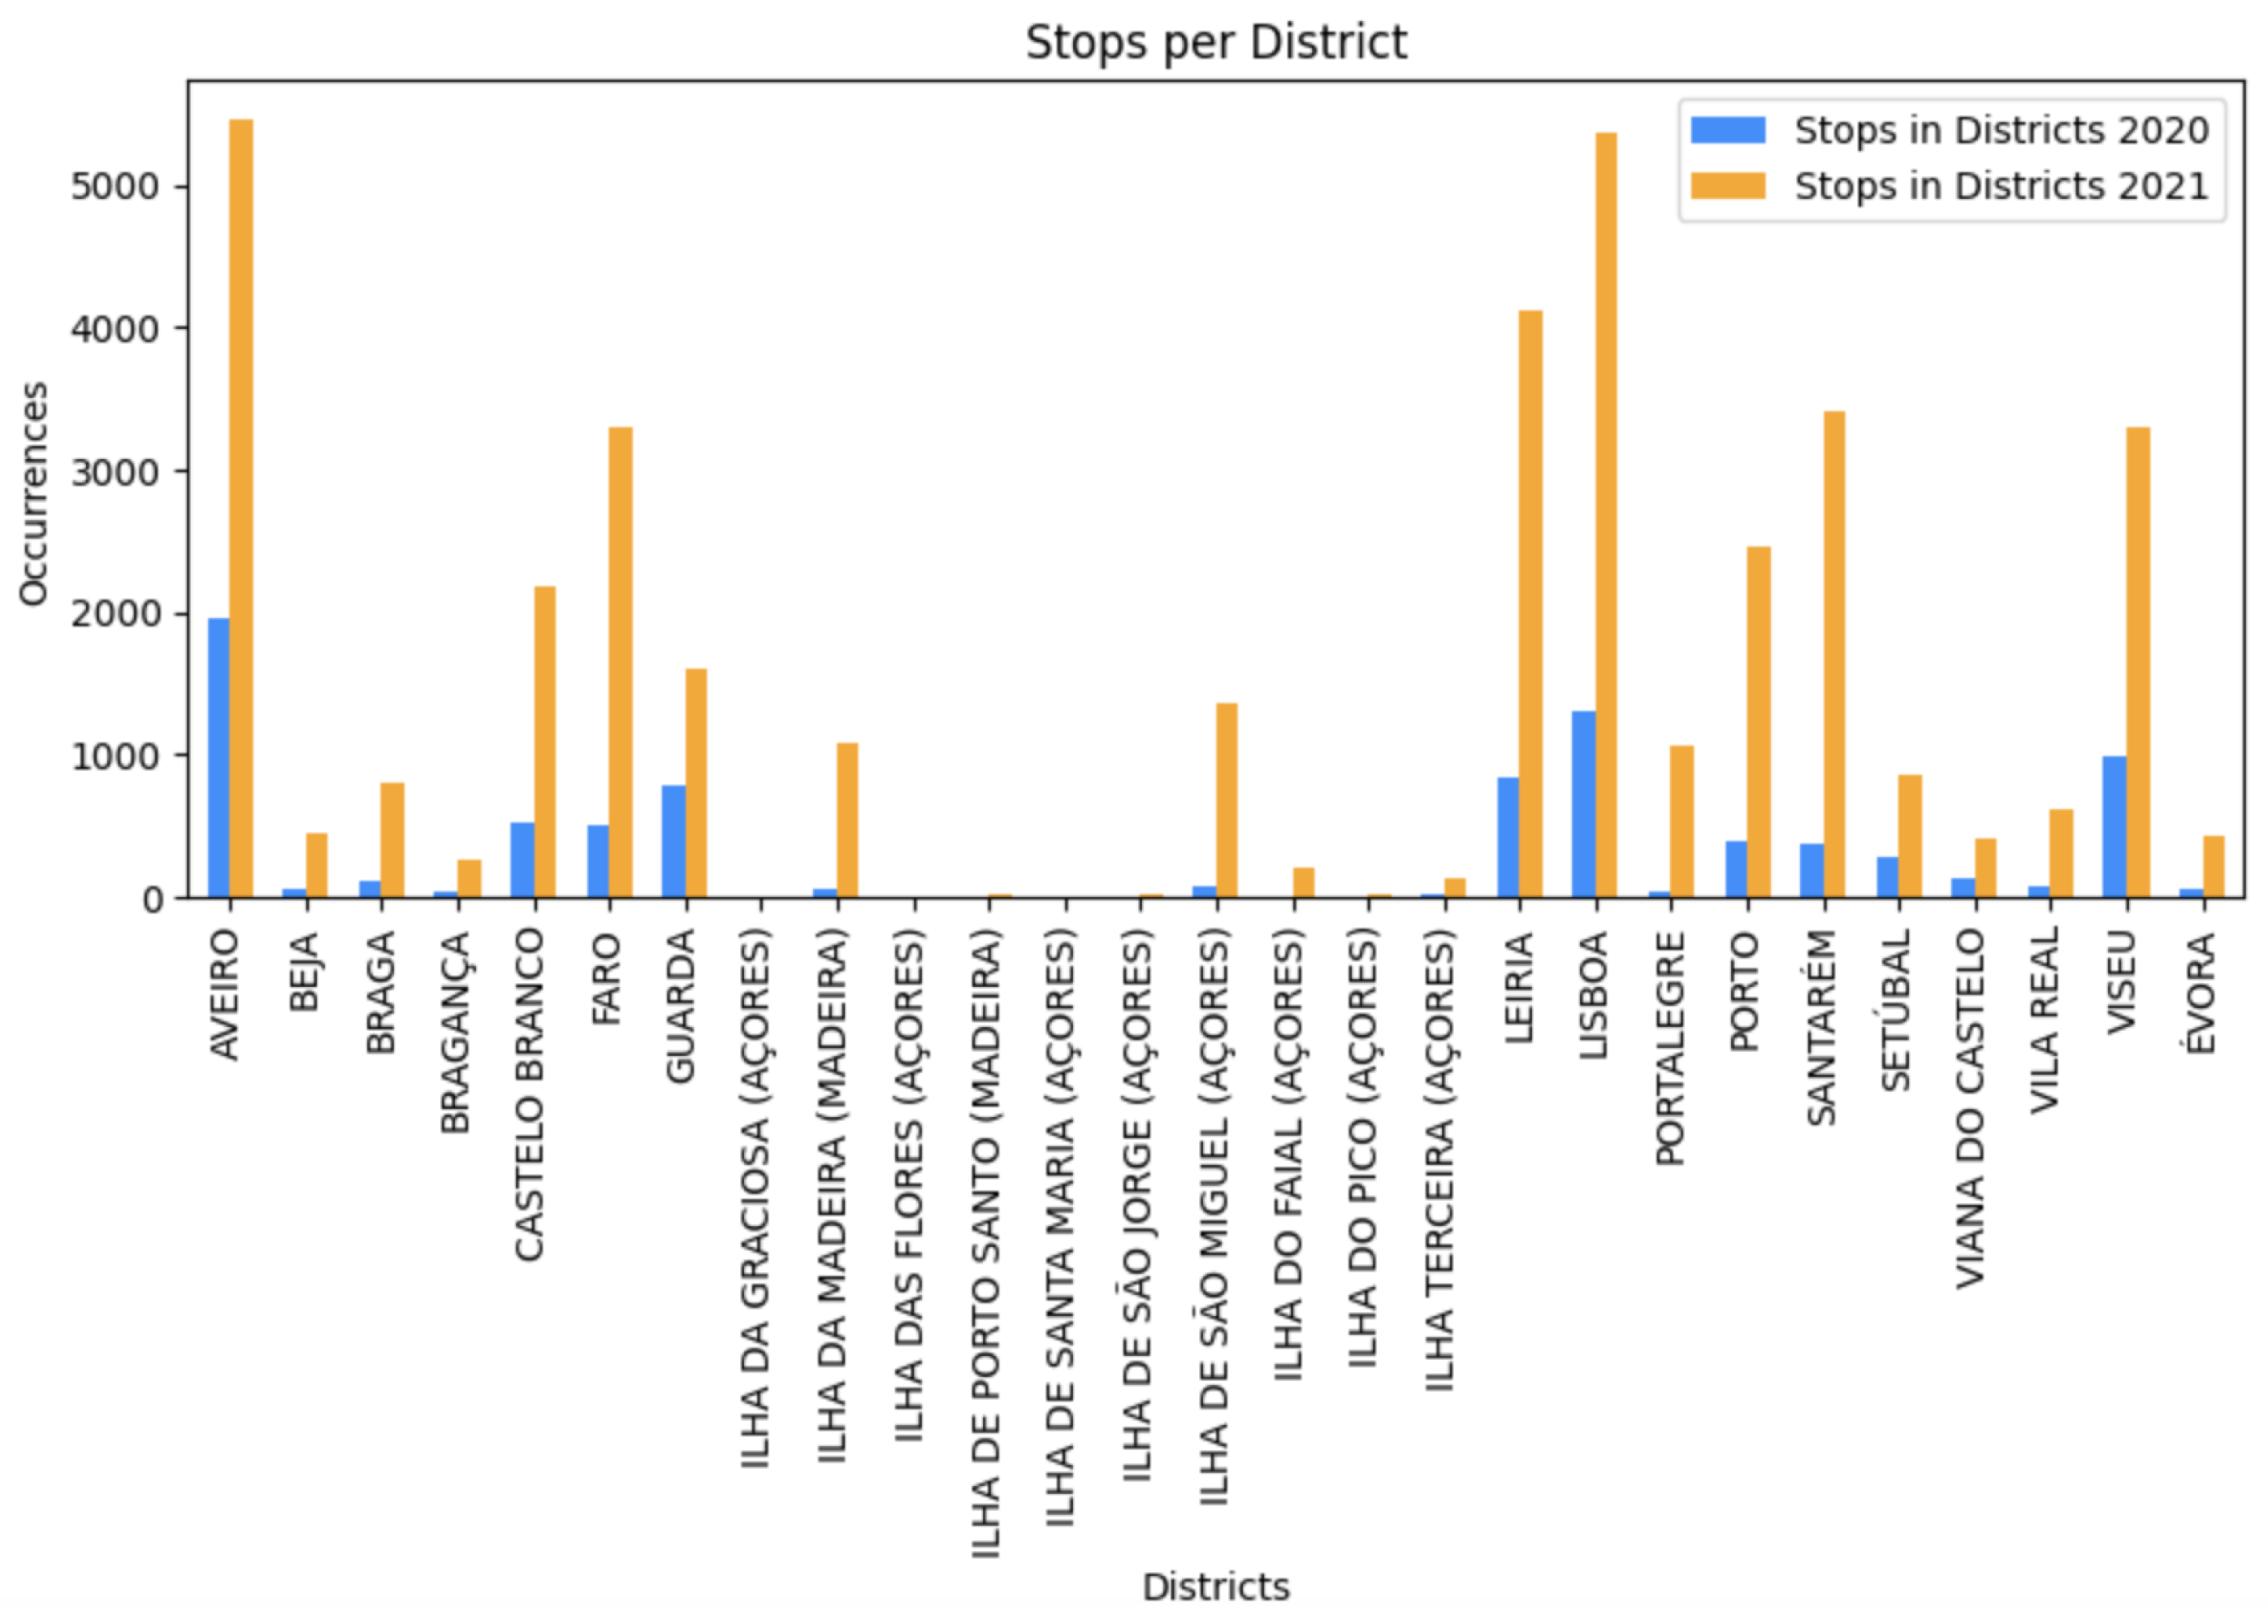
Coimbra was, with distinction, the most visited district in both years, with more than 40,000 stops registered in 2020 and 100,000 in 2021, an increase of 150%. We concluded that, in relation to the total number of stops, 74% of the stops were registered in this district in 2020 and 67% in 2021. So, besides the augmentation of stops in Coimbra in 2021, the percentage of stops in 2021 was lower compared with the previous year. To compare the visits in the other districts, the graph in
Figure 9 calls attention to the difference in the visits in the rest of the districts of Portugal.
The data comprehend two months that in Portugal are considered typical months of vacation when it is common for people to travel to other locations, and also months when typically people return to normal routines (school and work). Some districts where the increase in the number of visits is notorious, such as Faro, Santarém, and Portalegre, are considered typical regions for tourism in Portugal. So, it can be inferred that the number of visits to these locations increased in 2021 most probably because of the tourist attractions and because no contingency measures were applied during that vacation period.
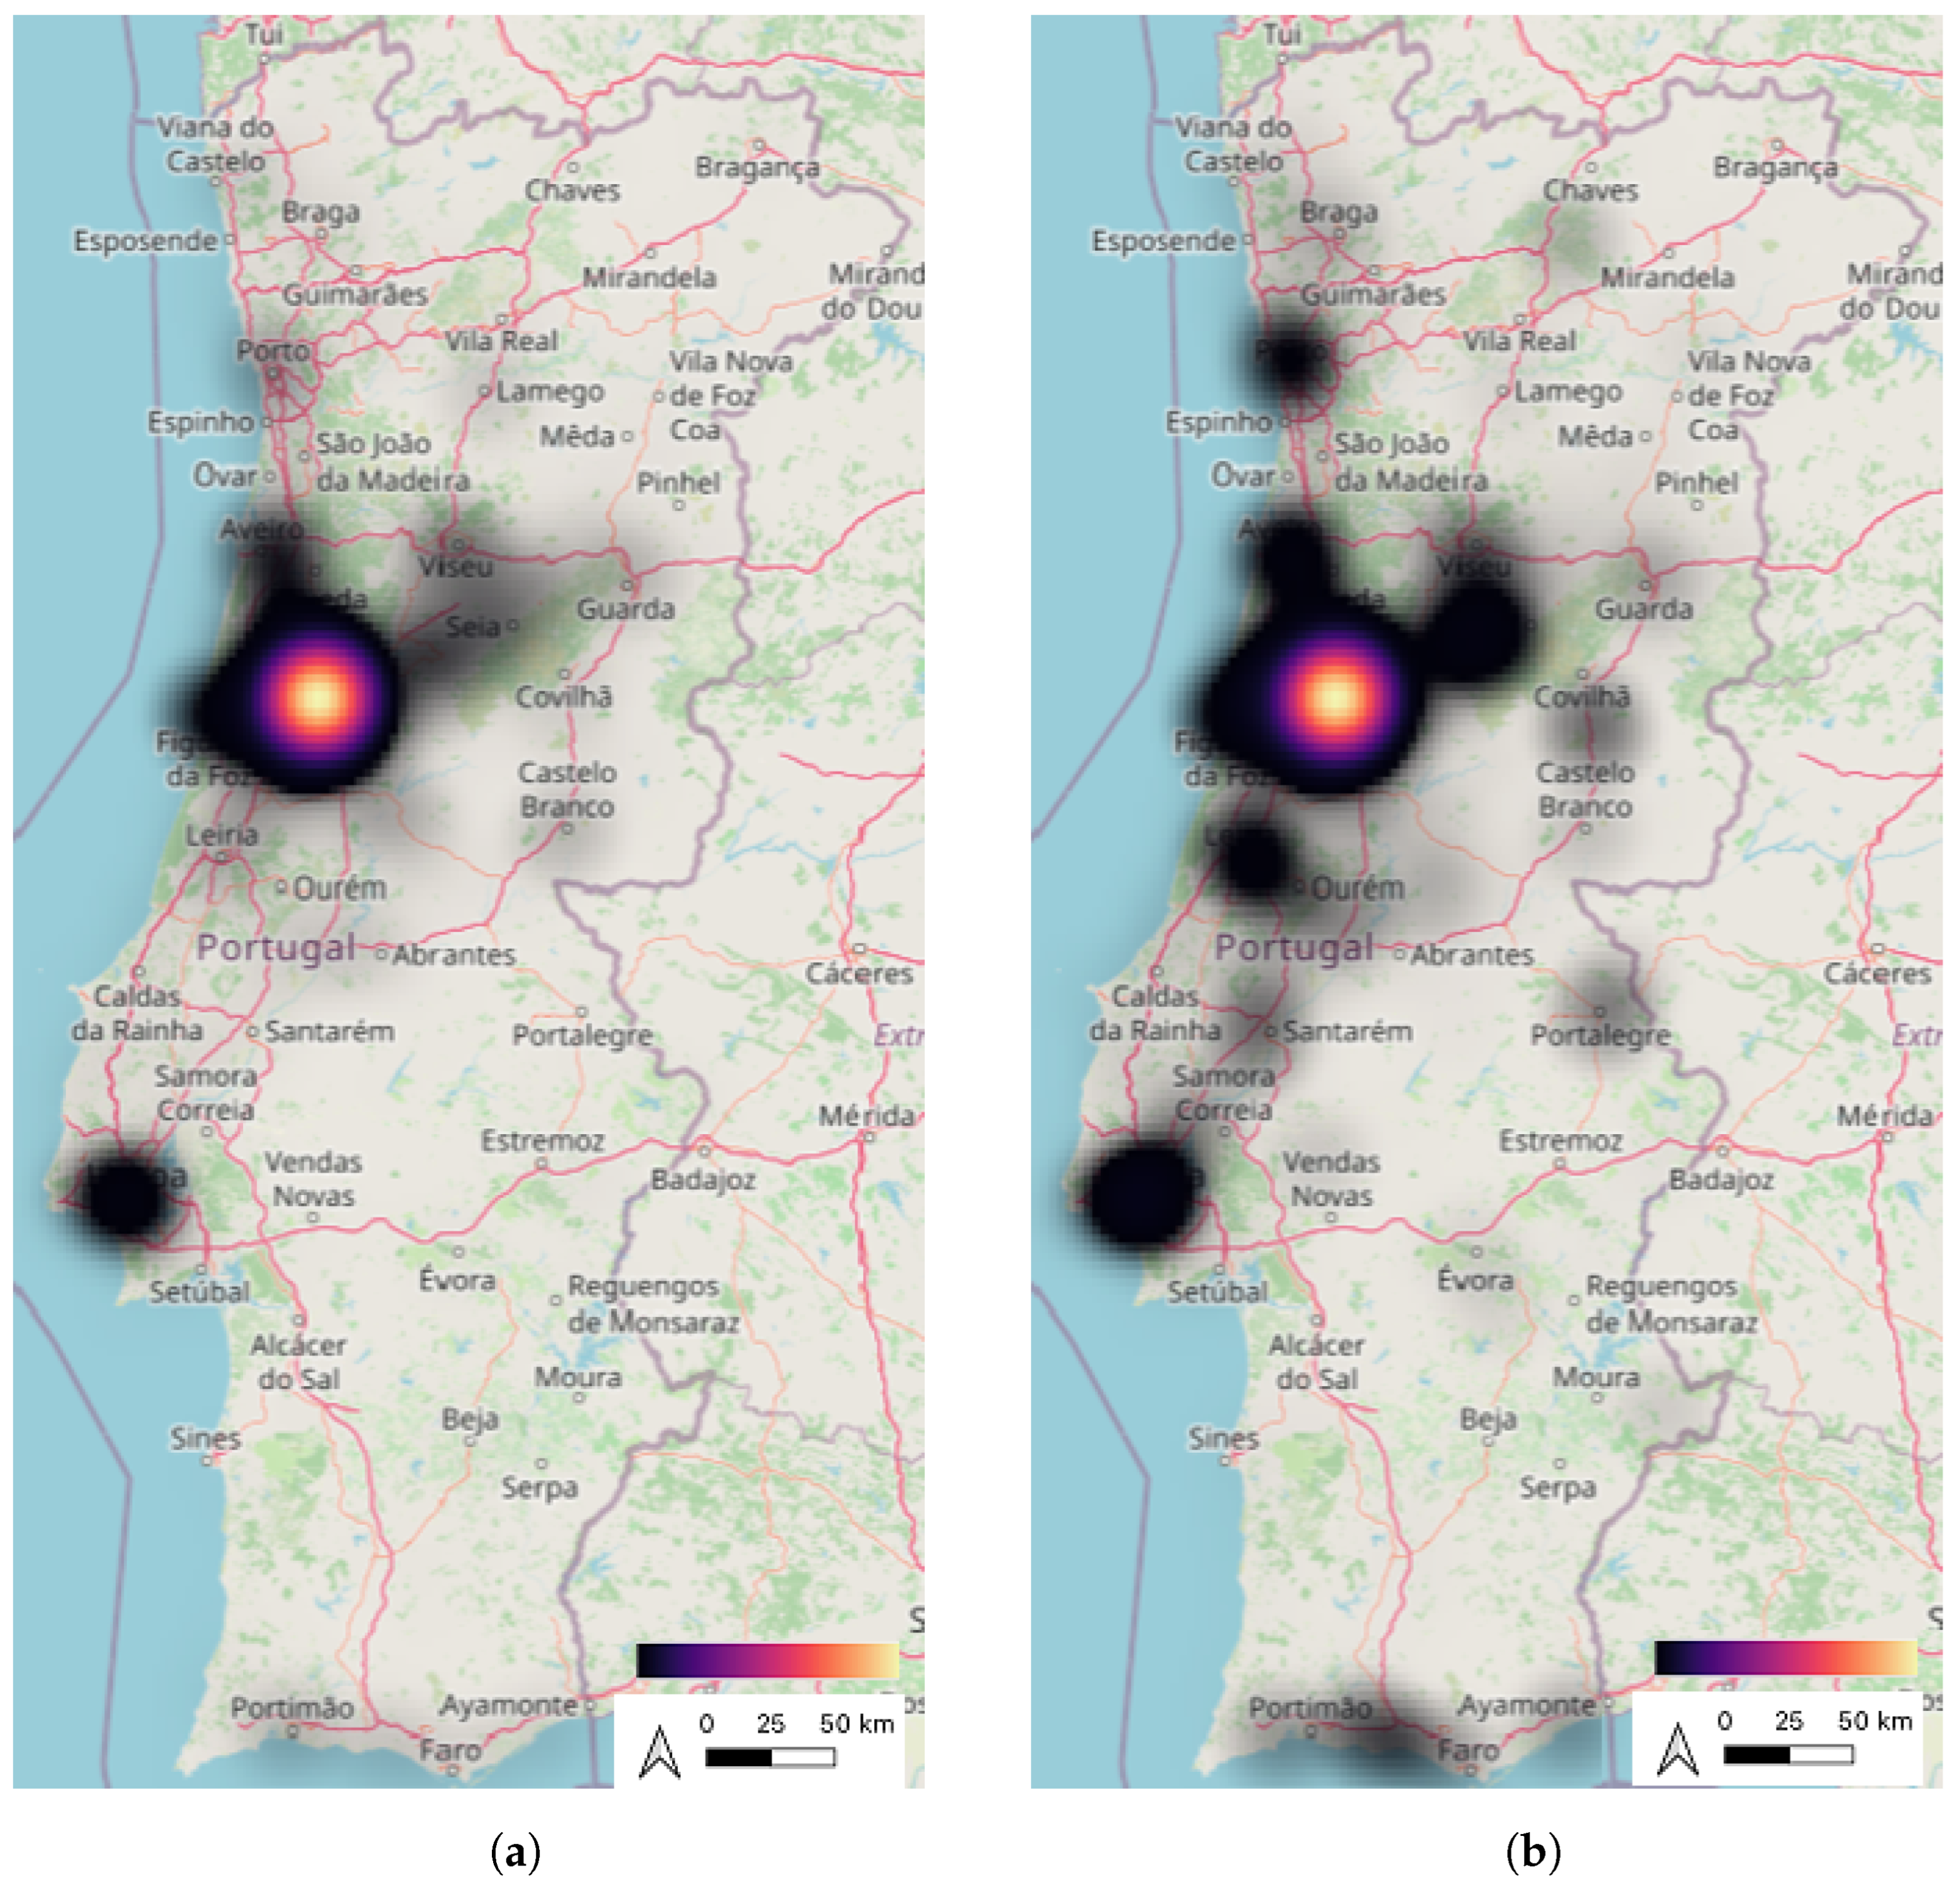
The heatmaps in
Figure 10 were generated in QGIS (QuantumGIS), a Geographic Information System (GIS), and highlight the districts where most of the stops were made in 2020 and 2021. These figures also enhance the analysis of the distribution of stops across the country, showing that in 2020 most of the stops were registered in Coimbra, the district of residence, or in the neighboring districts. On the contrary, other areas of the country were visited in 2021, with a higher frequency.
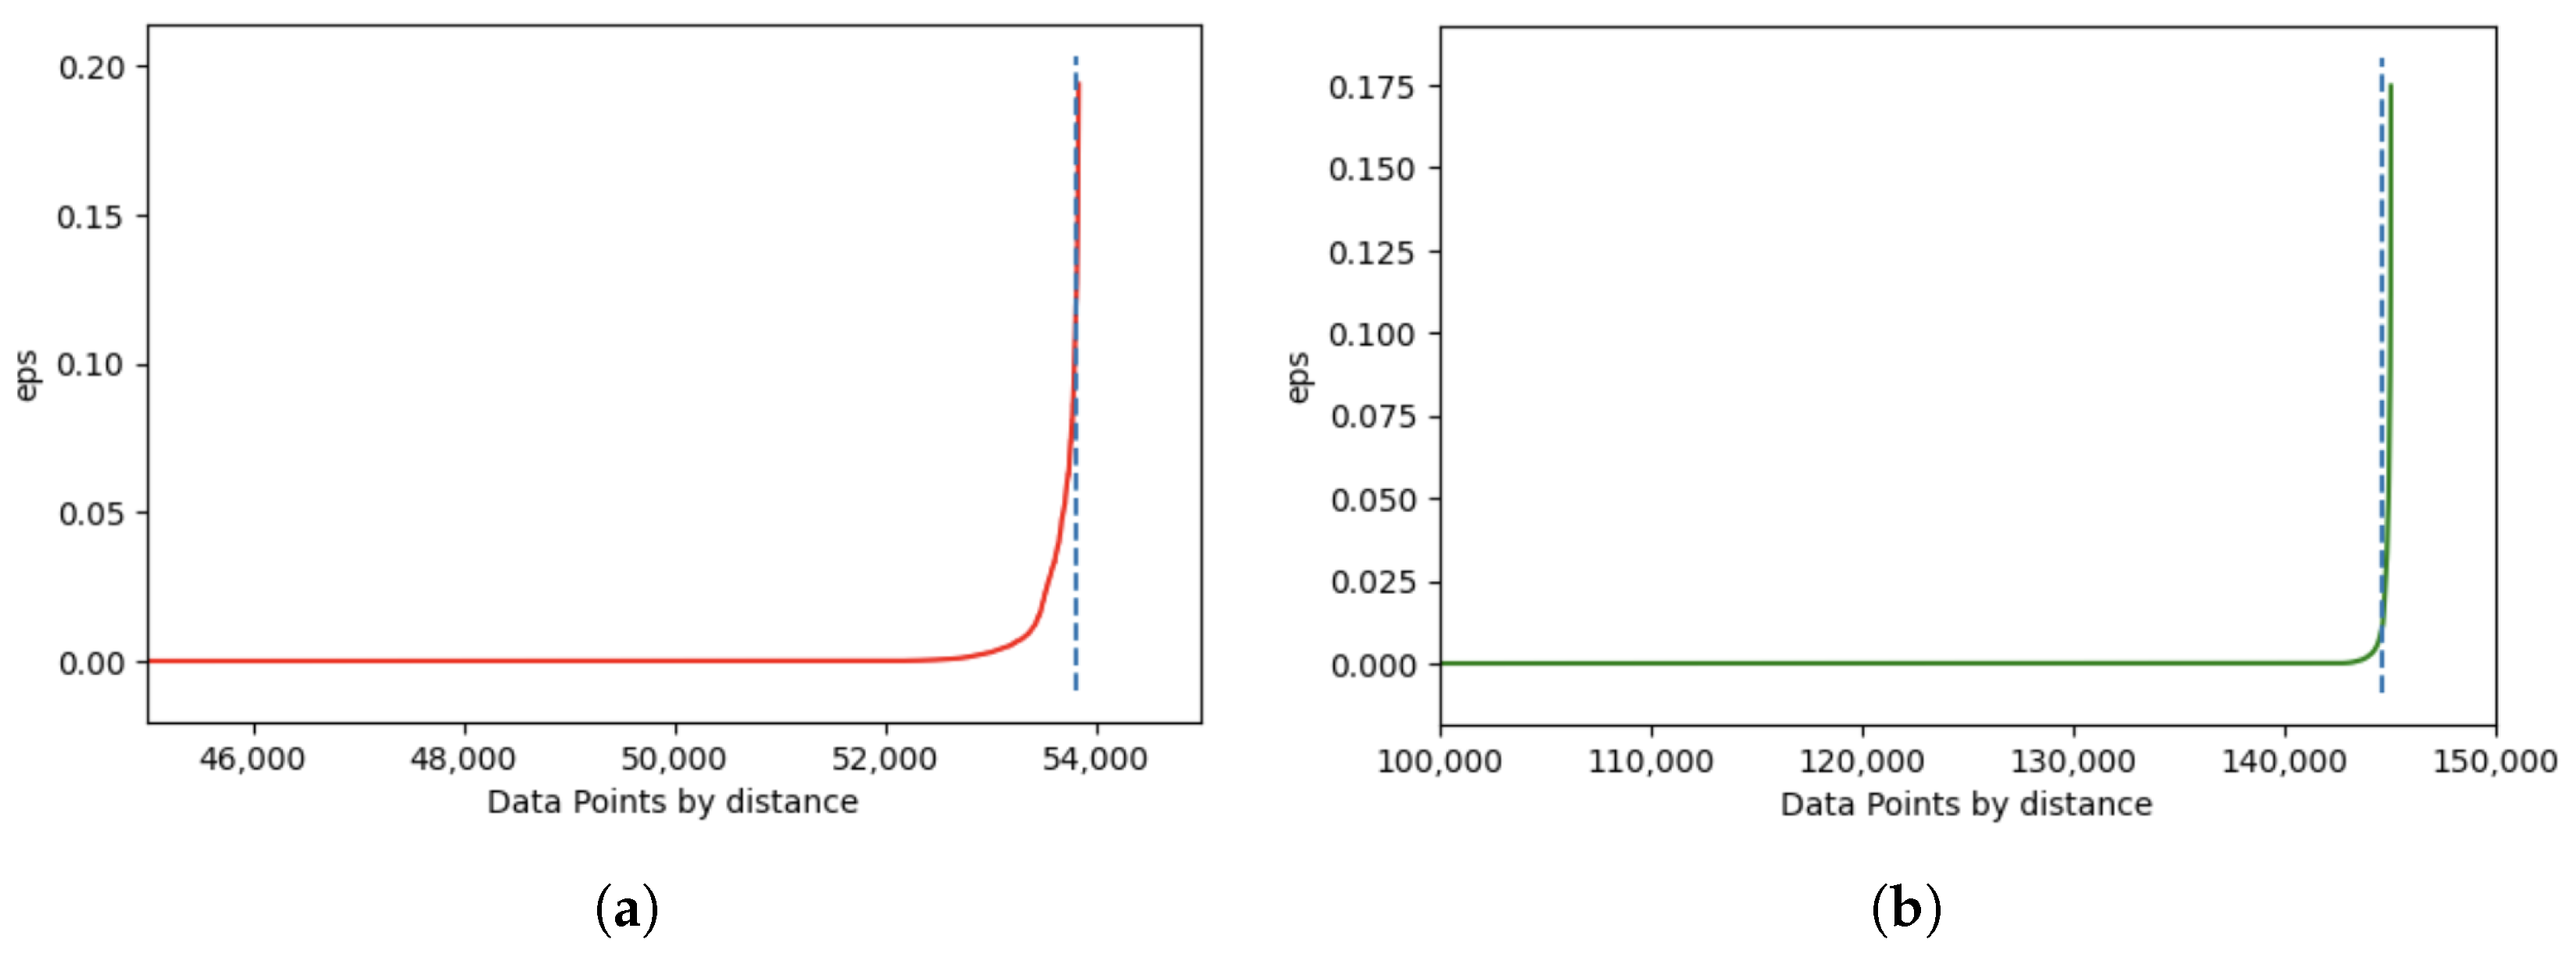
As mentioned in
Section 5.3, the average number of stops in each period was used as the minimum number of points.
Figure 11 presents the k-dist graphs with the detection of the knee/elbow to identify the ideal eps. Therefore, the parameters applied to the stops detected in 2020 were 9 for the minimum number of points and an eps equal to 0.10738 decimal degrees; and in 2021 a minimum number of points equal to 32 and an eps equal to 0.010172 decimal degrees. As the number of stops is much higher in 2021 and the stop points are closely located, the distance between points is inferior which influenced a lower value of the optimal eps.
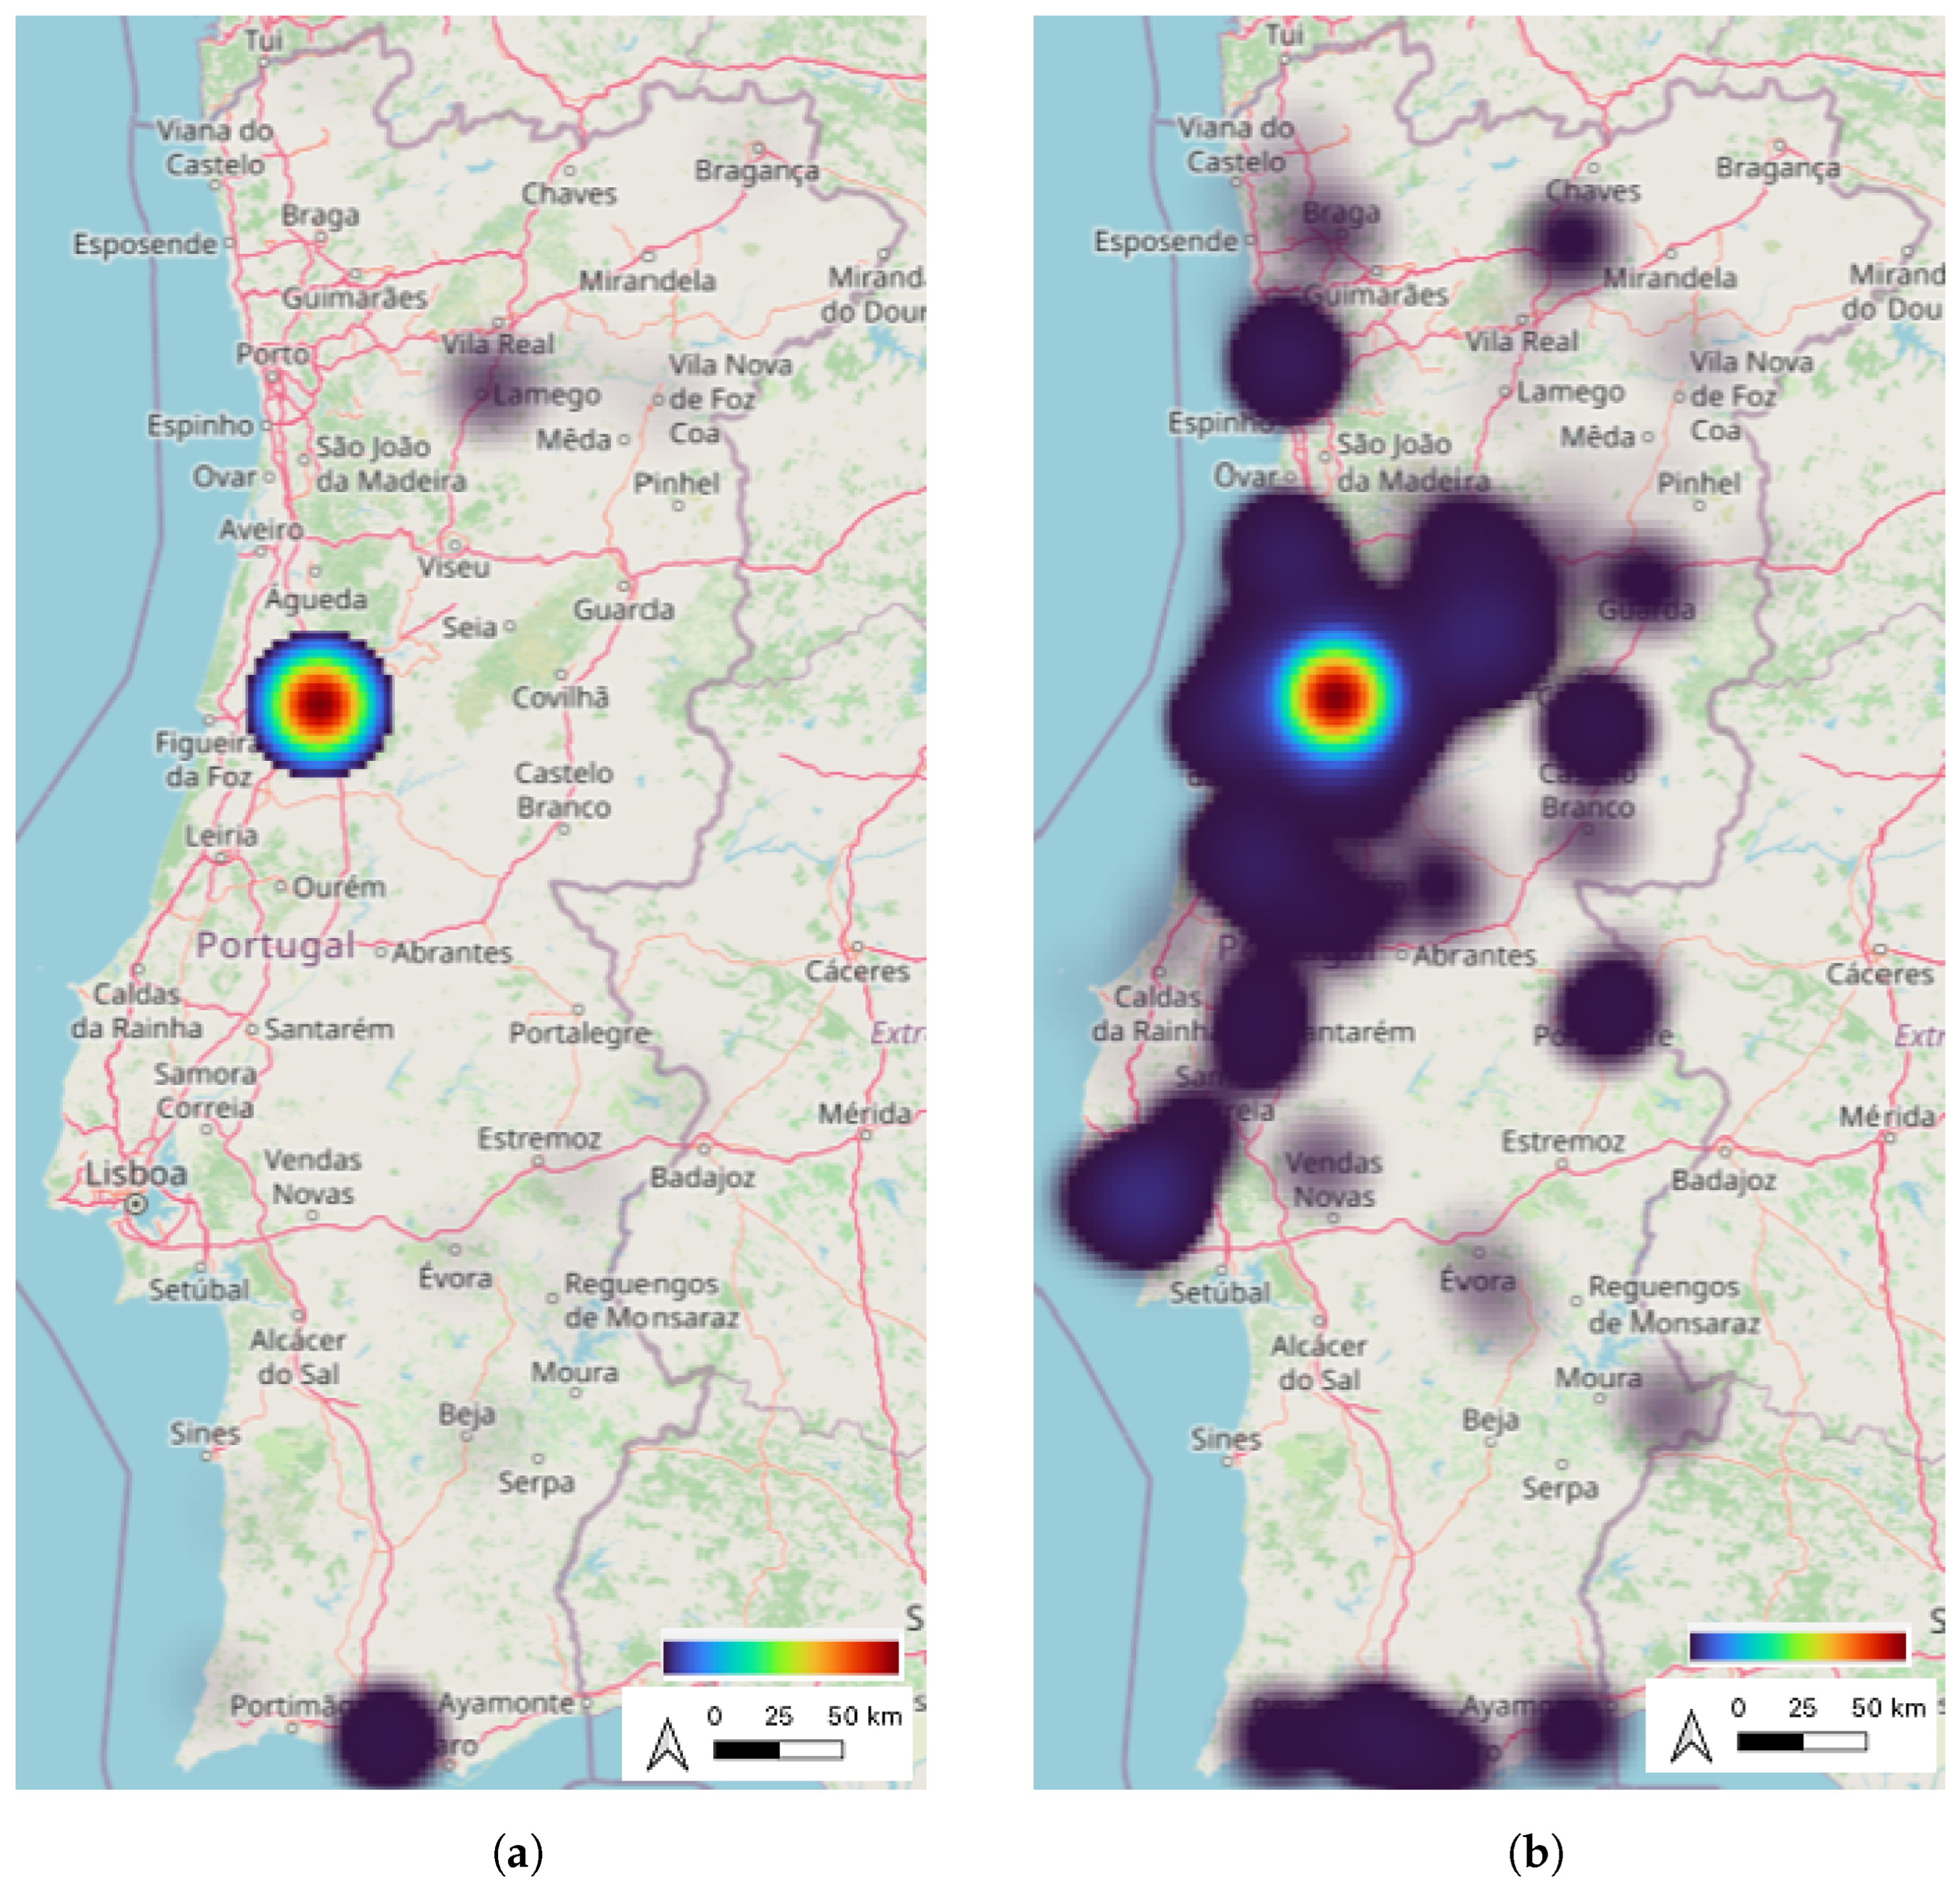
After applying the density-based clustering algorithm, 17 clusters were found in 2020 and 281 in 2021. The heatmaps in
Figure 12 were also generated in QGIS, and represent the clusters found. In the heatmaps, significant clusters are illustrated. These maps were created based on the weight of the clusters, which means that regions where more clusters were found are more highlighted (have a brighter color). As observed, in the first year, most of the locations visited were in Coimbra, with some exceptions, for example, visits to the south of Portugal. In the following year, even with the extreme number of infections and deaths, according to DGS [
31], especially in the region of Lisbon and the northern region of Portugal (
Figure 1), the individuals traveled and visited almost all districts across the country.
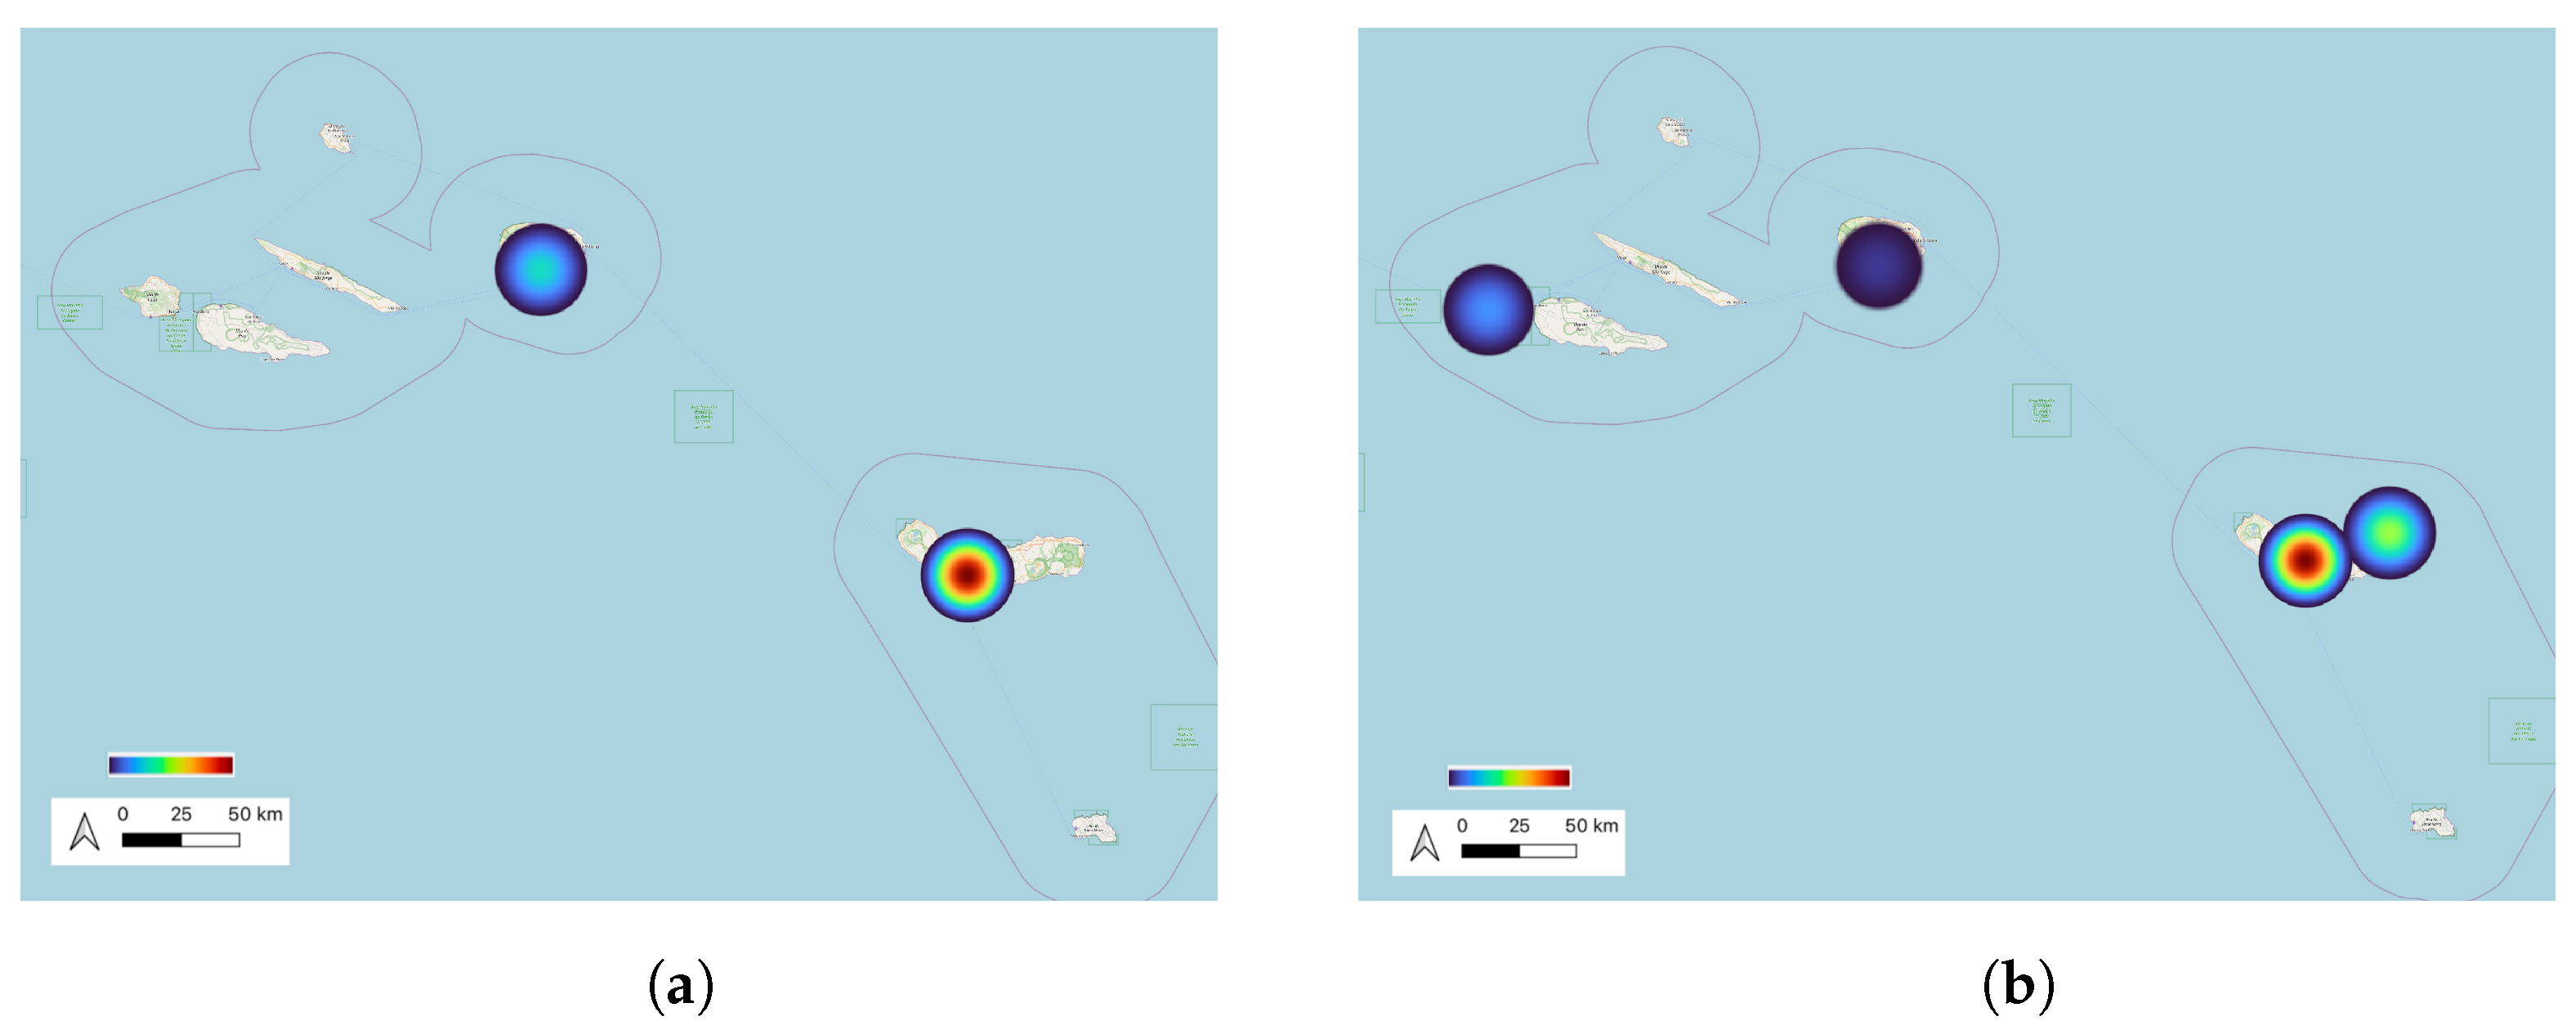
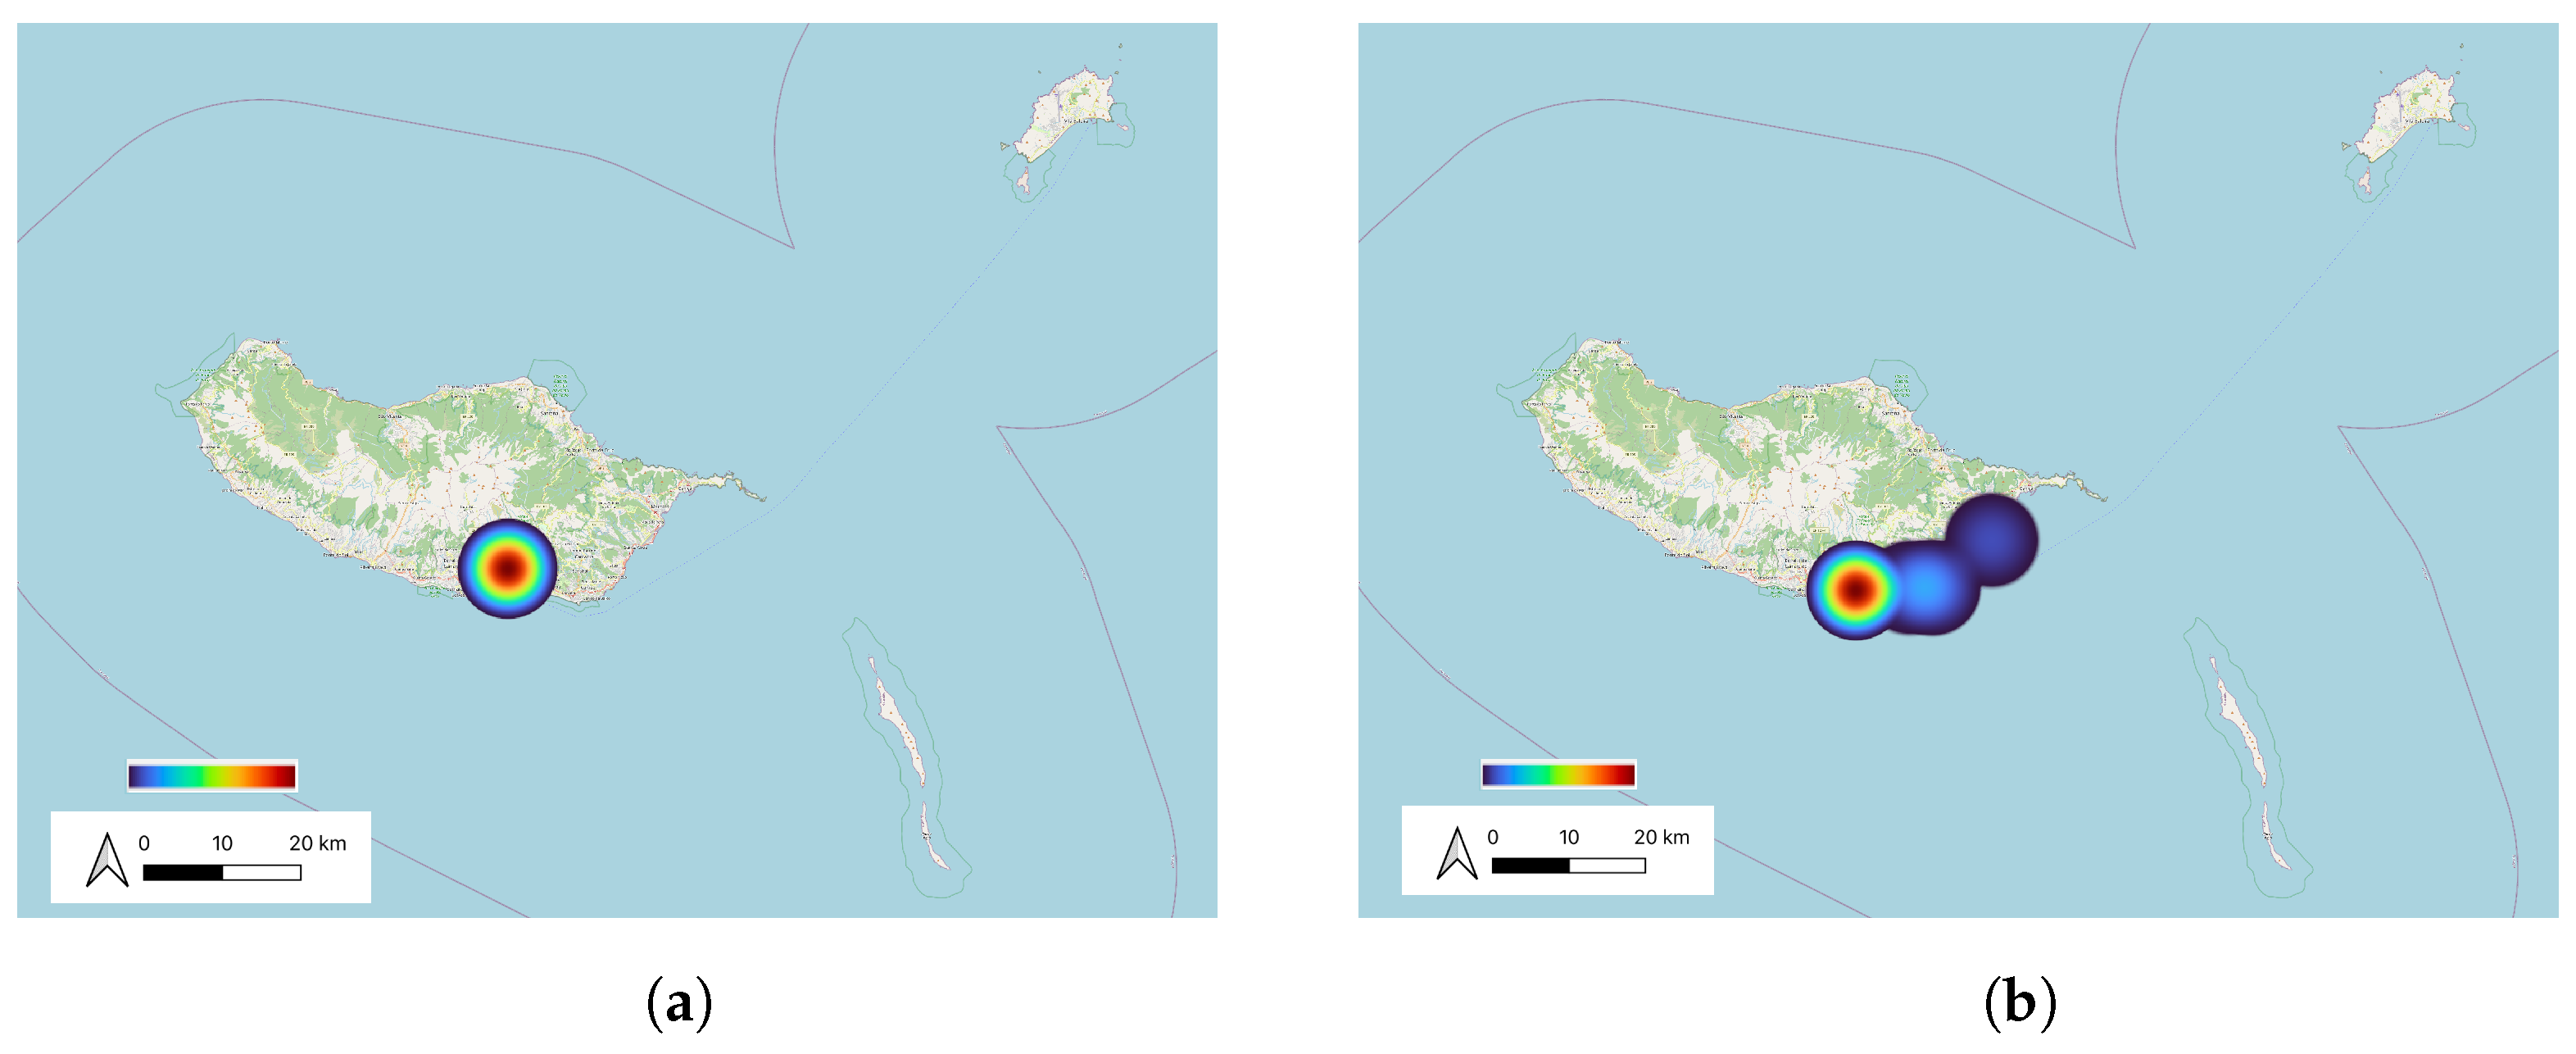
The same was verified on the Azores and Madeira islands, in
Figure 13 and
Figure 14, where it is observable the identification of more clusters in 2021. The islands are also regions with higher levels of tourism, which can be an explanation for the increase in visits in 2021.
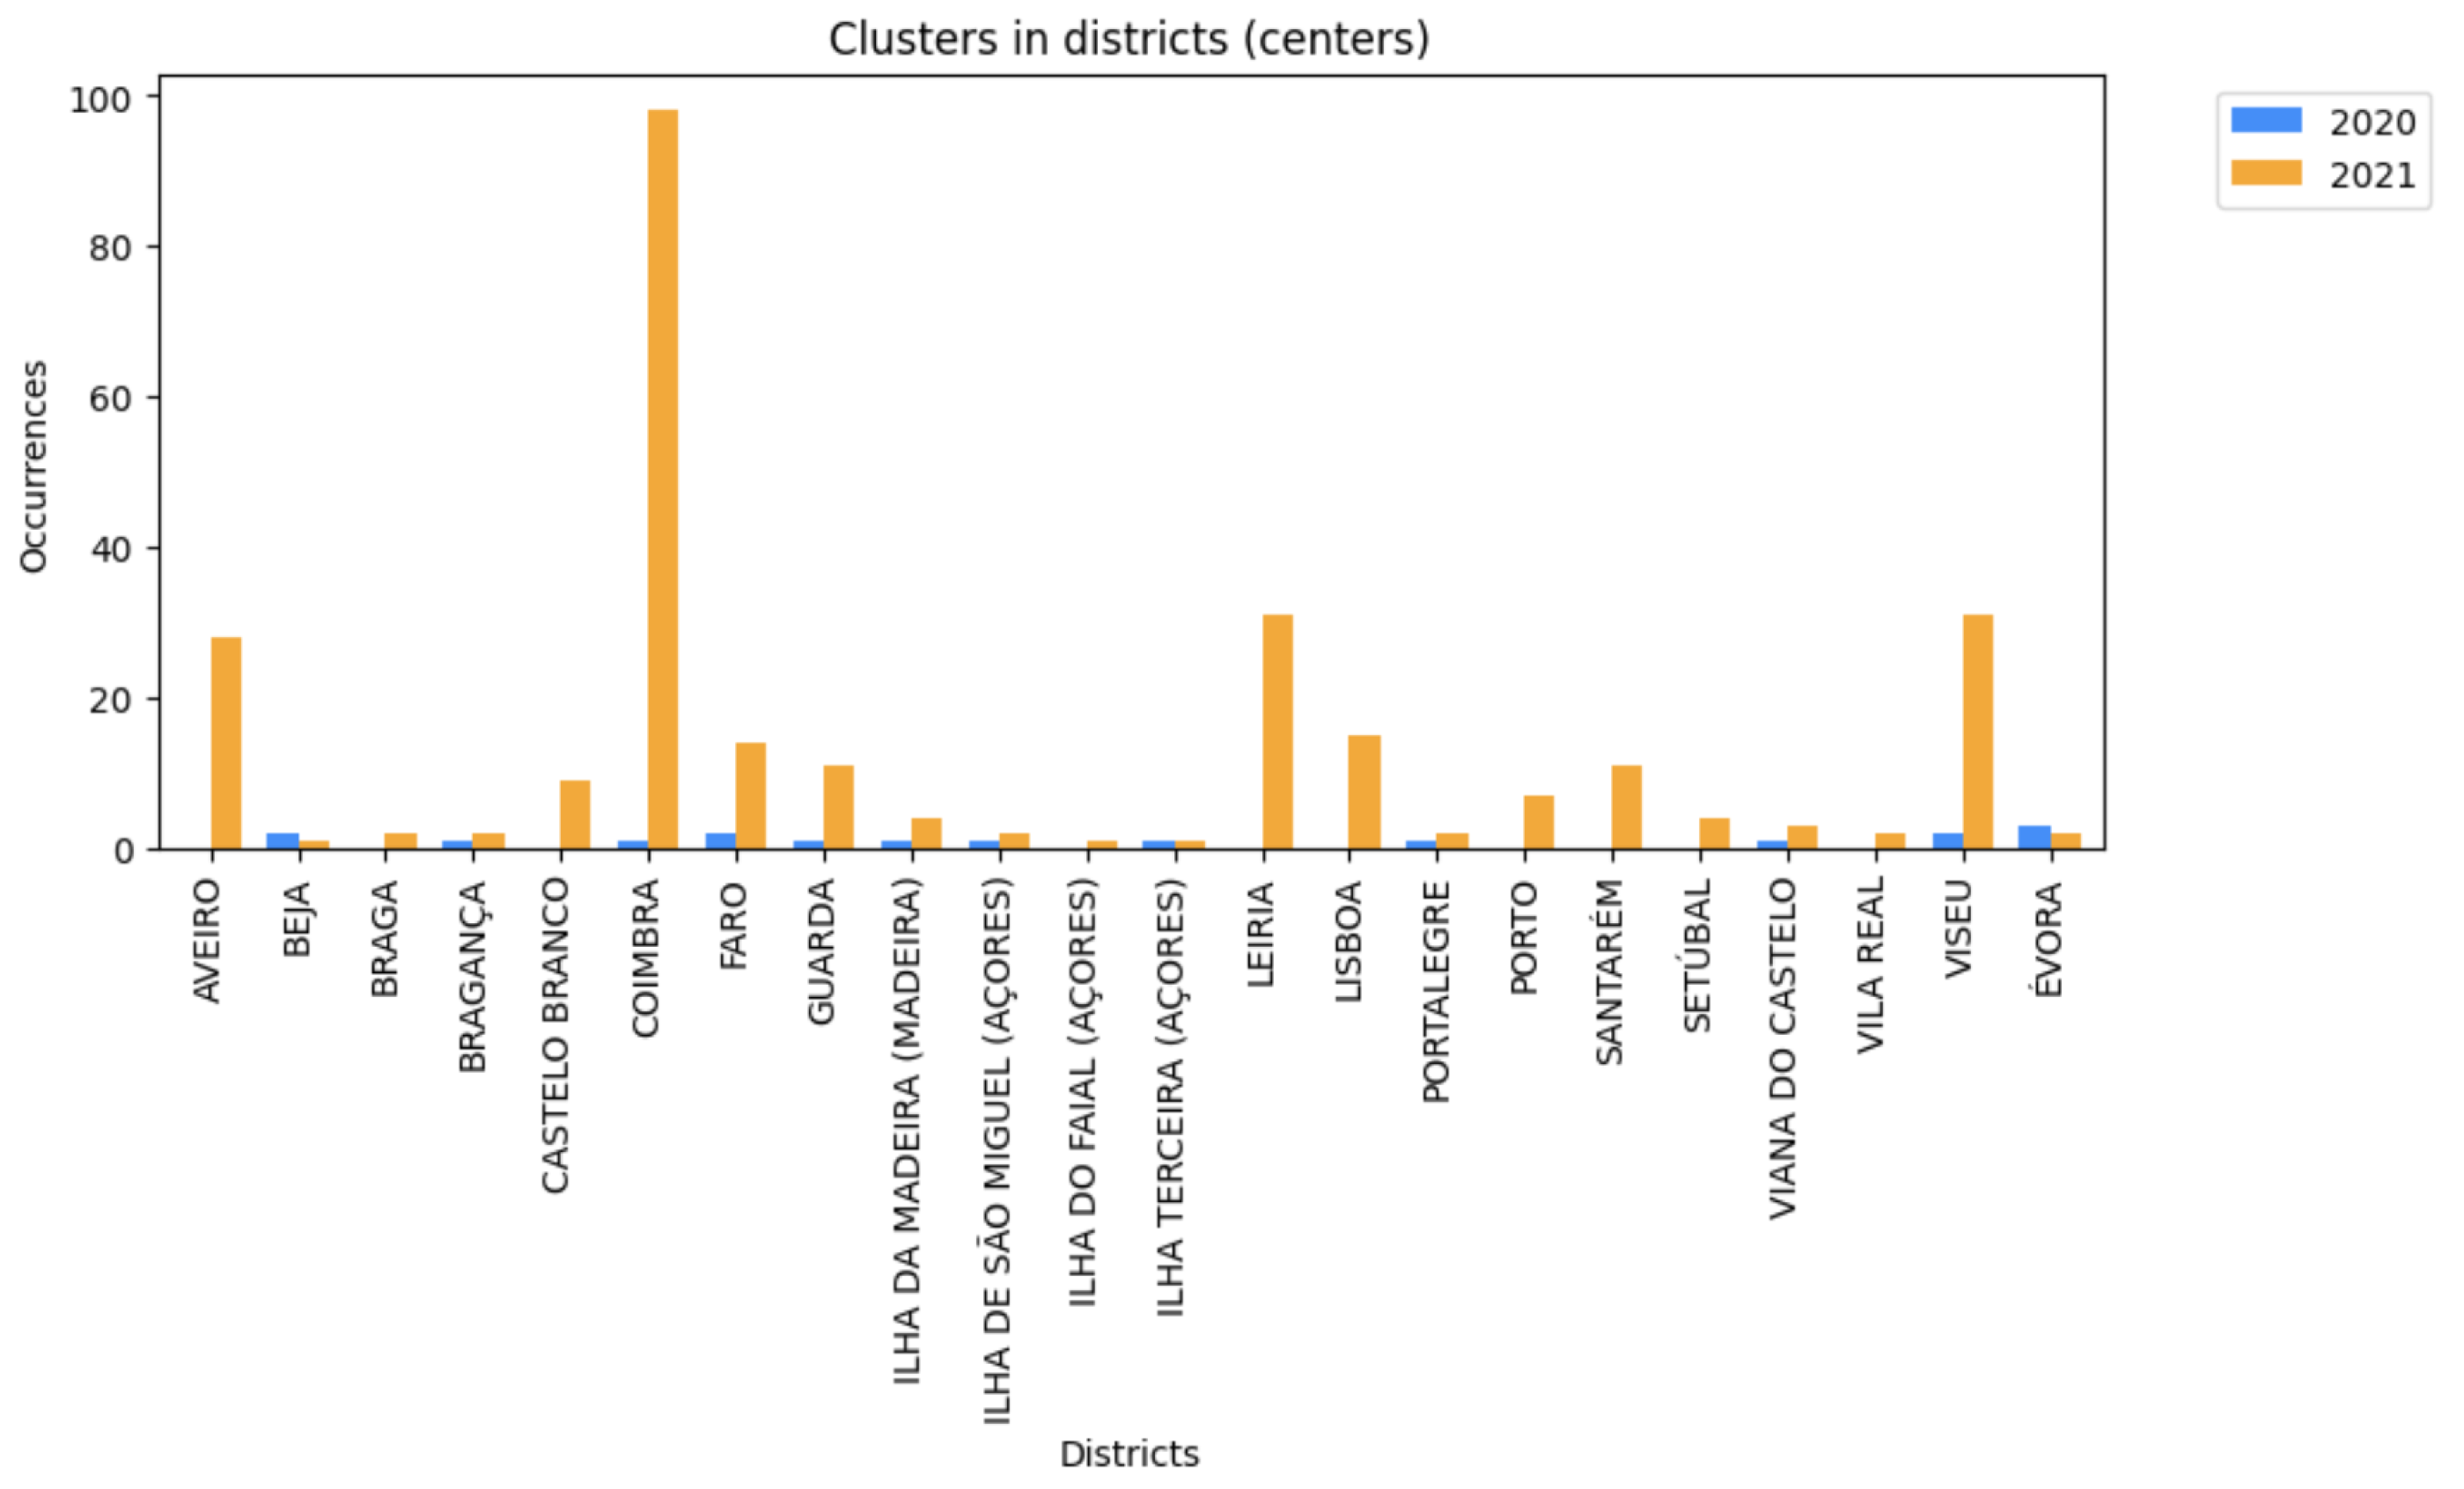
As observed, more clusters were found in 2021, indicating that people visited more locations in 2021, even though in September and October of 2020 most of the contingency measures were already dropped. A cluster can comprise stops from more than one district. The graph in
Figure 15 shows the districts where centers of clusters were found. These conclusions were taken after the identification of the antenna that was closest to the centroid of the clusters. Contrary to 2020, where some of the districts were not associated with a cluster’s center, in 2021, in most of the districts, at least one center of a cluster was identified. This graph highlights the differences observed in the heatmaps presented in
Figure 12,
Figure 13 and
Figure 14, giving knowledge about the enlargement in visits in 2021 and proving that in this year more islands of the Azores were visited.
It is observed an elevated identification of clusters in 2021 in the district of Coimbra. This occurrence is associated with the DBSCAN parameters. Coimbra was a district with an elevated number of stops identified, and although the algorithm was applied with a higher minimum number of points, the smaller eps that was applied might influence the increasing number of clusters. Nevertheless, this analysis intends to compare the identification or no identification of clusters in the districts and islands of Portugal.
6. Routine Locations Analysis
Besides comparing the movements in the two pandemic years, this study traces the changes in routine location visits in Coimbra. Mobile phone and crowdsourced data with semantic information were used to observe if visits to particular types of daily routines, such as shopping, physical exercise, or attendance in bars or restaurants, have changed as a result of business closures during the public health emergency.
6.1. Semantic Information: Points of Interest
A POI is an entity of interest with a well-defined location. There is a wide range of POIs such as famous landmarks (e.g., museums, churches, towers), natural attractions (e.g., bays, coasts, waterfalls), or commonplace spots (e.g., coffee shops, taverns) [
39]. The spatial distributions of POIs and the characteristics of the areas reveal different urban functions which can be associated with activities. For different types of activities (e.g., sports, eating, shopping), people can usually go to specific areas [
8]. Data taken from location-based social networks are important for a wide range of research areas, providing new opportunities for analyzing urban dynamics and structures. Facebook is probably one of the most popular social networks to connect with others. In 2010, the Facebook social network launched Facebook Places, a location-based service that allows users to check into POIs and share their physical location with friends [
40].
Facebook Places is an associated geo-location service developed to help users share their favorite spots and discover new ones. Users can “check-in” at various locations, from cities to small stores. Friends who see these events in their “News Feed” can then respond to these check-ins by liking or commenting on them. Ultimately, these crowdsourced data consist of the places people go and how their friends react to them. Additionally, users are given the ability to create a new POI if the one they intend to “check-in” or comment on does not possess a Facebook page. In total, the dataset contains 221,724 unique points spread over hundreds of categories of different hierarchies.
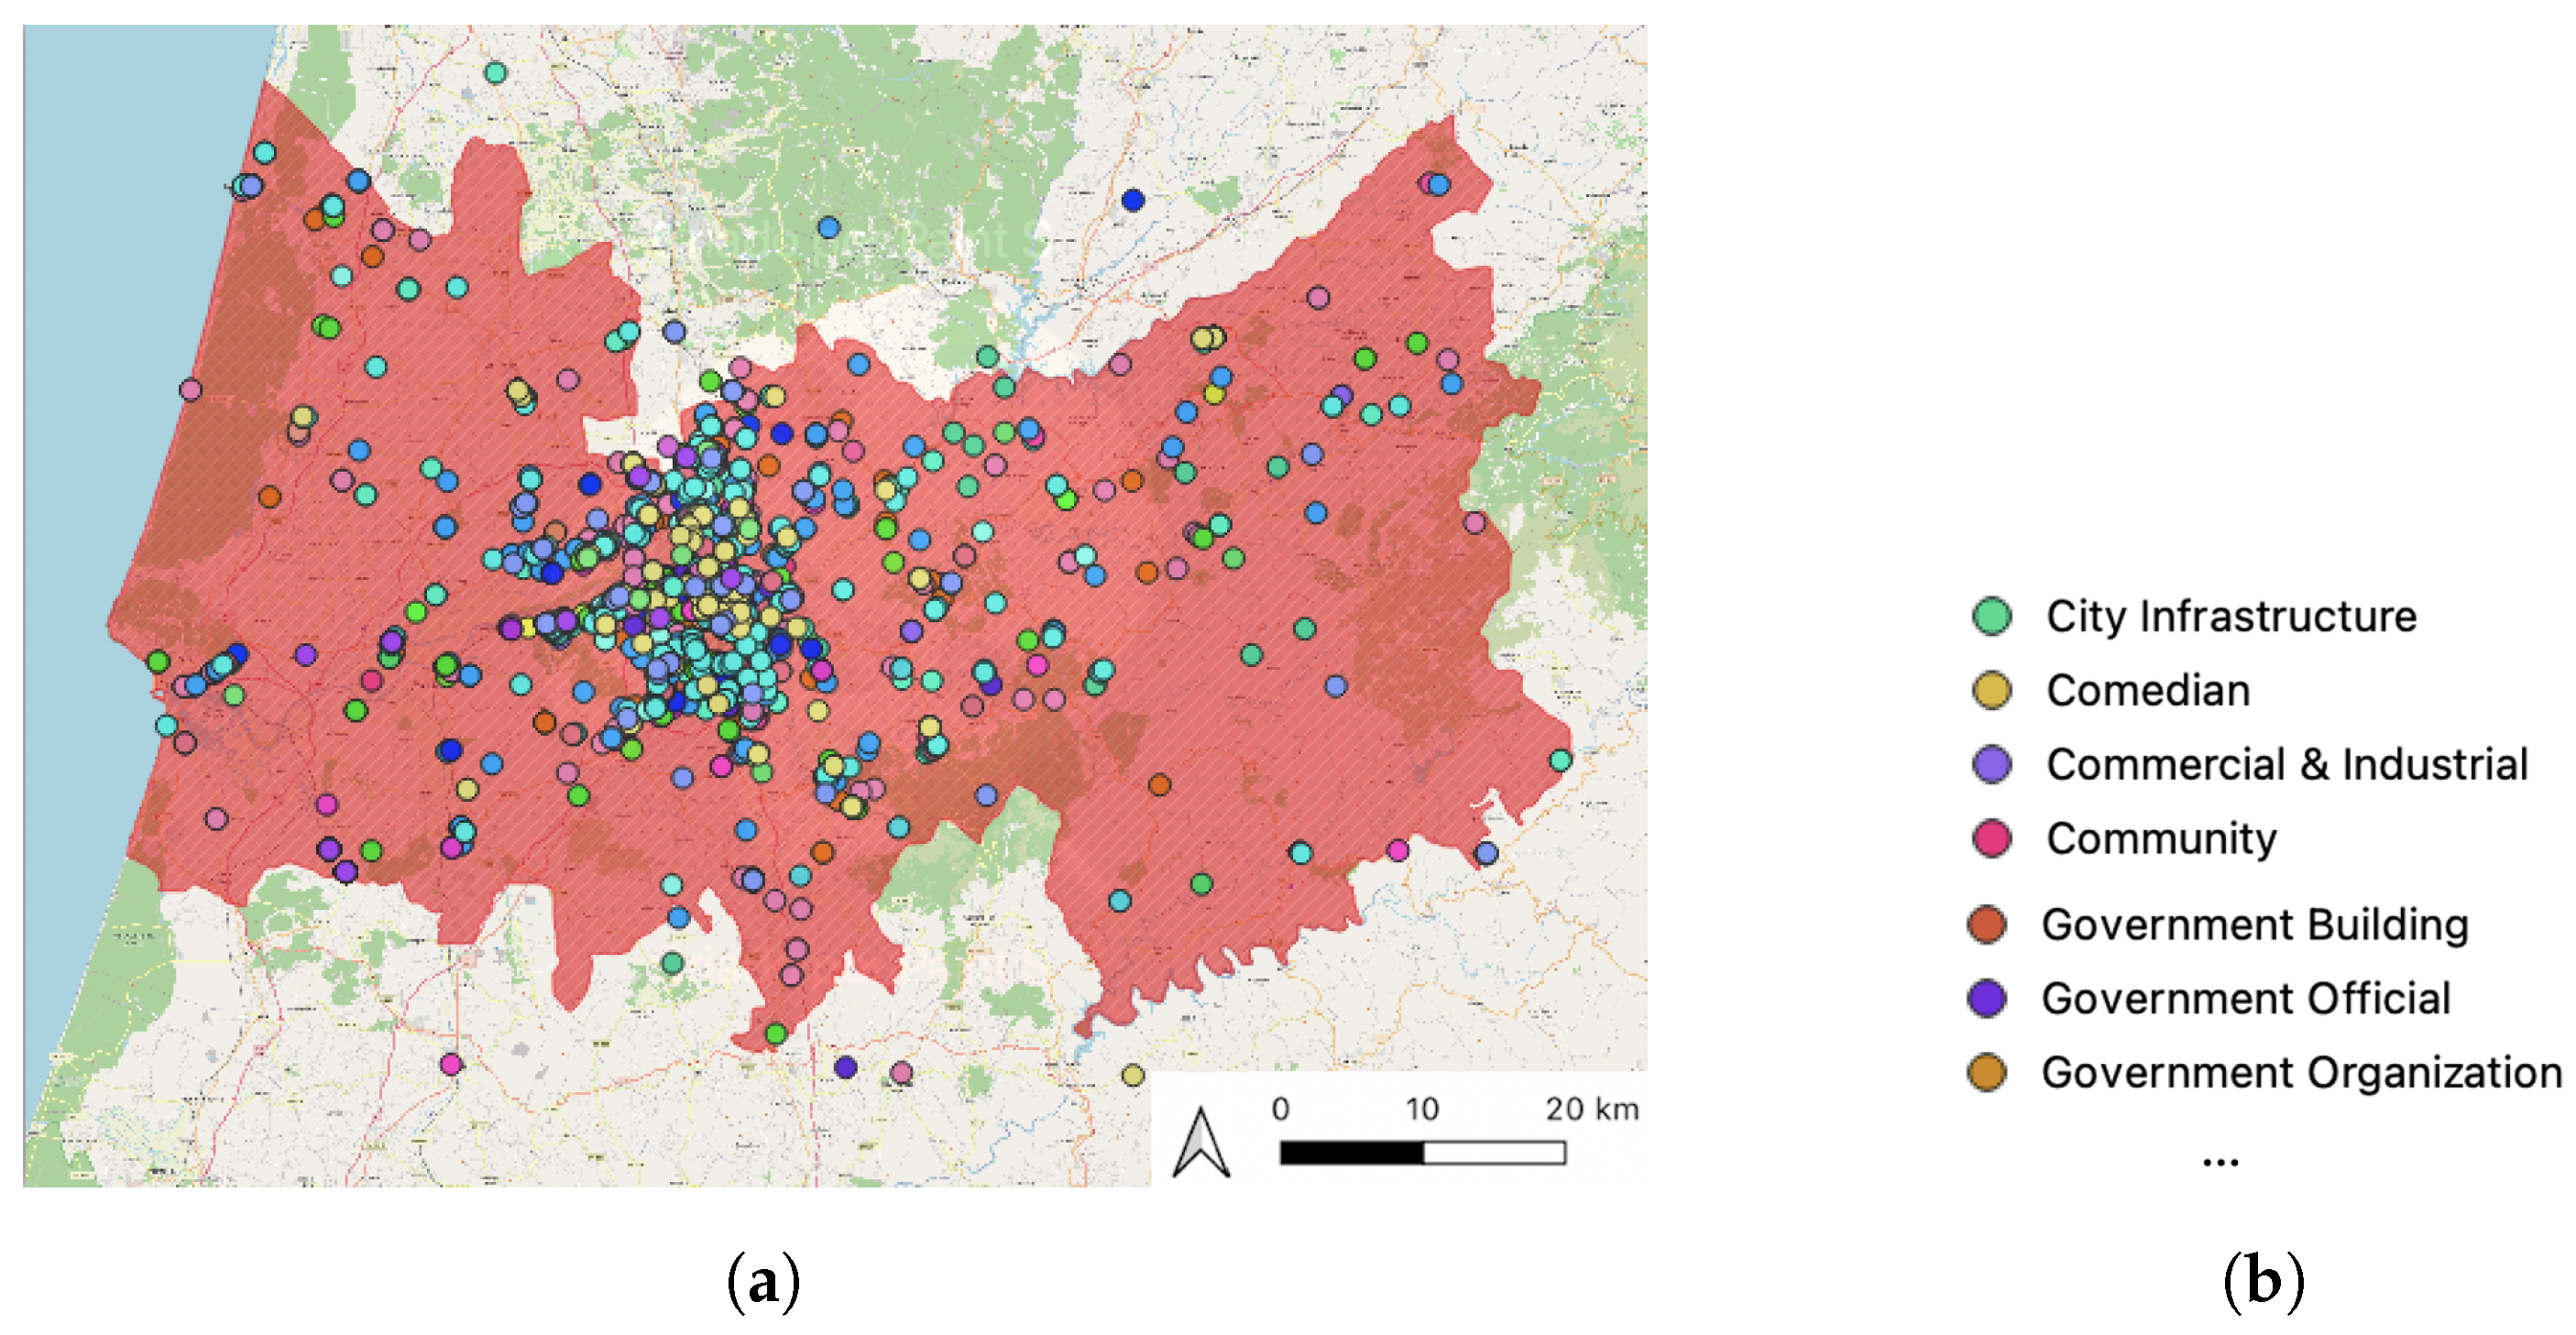
Figure 16 presents the Facebook POIs in the study area, where each POI belongs to a category that is represented by a color.
The crowdsourced dataset used in this analysis, containing the Facebook POIs, had already been constructed for the whole country in previous work [
22]. This allowed access to an extensive offline database. The POIs in this dataset are used for land use classification. The dataset contains such data as the name of the place, the number of “check-ins” in that location, the opening time, the geo-location (latitude and longitude), category to which the POI belongs (e.g., Portuguese Restaurant, Wholesale and Supply Store, etc.), the city where the POI is located and the top category to which the POI belongs (e.g., Food and Beverage, Shopping and Retail, etc.).
6.2. Identification of Routine Locations and Semantic Association
To identify the routine locations, we use an approach from Ferreira et al. [
8] that uses CDRs to identify places that are frequently visited by individuals in their daily life. How people use the land is strongly influenced by the characteristics of the zones. So, POIs are used to classify citizens’ activities outside of the normal home–work commute (i.e., shopping, dining, outdoor recreation). The approach consists of attaching semantic meaning of the areas to the routine locations, to infer the motivations behind the daily mobility. To identify the frequently visited places of the users, the locations are divided into classes of importance with respect to the number of unique visit days: Most Visited Places (MVPs) for locations that are regularly visited, Occasionally Visited Places (OVPs) for the locations of interest that are only visited occasionally, and Exceptionally Visited Places (EVPs) for the non-routine locations. To apply the classification, a relevance metric is used and takes into account the number of unique days that the user visits the location in certain time intervals on different days, over the total number of activity days. For that purpose, each day of the week is distinguished and divided into: early morning (3–6 a.m.), morning—peak hour (6–9 a.m.), morning—work (9 a.m.–12 p.m.), noon (12–2 p.m.), afternoon—work (2–5 p.m.), afternoon—peak hour (5–8 p.m.), night (8 p.m.–12 a.m.), and midnight (12–3 a.m.). Then, the K-Means clustering algorithm is applied, with an input value
k = 3 to distinguish the three different groups. K-Means is a partitioning algorithm that attempts to divide the dataset into
k pre-defined distinct non-overlapping clusters where each data point belongs to only one group [
41].
Then, the boundaries of the regularly visited antennas are defined and the POIs from the Facebook Places database in each region are analyzed. The boundaries to discover the POIs associated with the most visited locations of the individual are defined, taking into account the coverage angle and maximum range of the antenna in the study area. As observed in
Figure 17, this results in the creation of circular sectors, corresponding to the antenna signal [
8]. As the individual has to be within the boundaries of the signal range in order to connect to the corresponding antenna, there is more probability of inferring the correct location of the individual.
Thus, the routine locations are identified according to the activity of the user on the network (routine locations are associated with antennas where most of the activities were registered). Then, the activity to which the individual is more exposed in the region is returned, depending on the time of visitation, the day of the week, and the percentage of POIs of each category inside the area to classify. Finally, the routine location is associated with an activity.
6.3. Comparison and Discussion
As mentioned, the Facebook Places database presents POIs that are classified into multiple categories. After the identification and classification of the routine locations, we observed the differences in both periods, taking into attention that in 2020 there were some restrictions associated with some facilities, such as restaurants. A total of 46 and 47 different categories associated with routine locations were identified in 2020 and 2021, respectively. The identification was based on the activity that occurred in the district of Coimbra, which means that the locations identified are located in this area.
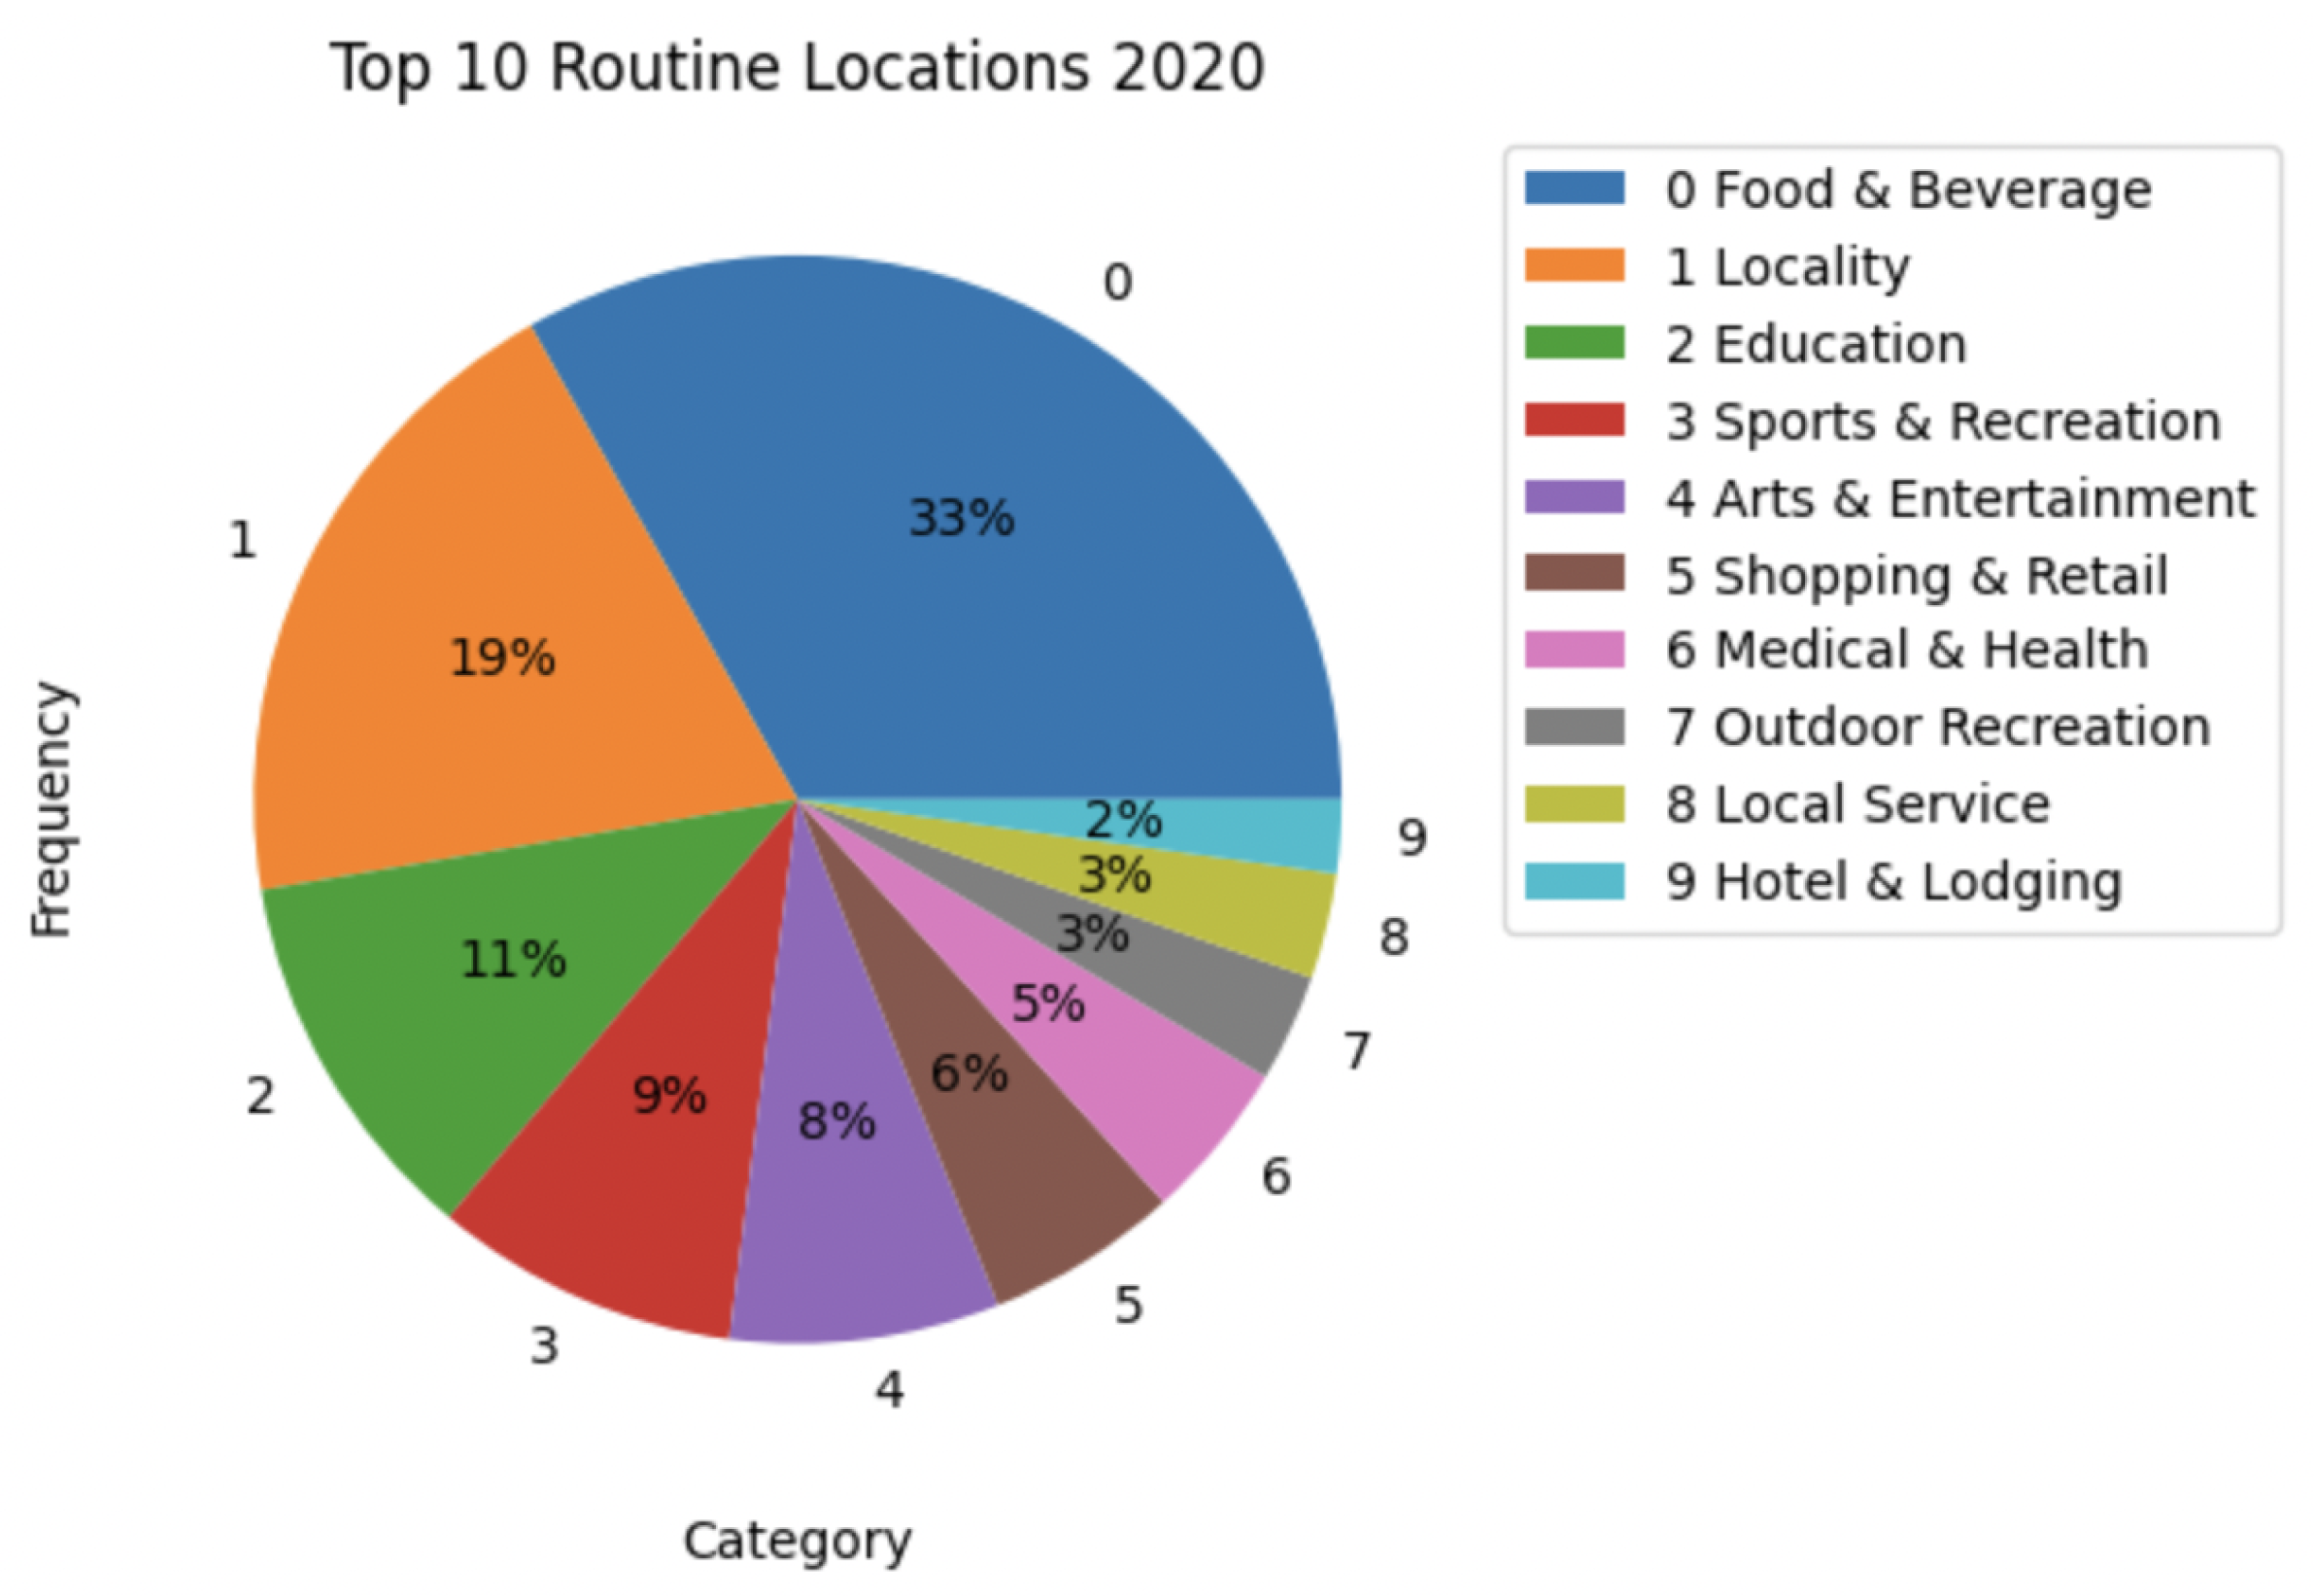
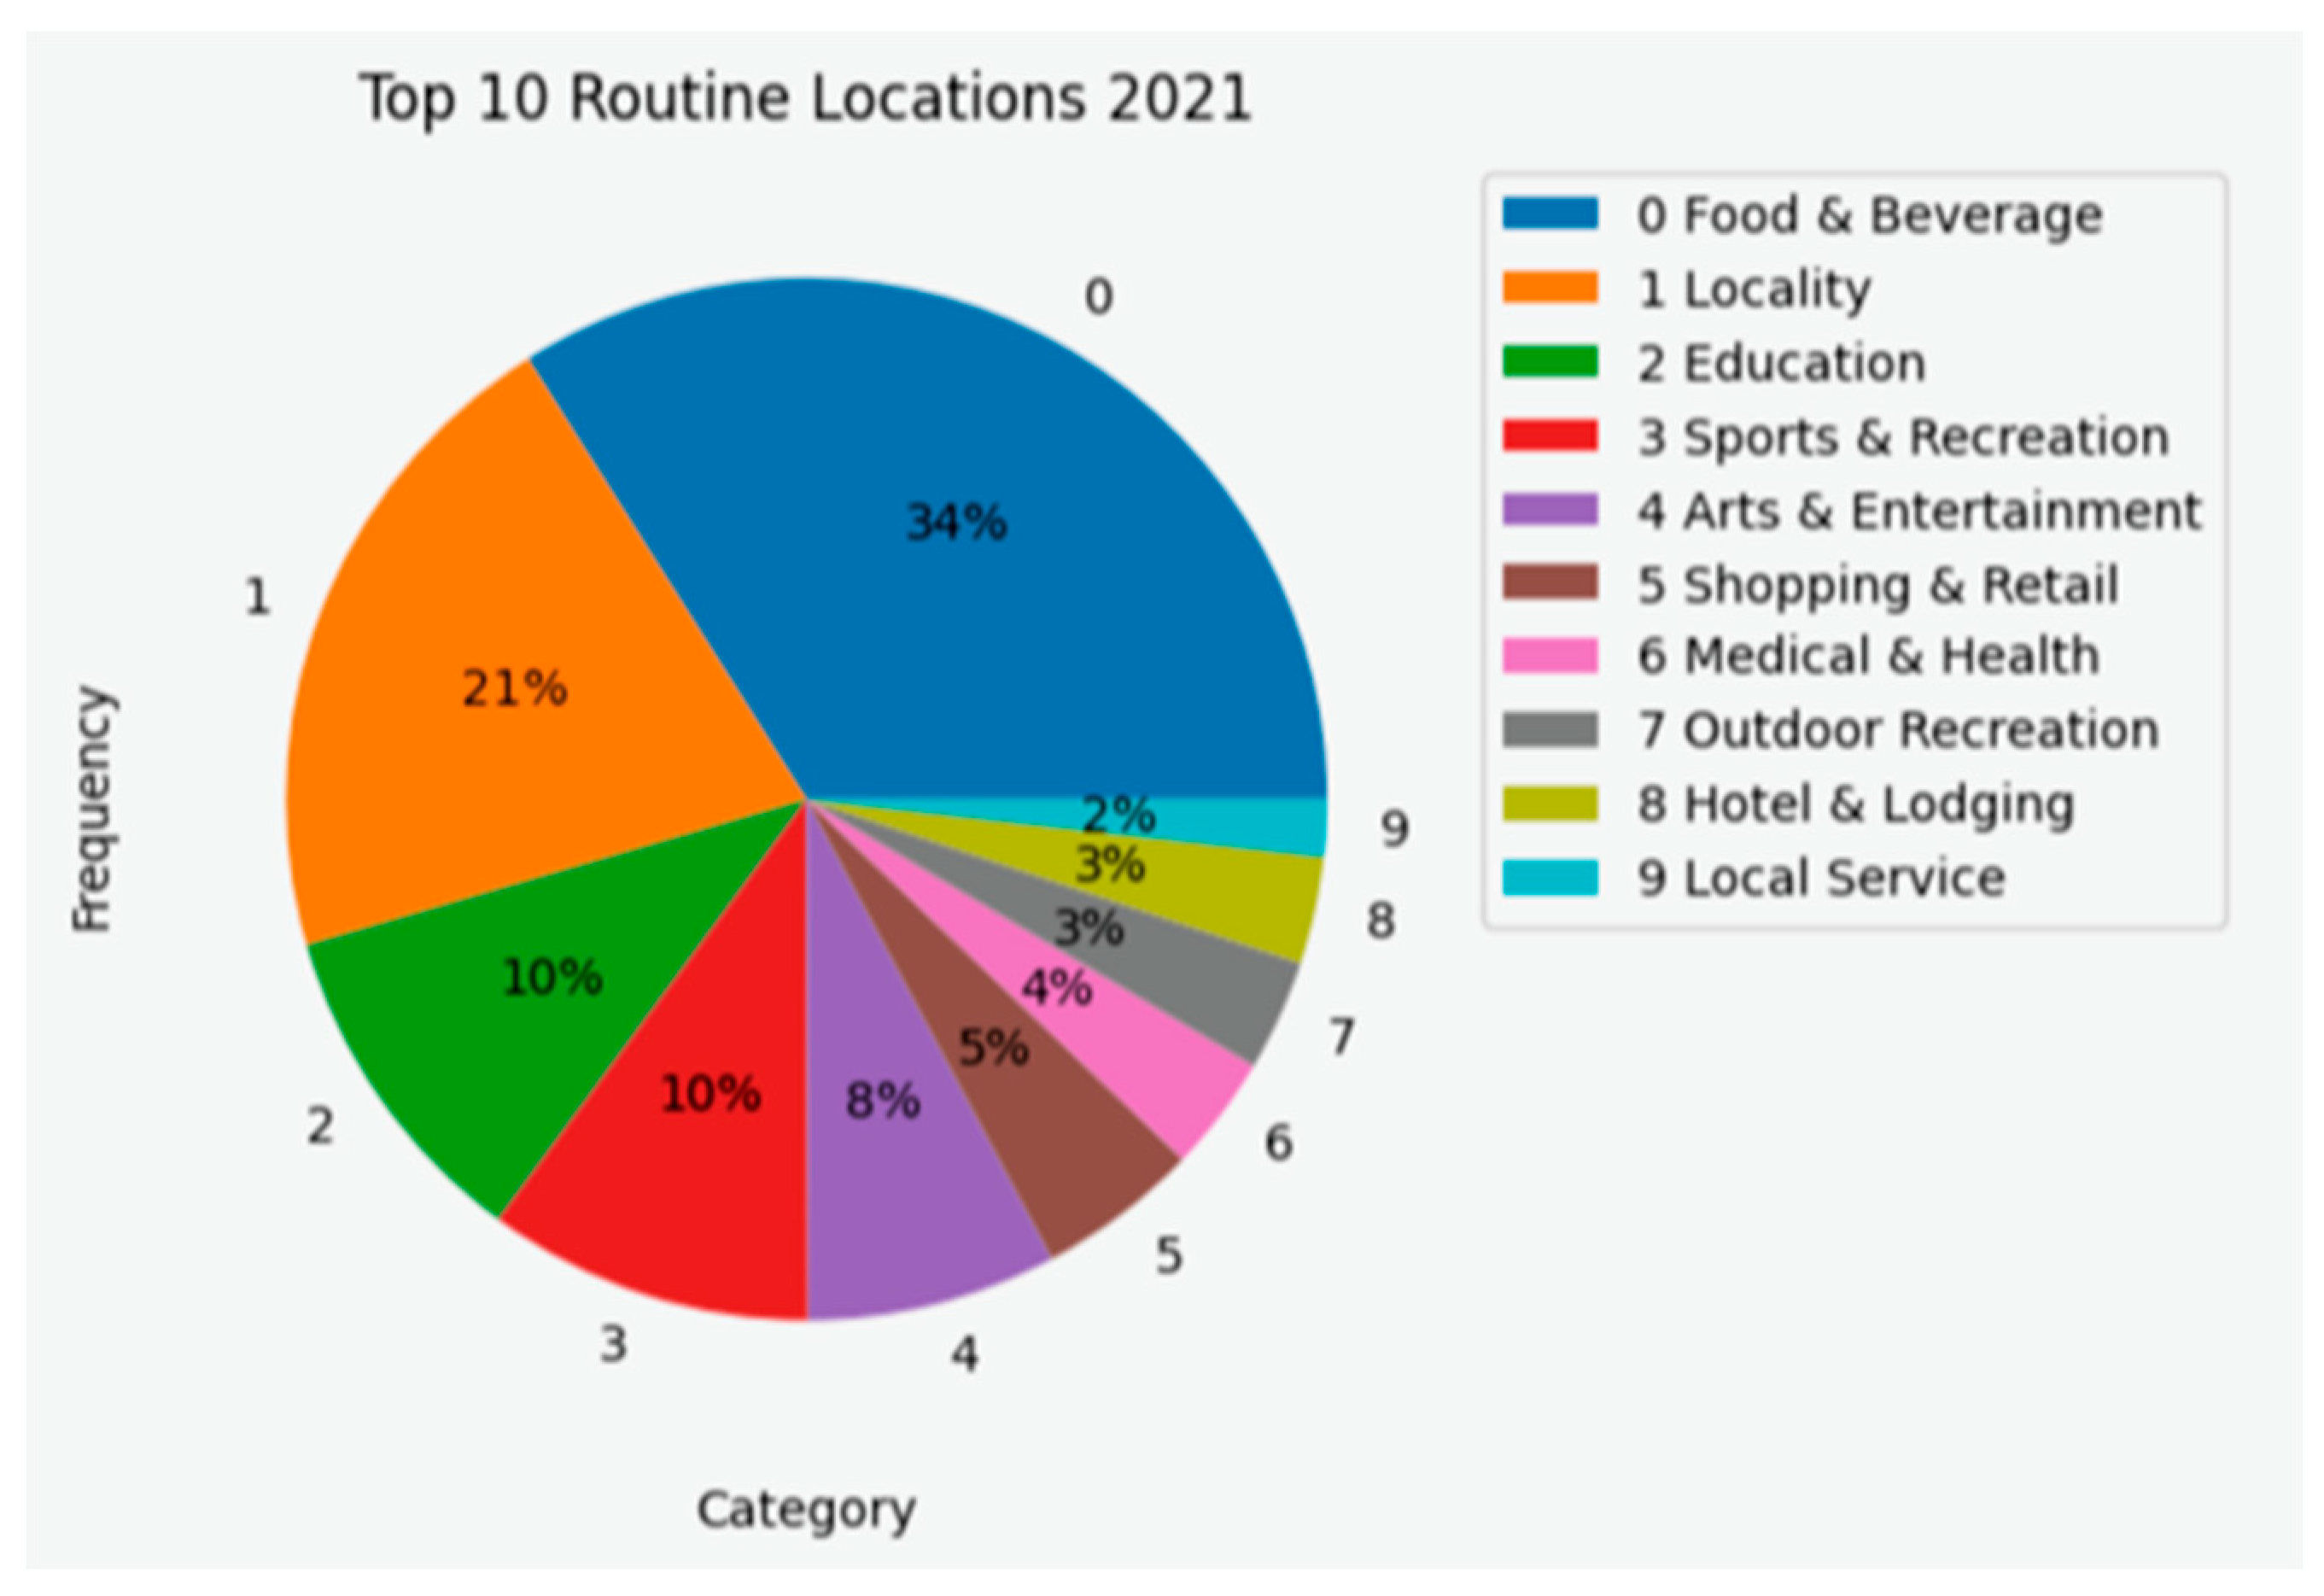
In 2020 the most visited category was related to Food and Beverage and the least visited was associated with Writing. In 2021 Food and Beverage was also the most visited category. Also, in 2021, activities associated with Media/News Company were the least popular in terms of visits. The analysis shows that the top 10 categories with more visits were similar in both years.
Figure 18 presents the 10 categories that were, most of the time, associated with the routine locations identified. As is observed, in
Figure 19, the preferences in routine locations were maintained.
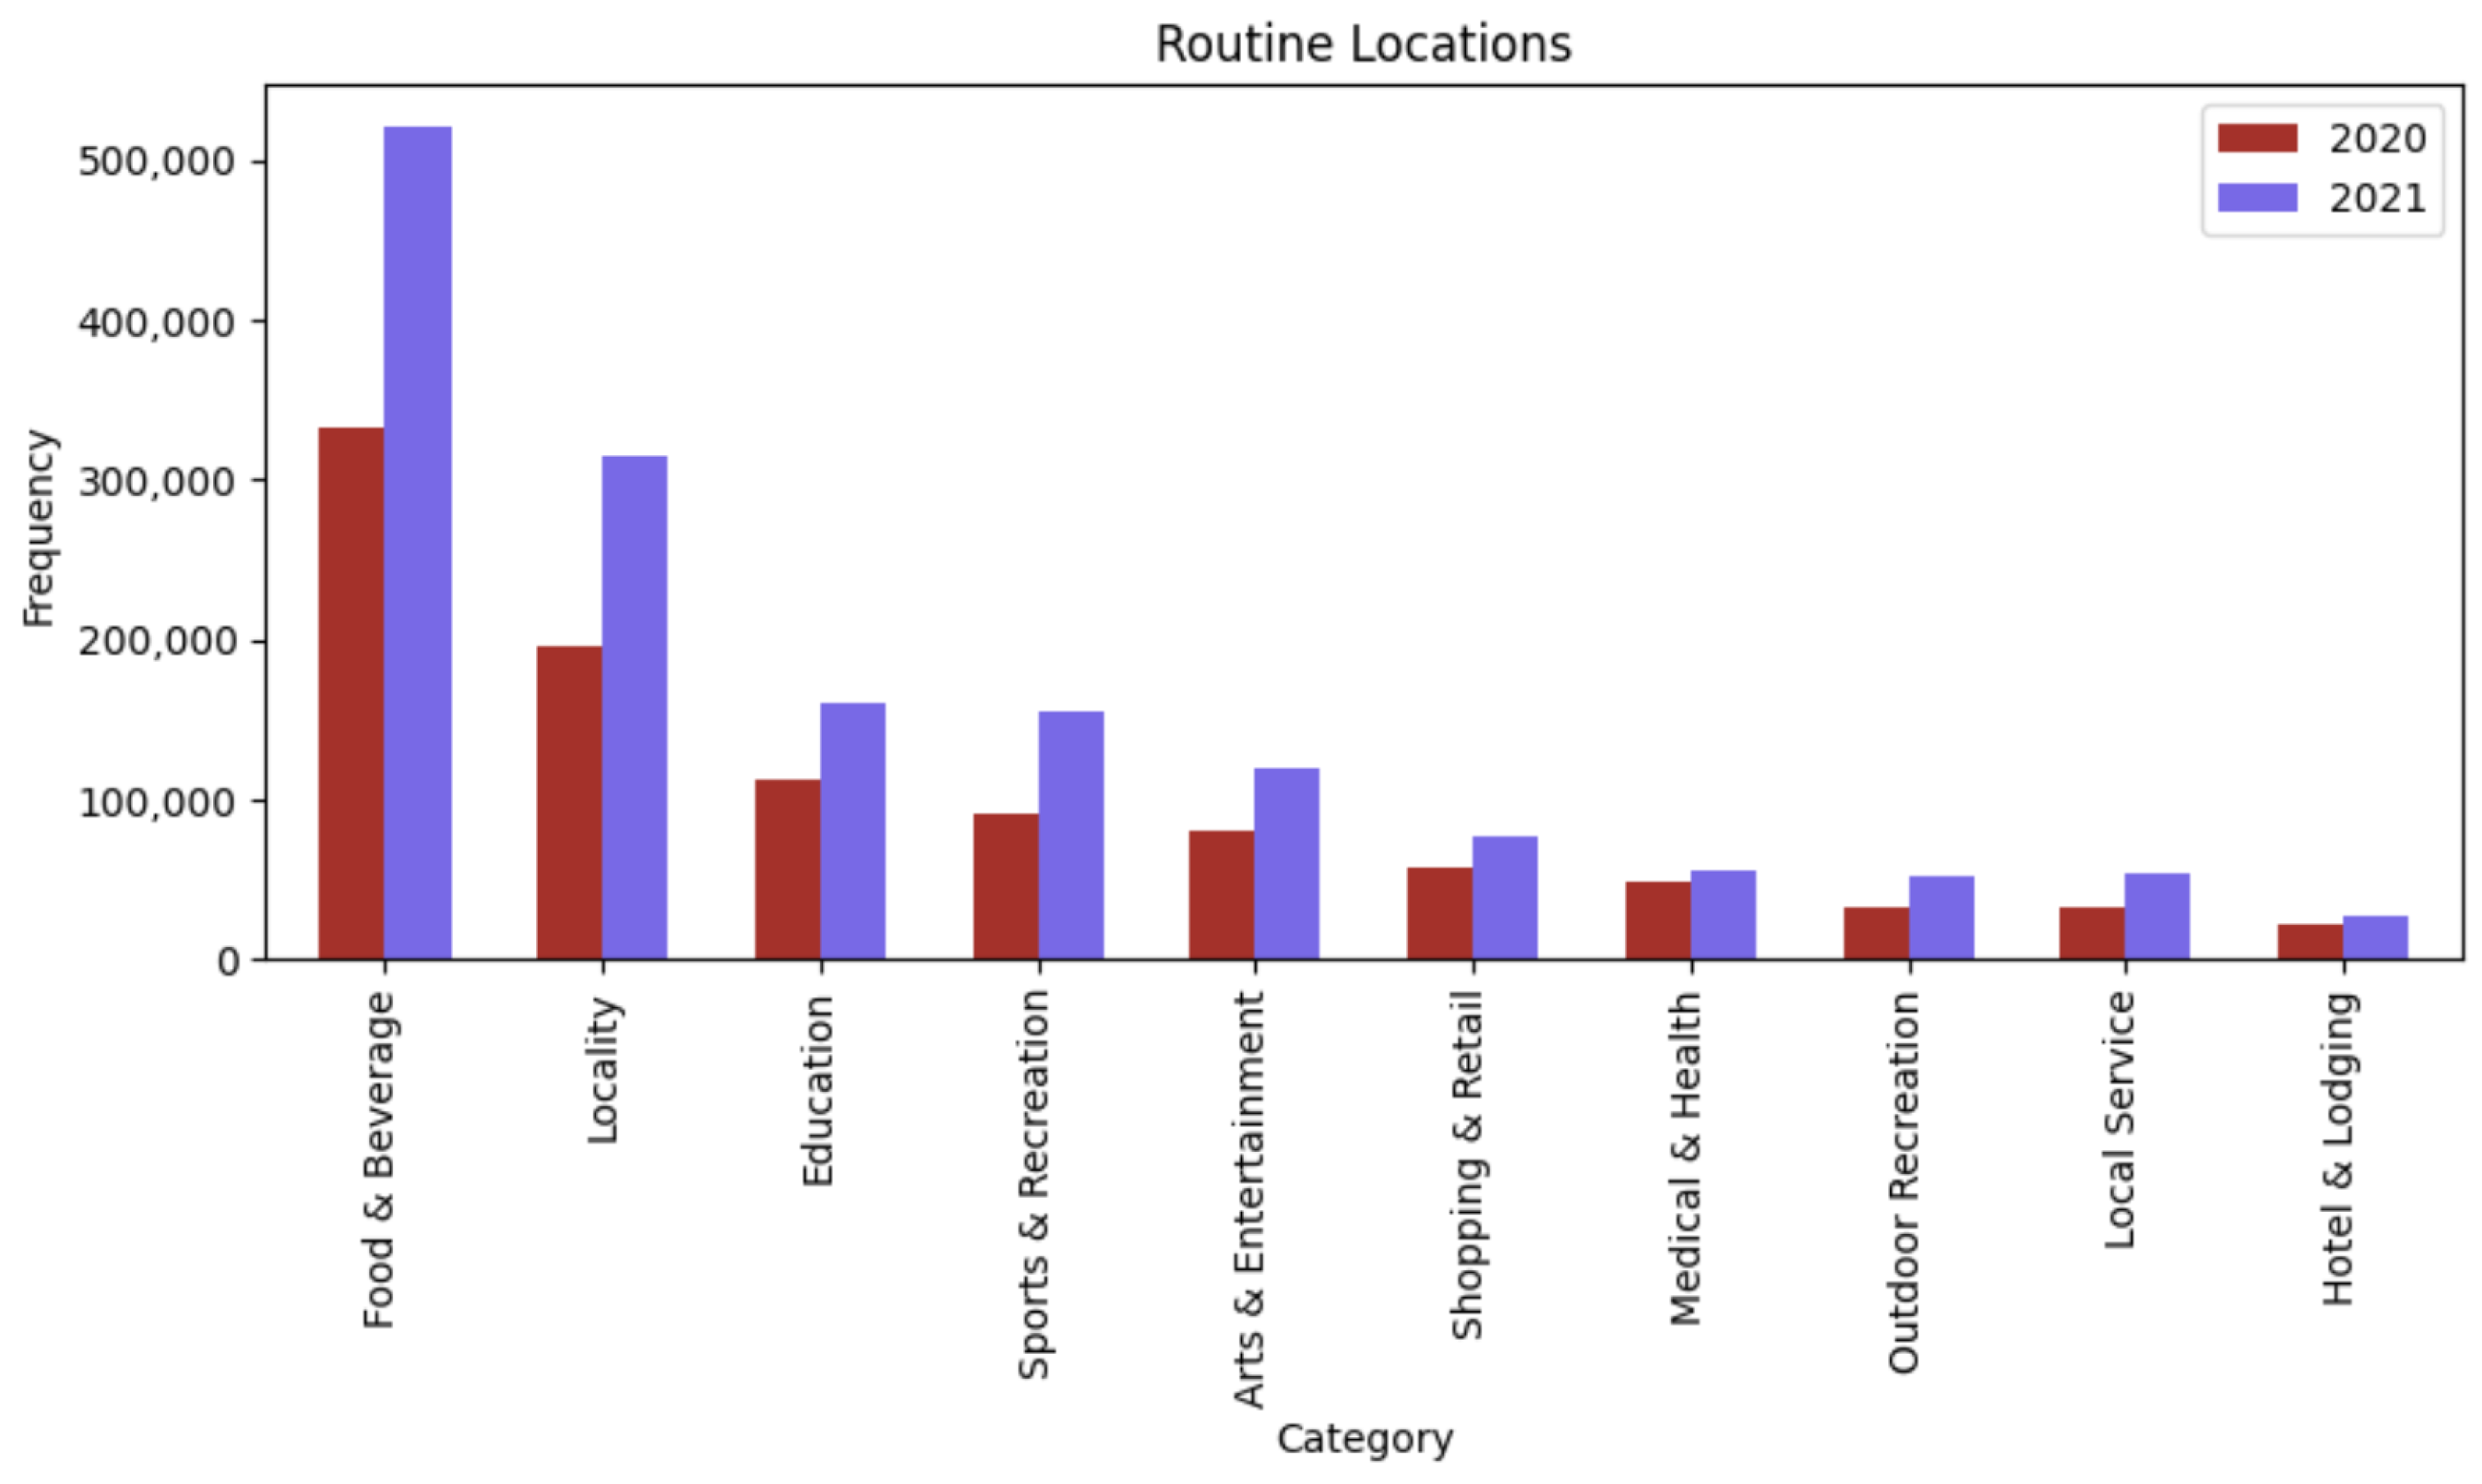
Figure 20 presents the top 10 routine locations identified from the 5000 individuals during September and October of 2020 and 2021. The main difference between the two periods is the number of routine locations visited which, as predicted, because of the increase in activity and movements verified previously, is much higher in 2021. It is also observable that most of the categories visited in 2020 were also visited in 2021 with a proportional augmentation. Most of the locations visited were related to Food and Beverage in both years. Nevertheless, there was a significant increase in visits in this category.
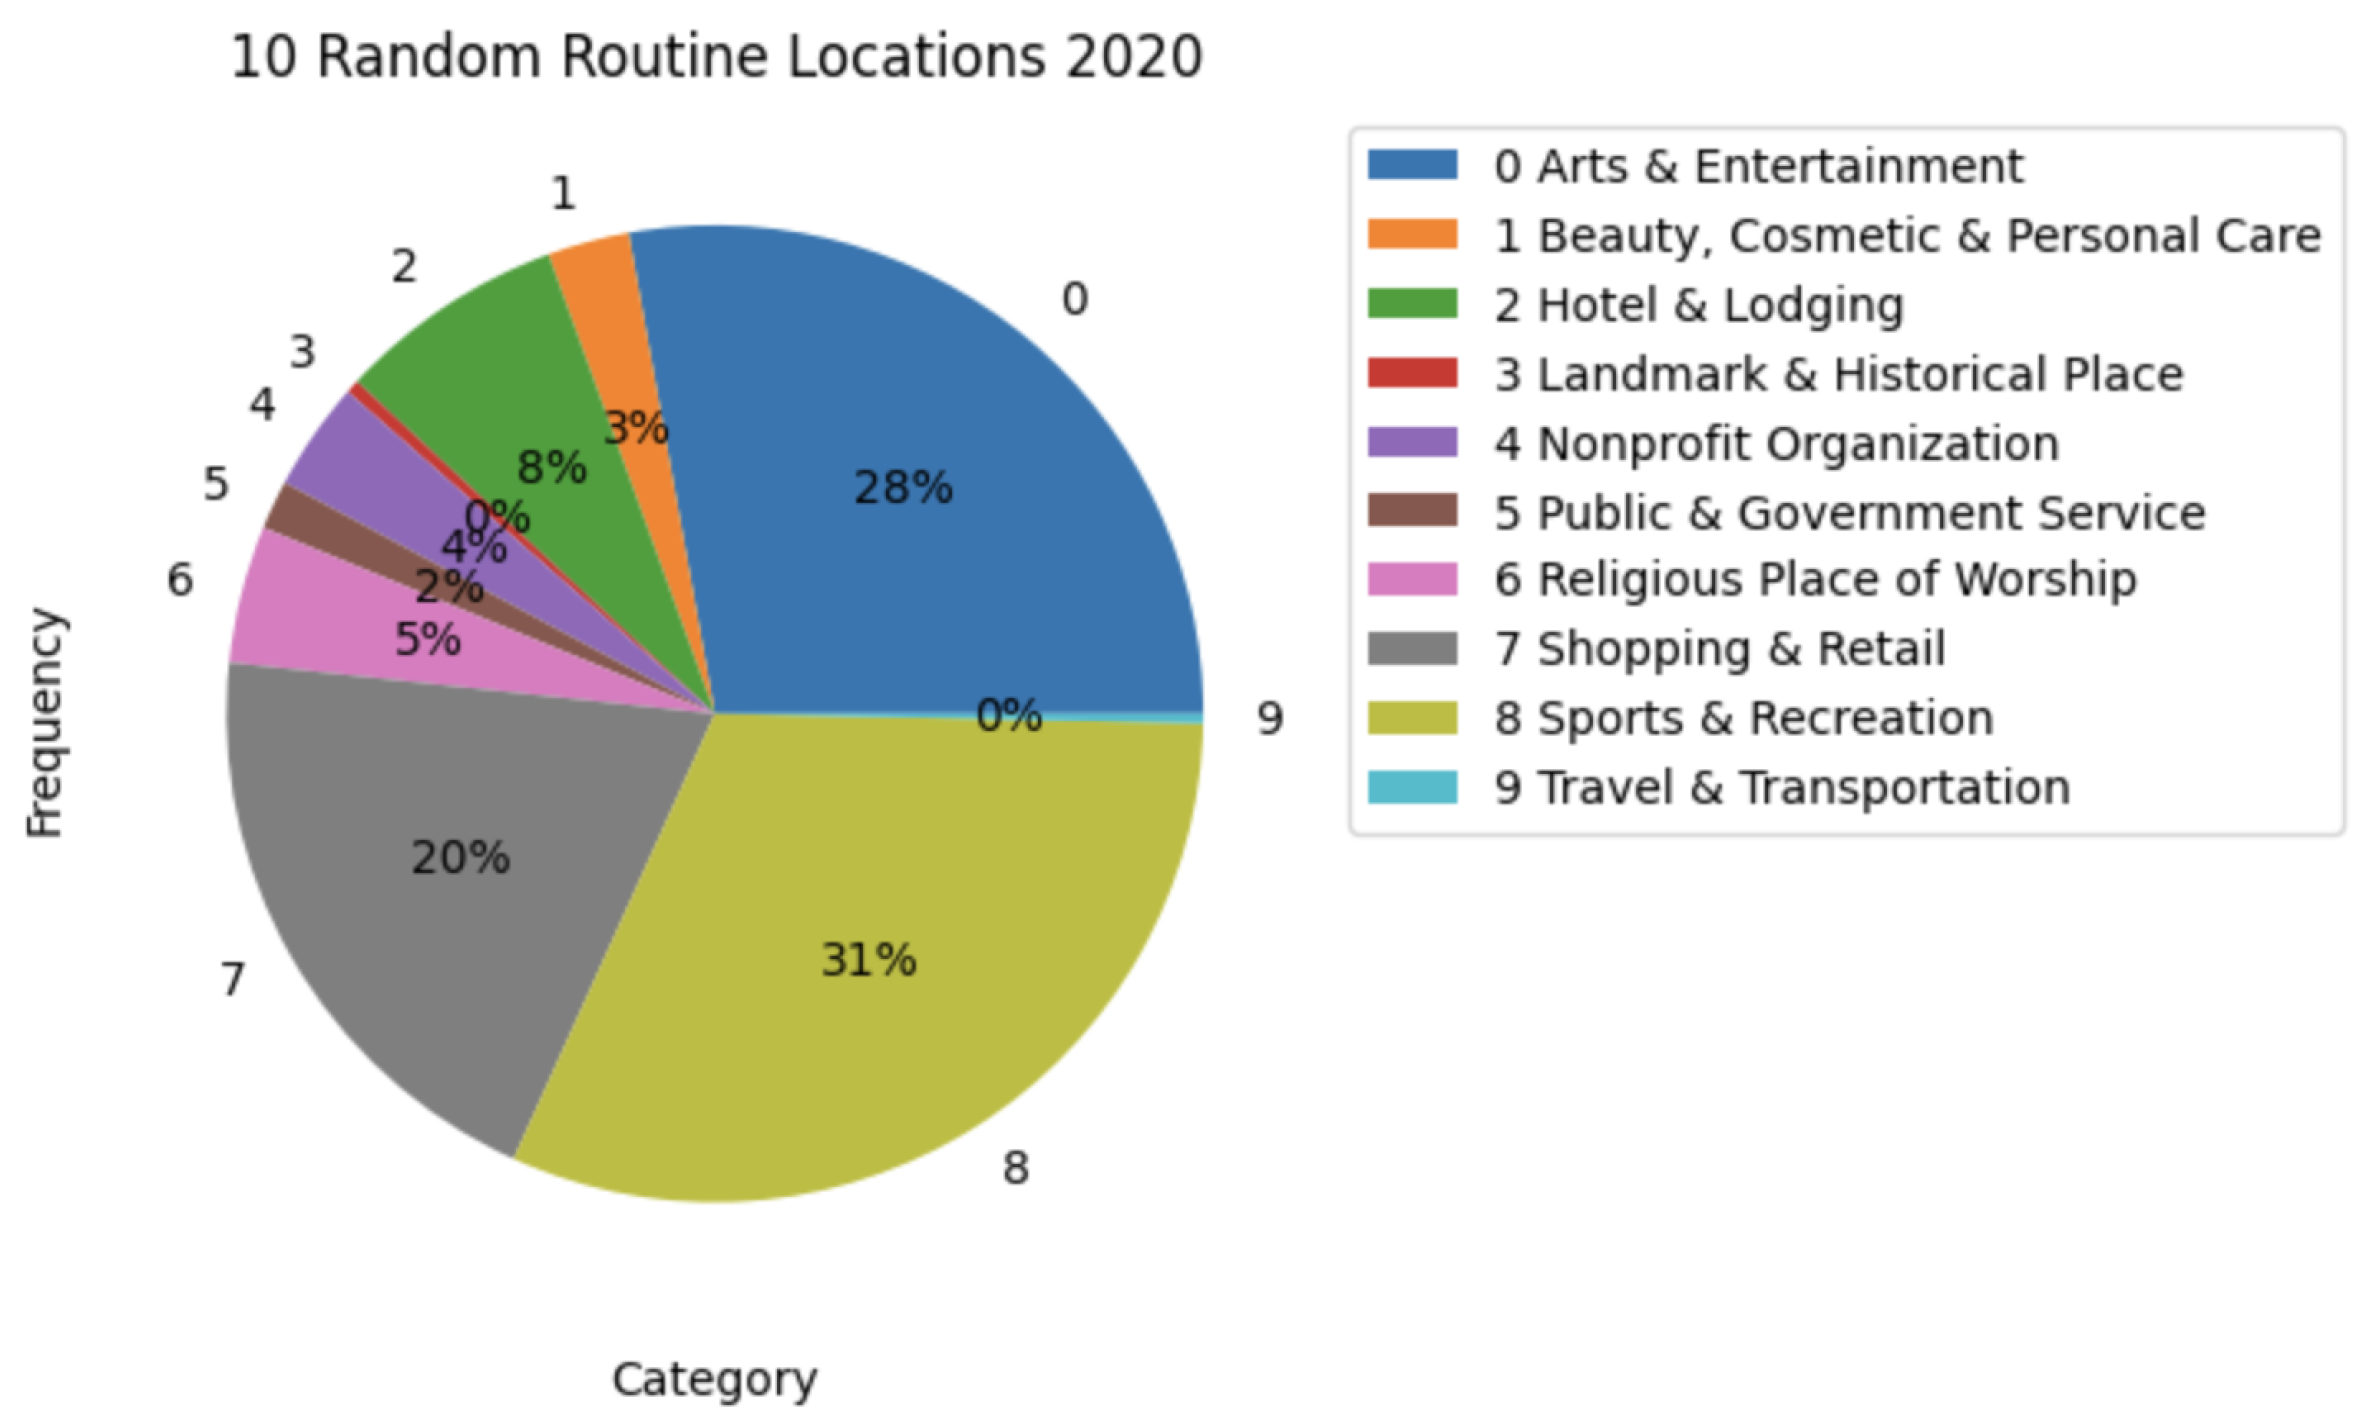
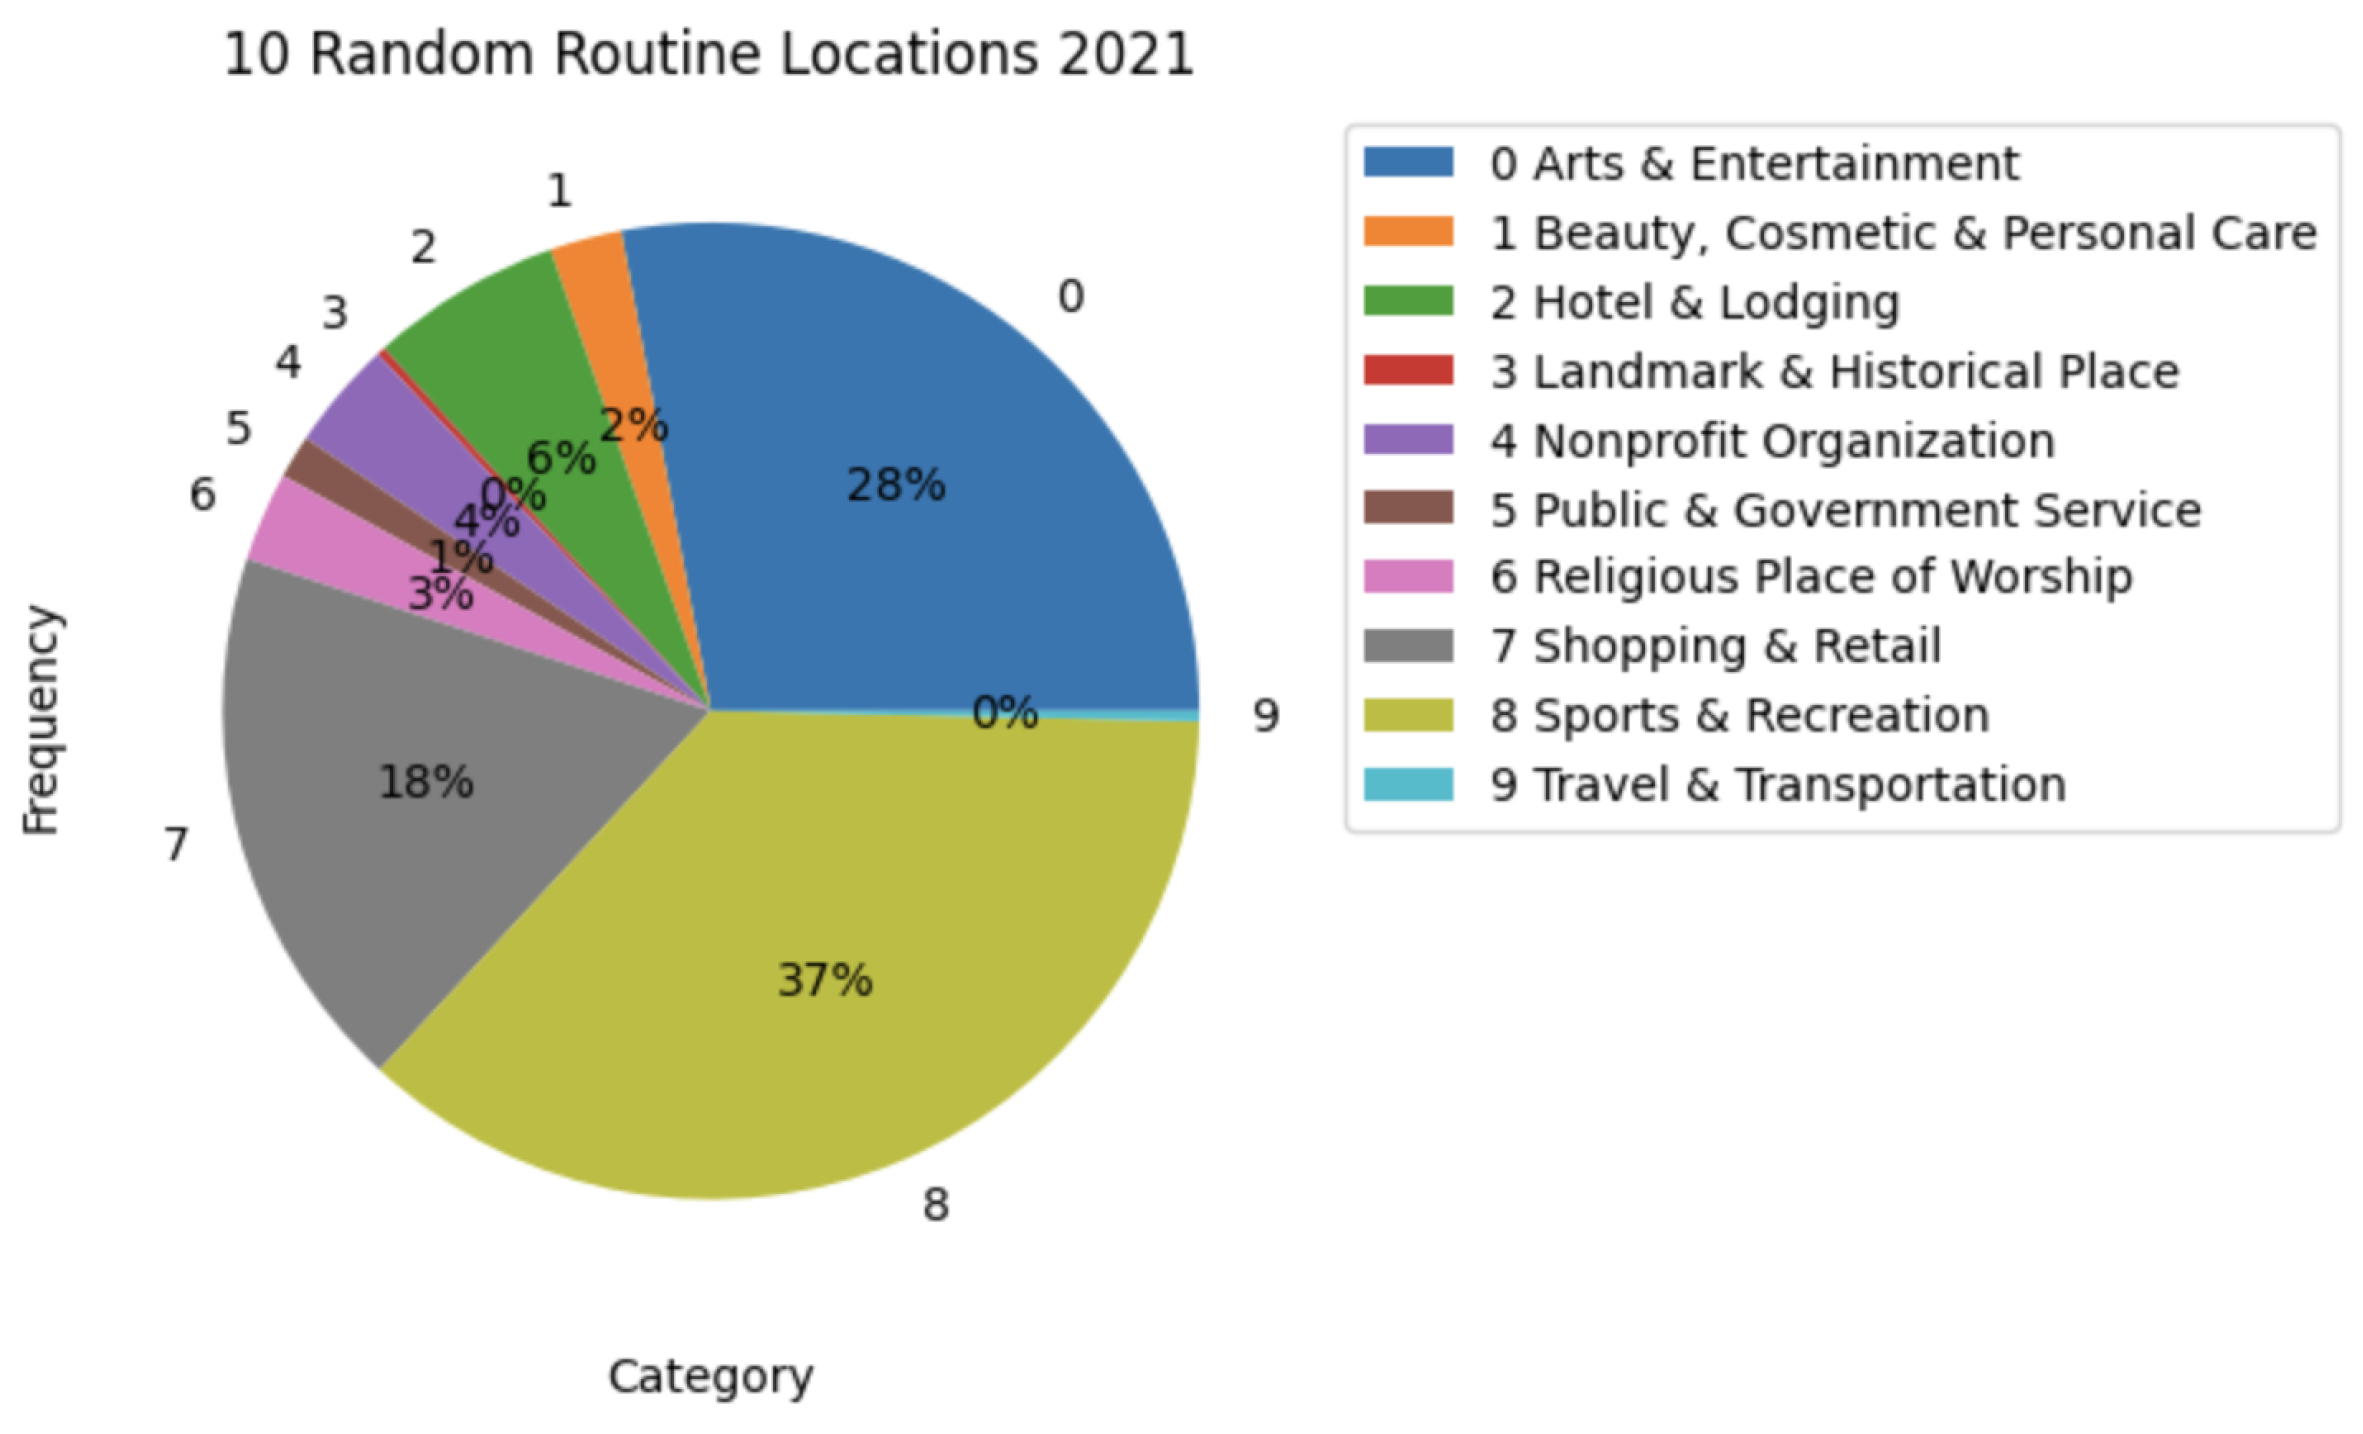
Due to the nature of this crowdsourced data, the results might be biased. The top 10 categories could be the ones that people tend to check-in more in Facebook Places. As an attempt to mitigate this, we selected 10 random categories and analyzed the difference in the number of visits in the two periods.
Figure 21 and
Figure 22 present small changes in the distribution of visits in the different categories. The difference in the numbers observed is very small to be considered relevant. Besides the augmentation of activity, there is no strong indicator that the population’s habits, when it comes to routine locations, have substantially changed due to the pandemic. Nevertheless, some variances were observed, for example, the Medical and Health category had less activity in 2021, and Government Building activity increased in 2021.
7. Conclusions
People’s mobility and lifestyle changed, and even after lifting some restrictions, mobility continued to reduce, which contributed to the blow in the Portuguese economy. This analysis shows the results of a study that aimed to analyze spatial patterns in the post-pandemic scenario through the analysis of mobile phone data and crowdsourced data. Since mobile phone data were often used to monitor and evaluate the pandemic status, this analysis intends to highlight the benefits of using CDRs and crowdsourced data to analyze the short and long-term effects of COVID-19 on mobility, daily habits, and even urban dynamics.
Results show that people preferred to stay isolated in the following months after the first wave of the pandemic. It also shows that people communicate less or that the main channel of connection changed over the two periods, most probably because in the first period, people stayed at home and used VOIP connections. Regarding mobility, it increased over the second year of the pandemic. More districts were visited, also increasing the travel between districts. The visits to the Portuguese islands, especially in Azores, have increased as well. It was observed that even with a larger number of infections in the second year, people communicated more, visited more locations, traveled longer distances, maintained the same habits, and visited the same locations of interest. According to the analysis, even with some measures applied in restaurants in 2020, the most visited locations this year were related to this category. Apart from some small changes, there is no strong indicator that the routine locations have changed due to the pandemic situation.
In conclusion, the use of CDRs and crowdsourced data can provide valuable insights into human mobility. While CDRs offer a detailed record of communication activities on a phone network, bringing knowledge of how people move and interact in their daily life, crowdsourced data can provide a broader picture of that interaction. By analyzing and combining these datasets, it is possible to gain a better understanding of movement behavior and the motivations behind the movements. However, there are also some limitations and challenges associated with using these data sources to infer mobility. For example, CDRs may not capture all aspects of human mobility, because they are only generated when people interact with the mobile network, and the accuracy of crowdsourced data varies depending on the level of participation and the quality of the data provided by the volunteers. Furthermore, the use of such data for mobility inference may raise privacy concerns.
The observed low number of CDRs-based communications in the first year of the pandemic may raise some concerns about the representativeness of the data. However, 2020 was an atypical year with events that affected everyone’s movements in a similar way, so this indicator may not substantially impact the validity of the insights taken from the CDRs. With a validation of using a type of data typically used for trajectory analysis, such as GPS, and other sources of crowdsourced data to complement the information from Facebook Places, some of these concerns could be mitigated.
Overall, the combination of CDRs and crowdsourced data offers a promising approach to studying human mobility and multiple urban dynamics. For future work, it would be essential to validate these results. Then, it would be interesting to analyze mobility and routine locations in a period without any restrictions related to the pandemic and compare it with the results obtained in this analysis. With validation and data from a period ahead without restrictions, this analysis could be an essential indicator to understand the long-term effects of COVID-19 on mobility and routine locations, as well as how the pandemic affected people’s communication. Also, the mobility and routine locations of people living in Coimbra could be compared with other districts.


