Article

To What Extent Can Satellite Cities and New Towns Serve as a Steering Instrument for Polycentric Urban Expansion during Massive Population Growth?—A Comparative Analysis of Tokyo and Shanghai

1
Institute of Building Climatology, Faculty of Architecture, TU Dresden, 01069 Dresden, Germany
2
School of Design, Kyushu University, Fukuoka 8158540, Japan
3
Leibniz Institute of Ecological Urban and Regional Development, 01217 Dresden, Germany
*
Author to whom correspondence should be addressed.
ISPRS Int. J. Geo-Inf. 2023, 12(6), 234; https://doi.org/10.3390/ijgi12060234
Submission received: 21 March 2023 / Revised: 23 May 2023 / Accepted: 1 June 2023 / Published: 6 June 2023

Abstract

:
In response to the call of the New Urban Agenda—Habitat III for a reinvigoration of long-term and integrated planning towards sustainable urban development, this paper presents an empirical comparative study of planning practices based on the “satellite city” and “new town” concepts in Tokyo and Shanghai to examine from a long-term perspective how well they have guided polycentric urban development at a time of massive population growth. We aim to deliver evidence-based contributions to boost the knowledge transfer between the Global North and the Global South. The paper adopts a multi-dimensional framework for the comparative analysis, including a review of long-term urban development policies and an inspection of the population distribution and extent of built-up areas using time-specific categorizations to map the spatiotemporal changes based on GHSL data. The comparative analysis shows that urban plans in Tokyo and Shanghai based on satellite cities and new towns as steering instruments for polycentric urban growth management have not lived up to the original aspirations. In fact, the intended steering of population distribution has essentially failed, despite the practical steps undertaken.

1. Introduction

In 1950, only 30% of the world’s population lived in urban areas. The ratio rose to 55% in 2018 and is projected to reach 68% by 2050. In other words, the global urban population is projected to grow by an additional 2.5 billion from 2018 to 2050, with nearly 90% of the increase concentrated in Asia and Africa. Over the coming decades, this process of urbanization will be particularly strong in Asia, which is expected to have 3.5 billion urban dwellers by 2050, the largest number among all continents [1]. To meet the challenges of rapid and massive urban population growth, the New Urban Agenda—Habitat III calls for a reinvigoration of “long-term and integrated urban and territorial planning and design in order to optimize the spatial dimension of the urban form and deliver the positive outcomes of urbanization” [2]. The fact that Habitat III uses terms such as “readdress”, “strengthening” and “reinvigorating” confirms a certain value in previous planning and design efforts while placing high expectations on their future development in order to achieve the UN’s Sustainable Development Goals.
One key difference between the urbanization process currently taking place in developing and emerging countries and the process in developed countries a few decades back is the magnitude of today’s population growth. For this reason, it is important to examine the extent to which different scales of population growth have affected urban expansion, in particular the aims of planning measures and their actual impact after implementation. In recent years, a group of scholars have proposed a “southern planning theory” based on the core argument that globally dominant planning theories and practices have mostly emerged from economically advanced regions of the world (i.e., the Global North) and were then unquestioningly applied to significantly different regions and areas [3,4,5,6,7,8]. Yet the application of planning concepts to diverse socio-spatial contexts is unlikely to lead to similar results. For instance, an evidence-based comparative study on the efficacy of the greenbelt concept in preventing urban sprawl showed that while the impact in Frankfurt am Main (Germany) was largely comparable to its place of origin, namely London (UK), the repercussions in Seoul (South Korea) were markedly different. A key factor here is that the trends and rates of population growth in Frankfurt am Main and London are comparable, while both differ greatly from the situation in Seoul [9].
During the establishment of what we now consider the modern discipline of urban planning, which parallels the emergence of modern functionalist urbanism, the focus was on developing technical tools to control and steer urban growth [10]. The “satellite city” and “new town” (Given the flexible (changing) usage of “satellite city” and “new town” in different socio-cultural settings, and because the focus of this paper is not specifically on planning theory, we do not attempt to distinguish between these two concepts) are two of the most common terms used by planners around the world when discussing urban growth management. The garden city movement, which arose in the United Kingdom at the beginning of the 20th century, is generally recognized as the originator of the concept of the satellite city and new town. The practice of constructing satellite cities and new towns in the countries of Western Europe took off during the period of reconstruction following the devastation of World War II; this lasted until the late 1970s/early 1980s. Some well-known programmes of this period are the London New Towns Act of 1946 and the Copenhagen Finger Plan of 1947/48. Around the same period, the United States saw a boom in the construction of new towns, driven by ambitious and wealthy real-estate developers such as Robert E. Simon Jr. as well as the Great Society domestic programmes set up by President Lyndon B. Johnson, reaching its peak in the 1960s [11]. In the years after the oil crisis of 1973, fewer satellite cities and new towns were constructed in developed countries of the West. One landmark event was the official announcement by the British government in September 1976 that it was abandoning any further extension of the New Towns programme. Following the Inner Urban Areas Act of 1978, the focus of planning in the United Kingdom shifted towards the needs and potential of designated inner-city areas. Today, however, the construction of satellite cities and new towns continues in countries facing massive population growth. For instance, satellite cities and new towns with emblematic names such as Techno City, Eco City and Hope City represent a new wave of property investment and an optimistic belief in economic growth driven by a rising middle class in emerging economies, particularly in Africa and Asia [12].
The basic planning concept for satellite cities and new towns as well as those with emblematic names is to move residents away from urban centres by establishing housing, industrial bases and shopping facilities as well as social and technical infrastructure and services at an alternative location. The intention is to prevent spontaneous urban sprawl and steer population growth to new centres, thereby forming a polycentric urban structure. Best practices from the Global North, for instance in London and Copenhagen, show that these planning interventions can indeed be effective up to a point. However, it should be noted that these cities saw only modest demographic change (population growth) after the implementation of the plans. For example, after decades of population loss, it was only in the year 2011 that the Greater London area returned to the population it had at the beginning of the 1950s, namely 8 million (according to official statistics). When the Copenhagen Finger Plan was created in 1947/48, it was projected that the Danish capital would gain more than 10,000 new residents annually for the next 20 years [13]. In fact, the population today is still lower by hundreds of thousands than in the 1950s, despite slight growth from the early 1990s. Yet what would the situation have been in such cities if the population had significantly increased following the implementation of the urban plans for satellite cities and new towns? This is a crucial research question for which more evidence-based studies are needed to make knowledge transfer and lesson learning between the Global South and the Global North more reliable.
Against the above-mentioned background, this paper presents an empirical comparative study of planning practices based on the satellite city and new town concept and their impact on the urban structural development of Tokyo and Shanghai. Both of these cities previously adopted the concept of satellite cities/new towns and have long been committed to the use of urban plans to guide the development of polycentric structures. Moreover, both have experienced massive urban population growth. Their development trajectories show the diverse repercussions that occur when concepts of urban growth management devised in Europe and North America are transferred to other parts of the globe. The objective of this paper is to provide evidence-based experience for international lesson learning with regard to urban expansion management based on an investigation of two cities that have undergone massive population growth.
The remainder of the paper is organized as follows: Section 2 introduces the methodological framework of the research, including an explanation of why the two case study cities were chosen, how the comparative analysis was conducted, and what data were used for quantitative analysis and verification. Section 3 gives a brief review of the planning policies adopted in Tokyo and Shanghai. In Section 4, based on the Global Human Settlement Layer (GHSL) dataset, the actual polycentric development of Tokyo and Shanghai is visualized to enable comparative analysis, in particular to determine the success of the respective urban plans. In Section 5, we draw conclusions and explore lessons that can be learned from the experiences of Tokyo and Shanghai to help urban planners design more sustainable cities during periods of massive urban population growth.

2. Materials and Methods

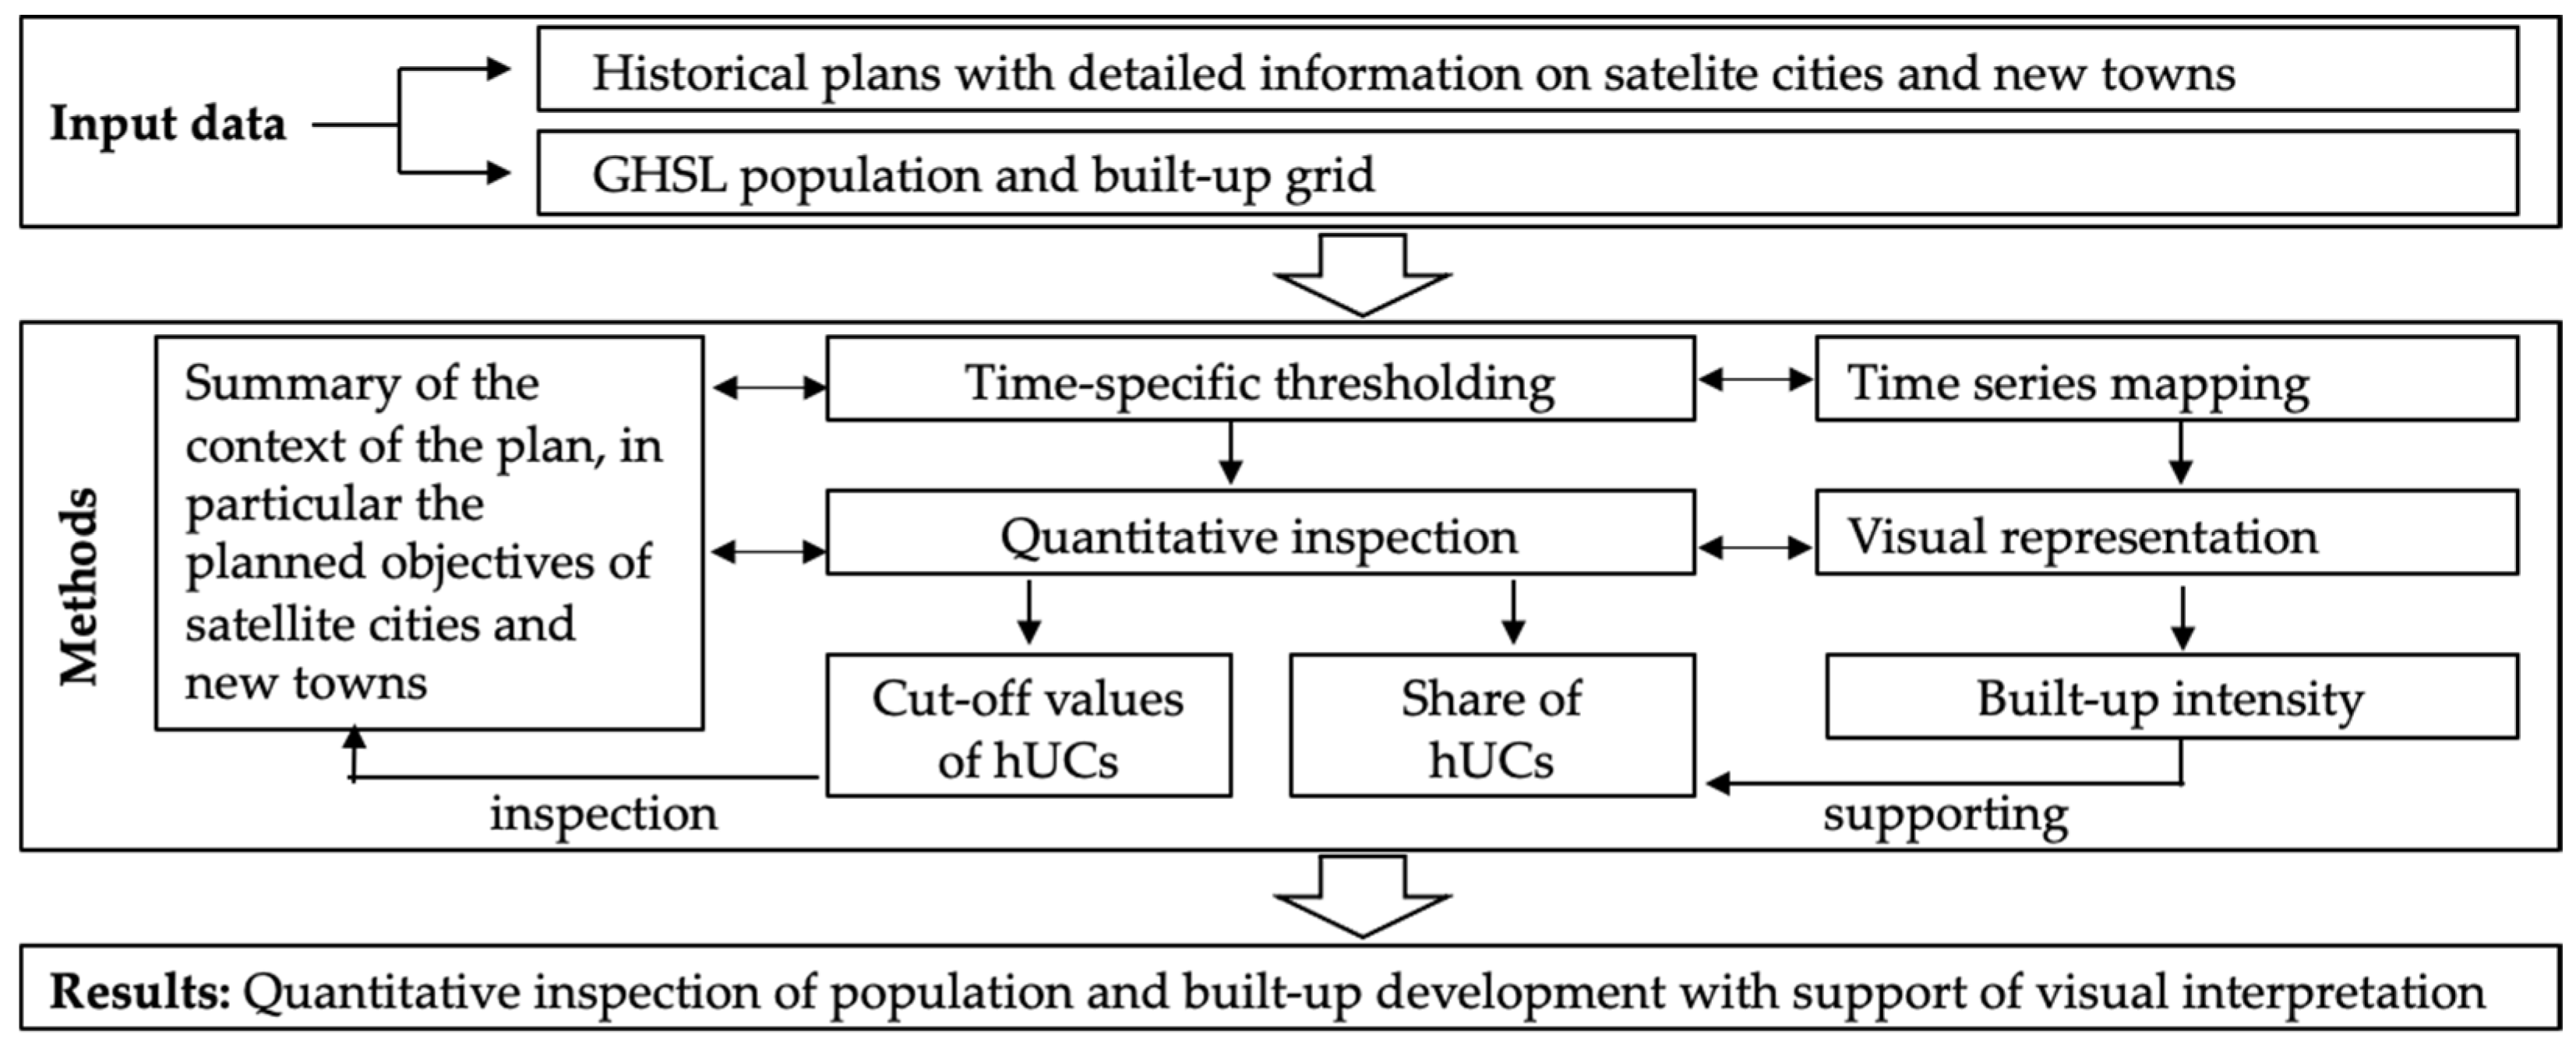
2.1. Methodological Framework

The general aim of this paper is to consider the particular challenges that developing/emerging countries face when they wish to learn from the experiences of economically advanced countries. The methodological design derives from the hypothesis that any application of the satellite city and new town concept, which originated in the European and North American regional context, will have a very different impact in other regions where population growth is much more intensive. In this regard, a number of previous studies have investigated the case of Tokyo, which presents a different urban settlement pattern than other cities of economically advanced countries [14,15,16]. To verify whether Tokyo’s situation is unique or can be said to represent a pattern, this paper selects Shanghai as a case study city to compare with the Japanese capital. Both cities launched new urban plans in 1958. Specifically, Shanghai began implementing the satellite city concept while Tokyo launched its National Capital Region Development Plan aimed at managing urban expansion. However, the socio-economic background for planning in Shanghai is quite different from that of Tokyo. As mentioned above in the discussion of London and Copenhagen, while the current settlement structures of Shanghai and Tokyo have certain similarities from a morphological point of view, they differ greatly in the desired structure of satellite cities.
This paper adopts a multi-dimensional framework for the comparative analysis of Tokyo and Shanghai: First, the urban expansion management plans of the two cities are reviewed from a long-term perspective. Based on this policy review, a comparative analysis is conducted to identify which adjustments were made in urban planning and under which particular circumstances. Second, we conduct a quantitative inspection of changes in population and built-up areas over time. This inspection is supported by a visual interpretation of the population distribution and extent of built-up areas using time-specific categorizations to map the spatial–temporal changes. Given that the planning purpose of satellite cities/new towns is to guide population growth into a polycentric urban structure by decentralizing urban development and dispersing population and economic activities across multiple centres to alleviate pressures on the central city, we take the paradigm of polycentricity as the basis for assessment.

2.2. Materials

The urban land use patterns of the Global Human Settlement Layer (GHSL R2018A) from 1975 to 2014/2015 served as base data for the empirical investigation of spatiotemporal changes. This provided a multi-temporal information layer on built-up presence derived from Landsat image collections (GLS1975, GLS1990, GLS2000 and GLS2014) [17]. Land usage in the Global Human Settlement Layer (GHSL R2022A) was updated in July 2022. The new data on built-up areas depict the distribution of built-up surfaces, expressed in square metres. We calculated the built-up area intensity based on GHSL R2022A [18]. GHSL 2022A also gives the population distribution and density, expressed as the number of people per cell. Estimates of the residential population for the target years 1975, 1990, 2005 and 2020 were disaggregated from the census or administrative units to the grid cells to supplement the data on the distribution and density of built-up areas, as mapped in the Global Human Settlement Layer (GHSL) per corresponding period [19].
To address the challenge of capturing polycentricity over a long-term period, we established a definition that considers an urban region as polycentric when it encompasses multiple areas exhibiting spatial densification from a morphological perspective. This definition is based on the methodology devised by Xie et al. [20], which aligns with the concepts introduced by Greene [21], Riguelle et al. [22] and Taubenböck et al. [23]. This approach aims to contribute to the transfer of knowledge in urban–regional development research between the Global North and Global South. Previous studies on polycentricity have largely focused on the intensity of economic activity, particularly employment, with a particular emphasis on cases in North America and Europe [24,25,26,27,28,29,30,31,32,33]. However, it is difficult to apply the same approach to cities and regions in the Global South due to the unreliability of employment data (informal employment is prevalent in these areas). Furthermore, the usefulness of long-term surveys is undermined by the need to reflect the diversity of administrative divisions, potentially rendering statistical data incomprehensible in terms of georeferencing. To meet the need for consistent and comparable data on urban development over an extended period, we focus on two fundamental indicators for our case study cities of Tokyo and Shanghai: urban population and built-up areas.

2.3. Analysis by Quantitative Inspection and Visual Interpretation

To investigate the extent to which planning interventions successfully steered the (re)distribution of the urban population, we undertook a quantitative assessment based on the fundamental logic of Greene’s method [21], using a basic set of reference thresholds (cut-offs) that reflect the temporality of different phases of urban development. We considered locations of high population density as proxies to demarcate urban centres. In particular, we adopted (sub-)centres as areas of high urban concentration (in short: hUC) based on the availability, consistency and comparability of data. We assumed that a (sub-)centre shows hUC, and the greater the number of such areas, the higher the degree of polycentricity. The population densities were calculated using a grid of cell size 1 km2. We defined four degrees of high urban concentration in the following way: The first degree of high urban concentration (abbr. 1 < hUC ≤ 2) has a threshold of more than 1 times and less than 2 times the mean population density. Similarly, the other degrees are 2 < hUC ≤ 4, 4 < hUC ≤ 8 and hUC > 8.
h U C y e a r = i 1 P D i y e a r P D m e a n y e a r
i = number of grid cells
PDiyear = population density in grid cell i in the respective period (year)
PDmeanyear = mean population density in the respective period (year)
P r o p o r t i o n   o f   h U C x   y e a r = A r e a   o f   h U C x T o t a l   A r e a × 100 %
Our analysis begins by inspecting the cut-off references and the proportion of hUCs, supported by a supplementary visual interpretation. Based on data from the 2018 GHSL database (GHSL 2018A), we first visualized the spatial expansion of built-up areas over time (1975–1990–2000–2014) using time series mapping in a geographic information system (GIS). Then, using GHSL 2022A, a kernel density estimation (KDE) analysis method was employed to inspect the spatial distribution of built-up intensity in the respective time nodes, i.e., the years 1975, 1990, 2005 and 2020. A temporal comparison of hUC development trends in relation to population provides an overview of long-term development. (cf. Figure 1)

3. Comparison of Satellite City Planning Policies in Tokyo and Shanghai

Tokyo and Shanghai were the first Asian metropolises to introduce spatial plans based around the concept of the satellite city or new town. Both cities pursued these state-of-the-art urban planning concepts in the 1920s and 1930s to guide urban expansion through planning interventions. Further, both introduced green belts to limit urban sprawl, although these had to be abandoned due to the high pressure of population growth. The two cases can be contrasted with the development of Seoul, another Asian metropolis which underwent similar massive population growth.
Following the Great Kanto Earthquake of 1923, the Japanese capital urgently needed to construct new housing. For this reason, the city authorities decided to develop areas alongside the railway network. The new unregulated and widespread suburban areas were largely created through the capital investments of private railway companies. “Greater Tokyo” was born in 1932 when five adjacent counties merged with 82 towns and villages to create Tokyo City, covering an area six times the size of the former settlement. To restrict further expansion, the Tokyo Regional Committee for Urban Planning came up with a greenbelt plan in 1938, which, however, was put on hold during the war years. After World War II, the country’s metropolitan areas (primarily Tokyo) saw a massive influx of people and industries as the economy began to recover, especially from the 1950s onwards. Due to long delays in the implementation of managed development through the capital’s urban recovery project, many new urban areas sprouted up in a disorderly fashion, leading to a worsening of living conditions, serious traffic congestion and shortages in public facilities and housing. To address the problems caused by out-of-control urban expansion, the Capital Region Improvement Act of 1956 was quickly followed by the first National Capital Region Basic Plan of 1958. This latter plan was modelled on the Greater London Plan of 1944 [34,35,36,37,38,39,40,41,42,43,44].
Similarly, plans were already drawn up in the late 1920s by China’s Nationalist government to steer the urban expansion of Shanghai. From 1946 to 1949, the local government first drew up a decentralization strategy as part of the Greater Shanghai Plans (which were never actually implemented). In 1946, the city had a population of about four million, occupying an administrative area of 893 square kilometres. It was predicted that the number of inhabitants would increase to about 15 million by the year 1996. The Greater Shanghai Plans specified an appropriate density as 1000 inhabitants per square kilometre. Based around this figure, the Plans introduced various spatial planning concepts such as the “garden city”, “organic decentralization theory” and “neighbourhood units”, whereby additional residents should be accommodated in satellite cities and new towns in the suburban area. In general, the planned suburban satellite cities and new towns, on the one hand, and the core city area, on the other, should each accommodate about half of the population. The goal was for each satellite city to grow to 0.5 to 1 million inhabitants, while the new towns were expected to have 160,000 to 180,000 inhabitants each. The satellite cities and new towns were designed as self-contained units, providing all the basic functions for urban life such as homes, workplaces, shops, schools and leisure facilities. Based on a strategy of industrial decentralization, industrial sites were planned in all satellite cities and new towns, separated by 500 m of greenbelt from residential and other functional areas. It was proposed to limit the built-up urban area of satellite cities and new towns to enable residents to reach all amenities on foot in under 30 min. Although the Greater Shanghai Plans were never actually implemented, they are considered to have had a significant and far-reaching impact on the city’s subsequent urban planning and development [45,46,47,48,49,50,51].
Following is a summary of the most important planning and main targets of satellite cities and new cities in Tokyo (cf. Table 1) and Shanghai (cf. Table 2).

4. The Results of the Tokyo–Shanghai Comparison

Comparing Figure 2 and Figure 3 for the different periods of built-up growth, we note a significant time lag between the periods of high population growth in Tokyo and Shanghai. The Japanese capital had already achieved high growth by the 1964 Tokyo Olympics, whereas the expansion of Shanghai only really started after the implementation in 1978 of the Chinese authorities’ wide-ranging reforms and Open Door Policy. In Figure 3 we can see that between 1975 and 1990, settlement expansion in Shanghai was concentrated in the area west of the Huangpu River, later paralleled by developments east and west of the Huangpu River between 1990 and 2000. This latter trend reflects the planning interventions aimed at developing Pudong, which began in 1990. Between 2000 and 2014, the built-up area east of the Huangpu River expanded much more than the area to the west.
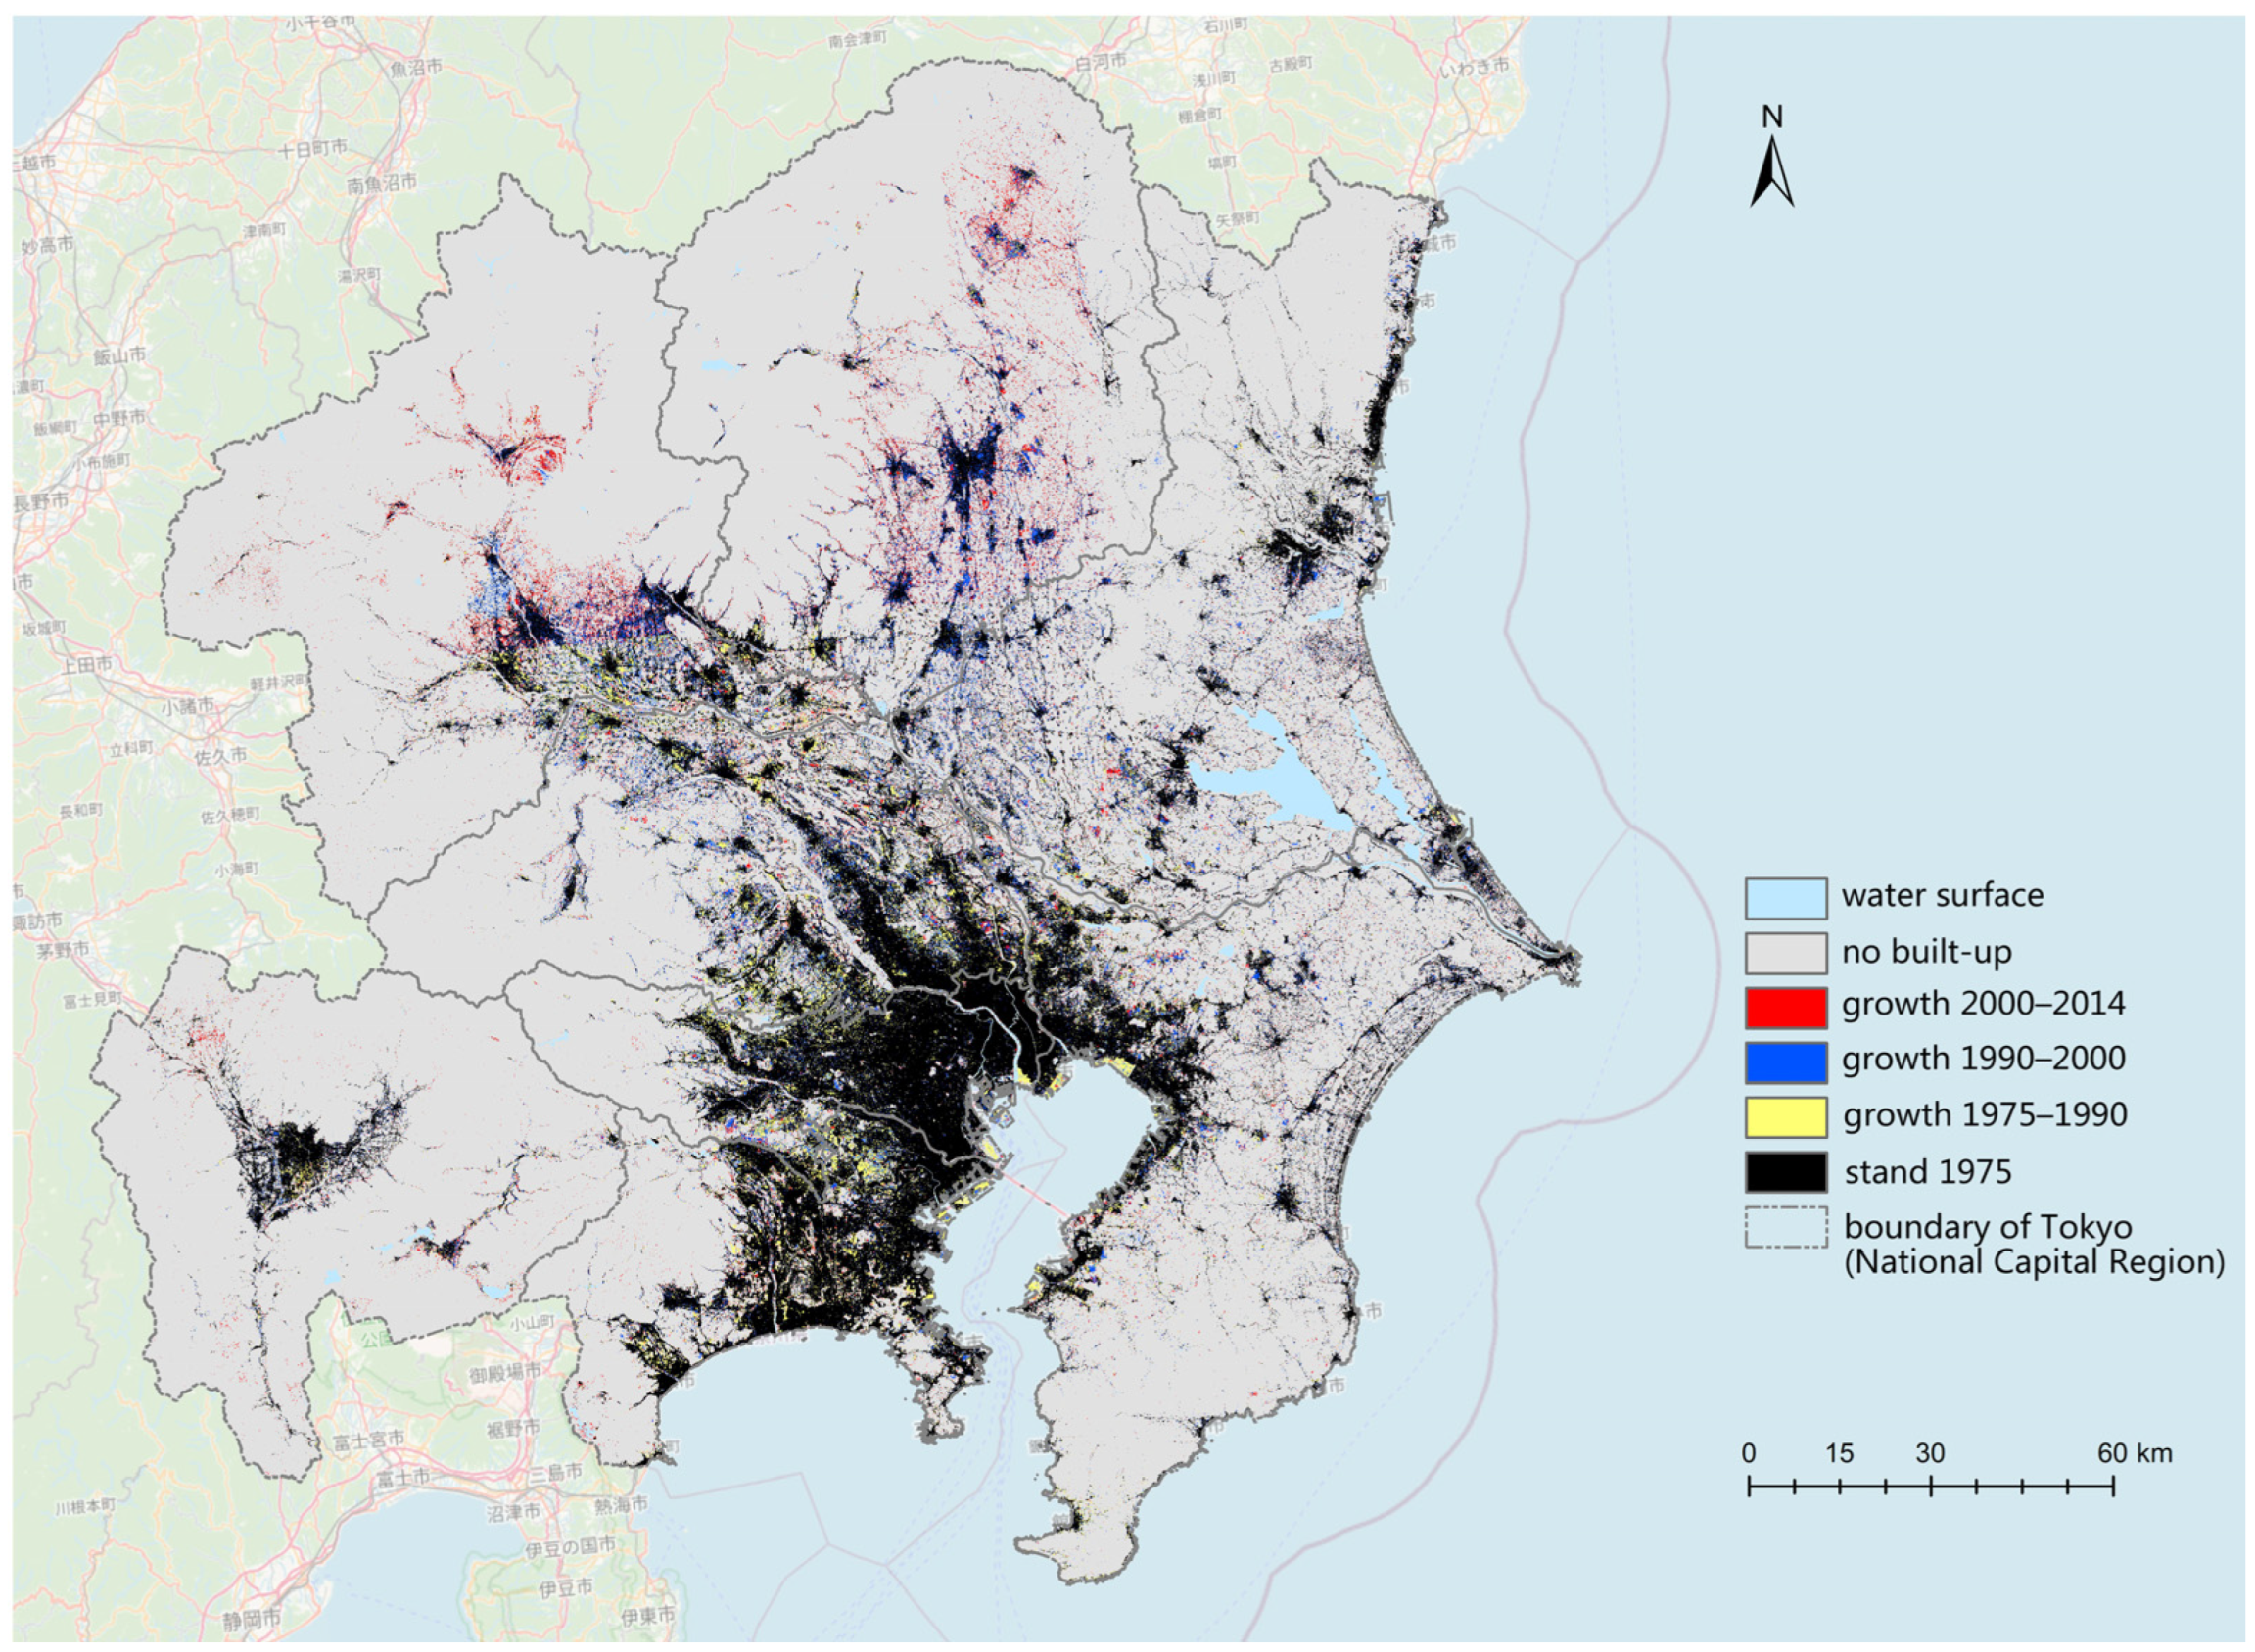
  • Despite the differences in the time frames of large-scale urban growth in Tokyo and Shanghai, the two cities show many similarities in urban development based on quantitative inspection supported by visual interpretation (cf. Table 3 and Table 4, Figure 4): Through visual inspection of built-up intensity for the four time nodes, we were able to identify significant hotspots of built-up growth, which largely coincide with the location of planned satellite cities and new towns in contemporary planning guidance. However, there is a remarkable discrepancy between the built-up intensity and high urban population concentration in the planning guidance for satellite cities and new cities. While the development patterns in Tokyo and Shanghai indicate a strong correlation between growth priorities in terms of built-up area (built-up intensity) and the planning guidance for satellite cities and new towns, the population concentration did not develop as envisaged in the planning guidance.
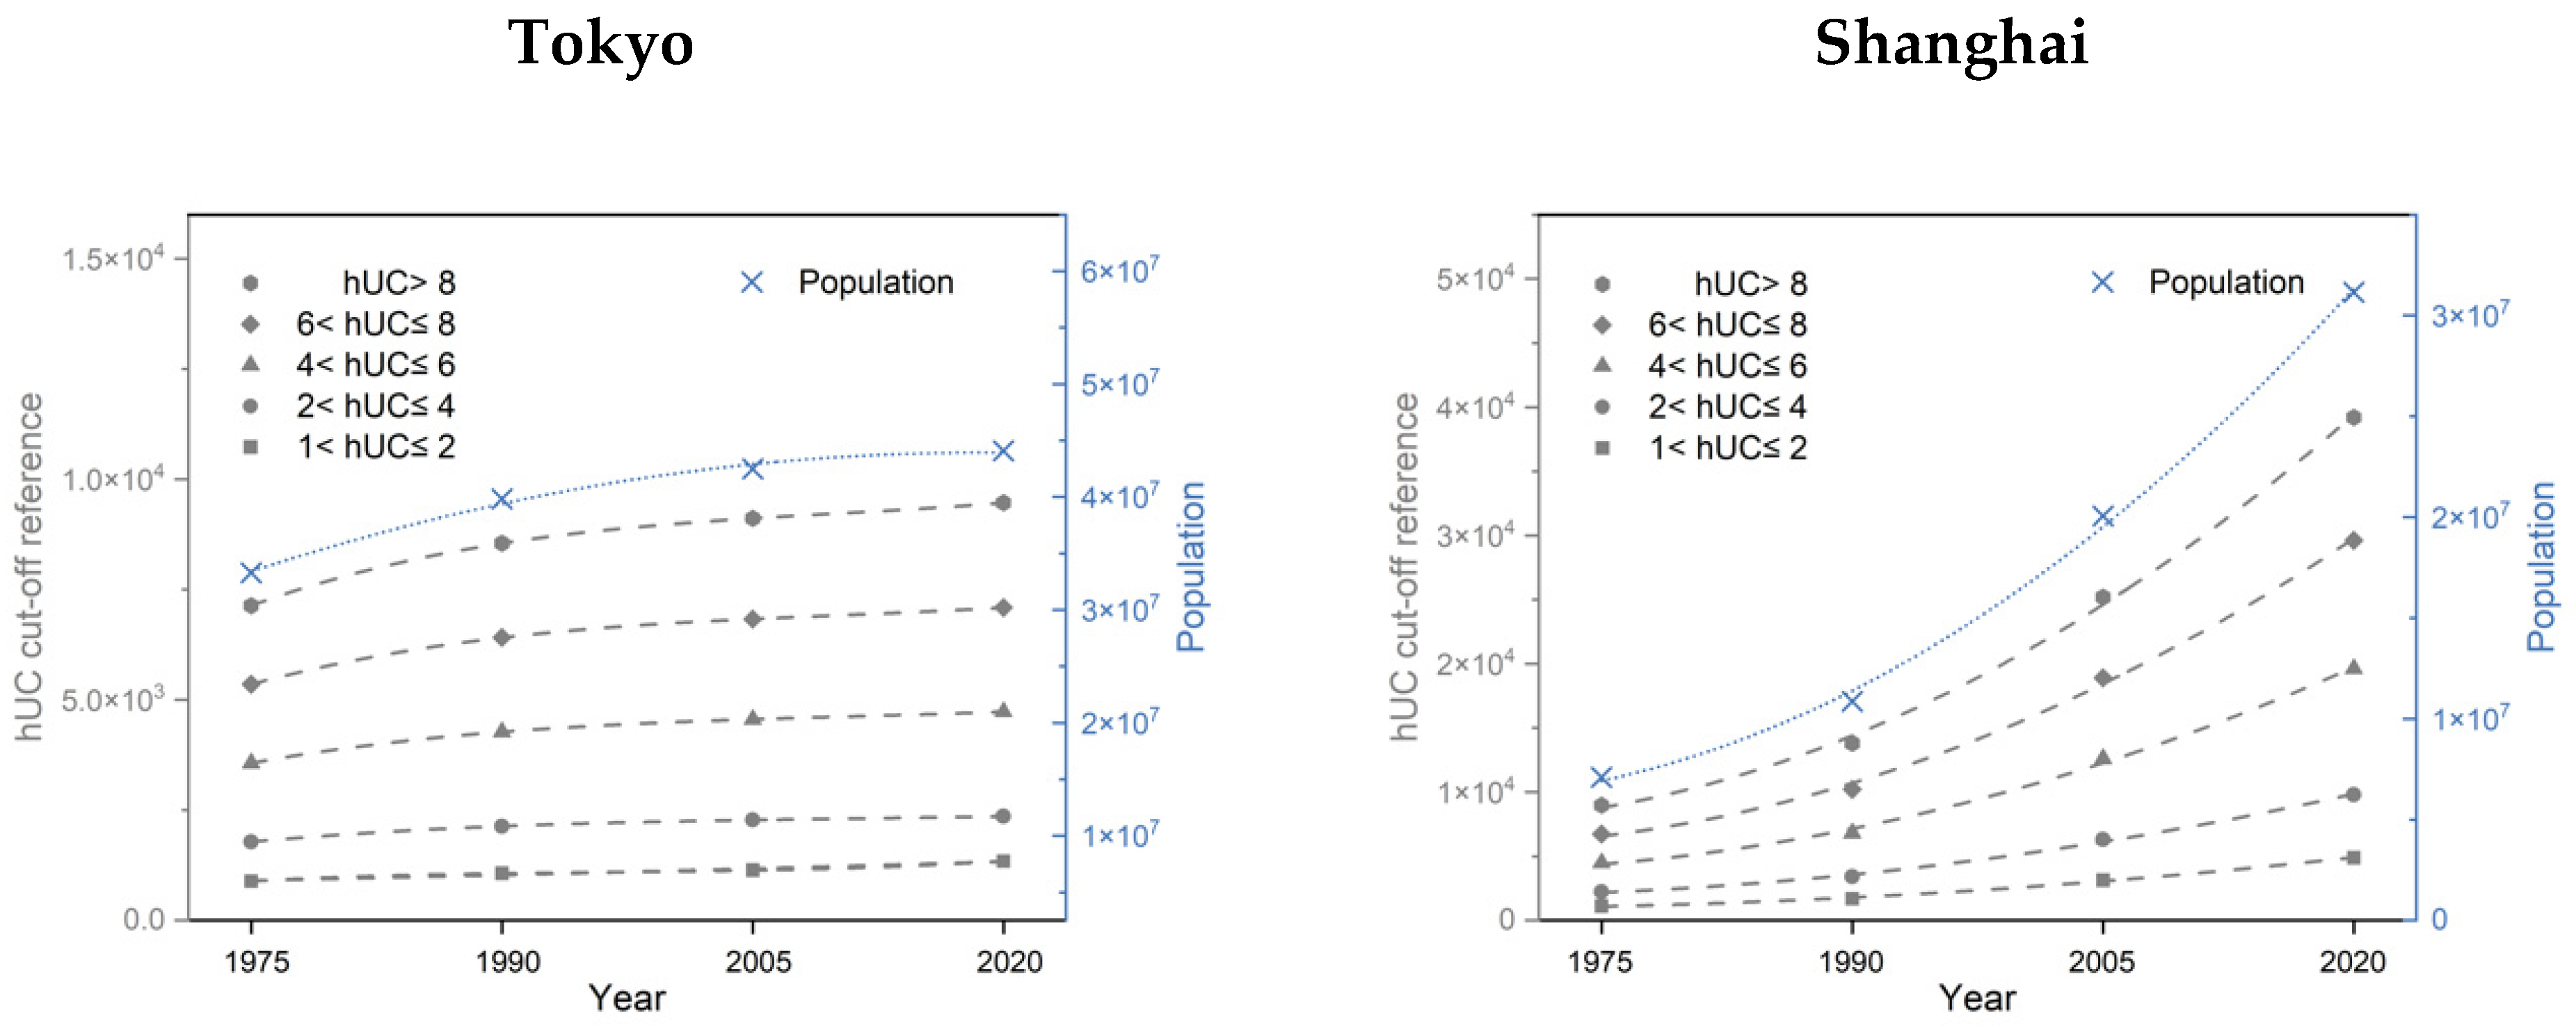
  • The development pattern of Tokyo and Shanghai shows that the high urban population concentration remained in central urban areas, while the thresholds for hUCs increased with the population size of the whole city. Here, good coupling curves were found between the increase in hUC cut-off values and the population of the entire city in both Tokyo and Shanghai. A shared trend is that the higher the cut-off value, the closer the population hUC curve to the overall population growth curve of the entire city. This means that the concentration of residents in certain high-density areas is further intensified by the massive growth of the urban population. Therefore, the intended objective of the satellite city and new town of achieving a certain level of population dispersion in a polycentric urban structure has not been attained.
  • In the later years of the two time frames (i.e., 2005 and 2020), the maps of built-up intensity indicate a fragmentation in both Tokyo and Shanghai. This can be interpreted as the undeveloped areas between the growth sub-centres (planned satellite towns and new towns) being filled with additional settlement areas and thus merging together as coherent parts.

5. Discussion and Conclusions

One major conclusion we can draw from the comparative analysis of Tokyo and Shanghai is that the situation in Tokyo, although very different to other cities in the Global North, is not unique. Despite differences in the time frames of peak urban growth in Tokyo and Shanghai, the time periods of comparison (1975–2020), as well as Tokyo’s more moderate population growth, the situation in the two cities still shows a high degree of comparability:
  • Previous urban plans for both Tokyo and Shanghai pursued a policy of polycentric urban growth management, namely the creation of satellite cities and new towns to absorb the population and attract new industries. Our quantitative-evidence-based comparative study over the period 1975–2020 shows that the designation of satellite cities and new towns did not succeed in creating a polycentric urban structure at a time of intensive growth in the urban population. Visual inspection of the expansion of built-up areas and population shows a clear discrepancy between planning efforts and the real development trends: although the satellite cities and new towns were planned and also to a large extent built, this did not result in the desired population dispersion away from the urban centre.
  • In terms of managed population growth, these plans have thus not fully lived up to the original aspirations. In fact, a rising urban population in both Tokyo and Shanghai led to the further densification of already very densely populated areas in the urban core. In particular, the higher the population density in an area, the more its trend in density growth coincides with the population growth of the city as a whole. This phenomenon is evident in both Tokyo and Shanghai. It can be contrasted with the example of Shenzhen [20], which shows how a planning-led polycentric structure can also yield substantial success in growth management, both regarding built-up areas and population density. Considering that Shenzhen is “a city with no urban history”, we can assume that in metropolises such as Tokyo and Shanghai, the creation of planned satellite cities and new towns is not an ideal way of steering population growth away from the urban core.
  • Quantitative examination and visual inspection of the growth in built-up areas in Tokyo and Shanghai, in particular growth hotspots (intensity), shows that even if the planning of satellite cities and new towns can help form a polycentric urban structure in the early development phase, massive growth in the urban population will still lead to urban sprawl in subsequent development phases. This shows that the strategy of creating a polycentric urban structure through satellite cities and new towns will have a limited impact on the management of population growth in the long term.
  • During the studied period, the vacant spaces between the city centres and the satellite cities/new towns filled up both in Tokyo and Shanghai, resulting in a continuous expansion of the cities, with their settlement areas merging into coherent parts. This seems to be the inevitable result of massive population growth. Clearly, urban planners and planning scholars should move away from the planned management of settlement/population distribution into standalone satellite cities/new towns to consider alternative approaches, such as establishing strict boundaries for settlement development and ecological reserves in existing peripheral areas, e.g., similar to the Copenhagen Finger Plan concept along railway lines. This could prove more sustainable in the long run by setting clear limits on the free market regarding industrial and residential development.
This study continues the methodology developed by Xie et al. for a case study of the Chinese city of Shenzhen [20], in which GIS data were used to quantitatively assess and visually represent the impact of planning interventions in urban growth management, thereby contributing to an evidence-based investigation of the long-term impact of satellite city/new town planning. The differences in the development pathways of Tokyo and Shanghai in the current case and Shenzhen in the aforementioned study confirm the plausibility of the methodology and its transferability to other geographical settings. One limitation of the methodology adopted in both studies is that it only considers data on built-up areas and population and not, for instance, data on jobs and the number of workplaces. This is justified due to the lack of consistent employment data for the time frame of 45 years considered here. Nevertheless, future studies that attempt to use the available data on employment and jobs for a more in-depth examination of, for example, “intensity of land use” or land productivity will be beneficial.

Author Contributions

Runzhu Gu: data curation and visualization; Zhiqiu Xie: data curation and visualization; Chika Takatori: methodology, supervision and writing—original draft; Hendrik Herold: methodology, supervision and data validation; Xiaoping Xie: conceptualization, methodology, supervision, funding acquisition and writing—original draft, review and editing. All authors have read and agreed to the published version of the manuscript.

Funding

The study was supported by the funding programme Internationalisation of TU Dresden within the framework of the Excellence Strategy of the Federal Government and the States of Germany. The Article Processing Charges (APC) were funded by the joint publication funds of the TU Dresden, including Carl Gustav Carus Faculty of Medicine, and the SLUB Dresden as well as the Open Access Publication Funding of the DFG.

Data Availability Statement

The original GIS data are available as follows: [17] Corbane, C.; Florczyk, A.; Pesaresi, M.; Politis, P.; Syrris, V. GHS Built-Up Grid, Derived from Landsat, Multitemporal (1975–1990–2000–2014), R2018A; European Commission, Joint Research Centre (JRC): Sevilla, Spain, 2018. https://doi.org/10.2905/jrc-ghsl-10007. Available online: http://data.europa.eu/89h/jrc-ghsl-10007 (accessed on 6 September 2022). [18] Pesaresi, M., and Politis, P. (2022). GHS-BUILT-S R2022A—GHS built-up surface grid, derived from Sentinel-2 composite and Landsat, multitemporal (1975–2030). European Commission, Joint Research Centre (JRC). https://doi.org/10.2905/D07D81B4-7680-4D28-B896-583745C27085. PID: http://data.europa.eu/89h/d07d81b4-7680-4d28-b896-583745c27085 (accessed on 6 September 2022). [19] Schiavina, M., Freire, S., and MacManus, K. (2022). GHS-POP R2022A—GHS population grid multitemporal (1975–2030). European Commission, Joint Research Centre (JRC). DOI: 10.2905/D6D86A90-4351-4508-99C1-CB074B022C4A. PID: http://data.europa.eu/89h/d6d86a90-4351-4508-99c1-cb074b022c4a (accessed on 6 September 2022).

Conflicts of Interest

The authors declare no conflict of interest.

References

  1. United Nations, Department of Economic and Social Affairs, Population Division. World Urbanization Prospects: The 2018 Revision. 2019. Available online: https://population.un.org/wup/publications/Files/WUP2018-Report.pdf (accessed on 10 August 2022).
  2. United Nations. New Urban Agenda—Habitat III. 2017. Available online: https://habitat3.org/the-new-urban-agenda (accessed on 10 August 2022).
  3. Bhan, G. Notes on a southern urban practice. Environ. Urban. 2019, 31, 639–654. [Google Scholar] [CrossRef]
  4. Roy, A. Who’s afraid of postcolonial theory? Int. J. Urban Reg. Res. 2016, 40, 200–209. [Google Scholar] [CrossRef]
  5. Storper, M.; Scott, A.J. Current debates in urban theory: A critical assessment. Urban Stud. 2016, 53, 1114–1136. [Google Scholar] [CrossRef] [Green Version]
  6. Wakeman, R. Practicing Utopia—An Intellectual History of the New Town Movement; The University of Chicago Press: Chicago, IL, USA, 2016. [Google Scholar]
  7. Yiftachel, O. The Aleph–Jerusalem as critical learning. City 2016, 20, 483–494. [Google Scholar] [CrossRef]
  8. Watson, V. Shifting approaches to planning theory: Global North and South. Urban Plan. 2016, 1, 32–41. [Google Scholar] [CrossRef]
  9. Xie, X.; Kang, H.; Behnisch, M.; Baildon, M.; Krüger, T. To what extent can the Green Belts prevent urban sprawl?—A comparative study of Frankfurt am Main, London and Seoul. Sustainability 2020, 12, 679. [Google Scholar] [CrossRef] [Green Version]
  10. Monclús, J.; Díez, M.C. Modern urban planning and modernist urbanism (1930–1950). In Urban Visions; Carmen, D.M., Javier, M., Eds.; Springer: Cham, Switzerland, 2018; pp. 281–304. [Google Scholar]
  11. Watson, V. The return of the city-region in the new urban agenda: Is this relevant in the Global South? Reg. Stud. 2021, 55, 19–28. [Google Scholar] [CrossRef]
  12. Van Leynseele, Y.; Bontje, M. Visionary cities or spaces of uncertainty? Satellite cities and new towns in emerging economies. Int. Plan. Stud. 2019, 24, 207–217. [Google Scholar] [CrossRef] [Green Version]
  13. Danish Ministry of the Environment, Nature Agency. The Finger Plan: A Strategy for the Development of the Greater Copenhagen Area. 2015. Available online: https://danishbusinessauthority.dk/sites/default/files/fp-eng_31_13052015.pdf (accessed on 19 September 2022).
  14. Rickaby, P.A. Six settlement patterns compared. Environ. Plan. B Plan. Des. 1987, 14, 193–223. [Google Scholar] [CrossRef]
  15. Murayama, Y. Tokyo and Paris: Comparison of urban spatial structure. In Japanese Urban System; Murayama, Y., Ed.; The GeoJournal Library; Springer: Dordrecht, The Netherlands, 2000; Volume 56. [Google Scholar] [CrossRef]
  16. Sorensen, A. Subcentres and satellite cities: Tokyo’s 20th century experience of planned polycentrism. Int. Plan. Stud. 2001, 6, 9–32. [Google Scholar] [CrossRef] [Green Version]
  17. Corbane, C.; Florczyk, A.; Pesaresi, M.; Politis, P.; Syrris, V. GHS Built-Up Grid, Derived from Landsat, Multitemporal (1975–1990–2000–2014), R2018A; European Commission, Joint Research Centre (JRC): Sevilla, Spain, 2018. [Google Scholar] [CrossRef]
  18. Pesaresi, M.; Politis, P. GHS-BUILT-S R2022A-GHS Built-Up Surface Grid, Derived from Sentinel-2 Composite and Landsat, Multitemporal (1975–2030); European Commission, Joint Research Centre (JRC): Sevilla, Spain, 2022. [Google Scholar] [CrossRef]
  19. Schiavina, M.; Freire, S.; MacManus, K. GHS-POP R2022A-GHS Population Grid Multitemporal (1975–2030); European Commission, Joint Research Centre (JRC): Sevilla, Spain, 2022. [Google Scholar] [CrossRef]
  20. Xie, X.; Hou, W.; Herold, H. Ex post impact assessment of master plans—The case of Shenzhen in shaping a polycentric urban structure. Int. J. Geo-Inf. 2018, 7, 252. [Google Scholar] [CrossRef] [Green Version]
  21. Greene, D.L. Recent trends in urban spatial structure. Growth Change 1980, 11, 29–40. [Google Scholar] [CrossRef] [PubMed]
  22. Riguelle, F.; Thomas, I.; Verhetsel, A. Measuring urban polycentricity: A European case study and its implications. J. Econ. Geogr. 2007, 7, 193–215. [Google Scholar] [CrossRef]
  23. Taubenböck, H.; Standfuß, I.; Wurma, M.; Krehl, A.; Siedentop, S. Measuring morphological polycentricity—A comparative analysis of urban mass concentrations using remote sensing data. Comput. Environ. Urban Syst. 2017, 64, 42–56. [Google Scholar] [CrossRef]
  24. McDonald, J.F. The identification of urban employment subcenters. J. Urban Econ. 1987, 21, 242–258. [Google Scholar] [CrossRef]
  25. Craig, S.G.; Ng, P.T. Using quantile smoothing splines to identify employment subcenters in a multicentric urban area. J. Urban Econ. 2001, 49, 100–120. [Google Scholar] [CrossRef] [Green Version]
  26. McMillen, D.P. Nonparametric employment subcenter identification. J. Urban Econ. 2001, 50, 448–473. [Google Scholar] [CrossRef]
  27. Giuliano, G.; Small, K.A. Subcenters in the Los Angeles region. Reg. Sci. Urban Econ. 1991, 21, 163–182. [Google Scholar] [CrossRef] [Green Version]
  28. McDonald, J.F.; Prather, P.J. Suburban employment centres: The case of Chicago. Urban Stud. 1994, 31, 201–218. [Google Scholar] [CrossRef]
  29. Cleveland, W.S. Robust locally-weighted regression and smoothing scatterplots. J. Am. Stat. Assoc. 1979, 74, 829–836. [Google Scholar] [CrossRef]
  30. Cleveland, W.S.; Devlin, S.J. Locally weighted regression: An approach to regression analysis by local fitting. J. Am. Stat. Assoc. 1988, 83, 596–610. [Google Scholar] [CrossRef]
  31. Múñiz, I.; Galindo, A.; García-López, M.A. Cubic spline density functions and satellite city delimitation: The case of Barcelona. Urban Stud. 2003, 40, 1303–1321. [Google Scholar] [CrossRef]
  32. Adolphson, M. Estimating a Polycentric Urban Structure. Case Study: Urban Changes in the Stockholm Region 1991–2004. J. Urban Plan. Dev. 2009, 135, 19–30. [Google Scholar] [CrossRef]
  33. Matsubara, A.; Yamakawa, H. On the development and the construction of school town along railway by private railway company in Tokyo before World War II. Pap. Res. Meet. Civ. Eng. Hist. Jpn. 1986, 6, 250–258. [Google Scholar] [CrossRef]
  34. Tokyo Daily Newspaper. Greater Tokyo Determination of the Areas and Names of the 20 New Wards—Documents Sent to the Ministry of the Interior. Volume 12. 1932. Available online: https://da.lib.kobe-u.ac.jp/da/np/0100200815/ (accessed on 12 December 2022).
  35. Sanada, J. A Study on Green Belt Ring Plan of Tokyo Park System. J. City Plan. Inst. Jpn. 2003, 38, 601–606. [Google Scholar] [CrossRef]
  36. Ministry of Land, Infrastructure and Transport. White Paper on National Capital Region Development. 2006. Available online: https://www.mlit.go.jp/kokudokeikaku/international/reports/white_paper_capital_2006_eng.pdf (accessed on 17 December 2022).
  37. National Land Agency. Metropolitan Area Development Plan Metropolitan Area Basic Plan (1st to 4th Round), The Changing Face of Tokyo: From Edo to Today, and into the Future. 1997. Available online: https://tokyo-urbandesignhistory.jp/ (accessed on 12 December 2022).
  38. Metropolitan Area Development Plans and Metropolitan Regional Plans: Genealogy and Prospects for Regional Planning in the Metropolitan Area. Community Or Reg. Dev. 2010, 551, 18–22.
  39. Torina, T. Review of the Metropolitan Basic Plan. Urban Plan. 2000, 49, 9–12. [Google Scholar]
  40. Metropolitan Policy Research Institute, Inc. Passage of the Metropolitan Area Basic Plan, Genealogy of Metropolitan Policy Series No. 6; Office of Management and Budget: Washington, DC, USA, 2000. [Google Scholar]
  41. Ishida, Y. Chronology of modern and contemporary urban planning history in Japan. In The Development of Modern and Contemporary Urban Planning in Japan: 1868–2003; Japan Local Government Centre: London, UK, 2004; pp. 335–363. ISBN 4880374075. [Google Scholar]
  42. Ministry of Land, Infrastructure, Transport and Tourism. The Greater Tokyo Metropolitan Area Regional Plan. Available online: https://www.ktr.mlit.go.jp/ktr_content/content/000643635.pdf (accessed on 19 December 2022).
  43. Takeuchi, T.; Ishikawa, M. A Study on the green space policies on the fringe of Tokyo Wards Area in the 1950‘s and 60’s. J. City Plan. Inst. Jpn. 2008, 43, 199–204. [Google Scholar] [CrossRef]
  44. Huang, X. The construction of Shanghai’s first batch of satellite cities. Shanghai Stud. CCP Hist. Constr. 2010, 2, 18–20. [Google Scholar]
  45. Hou, L.; Wang, Y. Greater Shanghai Plans (1946–1949): Planning visions and practice of a modern Chinese metropolis. City Plan. Rev. 2015, 10, 16–23. [Google Scholar] [CrossRef]
  46. Shanghai Academy of Urban Planning and Design. Greater Shanghai Plan; Tongji University Press: Shanghai, China, 2014. [Google Scholar]
  47. Li, X.; Fang, J.; Piao, S. The intensity and modes of urban land use growth in Shanghai. J. Nat. Resour. 2003, 18, 412–422. [Google Scholar]
  48. Nakamura, T. A Study on the National Capital Region Development Planning System and the Metropolitan Development Zoning System. J. City Plan. Inst. Jpn. 1991, 26, 73–78. [Google Scholar] [CrossRef]
  49. Tokyo Urban Planning and Development Corporation. A General History of Urban Development in Tokyo; Tokyo Urban Planning and Development Corporation: Hachioji, Japan, 2019. [Google Scholar]
  50. Compilation Committee of the Shanghai Urban Planning Chronicle. Shanghai Urban Planning Chronicle; Publishing House of Shanghai Academy of Social Sciences: Shanghai, China, 1999. [Google Scholar]
  51. Shanghai Planning & Nature Resources Bureau. Available online: https://ghzyj.sh.gov.cn (accessed on 21 August 2022).
Figure 1. Methodological framework and workflow.
Ijgi 12 00234 g001
Figure 2. Growth in Tokyo’s built-up area: 1975–2014 (Source: own visualization based on GHSL 2018 Data ©EC, JRC, cf. [17]; background map: © OSM 2022).
Ijgi 12 00234 g002
Figure 3. Growth in Shanghai’s built-up area: 1975–2014 (Source: own visualization based on GHSL 2018 Data ©EC, JRC, cf. [17]; background map: © OSM 2022).
Ijgi 12 00234 g003
Figure 4. Comparison of hUC development trends in Tokyo and Shanghai: 1975–2020 (Source: own calculation and visualization based on GHSL R2022A Data © EC, JRC, cf. [18]).
Ijgi 12 00234 g004
Table 1. Overview of satellite city/new town planning in Tokyo [48,49].
YearPlanning Targets for Satellite Cities and New Towns
1958The government established a 10 km wide green belt around the existing urban area to control expansion, while designating several development zones (satellite cities) in the surrounding areas to be developed industrially. These were intended to attract citizens away from the urban centre. In addition, the distribution of various urban services/functions was to be restricted in the wards of Tokyo to limit the construction of new factories, universities and other facilities.
1968The Japanese government forecast that the population of the Tokyo metropolitan area would increase from 26.96 million to 33.1 million in the period 1965–1975. As a response to the spatial concentration of various functions and population that accompanied Japan’s rapid economic growth, the government decided to construct the Tokyo metropolitan area as an integrated city. In terms of regional development, the aim was to create urbanisation promotion areas and urbanisation control areas in order to prevent urban sprawl. In the surrounding urban development areas, the authorities decided to continue to promote the development of satellite cities.
1976The planning aim was to manage the concentration of people and buildings while decentralizing the administrative facilities in the Tokyo metropolitan area. The population of the metropolitan area was forecast to rise from 33.62 million to approx. 38 million in the period 1975–1985. Unlike the previous plan, the central functions were selectively dispersed, the concentration of universities, etc., in the metropolitan area was minimized and dispersed to areas outside existing urban areas, and efforts were made to actively disperse industry outside the Tokyo metropolitan area.
1986The Japanese government forecast that the population of the Tokyo metropolitan area would rise from 37.6 million to 40.9 million in the period 1985–2000. As the basic direction of regional development, Tokyo’s metropolitan area should form self-sustaining metropolitan areas centred on business core cities, and rebuild a multi-nuclear, multi-regional structure while promoting the concentration of various functions in the surrounding areas. The plan designated Yokohama/Kawasaki, Chiba, Urawa/Omiya, Hachioji/Tachikawa, etc., as core business cities; further developments included the Minatomirai district in Yokohama, Makuhari New Urban Centre in Chiba, Saitama New Urban Centre, etc., as well as the relocation of administrative agencies, etc.
1999The aim was to shape the overall structure of the Tokyo metropolitan area so as to reduce overdependence on the centre of Tokyo, and to create a “decentralized network structure” in which various functions are arranged in a well-balanced manner around regional hub cities (Yokohama, Saitama, Chiba, Tachikawa, etc.). In turn, this should create highly independent regions with enhanced functions through mutual cooperation and exchange.
2017The Greater Tokyo Metropolitan Area Regional Plan is a 10-year plan that identifies regional strategies for the realization of a new metropolitan area. The plan aims to strengthen the global urban functions that Tokyo possesses and to build a metropolitan area that can maximize the value of its infrastructure stock, such as a transportation network that extends over an area. The planning area is oriented on the Tokyo metropolitan area and its seven prefectures, including the four neighbouring prefectures that are closely related to the metropolitan area; thus, it encompasses, the Tokyo metropolitan area and its 11 prefectures.
Table 2. Overview of satellite city/new town planning in Shanghai [50,51].
YearPlanning Targets for Satellite Cities and New Towns
1957The Shanghai Planning and Construction Bureau proposed the construction of satellite cities to decentralize heavy industries and relieve the excessively concentrated core city. Five satellite cities were planned, namely Minhang, Wujiang, Anting, Songjiang and Jiading.
1959The Draft Master Plan of 1959 adopted the basic idea of the Greater Shanghai Plans (drawn up from 1946 to 1949). In addition to the 5 satellite cities already under construction, another 12 satellite cities were designated, each with 100,000–200,000 inhabitants.
1986The Master Plan of 1986 once again emphasized the construction of satellite cities, revising their target population upwards to 300,000. The two large-scale industrial bases of Baosteel and Jinshan Petrochemical were added to the list of satellite cities. The master plan aimed to limit population growth in the whole administrative area of Shanghai to 13 million by the year 2000. Within this framework, the urban system of Shanghai was divided into four levels: The first level was the core city, with a target population of 6.5 million residents within an area of 300 square kilometres. The second level consisted of the industrial areas in the urban fringe and the satellite cities in suburban areas with target populations of 1.53 million.
2001The Shanghai Master Plan for 1999–2020 continued the multi-level urban system, now revised to cover five levels. These were: the core city with a target population of 8 million spread over 600 square kilometres; the 11 satellite cities of Baoshan, Jiading, Songjiang, Jinshan, Minhang, Huinan, Qingpu, Nanqiao, Chengqiao, Airport New City and Seaport New City, with populations of around 200,000 to 300,000; the 22 central towns with standard populations of 50,000 to 100,000; about 80 towns with populations of 10,000 to 30,000; and finally, central villages of around 2000 residents.
2017The Shanghai Master Plan for 2017–2035 has once again revised the urban spatial structure. The four satellite cities (Baoshan, Hongqiao, Minhang and Chuansha), which are relatively close to the central city and whose built-up areas have been integrated with the core city, form the main urban area together with the core city. The other five satellite cities (Jiading, Songjiang, Qingpu, Fengxian and Nanhui) at some distance from the main urban area continue to be identified as “new cities”. In addition, 2 core towns (Jinshan-Binhai and Chongming-Chenqiao) and another 21 central towns have been designated as central places that provide public services for the surrounding urban areas.
Table 3. Tokyo’s built-up intensity and hUCs: 1975–2020 (Source: own visualization based on GHSL R2022A Data ©EC, JRC, cf. [18]).
YearBuilt-Up IntensityhUCsValue of hUCCut-Off ReferenceShare of hUC
1975Ijgi 12 00234 i001Ijgi 12 00234 i0021 < hUC ≤ 2892.16.95%
2 < hUC ≤ 417846.06%
4 < hUC ≤ 85354.54.87%
hUC > 87138.13.01%
1990Ijgi 12 00234 i003Ijgi 12 00234 i0041 < hUC ≤ 21069.16.84%
2 < hUC ≤ 42136.45.88%
4 < hUC ≤ 86410.84.90%
hUC > 88548.22.82%
2005Ijgi 12 00234 i005Ijgi 12 00234 i0061 < hUC ≤ 21139.07.07%
2 < hUC ≤ 42279.45.47%
4 < hUC ≤ 86835.54.77%
hUC > 89114.32.77%
2020Ijgi 12 00234 i007Ijgi 12 00234 i0081 < hUC ≤ 21346.86.98%
2 < hUC ≤ 42365.84.68%
4 < hUC ≤ 87092.34.51%
hUC > 89468.02.87%
Table 4. Shanghai’s built-up intensity and hUCs: 1975–2020 (Source: own visualization based on GHSL R2022A Data ©EC, JRC, cf. [18]).
YearBuilt-Up IntensityhUCsValue of hUCCut-Off ReferenceShare of hUC
1975Ijgi 12 00234 i009Ijgi 12 00234 i0101 < hUC ≤ 21123.28.39%
2 < hUC ≤ 42242.14.64%
4 < hUC ≤ 86728.92.60%
hUC > 88988.40.80%
1990Ijgi 12 00234 i011Ijgi 12 00234 i0121 < hUC ≤ 21704.68.55%
2 < hUC ≤ 43412.84.71%
4 < hUC ≤ 810,230.32.58%
hUC > 813,807.30.71%
2005Ijgi 12 00234 i013Ijgi 12 00234 i0141 < hUC ≤ 23151.58.59%
2 < hUC ≤ 46302.04.09%
4 < hUC ≤ 818,911.62.55%
hUC > 825,194.80.75%
2020Ijgi 12 00234 i015Ijgi 12 00234 i0161 < hUC ≤ 24889.87.90%
2 < hUC ≤ 49809.43.80%
4 < hUC ≤ 829,607.32.53%
hUC > 839,200.70.71%
Disclaimer/Publisher’s Note: The statements, opinions and data contained in all publications are solely those of the individual author(s) and contributor(s) and not of MDPI and/or the editor(s). MDPI and/or the editor(s) disclaim responsibility for any injury to people or property resulting from any ideas, methods, instructions or products referred to in the content.

