Next Issue
Volume 12, July
Previous Issue
Volume 12, May


ISPRS Int. J. Geo-Inf., Volume 12, Issue 6 (June 2023) – 44 articles

Cover Story (view full-size image): 
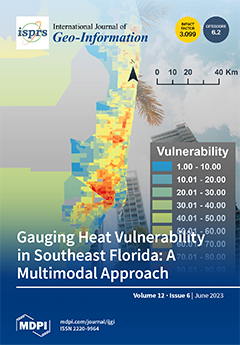
As city temperatures climb from urbanization and global warming, heat-related health impacts will increase, so locating susceptible populations is essential. A heat vulnerability index was constructed for Southeast Florida, integrating various physical exposure, sensitivity, and adaptive capacity indicators. We applied unconventional statistical weights and a multimodal approach. In addition to highly urban areas, some rural and agricultural locations were vulnerable despite having lower heat exposure. Results demonstrate that overlooked composite index methodological decisions can substantially alter assigned vulnerability scores and resulting spatial patterns. Nonetheless, this study highlights the practicality of multimodal approaches for enhancing heat vulnerability assessment comprehensiveness. View this paper
  • Issues are regarded as officially published after their release is announced to the table of contents alert mailing list.
  • You may sign up for e-mail alerts to receive table of contents of newly released issues.
  • PDF is the official format for papers published in both, html and pdf forms. To view the papers in pdf format, click on the "PDF Full-text" link, and use the free Adobe Reader to open them.
Order results
Result details
Select all
Export citation of selected articles as:
21 pages, 4352 KiB  
Article
A Study of the Impact of COVID-19 on Urban Contact Networks in China Based on Population Flows
by Xuejie Zhang, Jinli Zhao, Haimeng Liu, Yi Miao, Mengcheng Li and Chengxin Wang
ISPRS Int. J. Geo-Inf. 2023, 12(6), 252; https://doi.org/10.3390/ijgi12060252 - 20 Jun 2023
Viewed by 2583
Abstract
The emergence and enduring diffusion of COVID-19 has had a dramatic impact on cities worldwide. The scientific aim of this study was to introduce geospatial thinking to research related to infectious diseases, while the practical aim was to explore the impact on population [...] Read more.
The emergence and enduring diffusion of COVID-19 has had a dramatic impact on cities worldwide. The scientific aim of this study was to introduce geospatial thinking to research related to infectious diseases, while the practical aim was to explore the impact on population movements and urban linkages in the longer term following a pandemic outbreak. Therefore, this study took 366 cities in China as the research subjects while exploring the relationship between urban contact and the outbreak of the pandemic from both national and regional perspectives using social network analysis (SNA), Pearson correlation analysis and multi-scale geographically weighted regression (MGWR) modeling. The results revealed that the number of COVID-19 infections in China fluctuated with strain variation over the study period; the urban contact network exhibited a significant trend of recovery. The pandemic had a hindering effect on national urban contact, and this effect weakened progressively. Meanwhile, the effect exhibited significant spatial heterogeneity, with a weakening effect in the eastern region ≈ northeast region > central region > western region, indicating a decreasing phenomenon from coastal to inland areas. Moreover, the four major economic regions in China featured border barrier effects, whereby urban contact networks constituted by cross-regional flows were more sensitive to the development of the pandemic. The geostatistical approach adopted in this study related to infectious disease and urban linkages can be used in other regions, and its findings provide a reference for China and other countries around the world to respond to major public health events. Full article
(This article belongs to the Collection Spatial Components of COVID-19 Pandemic)
Show Figures

Figure 1

24 pages, 6755 KiB  
Article
Evaluation of Groundwater Vulnerability in the Upper Kelkit Valley (Northeastern Turkey) Using DRASTIC and AHP-DRASTICLu Models
by Ümit Yıldırım
ISPRS Int. J. Geo-Inf. 2023, 12(6), 251; https://doi.org/10.3390/ijgi12060251 - 19 Jun 2023
Cited by 1 | Viewed by 1207
Abstract
This study aimed to investigate groundwater vulnerability to pollution in the Upper Kelkit Valley (NE Turkey). For this purpose, vulnerability index maps were created using the generic DRASTIC and AHP-DRASTICLu models. The latter model was suggested by adding a parameter to the DRASTIC [...] Read more.
This study aimed to investigate groundwater vulnerability to pollution in the Upper Kelkit Valley (NE Turkey). For this purpose, vulnerability index maps were created using the generic DRASTIC and AHP-DRASTICLu models. The latter model was suggested by adding a parameter to the DRASTIC model and weighting its parameters with the analytical hierarchy process with the GIS technique. The results showed that areas with high and very high vulnerabilities are concentrated around the Kelkit Stream, which flows from east to west in the central part of the study area. In contrast, areas with low and very low vulnerability classes are located in the northern and southern parts of the study area. To validate the model results, a physicochemical characterization of groundwater samples and their corresponding vulnerability index values were statistically compared using the Spearman correlation method. In addition, the single-parameter sensitivity method was applied to analyze the models’ sensitivities. Results revealed a stronger correlation between the vulnerability index values of the AHP-DRASTICLu model (compared to the DRASTIC model) in terms of sulfate (R2 = 0.75) and chloride (R2 = 0.76), while there was a slightly weaker correlation for the electrical conductivity (R2 = 0.65) values of the groundwater samples. Sensitivity analysis indicated that the vadose zone, aquifer media, and land use are the most influential parameters responsible for the highest variation in the vulnerability index. Generally speaking, the results indicated that the AHP-DRASTICLu model performs better than the DRASTIC model for investigating groundwater vulnerability to pollution in the Upper Kelkit Valley. Full article
Show Figures

Figure 1

24 pages, 12270 KiB  
Article
Qualitative Analysis of Tree Canopy Top Points Extraction from Different Terrestrial Laser Scanner Combinations in Forest Plots
by Sunni Kanta Prasad Kushwaha, Arunima Singh, Kamal Jain, Jozef Vybostok and Martin Mokros
ISPRS Int. J. Geo-Inf. 2023, 12(6), 250; https://doi.org/10.3390/ijgi12060250 - 19 Jun 2023
Cited by 1 | Viewed by 1294
Abstract
In forestry research, for forest inventories or other applications which require accurate 3D information on the forest structure, a Terrestrial Laser Scanner (TLS) is an efficient tool for vegetation structure estimation. Light Detection and Ranging (LiDAR) can even provide high-resolution information in tree [...] Read more.
In forestry research, for forest inventories or other applications which require accurate 3D information on the forest structure, a Terrestrial Laser Scanner (TLS) is an efficient tool for vegetation structure estimation. Light Detection and Ranging (LiDAR) can even provide high-resolution information in tree canopies due to its high penetration capability. Depending on the forest plot size, tree density, and structure, multiple TLS scans are acquired to cover the forest plot in all directions to avoid any voids in the dataset that are generated. However, while increasing the number of scans, we often tend to increase the data redundancy as we keep acquiring data for the same region from multiple scan positions. In this research, an extensive qualitative analysis was carried out to examine the capability and efficiency of TLS to generate canopy top points in six different scanning combinations. A total of nine scans were acquired for each forest plot, and from these nine scans, we made six different combinations to evaluate the 3D vegetation structure derived from each scan combination, such as Center Scans (CS), Four Corners Scans (FCS), Four Corners with Center Scans (FCwCS), Four Sides Center Scans (FSCS), Four Sides Center with Center Scans (FSCwCS), and All Nine Scans (ANS). We considered eight forest plots with dimensions of 25 m × 25 m, of which four plots were of medium tree density, and the other four had a high tree density. The forest plots are located in central Slovakia; European beech was the dominant tree species with a mixture of European oak, Silver fir, Norway spruce, and European hornbeam. Altogether, 487 trees were considered for this research. The quantification of tree canopy top points obtained from a TLS point cloud is very crucial as the point cloud is used to derive the Digital Surface Model (DSM) and Canopy Height Model (CHM). We also performed a statistical evaluation by calculating the differences in the canopy top points between ANS and the five other combinations and found that the most significantly different combination was FSCwCS respective to ANS. The Root Mean Squared Error (RMSE) of the deviations in tree canopy top points obtained for plots TLS_Plot1 and TLS_Plot2 ranged from 0.89 m to 14.98 m and 0.61 m to 7.78 m, respectively. The relative Root Mean Squared Error (rRMSE) obtained for plots TLS_Plot1 and TLS_Plot2 ranged from 0.15% to 2.48% and 0.096% to 1.22%, respectively. Full article
(This article belongs to the Special Issue Geomatics in Forestry and Agriculture: New Advances and Perspectives)
Show Figures

Figure 1

20 pages, 8478 KiB  
Article
The Role of Subjective Perceptions and Objective Measurements of the Urban Environment in Explaining House Prices in Greater London: A Multi-Scale Urban Morphology Analysis
by Sijie Yang, Kimon Krenz, Waishan Qiu and Wenjing Li
ISPRS Int. J. Geo-Inf. 2023, 12(6), 249; https://doi.org/10.3390/ijgi12060249 - 19 Jun 2023
Cited by 8 | Viewed by 1612
Abstract
House prices have long been closely related to the built environment of cities, yet whether the subjective perception (SP) of these environments has a differing effect on prices at multiple urban scales is unclear. This study sheds light on the impact of people’s [...] Read more.
House prices have long been closely related to the built environment of cities, yet whether the subjective perception (SP) of these environments has a differing effect on prices at multiple urban scales is unclear. This study sheds light on the impact of people’s SP of the urban environment on house prices in a multi-scale urban morphology analysis. We trained a machine learning (ML) model to predict people’s SP of the urban environment around properties across Greater London with survey response data from an online survey evaluating people’s SP of street view image (SVI) and linked this to house price data. This information was used to construct a hedonic price model (HPM) and to evaluate the association between SP and house price data in a series of linear regression models controlling location information and urban morphological characteristics such as street network centralities at multiple urban scales, quantified using space syntax (SS) methods. The findings show that SP influences house prices, but this influence differs depending on the urban scale of analysis. Particularly, a sense of ‘enclosure’ and ‘comfort’ are important factors influencing house price variation. This study contributes by introducing SP of the urban environment as a new dimension into the traditional HPM and by exploring the economic impact of SP on the house price market at multiple urban scales. Full article
Show Figures

Figure 1

17 pages, 5482 KiB  
Article
Navigation-Oriented Topological Model Construction Algorithm for Complex Indoor Space
by Litao Han, Hu Qiao, Zeyu Li, Mengfan Liu and Pengfei Zhang
ISPRS Int. J. Geo-Inf. 2023, 12(6), 248; https://doi.org/10.3390/ijgi12060248 - 18 Jun 2023
Viewed by 1008
Abstract
Indoor space information is the basis of indoor location services such as indoor navigation, path planning, emergency evacuation, etc. Focusing on indoor navigation needs, this paper proposes a fast construction algorithm for a complex indoor space topology model based on disjoint set for [...] Read more.
Indoor space information is the basis of indoor location services such as indoor navigation, path planning, emergency evacuation, etc. Focusing on indoor navigation needs, this paper proposes a fast construction algorithm for a complex indoor space topology model based on disjoint set for the problem of lacking polygon description and topological relationship expression of indoor space entity objects in building plan drawings. Firstly, the Tarjan algorithm is used for identifying the hanging edges existing in the indoor space. Secondly, each edge is stored as two different edges belonging to two adjacent polygons that share the edge. A ring structure is introduced to judge the geometric position of walls, and then an efficient disjoint set algorithm is used to perform set merging. After that, disjoint set is queried to obtain all indoor space contours and external boundary contours, thereby the complete indoor space topological relationship at multiple levels is established. Finally, the connectivity theory of graph is used for solving the problem of a complex isolated polygon in topology information generation. The experimental results show that the proposed algorithm has generality to efficiently complete the automatic construction of a topological model for complex scenarios, and effectively acquire and organize indoor space information, thus providing a good spatial cognition mode for indoor navigation. Full article
Show Figures

Figure 1

22 pages, 50394 KiB  
Article
Multi-Supervised Feature Fusion Attention Network for Clouds and Shadows Detection
by Huiwen Ji, Min Xia, Dongsheng Zhang and Haifeng Lin
ISPRS Int. J. Geo-Inf. 2023, 12(6), 247; https://doi.org/10.3390/ijgi12060247 - 18 Jun 2023
Cited by 11 | Viewed by 1237
Abstract
Cloud and cloud shadow detection are essential in remote sensing imagery applications. Few semantic segmentation models were designed specifically for clouds and their shadows. Based on the visual and distribution characteristics of clouds and their shadows in remote sensing imagery, this paper provides [...] Read more.
Cloud and cloud shadow detection are essential in remote sensing imagery applications. Few semantic segmentation models were designed specifically for clouds and their shadows. Based on the visual and distribution characteristics of clouds and their shadows in remote sensing imagery, this paper provides a multi-supervised feature fusion attention network. We design a multi-scale feature fusion block (FFB) for the problems caused by the complex distribution and irregular boundaries of clouds and shadows. The block consists of a fusion convolution block (FCB), a channel attention block (CAB), and a spatial attention block (SPA). By multi-scale convolution, FCB reduces excessive semantic differences between shallow and deep feature maps. CAB focuses on global and local features through multi-scale channel attention. Meanwhile, it fuses deep and shallow feature maps with non-linear weighting to optimize fusion performance. SPA focuses on task-relevant areas through spatial attention. With the three blocks above, FCB alleviates the difficulties of fusing multi-scale features. Additionally, it makes the network resistant to background interference while optimizing boundary detection. Our proposed model designs a class feature attention block (CFAB) to increase the robustness of cloud detection. The network achieves good performance on the self-made cloud and shadow dataset. This dataset is taken from Google Earth and contains remote sensing imagery from several satellites. The proposed model achieved a mean intersection over union (MIoU) of 94.10% on our dataset, which is 0.44% higher than the other models. Moreover, it shows high generalization capability due to its superior prediction results on HRC_WHU and SPARCS datasets. Full article
Show Figures

Figure 1

21 pages, 54990 KiB  
Article
Quantifying the Spatial Ratio of Streets in Beijing Based on Street-View Images
by Wei Gao, Jiachen Hou, Yong Gao, Mei Zhao and Menghan Jia
ISPRS Int. J. Geo-Inf. 2023, 12(6), 246; https://doi.org/10.3390/ijgi12060246 - 17 Jun 2023
Cited by 2 | Viewed by 1943
Abstract
The physical presence of a street, called the “street view”, is a medium through which people perceive the urban form. A street’s spatial ratio is the main feature of the street view, and its measurement and quality are the core issues in the [...] Read more.
The physical presence of a street, called the “street view”, is a medium through which people perceive the urban form. A street’s spatial ratio is the main feature of the street view, and its measurement and quality are the core issues in the field of urban design. The traditional method of studying urban aspect ratios is manual on-site observation, which is inefficient, incomplete and inaccurate, making it difficult to reveal overall patterns and influencing factors. Street view images (SVI) provide large-scale urban data that, combined with deep learning algorithms, allow for studying street spatial ratios from a broader space-time perspective. This approach can reveal an urban forms’ aesthetics, spatial quality, and evolution process. However, current streetscape research mainly focuses on the creation and maintenance of spatial data infrastructure, street greening, street safety, urban vitality, etc. In this study, quantitative research of the Beijing street spatial ratio was carried out using street view images, a convolution neural network algorithm, and the classical street spatial ratio theory of urban morphology. Using the DenseNet model, the quantitative measurement of Beijing’s urban street location, street aspect ratio, and the street symmetry was realized. According to the model identification results, the law of the gradual transition of the street spatial ratio was depicted (from the open and balanced type to the canyon type and from the historical to the modern). Changes in the streets’ spatiotemporal characteristics in the central area of Beijing were revealed. Based on this, the clustering and distribution phenomena of four street aspect ratio types in Beijing are discussed and the relationship between the street aspect ratio type and symmetry is summarized, selecting a typical lot for empirical research. The classical theory of street spatial proportion has limitations under the conditions of high-density development in modern cities, and the traditional urban morphology theory, combined with new technical methods such as streetscape images and deep learning algorithms, can provide new ideas for the study of urban space morphology. Full article
Show Figures

Figure 1

18 pages, 5387 KiB  
Article
Efficient Classification of Imbalanced Natural Disasters Data Using Generative Adversarial Networks for Data Augmentation
by Rokaya Eltehewy, Ahmed Abouelfarag and Sherine Nagy Saleh
ISPRS Int. J. Geo-Inf. 2023, 12(6), 245; https://doi.org/10.3390/ijgi12060245 - 17 Jun 2023
Cited by 3 | Viewed by 1854
Abstract
Rapid damage identification and classification in disastrous situations and natural disasters are crucial for efficiently directing aid and resources. With the development of deep learning techniques and the availability of imagery content on social media platforms, extensive research has focused on damage assessment. [...] Read more.
Rapid damage identification and classification in disastrous situations and natural disasters are crucial for efficiently directing aid and resources. With the development of deep learning techniques and the availability of imagery content on social media platforms, extensive research has focused on damage assessment. Through the use of geospatial data related to such incidents, the visual characteristics of these images can quickly determine the safety situation in the region. However, training accurate disaster classification models has proven to be challenging due to the lack of labeled imagery data in this domain. This paper proposes a disaster classification framework, which combines a set of synthesized diverse disaster images generated using generative adversarial networks (GANs) and domain-specific fine-tuning of a deep convolutional neural network (CNN)-based model. The proposed model utilizes bootstrap aggregating (bagging) to further stabilize the target predictions. Since past work in this domain mainly suffers from limited data resources, a sample dataset that highlights the issue of imbalanced classification of multiple natural disasters was constructed and augmented. Qualitative and quantitative experiments show the validity of the data augmentation method employed in producing a balanced dataset. Further experiments with various evaluation metrics verified the proposed framework’s accuracy and generalization ability across different classes for the task of disaster classification in comparison to other state-of-the-art techniques. Furthermore, the framework outperforms the other models by an average validation accuracy of 11%. These results provide a deep learning solution for real-time disaster monitoring systems to mitigate the loss of lives and properties. Full article
Show Figures

Figure 1

22 pages, 8477 KiB  
Article
Inconsistency Detection in Cross-Layer Tile Maps with Super-Pixel Segmentation
by Junbo Yu, Tinghua Ai, Haijiang Xu, Lingrui Yan and Yilang Shen
ISPRS Int. J. Geo-Inf. 2023, 12(6), 244; https://doi.org/10.3390/ijgi12060244 - 17 Jun 2023
Viewed by 1094
Abstract
The consistency of geospatial data is of great significance for the application and updating of geographic information in web maps. Due to the multiple data sources and different temporal versions, the tile web maps usually meet the inconsistency question across different layers. This [...] Read more.
The consistency of geospatial data is of great significance for the application and updating of geographic information in web maps. Due to the multiple data sources and different temporal versions, the tile web maps usually meet the inconsistency question across different layers. This study tries to develop a method to detect this kind of inconsistency utilizing a raster-based scaling approach. Compared with vector-based handling, this method can be directly available for multi-level tile images in a pixel representation form. The proposed cross-layer raster tile map rendering method (CRTMRM) consists of four primary aspects: geographic object separation, consistency rendering rules, data scaling and derivation with super-pixel segmentation, and inconsistency detection. The scale transformation strategy with the super-pixel attempts to obtain a simplified representation. Taking the scale lifespan variation and geometric consistency rules into account, the inconsistency detection of tile maps is conducted between temporal versions, multi-sources, and different scales through actual and derived data overlay analysis. The experiment focuses on features of cross-layer water or vegetation areas with Level 9 to Level 14 in Baidu Maps, Amap, and Google Maps. This method is able to serve as a basis for massive unstructured web map data inconsistency detection and support intelligent web map rendering. Full article
Show Figures

Figure 1

19 pages, 9669 KiB  
Article
Analysis of Tourist Market Structure and Its Driving Factors in Small Cities before and after COVID-19
by Lili Wu, Yi Liu, Kuo Liu, Yongji Wang and Zhihui Tian
ISPRS Int. J. Geo-Inf. 2023, 12(6), 243; https://doi.org/10.3390/ijgi12060243 - 17 Jun 2023
Viewed by 1405
Abstract
Based on the digital footprint data, exploring the differences in tourist market structure and driving factors before and after COVID-19 is important for identifying tourist market demand and optimizing tourism product supply in the post-pandemic era. Most of the existing studies have explored [...] Read more.
Based on the digital footprint data, exploring the differences in tourist market structure and driving factors before and after COVID-19 is important for identifying tourist market demand and optimizing tourism product supply in the post-pandemic era. Most of the existing studies have explored the impact of the pandemic on the tourist market in well-known or large cities and have provided suggestions for tourism recovery. However, these suggestions are not entirely applicable to smaller cities. Small cities have a single level of tourism product, high homogeneity of tourism resources, small tourist market scale, and high volatility of the tourism industry. Therefore, it is necessary to study the differences in the tourist market structure of small cities and its driving factors before and after the pandemic and to propose targeted measures for the tourism recovery in the post-pandemic period. This paper, taking small cities as the study area and using online travel diaries as the data source, analyzed the differences in the spatial and temporal structures of tourist markets and their driving factors in Dengfeng and Kaifeng, China, before and after the pandemic. Then, countermeasures for tourism industry recovery in the post-pandemic era were proposed. The results were as follows: the difference in the tourism off-peak season increased after the pandemic, and the concentration of tourist market spatial distribution in Dengfeng showed a decreasing trend while that in Kaifeng showed an increasing trend. In addition to region traffic, the driving effects of leisure time, climate comfort and residents’ income level weakened after the outbreak. Dengfeng and Kaifeng can enhance the tourist market tendency and attractiveness by creating special indoor tourism projects, strengthening tourism product promotion and marketing and enhancing the facilities related to self-driving tours. Full article
(This article belongs to the Special Issue Urban Geospatial Analytics Based on Crowdsourced Data)
Show Figures

Figure 1

19 pages, 4871 KiB  
Article
Gauging Heat Vulnerability in Southeast Florida: A Multimodal Approach Integrating Physical Exposure, Sensitivity, and Adaptive Capacity
by Kevin Cresswell, Diana Mitsova, Weibo Liu, Maria Fadiman and Tobin Hindle
ISPRS Int. J. Geo-Inf. 2023, 12(6), 242; https://doi.org/10.3390/ijgi12060242 - 17 Jun 2023
Cited by 2 | Viewed by 1293
Abstract
Urbanization and warming climate suggest that health impacts from extreme heat will increase in cities, thus locating vulnerable populations is pivotal. However, heat vulnerability indices (HVI) overwhelmingly interpret one model that may be inaccurate or methodologically flawed without considering how results compare with [...] Read more.
Urbanization and warming climate suggest that health impacts from extreme heat will increase in cities, thus locating vulnerable populations is pivotal. However, heat vulnerability indices (HVI) overwhelmingly interpret one model that may be inaccurate or methodologically flawed without considering how results compare with other HVI. Accordingly, this analysis applied a multimodal approach incorporating underrepresented health and adaptability measures to analyze heat vulnerability more comprehensively and better identify vulnerable populations. The Southeast Florida HVI (SFHVI) blends twenty-four physical exposure, sensitivity, and adaptive capacity indicators using uncommon statistical weights removing overlap, then SFHVI scores were compared statistically and qualitatively with ten models utilizing alternative methods. Urban areas with degraded physical settings, socioeconomic conditions, health, and household resources were particularly vulnerable. Rural and agricultural areas were also vulnerable reflecting socioeconomic conditions, health, and community resources. Three alternative models produced vulnerability scores not statistically different than SFHVI. The other seven differed significantly despite geospatial consistency regarding the most at-risk areas. Since inaccurate HVI can mislead decisionmakers inhibiting mitigation, future studies should increasingly adopt multimodal approaches that enhance analysis comprehensiveness, illuminate methodological strengths and flaws, as well as reinforce conviction about susceptible populations. Full article
Show Figures

Figure 1

22 pages, 3043 KiB  
Article
PMGCN: Progressive Multi-Graph Convolutional Network for Traffic Forecasting
by Zhenxin Li, Yong Han, Zhenyu Xu, Zhihao Zhang, Zhixian Sun and Ge Chen
ISPRS Int. J. Geo-Inf. 2023, 12(6), 241; https://doi.org/10.3390/ijgi12060241 - 16 Jun 2023
Cited by 3 | Viewed by 1558
Abstract
Traffic forecasting has always been an important part of intelligent transportation systems. At present, spatiotemporal graph neural networks are widely used to capture spatiotemporal dependencies. However, most spatiotemporal graph neural networks use a single predefined matrix or a single self-generated matrix. It is [...] Read more.
Traffic forecasting has always been an important part of intelligent transportation systems. At present, spatiotemporal graph neural networks are widely used to capture spatiotemporal dependencies. However, most spatiotemporal graph neural networks use a single predefined matrix or a single self-generated matrix. It is difficult to obtain deeper spatial information by only relying on a single adjacency matrix. In this paper, we present a progressive multi-graph convolutional network (PMGCN), which includes spatiotemporal attention, multi-graph convolution, and multi-scale convolution modules. Specifically, we use a new spatiotemporal attention multi-graph convolution that can extract extensive and comprehensive dynamic spatial dependence between nodes, in which multiple graph convolutions adopt progressive connections and spatiotemporal attention dynamically adjusts each item of the Chebyshev polynomial in graph convolutions. In addition, multi-scale time convolution was added to obtain an extensive and comprehensive dynamic time dependence from multiple receptive field features. We used real datasets to predict traffic speed and traffic flow, and the results were compared with a variety of typical prediction models. PMGCN has the smallest Mean Absolute Error (MAE), Root Mean Squared Error (RMSE), and Mean Absolute Percentage Error (MAPE) results under different horizons (H = 15 min, 30 min, 60 min), which shows the superiority of the proposed model. Full article
Show Figures

Figure 1

21 pages, 13937 KiB  
Article
Applicability Analysis and Ensemble Application of BERT with TF-IDF, TextRank, MMR, and LDA for Topic Classification Based on Flood-Related VGI
by Wenying Du, Chang Ge, Shuang Yao, Nengcheng Chen and Lei Xu
ISPRS Int. J. Geo-Inf. 2023, 12(6), 240; https://doi.org/10.3390/ijgi12060240 - 09 Jun 2023
Cited by 3 | Viewed by 1689
Abstract
Volunteered geographic information (VGI) plays an increasingly crucial role in flash floods. However, topic classification and spatiotemporal analysis are complicated by the various expressions and lengths of social media textual data. This paper conducted applicability analysis on bidirectional encoder representation from transformers (BERT) [...] Read more.
Volunteered geographic information (VGI) plays an increasingly crucial role in flash floods. However, topic classification and spatiotemporal analysis are complicated by the various expressions and lengths of social media textual data. This paper conducted applicability analysis on bidirectional encoder representation from transformers (BERT) and four traditional methods, TextRank, term frequency–inverse document frequency (TF-IDF), maximal marginal relevance (MMR), and linear discriminant analysis (LDA), and the results show that for user type, BERT performs best on the Government Affairs Microblog, whereas LDA-BERT performs best on the We Media Microblog. As for text length, TF-IDF-BERT works better for texts with a length of <70 and length >140 words, and LDA-BERT performs best with a text length of 70–140 words. For the spatiotemporal evolution pattern, the study suggests that in a Henan rainstorm, the textual topics follow the general pattern of “situation-tips-rescue”. Moreover, this paper detected the hotspot of “Metro Line 5” related to a Henan rainstorm and discovered that the topical focus of the Henan rainstorm spatially shifts from Zhengzhou, first to Xinxiang, and then to Hebi, showing a remarkable tendency from south to north, which was the same as the report issued by the authorities. We integrated multi-methods to improve the overall topic classification accuracy of Sina microblogs, facilitating the spatiotemporal analysis of flooding. Full article
(This article belongs to the Special Issue Urban Geospatial Analytics Based on Crowdsourced Data)
Show Figures

Figure 1

19 pages, 15019 KiB  
Article
Synergy of Road Network Planning Indices on Central Retail District Pedestrian Evacuation Efficiency
by Gen Yang, Tiejun Zhou, Mingxi Peng, Zhigang Wang and Dachuan Wang
ISPRS Int. J. Geo-Inf. 2023, 12(6), 239; https://doi.org/10.3390/ijgi12060239 - 09 Jun 2023
Viewed by 1112
Abstract
Pedestrian evacuation is an important measure to ensure disaster safety in central retail districts, the efficiency of which is affected by the synergy of road network planning indices. This paper established the typical forms of central retail district (CRD) road networks in terms [...] Read more.
Pedestrian evacuation is an important measure to ensure disaster safety in central retail districts, the efficiency of which is affected by the synergy of road network planning indices. This paper established the typical forms of central retail district (CRD) road networks in terms of block form, network structure and road grade, taking China as an example. The experiment was designed using the orthogonal design of experiment (ODOE) method and quantified the evacuation time under different road network planning indices levels through the Anylogic simulation platform. Using range and variance analysis methods, the synergy of network density, network connectivity, road type and road width on pedestrian evacuation efficiency were studied from the perspectives of significance, importance and optimal level. The results showed that the type of CRD will affect the importance of network planning indices, and that the network connectivity is insignificant (P 0.477/0.581) in synergy; networks with wide pedestrian primary roads (30.1~40.0 m), medium secondary roads (3.1~5.0 m/side) and high density (11.0~13.0 km/km2) have the highest evacuation efficiency. From the perspective of evacuees, this paper put forward urban design implications on CRD road networks to improve their capacity for disaster prevention and reduction. Full article
Show Figures

Figure 1

27 pages, 12002 KiB  
Article
Archaeological Predictive Modeling Using Machine Learning and Statistical Methods for Japan and China
by Yuan Wang, Xiaodan Shi and Takashi Oguchi
ISPRS Int. J. Geo-Inf. 2023, 12(6), 238; https://doi.org/10.3390/ijgi12060238 - 07 Jun 2023
Cited by 1 | Viewed by 2111
Abstract
Archaeological predictive modeling (APM) is an essential method for quantitatively assessing the probability of archaeological sites present in a region. It is a necessary tool for archaeological research and cultural heritage management. In particular, the predictive modeling process could help us understand the [...] Read more.
Archaeological predictive modeling (APM) is an essential method for quantitatively assessing the probability of archaeological sites present in a region. It is a necessary tool for archaeological research and cultural heritage management. In particular, the predictive modeling process could help us understand the relationship between past human civilizations and the natural environment; moreover, a better understanding of the mechanisms of the human–land relationship can provide new ideas for sustainable development. This study aims to investigate the impact of topographic and hydrological factors on archaeological sites in the Japanese archipelago and Shaanxi Province, China and proposes a hybrid integration approach for APM. This approach employed a conditional attention mechanism (AM) using deep learning and a frequency ratio (FR) model, in addition to a separate FR model and the widely-used machine learning MaxEnt method. The models’ outcomes were cross-checked using the four-fold cross-validation method, and the models’ performances were compared using the area under the receiver operating characteristic curve (AUC) and Kvamme’s Gain. The results showed that in both study areas, the AM_FR model exhibited the most satisfactory performances. Full article
Show Figures

Figure 1

30 pages, 2429 KiB  
Article
The Use of ICTs to Support Social Participation in the Planning, Design and Maintenance of Public Spaces in Latin America
by Sergio Alvarado Vazquez, Ana Mafalda Madureira, Frank O. Ostermann and Karin Pfeffer
ISPRS Int. J. Geo-Inf. 2023, 12(6), 237; https://doi.org/10.3390/ijgi12060237 - 07 Jun 2023
Cited by 1 | Viewed by 2494
Abstract
Recent research indicates that information and communication technologies (ICTs) can support social participation in the planning, design and maintenance of public spaces (PDMPS), specifically to create comprehensive knowledge among different stakeholders. However, critics point out that the use of ICTs by planners and [...] Read more.
Recent research indicates that information and communication technologies (ICTs) can support social participation in the planning, design and maintenance of public spaces (PDMPS), specifically to create comprehensive knowledge among different stakeholders. However, critics point out that the use of ICTs by planners and decision-makers often ignores the needs of local residents. For this research, we inquired how ICTs can support social participation in PDMPS. Our case study combines a literature review and 21 semi-structured interviews with government officials, non-governmental organisations, academics and architecture/urban planning consultancy companies in Mexico to understand how different stakeholders use ICTs to improve the quality of public spaces. We developed an approach that facilitates the analysis of ICT aspects related to hardware and software supporting social participation in PDMPS. The findings show that Mexico has a base of digital tools requiring technical capacities and spatial literacy at various stages of PDMPS, and ICTs are seen as an opportunity to engage with residents. However, in practice, our interviewees mentioned that ICTs are rarely implemented to support participatory processes due to high costs, a lack of political support and the insufficient technical expertise of technical staff to engage with residents using ICTs. The paper closes with recommendations and suggestions for future research on how ICTs can better support participatory processes in PDMPS. Full article
Show Figures

Figure 1

17 pages, 307 KiB  
Article
Assessing the Status of National Spatial Data Infrastructure (NSDI) of Bangladesh
by Md. Mostafizur Rahman and György Szabó
ISPRS Int. J. Geo-Inf. 2023, 12(6), 236; https://doi.org/10.3390/ijgi12060236 - 07 Jun 2023
Cited by 2 | Viewed by 2051
Abstract
National spatial data infrastructure (NSDI) is an essential framework for managing and sharing geospatial data across different sectors and organizations. In Bangladesh, the development of NSDI is still in its early stages, and there are several challenges that need to be addressed to [...] Read more.
National spatial data infrastructure (NSDI) is an essential framework for managing and sharing geospatial data across different sectors and organizations. In Bangladesh, the development of NSDI is still in its early stages, and there are several challenges that need to be addressed to ensure its effective implementation. This paper provides a comprehensive assessment of the status of NSDI implementation in Bangladesh using Eelderink’s fourteen key variables. The paper examines the current state of NSDI implementation in Bangladesh, identifies strengths and weaknesses, and suggests recommendations for improvement. The findings suggest that while some progress has been made in establishing NSDI in Bangladesh, there are still significant challenges, such as limited funding; weak coordination among stakeholders; and a lack of skilled manpower, awareness, and capacity among users. To address these challenges, in this paper, we recommend several measures to improve the NSDI framework in Bangladesh. These include increasing funding support for NSDI development and maintenance, improving coordination among stakeholders through the establishment of a national coordinating body, enhancing awareness and capacity-building programs for NSDI users, and promoting the use of open data standards to improve data quality and interoperability. It is hoped that these recommendations will be taken into consideration by policymakers and other stakeholders to further enhance the development of NSDI in Bangladesh. Full article
19 pages, 6266 KiB  
Article
Reducing Redundancy in Maps without Lowering Accuracy: A Geometric Feature Fusion Approach for Simultaneous Localization and Mapping
by Feiya Li, Chunyun Fu, Dongye Sun, Hormoz Marzbani and Minghui Hu
ISPRS Int. J. Geo-Inf. 2023, 12(6), 235; https://doi.org/10.3390/ijgi12060235 - 07 Jun 2023
Viewed by 1153
Abstract
Geometric map features, such as line segments and planes, are receiving increasing attention due to their advantages in simultaneous localization and mapping applications. However, large structures in different environments are very likely to appear repeatedly in several consecutive time steps, resulting in redundant [...] Read more.
Geometric map features, such as line segments and planes, are receiving increasing attention due to their advantages in simultaneous localization and mapping applications. However, large structures in different environments are very likely to appear repeatedly in several consecutive time steps, resulting in redundant features in the final map. These redundant features should be properly fused, in order to avoid ambiguity and reduce the computation load. In this paper, three criteria are proposed to evaluate the closeness between any two features extracted at two different times, in terms of their included angle, feature circle overlapping and relative distance. These criteria determine whether any two features should be fused in the mapping process. Using the three criteria, all features in the global map are categorized into different clusters with distinct labels, and a fused feature is then generated for each cluster by means of least squares fitting. Two competing methods are employed for comparative verification. The comparison results indicate that using the commonly used KITTI dataset and the commercial software PreScan, the proposed feature fusion method outperforms the competing methods in terms of conciseness and accuracy. Full article
Show Figures

Figure 1

15 pages, 13149 KiB  
Article
To What Extent Can Satellite Cities and New Towns Serve as a Steering Instrument for Polycentric Urban Expansion during Massive Population Growth?—A Comparative Analysis of Tokyo and Shanghai
by Runzhu Gu, Zhiqiu Xie, Chika Takatori, Hendrik Herold and Xiaoping Xie
ISPRS Int. J. Geo-Inf. 2023, 12(6), 234; https://doi.org/10.3390/ijgi12060234 - 06 Jun 2023
Cited by 1 | Viewed by 1912
Abstract
In response to the call of the New Urban Agenda—Habitat III for a reinvigoration of long-term and integrated planning towards sustainable urban development, this paper presents an empirical comparative study of planning practices based on the “satellite city” and “new town” concepts in [...] Read more.
In response to the call of the New Urban Agenda—Habitat III for a reinvigoration of long-term and integrated planning towards sustainable urban development, this paper presents an empirical comparative study of planning practices based on the “satellite city” and “new town” concepts in Tokyo and Shanghai to examine from a long-term perspective how well they have guided polycentric urban development at a time of massive population growth. We aim to deliver evidence-based contributions to boost the knowledge transfer between the Global North and the Global South. The paper adopts a multi-dimensional framework for the comparative analysis, including a review of long-term urban development policies and an inspection of the population distribution and extent of built-up areas using time-specific categorizations to map the spatiotemporal changes based on GHSL data. The comparative analysis shows that urban plans in Tokyo and Shanghai based on satellite cities and new towns as steering instruments for polycentric urban growth management have not lived up to the original aspirations. In fact, the intended steering of population distribution has essentially failed, despite the practical steps undertaken. Full article
Show Figures

Figure 1

20 pages, 4115 KiB  
Article
Spatiotemporal Patterns Evolution of Residential Areas and Transportation Facilities Based on Multi-Source Data: A Case Study of Xi’an, China
by Xinyi Lai and Chao Gao
ISPRS Int. J. Geo-Inf. 2023, 12(6), 233; https://doi.org/10.3390/ijgi12060233 - 06 Jun 2023
Cited by 2 | Viewed by 1115
Abstract
The spatiotemporal patterns of residential and supporting service facilities are critical to effective urban planning. However, with growing urban sprawl and congestion, the spatial distribution patterns and evolutionary characteristics of these areas show significant uncertainty. This research was conducted for six phases from [...] Read more.
The spatiotemporal patterns of residential and supporting service facilities are critical to effective urban planning. However, with growing urban sprawl and congestion, the spatial distribution patterns and evolutionary characteristics of these areas show significant uncertainty. This research was conducted for six phases from 2012 to 2022, incorporating datasets of point of interest (POI) data for residential areas and transportation facilities (RATFs) and OpenStreetMap (OSM) data. Using exploratory spatial data analysis (ESDA) and standard deviation ellipse, we investigated the spatiotemporal patterns and directional characteristics of RATFs in Xi’an, as well as their evolution and underlying causes. The analysis demonstrated that: (1) The spatial distribution of RATFs in Xi’an exhibits non-uniform and gradually evolving patterns, with significant spatial agglomeration characteristics over the past decade. Residential areas (RAs) exhibit a spatial autocorrelation that is high in the middle and low in the surrounding areas, while transportation facilities (TFs) exhibit spatial patterns that are high in the southern and low in the northern areas. (2) Overall, the number of RATFs has continued to increase, and they exhibit significant spatial autocorrelation. Specifically, the trend of RAs concentrating in the central city has become increasingly prominent, while TFs have expanded from the center to the north. (3) Furthermore, from the perspective of supply–demand matching, this study proposes targeted adjustment strategies for the distribution of RATFs. It provides significant references for the optimization of service facilities and provides new ideas and practical experience for urban spatial analysis methods based on multi-source data. Full article
(This article belongs to the Special Issue Urban Geospatial Analytics Based on Crowdsourced Data)
Show Figures

Figure 1

20 pages, 8731 KiB  
Article
An Earth Observation Framework in Service of the Sendai Framework for Disaster Risk Reduction 2015–2030
by Boyi Li, Adu Gong, Longfei Liu, Jing Li, Jinglin Li, Lingling Li, Xiang Pan and Zikun Chen
ISPRS Int. J. Geo-Inf. 2023, 12(6), 232; https://doi.org/10.3390/ijgi12060232 - 06 Jun 2023
Cited by 2 | Viewed by 2064
Abstract
The Sendai Framework for Disaster Risk Reduction 2015–2030 (SFDRR) proposed seven targets comprising 38 quantified indicators and various sub-indicators to monitor the progress of disaster risk and loss reduction efforts. However, challenges persist regarding the availability of disaster-related data and the required resources [...] Read more.
The Sendai Framework for Disaster Risk Reduction 2015–2030 (SFDRR) proposed seven targets comprising 38 quantified indicators and various sub-indicators to monitor the progress of disaster risk and loss reduction efforts. However, challenges persist regarding the availability of disaster-related data and the required resources to address data gaps. A promising way to address this issue is the utilization of Earth observation (EO). In this study, we proposed an EO-based disaster evaluation framework in service of the SFDRR and applied it to the context of tropical cyclones (TCs). We first investigated the potential of EO in supporting the SFDRR indicators, and we then decoupled those EO-supported indicators into essential variables (EVs) based on regional disaster system theory (RDST) and the TC disaster chain. We established a mapping relationship between the measurement requirements of EVs and the capabilities of EO on Google Earth Engine (GEE). An end-to-end framework that utilizes EO to evaluate the SFDRR indicators was finally established. The results showed that the SFDRR contains 75 indicators, among which 18.7% and 20.0% of those indicators can be directly and indirectly supported by EO, respectively, indicating the significant role of EO for the SFDRR. We provided four EV classes with nine EVs derived from the EO-supported indicators in the proposed framework, along with available EO data and methods. Our proposed framework demonstrates that EO has an important contribution to supporting the implementation of the SFDRR, and that it provides effective evaluation solutions. Full article
(This article belongs to the Topic Advances in Earth Observation and Geosciences)
Show Figures

Figure 1

25 pages, 7215 KiB  
Article
Automatic Generation of 3D Indoor Navigation Networks from Building Information Modeling Data Using Image Thinning
by Weisong Zhang, Yukang Wang and Xiaoping Zhou
ISPRS Int. J. Geo-Inf. 2023, 12(6), 231; https://doi.org/10.3390/ijgi12060231 - 05 Jun 2023
Viewed by 1624
Abstract
Navigation networks are a common form of indoor map that provide the basis for a wide range of indoor location-based services, intelligent tasks for indoor robots, and three-dimensional (3D) geographic information systems. The majority of current indoor navigation networks are manually modeled, resulting [...] Read more.
Navigation networks are a common form of indoor map that provide the basis for a wide range of indoor location-based services, intelligent tasks for indoor robots, and three-dimensional (3D) geographic information systems. The majority of current indoor navigation networks are manually modeled, resulting in a laborious and fallible process. Building Information Modeling (BIM) captures design information, allowing for the automated generation of indoor maps. Most existing BIM-based navigation systems for floor-level wayfinding rely on well-defined spatial semantics, and do not adapt well to buildings with irregular 3D shapes, which can make cross-floor path generation difficult. This research introduces an innovative approach to generating 3D indoor navigation networks automatically from BIM data using image thinning, which is referred to as GINIT. Firstly, GINIT extracts grid-based maps for floors from BIM data using only two types of semantics, i.e., slabs and doors. Secondly, GINIT captures cross-floor paths from building components by projecting 3D forms onto a 2D image, thinning the 2D image to capture the 2D projection path, and crossing over the 2D routes with 3D routes to restore the 3D path. Finally, to demonstrate the effectiveness of GINIT, experiments were conducted on three real-world multi-floor buildings, evaluating its performance across eight types of cross-layer architectural component. GINIT overcomes the dependency of space definitions in current BIM-based navigation network generation schemes by introducing image thinning. Due to the adaptability of navigation image thinning to any binary image, GINIT is capable of generating navigation networks from building components with diverse 3D shapes. Moreover, the current studies on indoor navigation network extraction mainly use geometry theory, while this study is the first to generate 3D indoor navigation networks automatically using image thinning theory. The results of this study will offer a unique perspective and foster the exploration of imaging theory applications of BIM. Full article
Show Figures

Figure 1

17 pages, 5541 KiB  
Article
Cartographic Design and Processing of Originally Printed Historical Maps for Their Presentation on the Web
by Petra Justová and Jiří Cajthaml
ISPRS Int. J. Geo-Inf. 2023, 12(6), 230; https://doi.org/10.3390/ijgi12060230 - 02 Jun 2023
Cited by 2 | Viewed by 1274
Abstract
On the example of our project on the creation of the historical web atlas on Czech history, we introduce the process of adapting originally printed historical maps for their presentation in the web environment, which overcomes the shortcomings of standard approaches in similar [...] Read more.
On the example of our project on the creation of the historical web atlas on Czech history, we introduce the process of adapting originally printed historical maps for their presentation in the web environment, which overcomes the shortcomings of standard approaches in similar projects based on printed predecessors published only as zoomable scanned analogues or default GIS maps. To simplify the originally complex map and to increase the information potential of the maps, we propose seven different types of additional map functionality according to the specific characteristics of the original map content. In addition, we present a set of rules, principles, recommendations, and methods for the cartographic design and processing of originally printed historical maps that should be considered when they are prepared for presentation on the web, including the description of the specific visualisation processes for the proposed types of map functionality. The proposed complex methodology can be applied to similar projects focused on the conversion of originally printed maps to the web and may contribute to improving the quality of the visualisation and presentation of historical maps on the web in general. Full article
(This article belongs to the Special Issue Cartography and Geomedia)
Show Figures

Figure 1

23 pages, 3147 KiB  
Article
Research on Spatial Patterns and Mechanisms of Live Streaming Commerce in China Based on Geolocation Data
by Yiwen Zhu, Xumin Zhang, Simin Yan and Lin Zou
ISPRS Int. J. Geo-Inf. 2023, 12(6), 229; https://doi.org/10.3390/ijgi12060229 - 02 Jun 2023
Cited by 2 | Viewed by 2196
Abstract
Live streaming commerce (LSC) effectively combines the traditional real economy and e-commerce. Based on more than half a million unique GIS data values on LSC activities sourced via Taobao (Alibaba), we traced the spatial distribution of different players along the supply chain and [...] Read more.
Live streaming commerce (LSC) effectively combines the traditional real economy and e-commerce. Based on more than half a million unique GIS data values on LSC activities sourced via Taobao (Alibaba), we traced the spatial distribution of different players along the supply chain and further highlighted the intermediary role of streamers in developing the inter-regional industry. This study guides industrial planning in a diversified regional context, especially in economically peripheral regions. Our results show the following outcomes: (1) in contrast to dispersed suppliers, streamers and consumers are highly clustered. This trend proves that streamers are rooted in a specific urban context while playing the role of an intermediary in inter-regional supply chains, effectively extending geographic interactivity between suppliers and (potential) customers. (2) LSC primarily promotes regional light industry, especially in economically peripheral and rural areas, and provides opportunities for rapid development in cities with skilled handicraft providers. (3) China’s LSC streams have a pyramid structure, and the top group is highly clustered in metropolitan regions, such as the Yangtze River Delta (YRD) and the Pearl River Delta (PRD). This clustering makes it easier for streamers to work with large, well-known brands. The bottom group is mainly in charge of expanding the supply chain within the region and relies more on the local industrial base. It is diversified due to the different types of businesses or products. Ultimately, we draw attention to adaptive spatial planning and resource allocation in the context of the economic and geographic reforms brought by this growing industry, and discuss the policy implications based on the relationships between the supply of and demand for live streamers from a broader regional perspective. Full article
Show Figures

Figure 1

16 pages, 4178 KiB  
Article
The Spatial Effect of Accessibility to Public Service Facilities on Housing Prices: Highlighting the Housing Equity
by Peiheng Yu, Esther H. K. Yung, Edwin H. W. Chan, Shujin Zhang, Siqiang Wang and Yiyun Chen
ISPRS Int. J. Geo-Inf. 2023, 12(6), 228; https://doi.org/10.3390/ijgi12060228 - 01 Jun 2023
Cited by 2 | Viewed by 1761
Abstract
Understanding how public service accessibility is related to housing prices is crucial to housing equity, yet the heterogeneous capitalisation effect remains unknown. This study aims to investigate the spatial effect of public service accessibility on housing prices in rapidly urbanising regions. Here, we [...] Read more.
Understanding how public service accessibility is related to housing prices is crucial to housing equity, yet the heterogeneous capitalisation effect remains unknown. This study aims to investigate the spatial effect of public service accessibility on housing prices in rapidly urbanising regions. Here, we propose a novel methodological framework that integrates the hedonic price model, geographical detector model and the spatial association detector model to understand housing equity issues. The rapidly rising housing prices, vastly transformed urban planning and heterogeneous land use patterns make the urban centre of Wuhan a typical case study. High-value units of public service accessibility are concentrated in built-up areas, while low-value units are located at the urban fringe. The results indicate that larger public services have more significant clustering effects than smaller ones. Recreational, medical, educational and financial facilities all have capitalisation effects on housing prices. Both the geographical detector model and the spatial association detector model could identify the drivers of housing prices, but the explanatory power of the latter is greater and could enhance the validity and reliability of the findings. We further find that the explanatory power of the driving factors on housing prices obtained from the spatial association detector model is greater than that of the geographical detector model. Based on the spatial association detector model, the main drivers of public service facilities are accessibility to restaurants and bars and accessibility to ATMs. In addition, there are bivariate or nonlinear enhancement effects between each pair of driving factors. This approach provides significant insights for urban environmental development planning and local real estate planning. Full article
Show Figures

Figure 1

17 pages, 3708 KiB  
Article
A Machine Learning Approach for Classifying Road Accident Hotspots
by Brunna de Sousa Pereira Amorim, Anderson Almeida Firmino, Cláudio de Souza Baptista, Geraldo Braz Júnior, Anselmo Cardoso de Paiva and Francisco Edeverton de Almeida Júnior
ISPRS Int. J. Geo-Inf. 2023, 12(6), 227; https://doi.org/10.3390/ijgi12060227 - 31 May 2023
Cited by 3 | Viewed by 2075
Abstract
Road accidents are a worldwide problem, affecting millions of people annually. One way to reduce such accidents is to predict risk areas and alert drivers. Advanced research has been carried out on identifying accident-influencing factors and potential highway risk areas to mitigate the [...] Read more.
Road accidents are a worldwide problem, affecting millions of people annually. One way to reduce such accidents is to predict risk areas and alert drivers. Advanced research has been carried out on identifying accident-influencing factors and potential highway risk areas to mitigate the number of road accidents. Machine learning techniques have been used to build prediction models using a supervised classification based on a labeled dataset. In this work, we experimented with many machine learning algorithms to discover the best classifier for the Brazilian federal road hotspots associated with severe or nonsevere accident risk using several features. We tested with SVM, random forest, and a multi-layer perceptron neural network. The dataset contains a ten-year road accident report by the Brazilian Federal Highway Police. The feature set includes spatial footprint, weekday and time when the accident happened, road type, route, orientation, weather conditions, and accident type. The results were promising, and the neural network model provided the best results, achieving an accuracy of 83%, a precision of 84%, a recall of 83%, and an F1-score of 82%. Full article
Show Figures

Figure 1

25 pages, 6840 KiB  
Article
Controlling Traffic Congestion in Urbanised City: A Framework Using Agent-Based Modelling and Simulation Approach
by Raihanah Adawiyah Shaharuddin and Md Yushalify Misro
ISPRS Int. J. Geo-Inf. 2023, 12(6), 226; https://doi.org/10.3390/ijgi12060226 - 31 May 2023
Cited by 1 | Viewed by 2822
Abstract
Urbanised city transportation simulation needs a wide range of factors to reflect the influence of certain real-life events accurately. The vehicle composition and the timing of the traffic light signal scheduling play an important role in controlling the traffic flow and facilitate road [...] Read more.
Urbanised city transportation simulation needs a wide range of factors to reflect the influence of certain real-life events accurately. The vehicle composition and the timing of the traffic light signal scheduling play an important role in controlling the traffic flow and facilitate road users, particularly in densely populated urban cities. Since road capacity in urban cities changes throughout the day, an optimal traffic light signal duration might be different. Hence, in this paper, the effect of vehicle composition and traffic light phases on traffic flow during peak and off-peak hours in Georgetown, Penang, one of the highly populated cities in Malaysia, is investigated. Through Agent-Based Modelling (ABM), this complex system is simulated by integrating the driver’s behaviour into the model using the GIS and Agent-Based Modelling Architecture (GAMA) simulation platform. The result of predicted traffic flow varies significantly depending on the vehicle composition while the duration of the traffic signal timing has little impact on traffic flow during peak hours. However, during off-peak hour, it is suggested that 20 s duration of green light provides the highest flow compared to 30 s and 40 s duration of green light. This concludes that the planning for traffic light phasing should consider multiple factors since the vehicle composition and traffic light timing for an effective traffic flow varies according to the volume of road users. Full article
Show Figures

Figure 1

21 pages, 9764 KiB  
Article
Exploring Crowd Travel Demands Based on the Characteristics of Spatiotemporal Interaction between Urban Functional Zones
by Ju Peng, Huimin Liu, Jianbo Tang, Cheng Peng, Xuexi Yang, Min Deng and Yiyuan Xu
ISPRS Int. J. Geo-Inf. 2023, 12(6), 225; https://doi.org/10.3390/ijgi12060225 - 30 May 2023
Cited by 2 | Viewed by 1356
Abstract
As a hot research topic in urban geography, spatiotemporal interaction analysis has been used to detect the hotspot mobility patterns of crowds and urban structures based on the origin-destination (OD) flow data, which provide useful information for urban planning and traffic management applications. [...] Read more.
As a hot research topic in urban geography, spatiotemporal interaction analysis has been used to detect the hotspot mobility patterns of crowds and urban structures based on the origin-destination (OD) flow data, which provide useful information for urban planning and traffic management applications. However, existing methods mainly focus on the detection of explicit spatial interaction patterns (such as spatial flow clusters) in OD flow data, with less attention to the discovery of underlying crowd travel demands. Therefore, this paper proposes a framework to discover the crowd travel demands by associating the dynamic spatiotemporal interaction patterns and the contextual semantic features of the geographical environment. With urban functional zones (UFZs) as the basic units of human mobility in urban spaces, this paper gives a case study in Wuhan, China, to detect and interpret the human mobility patterns based on the characteristics of spatiotemporal interaction between UFZs. Firstly, we build the spatiotemporal interaction matrix based on the OD flows of different UFZs and analyze the characteristics of the interaction matrix. Then, hotspot poles, defined as the local areas where people gather significantly, are extracted using the Gi-statistic-based spatial hotspot detection algorithm. Next, we develop a frequent interaction pattern mining method to detect the frequent interaction patterns of the hotspot poles. Finally, based on the detected frequent interaction patterns, we discover the travel demands of crowds with semantic features of corresponding urban functional zones. The characteristics of crowd travel distance and travel time are further discussed. Experiments with floating car data, road networks, and POIs in Wuhan were conducted, and results show that the underlying travel demands can be better discovered and interpreted by the proposed framework and methods in this paper. This study helps to understand the characteristics of human movement and can provide support for applications such as urban planning and facility optimization. Full article
Show Figures

Figure 1

18 pages, 12790 KiB  
Article
Building Façade Color Distribution, Color Harmony and Diversity in Relation to Street Functions: Using Street View Images and Deep Learning
by Yujia Zhai, Ruoyu Gong, Junzi Huo and Binbin Fan
ISPRS Int. J. Geo-Inf. 2023, 12(6), 224; https://doi.org/10.3390/ijgi12060224 - 30 May 2023
Cited by 4 | Viewed by 2021
Abstract
Building façade colors play an important role in influencing urban imageability, attraction and citizens’ experience. However, the relations between street functions and the building façade color distribution, color harmony and color diversity have not been thoroughly examined. We obtained the dominant colors of [...] Read more.
Building façade colors play an important role in influencing urban imageability, attraction and citizens’ experience. However, the relations between street functions and the building façade color distribution, color harmony and color diversity have not been thoroughly examined. We obtained the dominant colors of building façades in Changning District, Shanghai, utilizing Baidu street view images, image semantic segmentation technology and the K-means algorithm. The variations in building façades’ dominant colors, color harmony and diversity across different types of functional streets were examined through logistic regression and ANOVA analyses. The results indicate that, compared to industrial streets, red hues are more common in science education streets, residential streets and mixed functional streets. Business streets are more likely to have hues of green, red and red–purple. Residential streets’ saturation is overall higher than that of industrial streets. In business streets, the medium–high value occurs less frequently than other streets. Moreover, we found that the street building façade colors in industrial streets were more harmonious and less diversified than that in other functional streets. This study has implications for urban color planning practices. Color harmony and color diversity should be well considered in future planning. The role of street functions should also be addressed in building façade color planning, to improve existing planning frameworks as well as related strategies. Full article
Show Figures

Figure 1

15 pages, 9538 KiB  
Article
The Spatial Association between Residents’ Leisure Activities and Tourism Activities Using Colocation Pattern Measures: A Case Study of Nanjing, China
by Jiemin Zheng, Mingxing Hu, Junheng Qi, Bing Han, Hui Wang and Feifei Xu
ISPRS Int. J. Geo-Inf. 2023, 12(6), 223; https://doi.org/10.3390/ijgi12060223 - 29 May 2023
Viewed by 1268
Abstract
With the increasing trend of residents and tourists sharing urban spaces, the boundary between leisure spaces and tourism spaces is gradually being blurred. However, few studies have quantified the spatiotemporal correlation patterns of residents’ leisure activities and tourists’ activities. To fill this gap, [...] Read more.
With the increasing trend of residents and tourists sharing urban spaces, the boundary between leisure spaces and tourism spaces is gradually being blurred. However, few studies have quantified the spatiotemporal correlation patterns of residents’ leisure activities and tourists’ activities. To fill this gap, this paper takes Nanjing as an example to study the temporal and spatial correlation between residents’ leisure activities and tourists’ activities based on mobile phone signal data. First, through kernel density analysis, it is found that there is a spatial overlap between residents’ leisure activities and tourists’ activities. Then, the spatial and temporal correlation patterns of residents’ leisure activities and tourists’ activities are analyzed through the colocation quotient. According to our findings, (1) residents’ leisure activities and tourists’ activities are not spatially correlated, indicating that they are relatively independent in space both during the week and on weekends. (2) On weekday afternoons, the spatial correlation between residents’ and tourists’ leisure activities is strongest. On weekends, the night is when residents’ leisure activities and tourists’ activities are most closely related. (3) The correlation area is mainly distributed in areas near famous scenic spots, as well as public spaces such as parks and squares. Based on the above analysis, this paper aims to study the resident-tourist interaction in the spatial context to provide directions for improving the attractiveness of cities, urban transportation, services, and marketing strategies. Full article
Show Figures

Figure 1

Previous Issue
Next Issue
Back to TopTop