Article

A Deep Transfer Learning Toponym Extraction and Geospatial Clustering Framework for Investigating Scenic Spots as Cognitive Regions

1
School of Earth Sciences, Zhejiang University, Hangzhou 310058, China
2
College of Mathematics and Computer Science, Zhejiang A&F University, Hangzhou 311300, China
3
Key Laboratory of Forestry Intelligent Monitoring and Information Technology of Zhejiang Province, Hangzhou 311300, China
4
Key Laboratory of State Forestry and Grassland Administration on Forestry Sensing Technology and Intelligent Equipment, Hangzhou 311300, China
5
College of Education, Zhejiang University of Technology, Hangzhou 310014, China
6
Ocean Academy, Zhejiang University, Zhoushan 316021, China
7
College of Computer Science and Technology, Zhejiang University, Hangzhou 310063, China
8
Financial Big Data Research Institute, Sunyard Technology Co., Ltd., Hangzhou 310053, China
*
Author to whom correspondence should be addressed.
These authors contributed equally to this work.
ISPRS Int. J. Geo-Inf. 2023, 12(5), 196; https://doi.org/10.3390/ijgi12050196
Submission received: 8 March 2023 / Revised: 9 May 2023 / Accepted: 10 May 2023 / Published: 12 May 2023
(This article belongs to the Special Issue Urban Geospatial Analytics Based on Crowdsourced Data)

Abstract

:
In recent years, the Chinese tourism industry has developed rapidly, leading to significant changes in the relationship between people and space patterns in scenic regions. To attract more tourists, the surrounding environment of a scenic region is usually well developed, attracting a large number of human activities, which creates a cognitive range for the scenic region. From the perspective of tourism, tourists’ perceptions of the region in which tourist attractions are located in a city usually differ from the objective region of the scenic spots. Among them, social media serves as an important medium for tourists to share information about scenic spots and for potential tourists to learn scenic spot information, and it interacts to influence people’s perceptions of the destination image. Extracting the names of tourist attractions from social media data and exploring their spatial distribution patterns is the basis for research on the cognitive region of tourist attractions. This study takes Hangzhou, a well-known tourist city in China, as a case study to explore the human cognitive region of its popular scenic spots. First, we propose a Chinese tourist attraction name extraction model based on RoBERTa-BiLSTM-CRF to extract the names of tourist attractions from social media data. Then, we use a multi-distance spatial clustering method called Ripley’s K to filter the extracted tourist attraction names. Finally, we combine road network data and polygons generated using the chi-shape algorithm to construct the vague cognitive regions of each scenic spot. The results show that the classification indicators of our proposed tourist attraction name extraction model are significantly better than those of previous toponym extraction models and algorithms (precision = 0.7371, recall = 0.6926, F1 = 0.7141), and the extracted vague cognitive regions of tourist attractions also generally conform to people’s habitual cognition.

1. Introduction

Toponyms are the basis of people’s understanding of a place, and the names have high cultural, historical and tourism value [1], especially the names of tourist attractions, as a business card for the tourist destination, reflecting the unique charm and characteristics of the place [2]. At the same time, the names of tourist attractions also contribute to the development of the local region [3]. However, due to the complex interactions of various factors, people’s perceptions of the region represented by the name of a tourist attraction are usually different from the objective region. Taking the West Lake Scenic Area as an example, shown in Figure 1, it is one of the most famous scenic spots in China, located in Hangzhou City, Zhejiang Province. It is surrounded by many historical celebrities’ former residences and cultural relics, such as Su Dongpo’s cottage (a well-known literary scholar, calligrapher, politician and philosopher in Ancient China) and Cao Xueqin’s former residence (a well-known Chinese novelist of the Qing Dynasty, whose representative works include Dream of the Red Chamber), which represent valuable heritage aspects within Chinese traditional culture. West Lake is also an important symbol of Ancient Chinese culture, known as the “Oriental Venus”. In summary, West Lake is an outstanding representative of Chinese history, culture and natural scenery, and is a source of value and pride in the Chinese nation. When tourists visit the West Lake Scenic Area, they often take photos and check-in in the regions next to West Lake, such as the Hua Wai Tong Wu Scenic Area (a small scenic area located outside the West Lake scenic area), located on the west side of the West Lake Scenic Area, but with less popularity. Tourists traveling in these types of scenic spots tend to naturally include this part that does not actually belong to West Lake as part of the West Lake Scenic Area, resulting in a difference between the perceived area of the West Lake Scenic Area and its objective area.
This paper aims to obtain people’s vague perceptions of the regions of tourist attractions based on existing data, in order to facilitate comparison and observation with the objective regions of the tourist attractions, providing a reasonable reference for the future regional planning of tourist attractions. Currently, due to the popularity of social media and its uniqueness in terms of information type, quantity and exchange, social media is regarded as a challenging information resource [4]. When people travel, sharing on social media generates a large amount of tourist attraction name data, providing researchers with the opportunity to explore collective patterns in many fields [5]. Compared with data obtained from traditional surveys, tourist attraction name data on social media not only provide the possibility of researching a wide range of topics but also allow for the investigation of research questions with large samples. Compared with survey data, they can be monitored continuously for a long time (and with high temporal resolution) at a lower cost [6]. After analyzing and being inspired by previous research, this paper proposes a Chinese tourist attraction toponym extraction model based on RoBERTa-BiLSTM-CRF [7]. The model is trained using social media data and has relatively high accuracy, and it is suitable for Chinese tourist attraction name entity extraction scenarios. Specifically, this paper mainly refers to the following work.
First, we propose a tourist scenic spot name entity recognition model to extract the candidate tourist scenic spot names from the travel note texts of the social media platform Xiaohongshu. Then, based on these extracted candidate tourist attraction names and their corresponding geospatial coordinates, we use a multi-distance spatial distance method to filter the candidate tourist attraction names extracted by the model, so as to filter out the false results. Finally, we generate vague perceptual regions of tourist attractions based on the chi-shape algorithm and fuse the administrative division data and road network data of the study area. The chi-shape algorithm has been used by Liu et al. to generate perceptual regions of urban subway stations [8], which provides a reference for this study. In order to verify the accuracy of our algorithm method, we used other algorithms for comparison experiments. In the final obtained experimental results, the accuracy of our algorithm is 0.7578, the recall is 0.6926 and the F1 value is 0.7141. This result is more accurate compared to other algorithms. The following experimental results were obtained. Among many well-known tourist attractions in Hangzhou, we conducted an experimental study on the vague perception regions of tourist attractions using several well-known attractions as cases, including the Xixi Wetland Scenic Region, West Lake Scenic Region, Baima Lake Scenic Region and Xiang Lake Scenic Region. First, the chi-shape of each tourist attraction was obtained using the method described above. Considering the influence of other factors, especially the influence of transportation on tourism and location names, this paper introduces fine-grained Traffic Analysis Zone (TAZ) data [9], intersects them with the previously obtained chi-shape area and finally obtains the overlap region as the cognitive region of the tourist attraction. After comparing the final results of different tourist attractions with the objective regions, it was found that the perception regions of the tourist attractions obtained in this study included the actual regions and had some extension based on the actual region range of each tourist attraction.
Compared with previous studies, the novelty of the research presented in this paper is mainly reflected in the following aspects: our research firstly proposes a method to extract the cognitive area of tourist attractions, which is innovative in terms of models and can reflect the spatial extent of the human–land relationship in tourist attractions, so as to obtain results in line with cognition. Secondly, we obtained the metric results under the optimal method by fine-tuning the data of tourist attractions. Finally, our method is based on Volunteered Geographic Information (VGI) for the fusion of text understanding and spatial clustering, which is an innovation in textual spatial intelligence.
In summary, the contributions of this paper are mainly reflected in the following aspects.
1. We construct a chi-shape diagram based on the name points of tourist attractions extracted from Xiaohongshu’s travel notes, which provides a relatively accurate method for the determination of vague perception regions of tourist attractions. 2. We introduce the Traffic Analysis Zone data and intersect them with the chi-shape graph to obtain results with high tourist awareness, which provides ideas for related researchers. 3. The dataset that we use is collected and fine-tuned to provide a reference for researchers in related fields, and can also be used for other research including more aspects.
The structure of this paper is as follows. In Section 2, related works on toponym extraction and vague cognitive regions are introduced. Section 3 describes the methods used in this study and explains their principles. In Section 4, we present the dataset, experiment and results of the data. Finally, in Section 5, we summarize the experimental results of this paper and propose future directions.

2. Related work

2.1. Toponym Entity Recognition in Web Text

A toponym refers to the proper name given by people to a geographic entity in a spatial location. In addition to referring to specific geographic locations, toponyms may also contain natural or cultural features. Toponyms are widely used in people’s daily lives and are the foundation of geographic information [10]. Extracting toponyms from empirical data such as interviews and social surveys and exploring their cognitive range used to be effective methods [11,12]. However, these methods are difficult to scale up and apply widely due to high costs, low efficiency and weak generalization. With the popularity of geospatial information services, data have rapidly increased. Social media, location-based tourism blogs and housing advertisements are increasingly appearing in people’s daily lives, and toponyms are widely present in these different types of texts [13,14,15]. However, the toponym information hidden in the texts is rarely effectively utilized. With the development and advancement of natural language processing technology, toponym extraction from large-scale data has become a research hotspot.
The existing research methods for toponym entity recognition can be roughly divided into two categories: traditional methods based on spatial statistics and machine learning, and deep learning methods in the framework of pre-training and fine-tuning. The spatial statistics-based methods mainly extract toponyms from texts via researchers specifying corresponding extraction rules for specific research regions or by mining the spatial distribution patterns of toponyms. De Bruijn et al. proposed a toponym extraction method by matching existing toponym databases and OpenStreetMap [16]. However, toponym information contributed by users in network text data, especially in crowdsourcing data, is often arbitrary, and there are also some local conventions and aliases for toponyms, as well as irregular language and abbreviations in the texts. The methods based on specific gazetteers cannot recognize informal toponyms in these unstructured texts. In addition, McKenzie et al., integrated multiple spatial statistical metrics and random forest ensemble learning methods to extract neighborhood names from rental property listing data [17]. Lai et al., extracted toponyms from geotagged Twitter texts using a method based on spatial point pattern analysis [18]. However, these methods, based on spatial statistics metrics and traditional machine learning, can achieve relatively ideal results in specific research regions, but there are problems such as high dimensionality, high computational complexity and easy overfitting. Using existing named entity recognition (NER) tools for toponym extraction is a means to reduce the computational complexity. Hu et al. extracted toponyms from real estate advertisements using NER tools such as spaCy NER and Stanford NER, and then filtered them using spatial clustering [19]. Similarly, NER tools have been applied to extract toponyms from historical corpora and Twitter texts [20,21]. However, this method of using existing NER tools for toponym extraction has limited generalization ability. Artificial neural networks are an effective method to address the issues of generality and scalability. When the amount of data is small, applying a simple neural network structure to extract toponyms from unstructured textual data is an effective approach [22,23,24,25]. However, simple neural network structures may have issues of underfitting when applied to large-scale corpora. Hu et al. proposed a deep learning architecture called C-LSTM, which combines toponym dictionaries and rules and was applied to toponym extraction in Weibo data [26]. However, this method cannot solve the problem of toponym disambiguation as it does not utilize the contextual features of the text. Wang et al. proposed a neural network-based toponym recognition model for extracting locations from social media messages using a BiLSTM-CRF architecture and trained the model with annotated tweets and datasets from Wikipedia [27]. Similarly, the BiLSTM-CRF architecture has also been applied to extract geographic spatial entities from heritage corpora and real estate advertisements [28,29]. These architectures suffer from low computational efficiency when applied to large-scale datasets due to their inability to perform parallel computation. With the development of natural language processing techniques, pre-training and fine-tuning language models such as BERT have made it possible to efficiently and accurately extract toponyms from web text [7]. Liu et al. implemented geological name entity recognition (Geo-NER) on geological reports based on the BERT model [30]. Ma et al. proposed a deep neural network architecture called BERT-BiLSTM-CRF for Chinese text-based toponym recognition [31]. Similarly, Qiu et al. proposed a Chinese toponym recognition architecture called ChineseTR, based on weakly supervised BERT+BiLSTM+CRF, and trained the Chinese toponym recognition model on a training dataset automatically generated from the People’s Daily corpus [32]. Named entity recognition models based on pre-trained, fine-tuned deep learning architectures split pre-training and fine-tuning into two stages. By pre-training on massive amounts of unsupervised text, they can better learn the semantic features of the text [9]. At the same time, they can be fine-tuned for specific downstream tasks (such as toponym entity recognition), using the model initialization parameters obtained from the pre-training stage based on a large amount of unsupervised text data [33]. Additionally, adding a CRF layer after BERT can place constraints on the sequence data. These methods have demonstrated good performance in named entity recognition tasks. Therefore, inspired by these methods, this study proposes a named entity recognition model based on RoBERTa-BiLSTM-CRF.

2.2. Vague Region Perception

A region is one of the oldest concepts in geography. It is a bounded spatial extent characterized by the similarity or invariance of a set of attributes. Due to the complex interactions between individuals, society and the environment, the boundaries of geographic regions are often vague [34]. In other words, human perception of regions often does not align with official administrative divisions implemented by governments [35]. Traditional survey-based methods are an effective means to study regions. Montello et al. introduced a method of inviting volunteers to participate in a survey to evaluate the cognitive regions of “Northern” and “Southern” California [36]. This survey-based method of evaluating cognitive regions can accurately identify the geographic regions of interest, but it suffers from high costs and limited study regions. In addition, since it is a survey method designed for specific study regions, it is difficult to generalize to other regions of study. Geometric algorithms such as convex hulls and concave hulls are also commonly used to extract the boundaries of geographic regions. Chen et al. used HDBSCAN to cluster Flickr data with geographic labels, and then used a concave hull algorithm called alpha shapes to construct the boundaries of regions, ultimately generating urban regions of interest (UAOIs) [37]. Hu et al. used convex hulls, concave hulls and kernel density estimation methods to create rough spatial footprints for toponyms [19]. However, simply generating a convex hull or concave hull based on points often does not conform to people’s spatial cognition because it usually contains a large number of gap regions that are not occupied by points [38]. Liu et al. used an algorithm called chi-shape and generated perceptual regions of city subway stations based on POI data [39]. This method balances well the emptiness and complexity of the generated convex hull. The method used in the present study for generating perceptual regions of tourist attractions is similar to this method, but we also consider Traffic Analysis Zone (TAZ) data when generating the perceptual regions of tourist attractions. TAZ is closely related to the urban road traffic and, to some extent, represents the ways in which urban residents use urban space [40,41]. Therefore, perceptual regions that consider urban traffic information may be more in line with human cognition. In the field of tourism research, the data-driven generation of perceptual regions for tourist attractions has also become a major topic. Shao et al. introduced the concept of graph theory and used Sina Weibo data to extract regions of interest (AOIs) for tourist attractions [42]. The authors divided the research region into many grids, regarded each grid as the vertex of a graph and constructed the edges of the graph based on the tourists’ daily activities. They then used community detection algorithms to extract AOIs for tourist attractions [43]. In addition, clustering methods have also been widely used to extract tourist interest regions. Peng et al., proposed a clustering method called CFSFDP that considers partitioning and standardization for the discovery of tourist attraction regions [44]. To address the problem of significant differences in density distribution in clustering regions, this study divided the research region into several sub-regions using the road network and then standardized the density of points and the relative distance between points in each sub-region. Subsequently, the TF-IDF method was used to generate a label vector for each initial cluster, and the vector similarity was calculated to merge adjacent semantically similar clusters, which could better identify large, irregularly shaped AOIs for tourist attractions. Devkota et al. proposed a method of extracting tourist interest regions that integrates nighttime light satellite imagery data, geotagged Twitter data, OSM data and other auxiliary data using the DBSCAN spatial clustering algorithm [45]. Similarly, the DBSCAN spatial clustering algorithm has also been applied to Twitter and Flickr datasets to extract and identify tourist interest regions and users’ travel destinations [46,47,48]. These DBSCAN-based methods are sensitive to the algorithm’s parameters and require different clustering algorithm parameters for different study regions and datasets, which affects the generalizability of the method. Additionally, when the dataset is large, the computational complexity of the method is also high.

3. Methodology

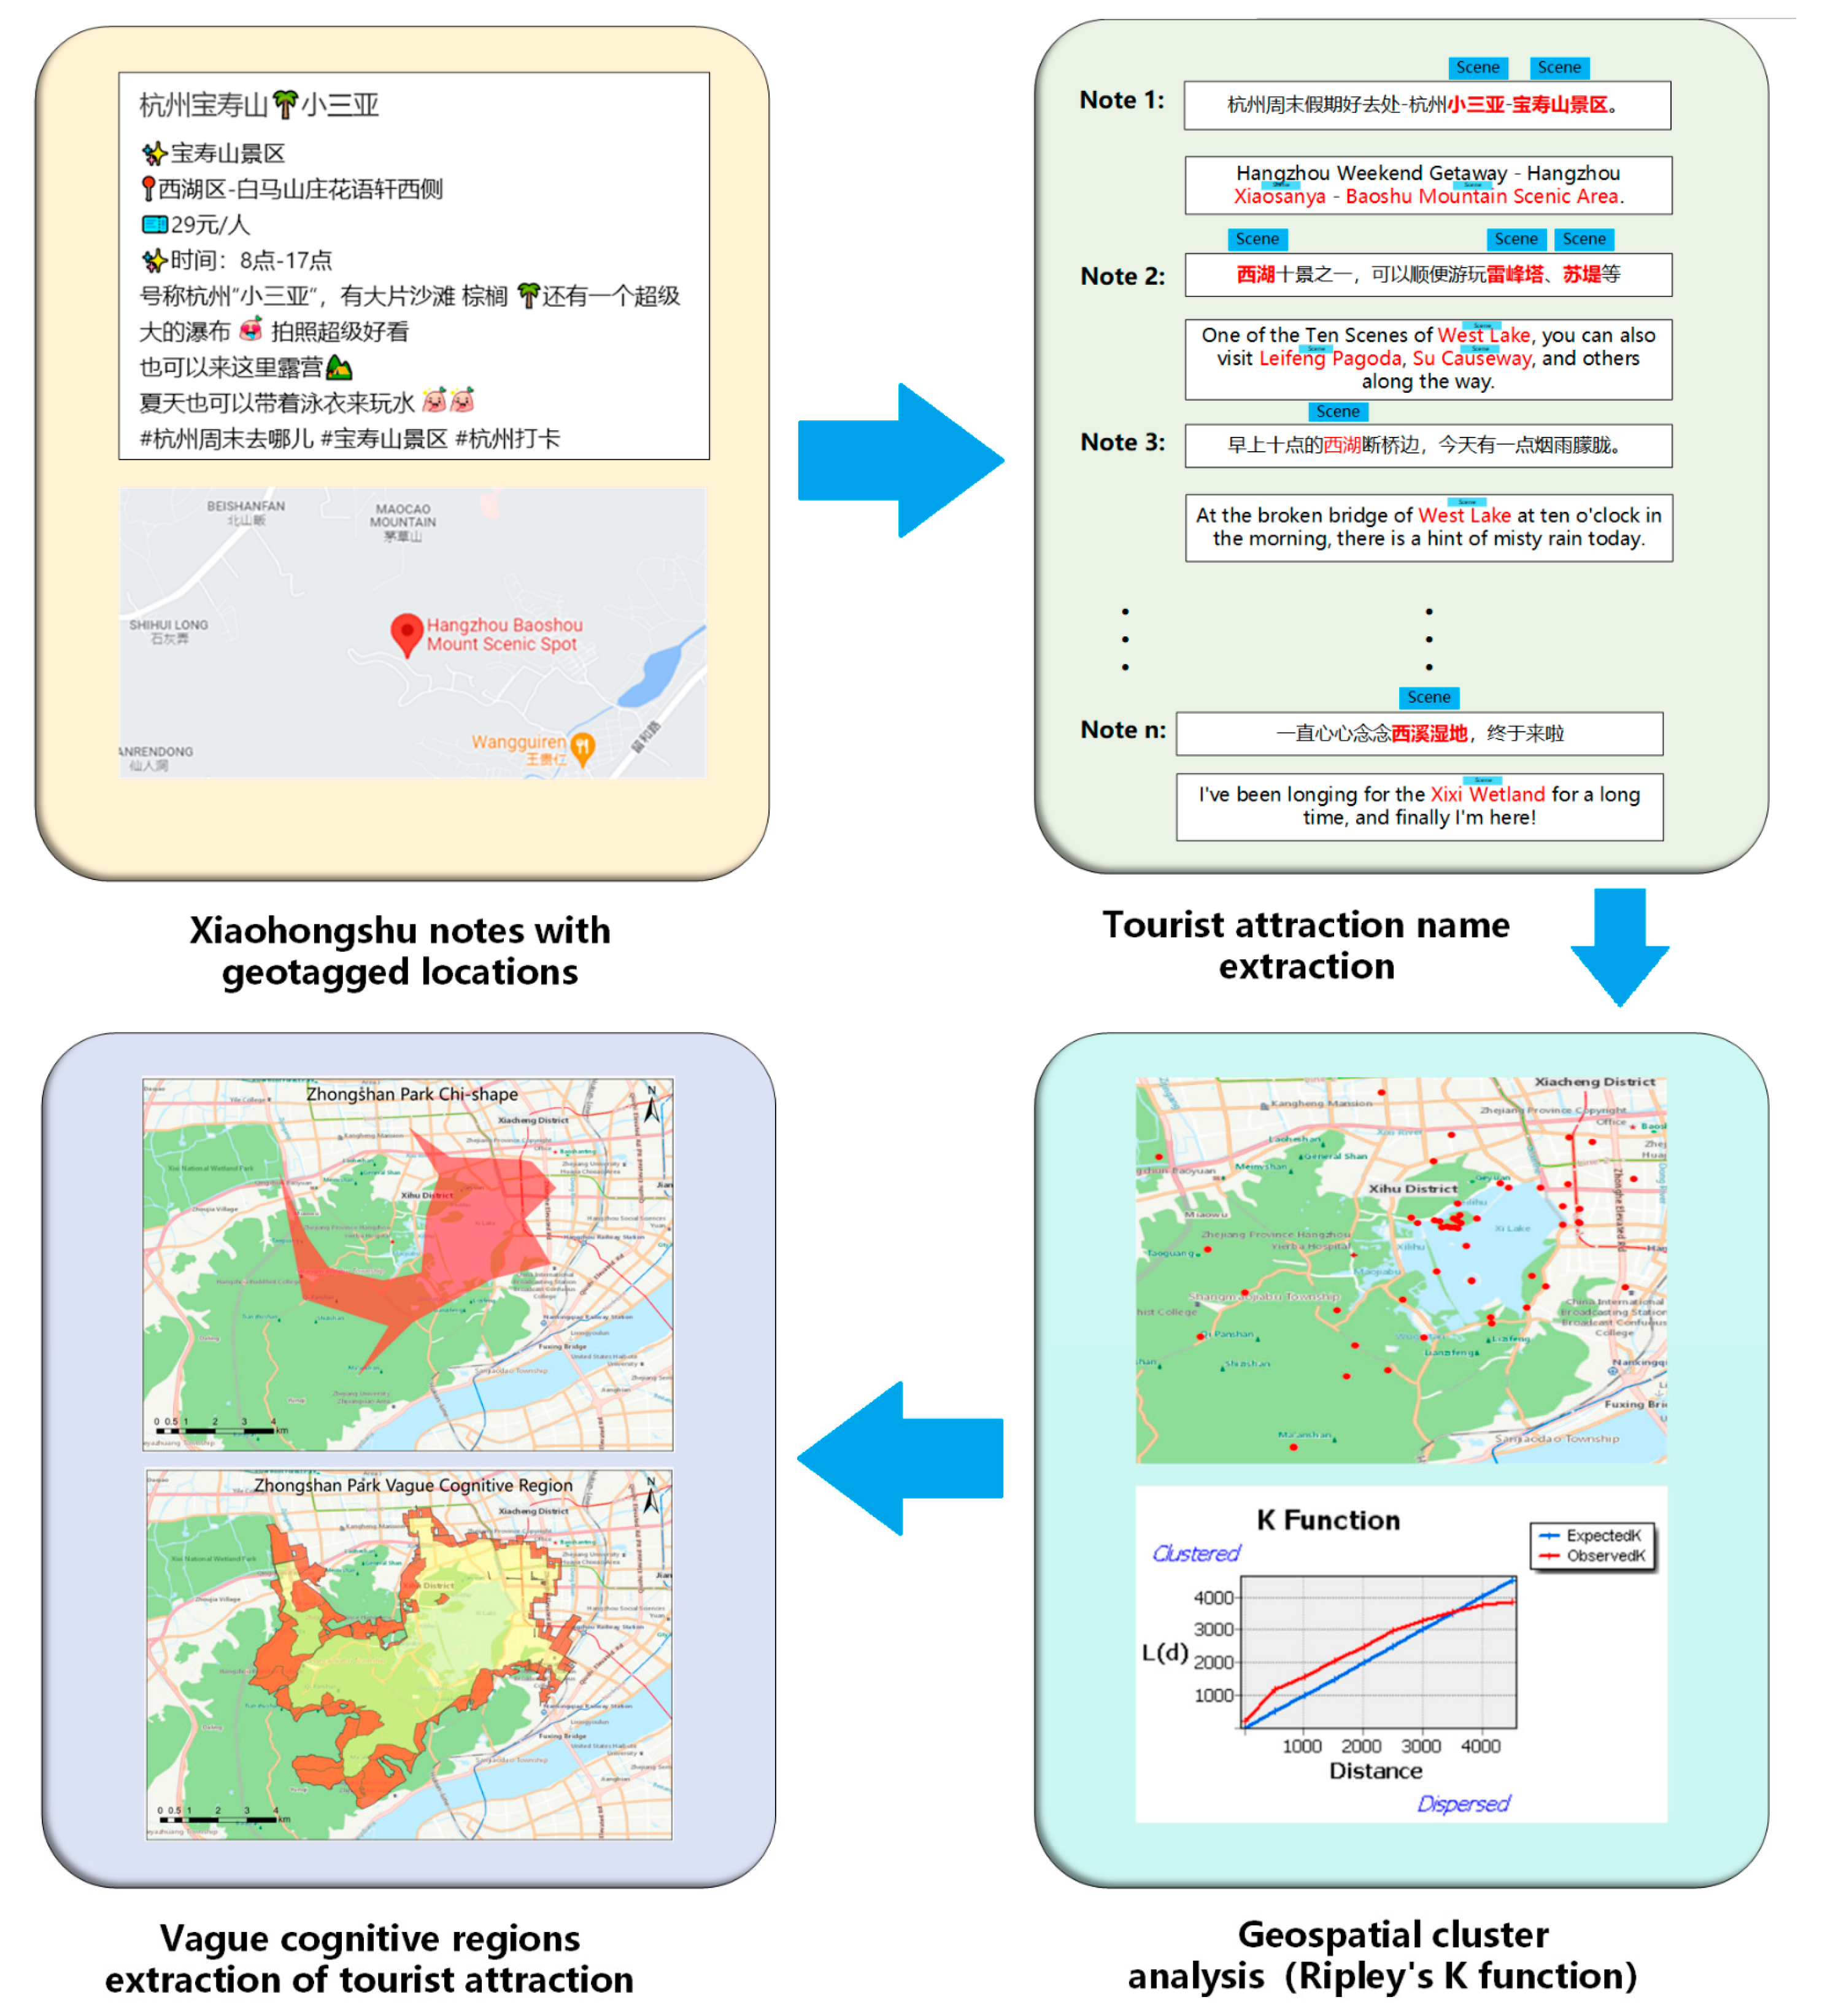
3.1. Overall Architecture

We propose a framework consisting of three stages that takes Xiaohongshu’s note data as input and produces the names of tourist attractions and their corresponding vague cognitive regions as output. Figure 2 shows the overall architecture of the framework.
Regarding the environment of the current research model, the software environment includes Pytorch 1.10.0, Python 3.7.10 and ArcGIS 10.8. The hardware environment consists of the Windows 10 and Ubuntu 18.04.5 operating systems, an Intel(R) Xeon(R) Platinum 8358 CPU @ 2.60 GHz, 512 GB of RAM and an NVIDIA A100 SXM4 40 GB graphics card.

3.2. Tourist Attraction Name Extraction

When extracting tourist attraction names from travel note data in Xiaohongshu (a Chinese social media platform), we cannot refer to existing gazetteers or rely on methods based on such dictionaries. This is because the purpose of this study is to extract and recognize tourism attraction names that comply with people’s cognitive habits, such as the unofficial names of tourist attractions known by locals, which are not recorded in standard gazetteers. Therefore, we use natural language processing models to achieve the task of identifying tourism attraction entities and extract their names without relying on gazetteers. In this study, we designed a tourism attraction name entity extraction model based on RoBERTa-BiLSTM-CRF. RoBERTa, BiLSTM and CRF are the main components of the neural network model for tourism attraction name entity extraction, and the overall architecture of the model is shown in Figure 3.
We describe all layers of the neural network model from bottom to top. The input layer receives arbitrary Chinese text consisting of multiple words (e.g., “There is a Xixi Wetland 5 km away from West Lake in Hangzhou”). Each word in the input Chinese text is encoded into a corresponding ID using a pre-trained vocabulary, forming an ID sequence that serves as the input to the RoBERTa model. RoBERTa is an improved version of the BERT model. Unlike other language models, such as ELMO and GPT, BERT uses a bidirectional transformer encoder architecture and the Masked Language Model (Masked LM) as the pre-training task. This allows the BERT model to fully understand the semantic information of a word through its preceding and following words. Therefore, after fine-tuning, the pre-trained BERT model can exhibit good performance for various natural language processing tasks [7]. However, Liu et al. argued that the BERT model is significantly undertrained and proposed the RoBERTa model based on BERT. RoBERTa uses more training data than BERT in the pre-training stage and employs several training strategies to improve model performance, including dynamic masking, training with large batches and byte–pair encoding [49]. Therefore, in this study, we use RoBERTa pre-trained representations for fine-tuning. The input representations of the RoBERTa model consist of three parts: token embeddings, segment embeddings and position embeddings. These three representations are concatenated and serve as the input to the RoBERTa module. Then, the output of the RoBERTa module is used as the input of the BiLSTM layer. The layer consists of forward and backward hidden layers, which can capture forward and backward contextual information, respectively. The output of the BiLSTM layer is concatenated and transmitted to the fully connected layer for sequence labeling classification. In this study, the BIOS sequence labeling scheme is used for tourism attraction name entity extraction (where B denotes the beginning position of the entity, I denotes the middle position of the entity, O denotes other categories and S denotes a single character entity). The last layer is a CRF layer, which calculates the CRF loss function based on the sequence labeling classification of the fully connected layer. The CRF loss function is shown in Equation (1), where N denotes the number of label paths, S Re a l P a t h represents the score of the true path and S i represents the score of path i. The path score consists of state scores and transition scores, as shown in Equation (2). State scores are derived from the output of the BiLSTM layer. The transition scores are parameters of the model that are updated during the iterative training process. Another function of the CRF layer is to use the Viterbi algorithm to find the most likely label sequence based on the output of the fully connected layer, i.e., the label for each character in the input text sequence. In this study, the CRF layer serves to increase the constraints on the generated label order, ensuring that the output result is a legal sequence. For example, the beginning of a tourism attraction name entity is labeled as the B-scene, while the part following the B-scene is labeled as the I-scene.
L oss F u n c t i o n = ( S Re a l P a t h log ( e S 1 + e S 2 + + e S N ) )
S i = S t a t e S c o r e + T r a n s i t i o n S c o r e
In particular, our proposed model for the name entity extraction of Chinese tourism scenic spots introduces the following features to improve the performance. First, we use the Chinese pre-trained RoBERTa model, which utilizes 30 GB of Chinese training data in its pre-training stage, including news, community discussions and multiple encyclopedias. Our dataset contains many Chinese tourism scenic spot names, some of which may not be included in the pre-training corpus of the native RoBERTa model, including some popular expressions for local tourism scenic spots (e.g., “Baoshou Mountain Scenic Spot” is commonly referred to as “Hangzhou’s Little Sanya”). When encountering such cases, the native RoBERTa model treats these words as unknown words, greatly affecting the performance of the model. Therefore, the Chinese pre-trained RoBERTa model is more suitable for NER in Chinese tourism scenic spots. Secondly, during the fine-tuning stage, we use the CLUENER2020 (https://github.com/CLUEbenchmark/CLUENER2020, accessed on 5 September 2022) dataset as an additional supplement to the human-annotated social media dataset, which is a dataset for fine-grained Chinese name entity recognition, including scene classification. It is based on a text classification dataset called THUCTC, which was open-sourced by Tsinghua University. CLUENER2020 selects a portion of the data from THUCTC and adds fine-grained named entity annotations. The original data come from the Sina News RSS. Thus, they are in line with our research objectives.

3.3. Delineating Vague Cognitive Boundaries of Tourist Attraction Regions

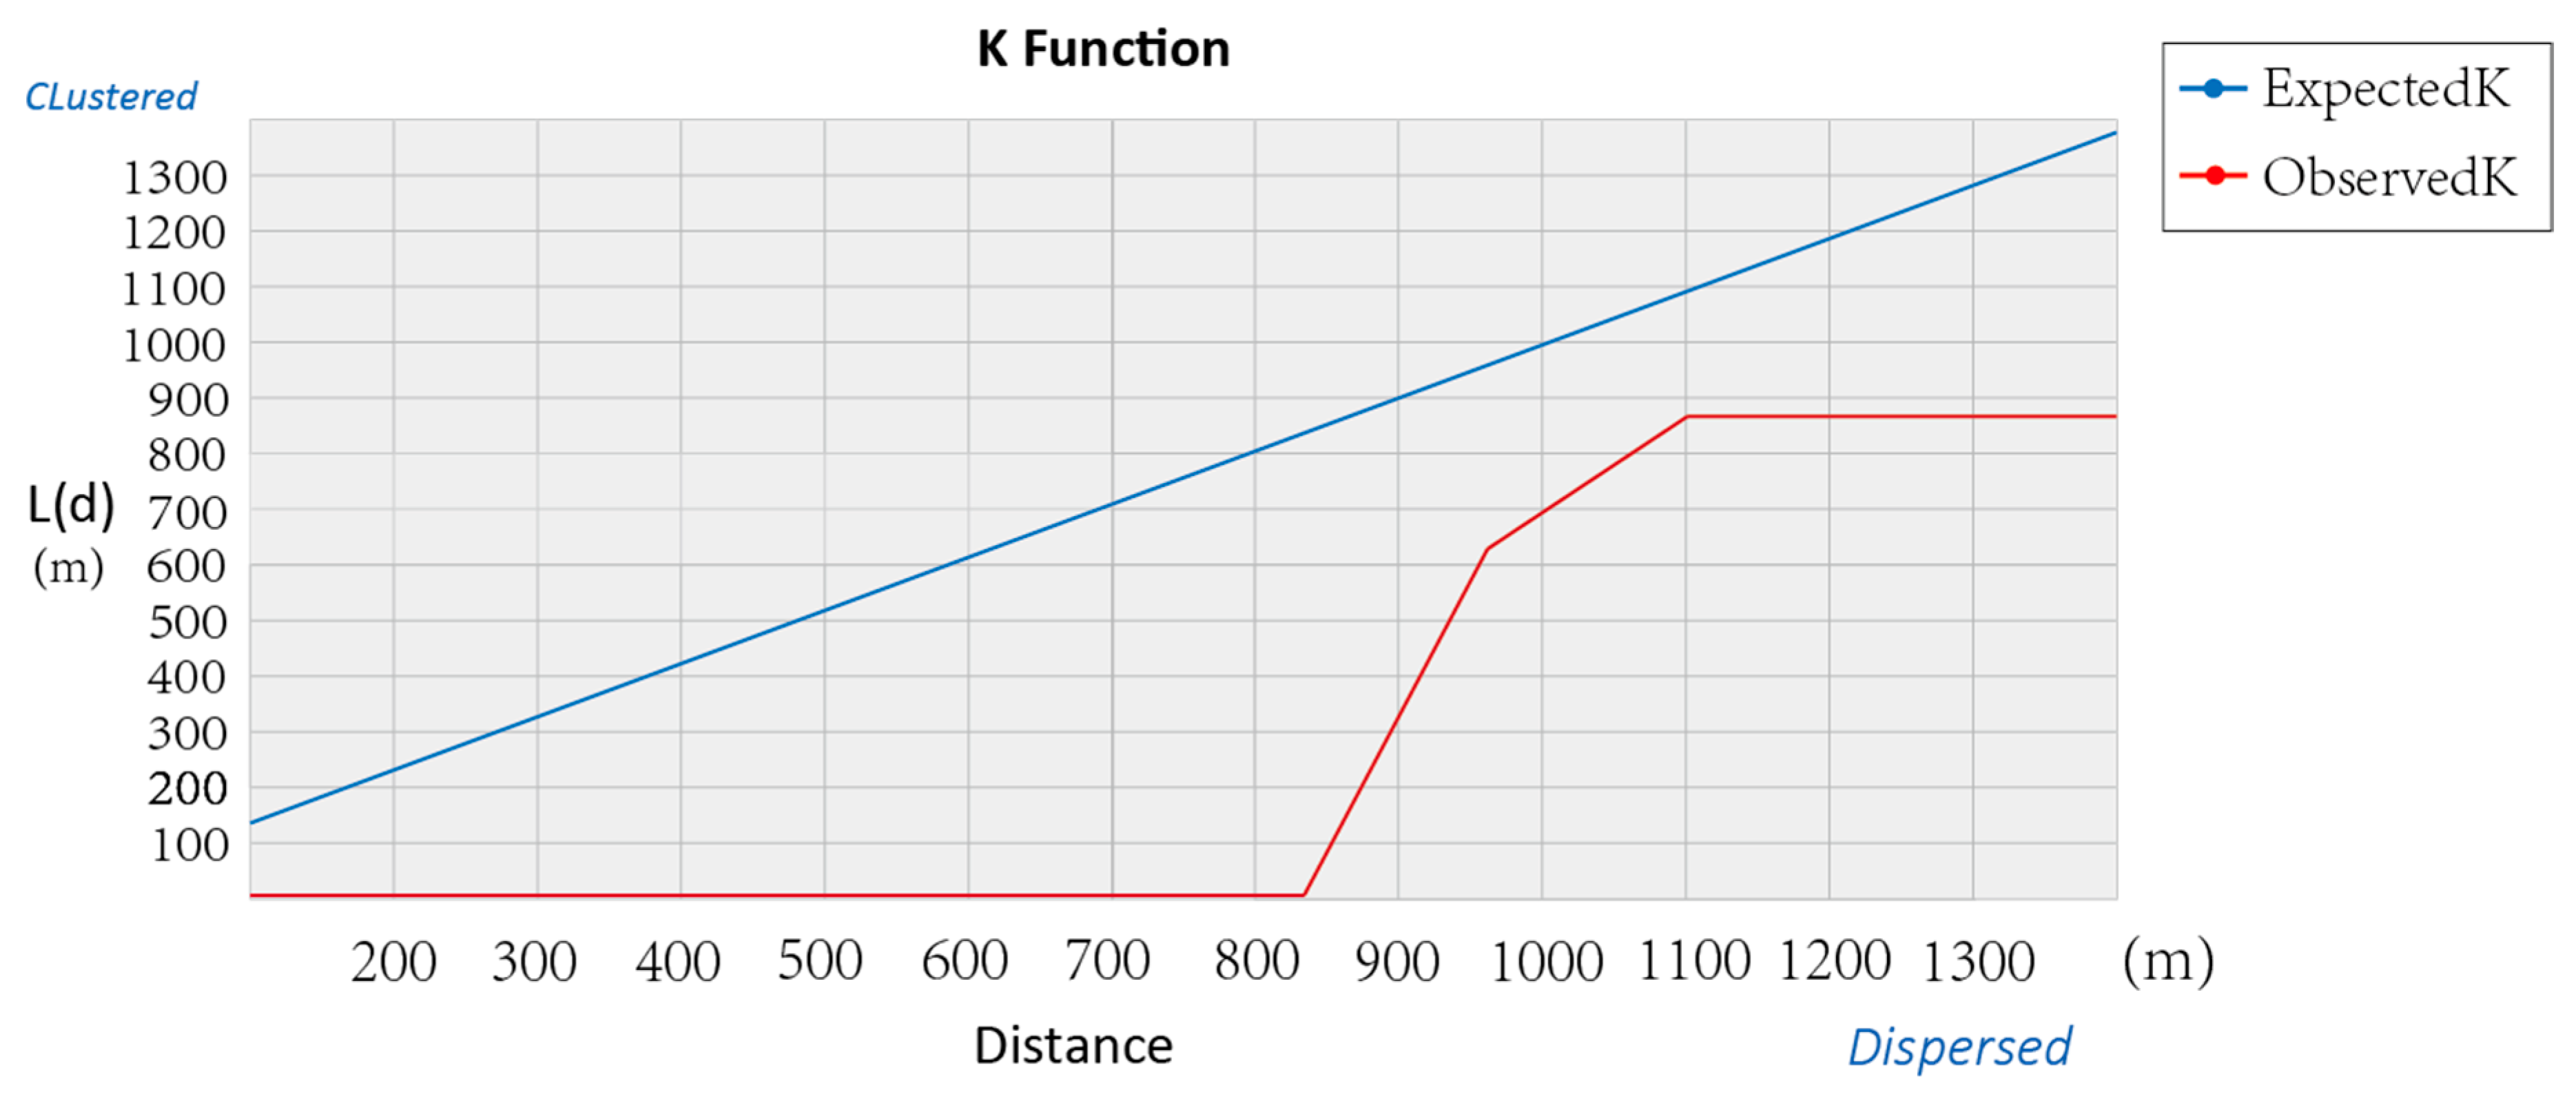
3.3.1. Geospatial Clustering Analysis

In geographic spatial clustering analysis, spatial scale is an important concept. Different spatial scales can lead to different clustering results. When performing clustering analysis on a set of geographic spatial objects in a city, using only a specific spatial scale for analysis often means that we ignore other clustering patterns in the results. To address this issue, in this study, we use Ripley’s K function to perform multi-distance spatial clustering analysis on tourist attraction names. Ripley’s K function is one of the most commonly used methods in geographic spatial clustering analysis [50,51]. The advantage of Ripley’s K function is that it analyzes the point distribution pattern at all spatial scales in the entire study area by considering the distance relationship between all geographic spatial points. The definition of Ripley’s K function is shown in Equation (3). In Equation (3), N is the number of tourist attraction points, d is the spatial scale, w i j ( d ) is the distance between tourist attraction points i and j and A is the area of the study area. We use the commonly used mathematical transformation of Ripley’s K function for clustering analysis, and the equation for the transformed function is shown in Equation (4). In Equation (4), k ( i , j ) represents the weight, which is 1 when the distance between tourist attraction points i and j is less than d, and 0 otherwise. In this study, we set the starting distance of Ripley’s K function to 10 m, the distance increment to 500 m and the number of distance changes to 10. From a conceptual perspective, most tourist attraction names will show higher K values than expected at some spatial scale. The expected K value refers to the expected distribution under random distribution. We believe that candidate tourist attraction names with K values higher than expected have obvious clustering characteristics and are more likely to be real tourist attraction names.
K ( d ) = A i n j n w i j ( d ) N 2
L ( d ) = A i = 1 N j = 1 , j i N k ( i , j ) π N ( N 1 )

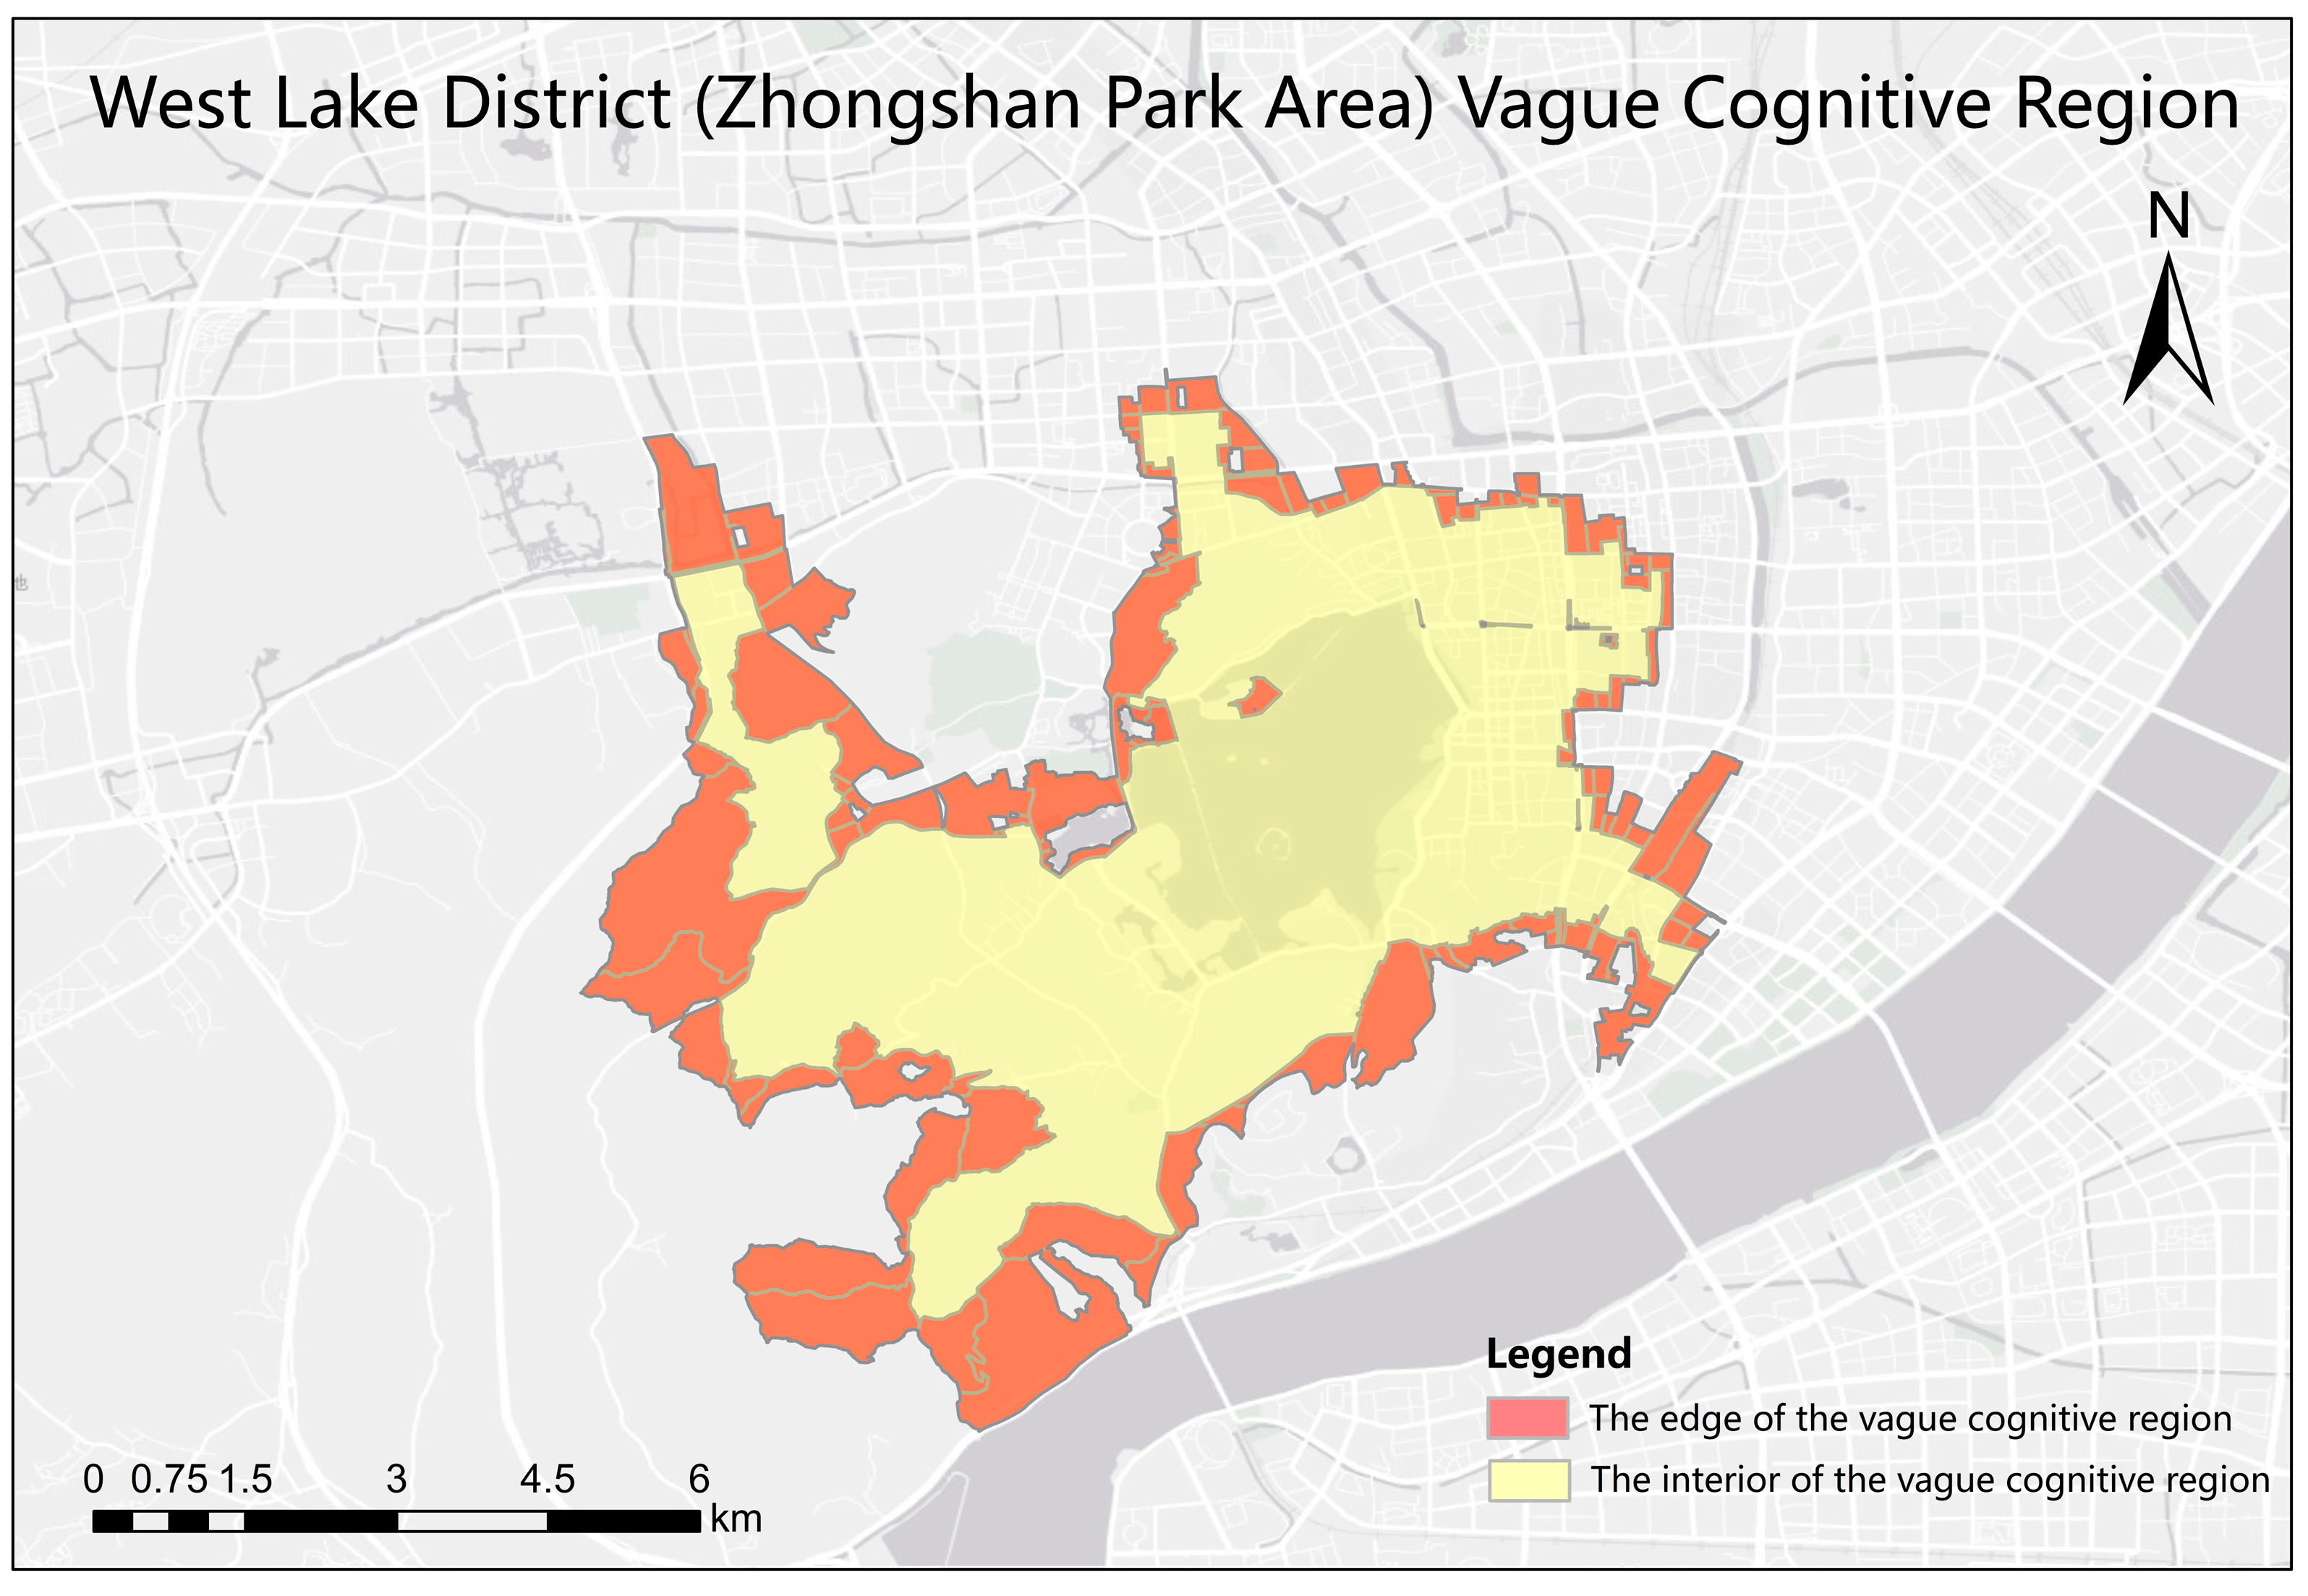
3.3.2. Extracting Vague Cognitive Zones of Tourist Attractions

In this study, we constructed the vague cognitive regions of tourist attractions by building the minimum bounding geometry of extracted tourist attraction name points. In previous research, convex hulls and buffer zones were commonly used to construct the minimum bounding geometry of point sets. Although these methods can fully and smoothly contain all input points, the results formed are often unsatisfactory because the resulting polygons usually contain a large number of gaps for non-convex point distributions. To address this problem, Duckham et al. proposed an algorithm called chi-shape, which generates simple polygons based on the input point set [52]. This algorithm has been applied in AOI-related research. Hu et al. used the chi-shape algorithm to generate urban regions of interest (AOI) based on input social media point sets [53]. Liu et al. used the chi-shape algorithm to generate the cognitive regions of city subway stations based on input POI point sets [39].
The implementation of the chi-shape algorithm mainly consists of the following four steps.
(1)
Generate Delaunay triangulation based on the input tourist attraction name point set.
(2)
Remove the longest external edge from the Delaunay triangulation, as long as the external boundary meets the following conditions:
  • The length of the edge is longer than the length parameter;
  • The remaining edges after removing the edge form a simple polygon.
(3)
Repeat step (2) as long as there are edges that meet the removal conditions.
(4)
Return the polygon formed by the remaining external edges of the Delaunay triangulation (Duckham and Kulik et al., 2008).
The length parameter, with a value range of [0, 100], determines the maximum boundary of the generated polygon. The smaller the length parameter, the closer the result is to the original point set, i.e., the more complex it is. Conversely, the larger the length parameter, the more gaps the generated result contains. To balance complexity and emptiness, Akdag et al. proposed a method to find the optimal parameter by minimizing the fitness function [7], as shown in Equation (5).
ϕ ( P , D ) = E m p t i n e s s ( P , D ) + C × C o m p l e x i t y ( P )
In Equation (5), C is a parameter that evaluates the importance of polygon complexity relative to sparsity, with values ranging from 0 to 1. The larger the value of parameter C, the smoother the generated polygon. In this study, we set C to 1 to generate smoother and more humanly recognizable regions. P represents the simple polygon generated from the input point set, while D represents the Delaunay triangulation generated from the same input point set. E m p t i n e s s ( P , D ) evaluates the sparsity of P relative to D and C o m p l e x i t y ( P ) is used to assess the complexity of P.
The chi-shape algorithm is essentially based on generating concave hulls from points. However, these hulls often do not exactly match the trajectories of human movement. In addition, people’s cognitive range regarding tourist attractions is usually influenced by the surrounding traffic conditions. For example, local residents may also consider the roads around tourist attractions as part of the tourist attraction. To consider the influence of traffic factors, this study introduced fine-grained Traffic Analysis Zone (TAZ) data when extracting the vague cognitive regions of tourist attractions. The TAZ data are a fusion of administrative district data and road data up to the third level in the study area. Unlike previous TAZ-based studies that only use the city’s main roads [13], the TAZ used in this study considers small roads in the city as well. Some natural scenic regions far from the city center are often far from the city’s primary roads, so TAZ that considers road levels up to the third level can more finely describe the traffic conditions around these scenic regions. After generating the concave hull with the optimal parameter l , we take the intersection of the generated concave hull and the TAZ as the vague cognitive region of the tourist attraction.

4. Experimental Results and Discussion
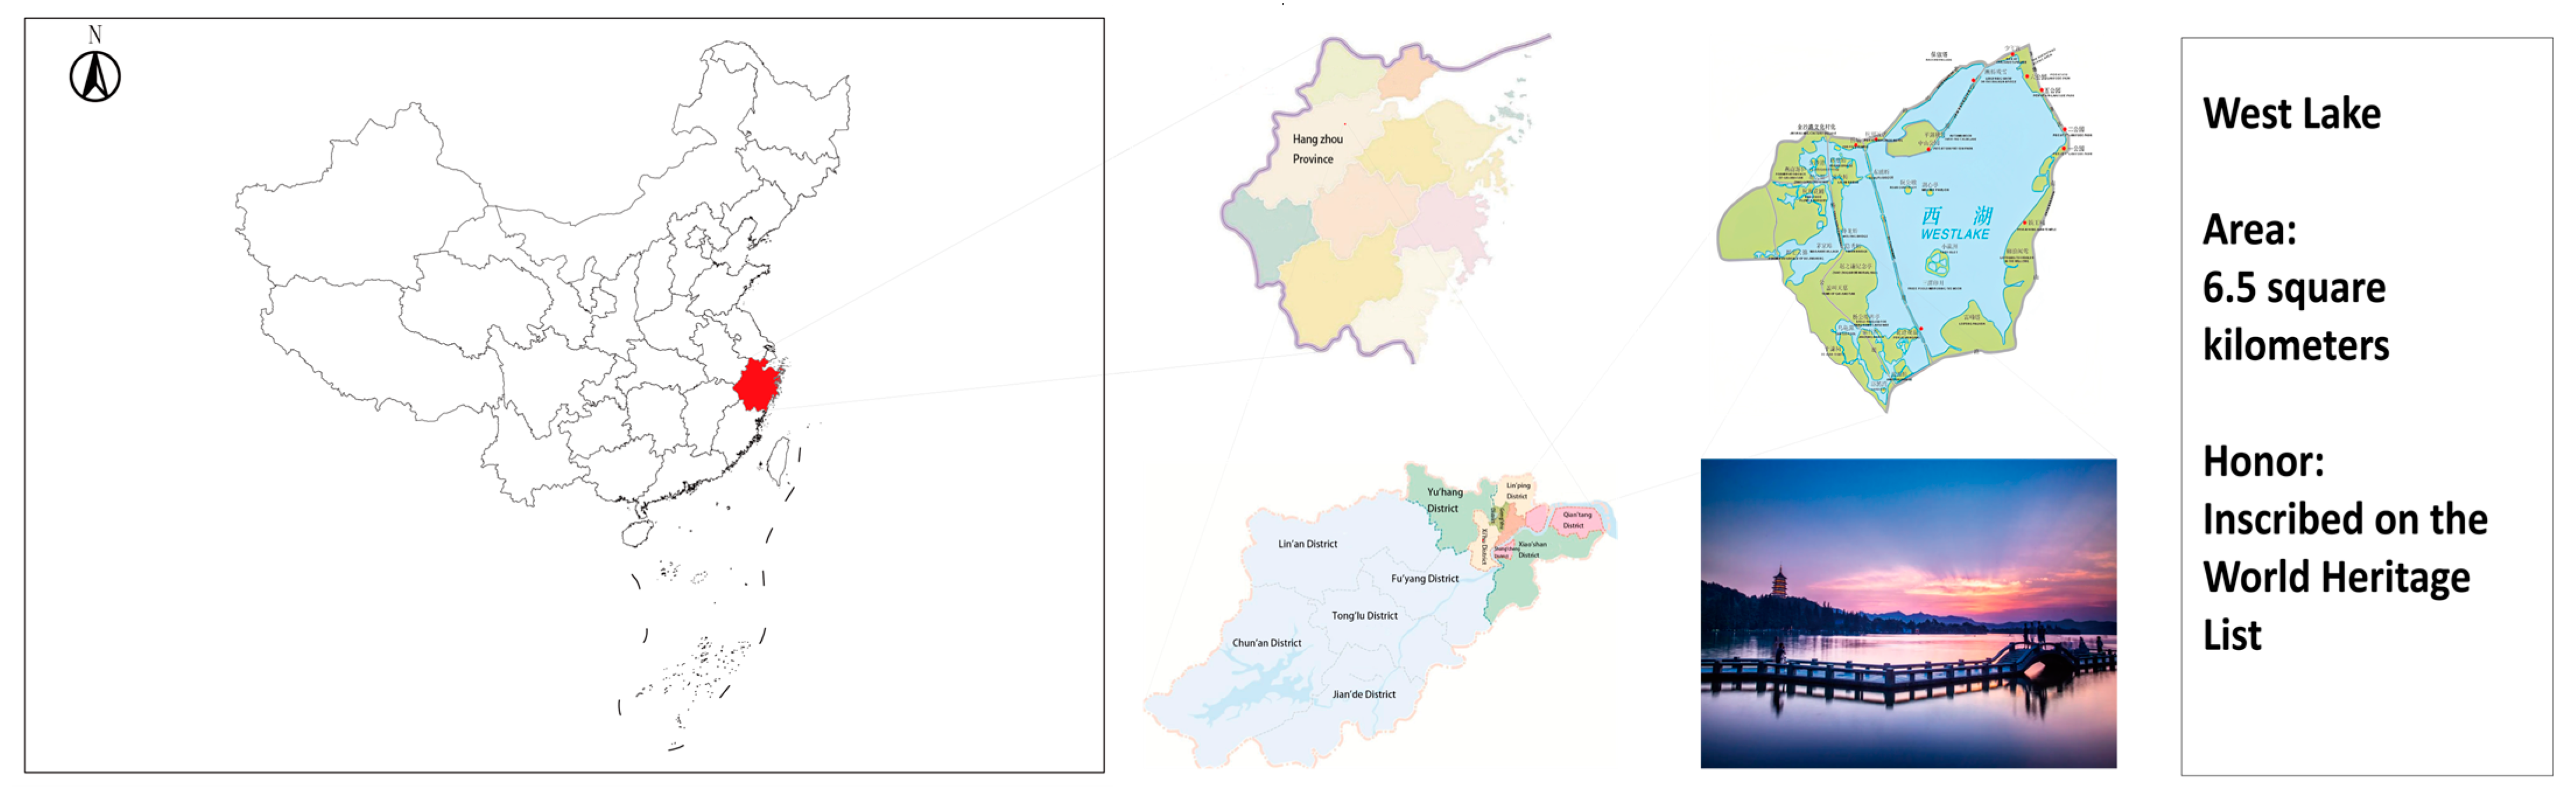
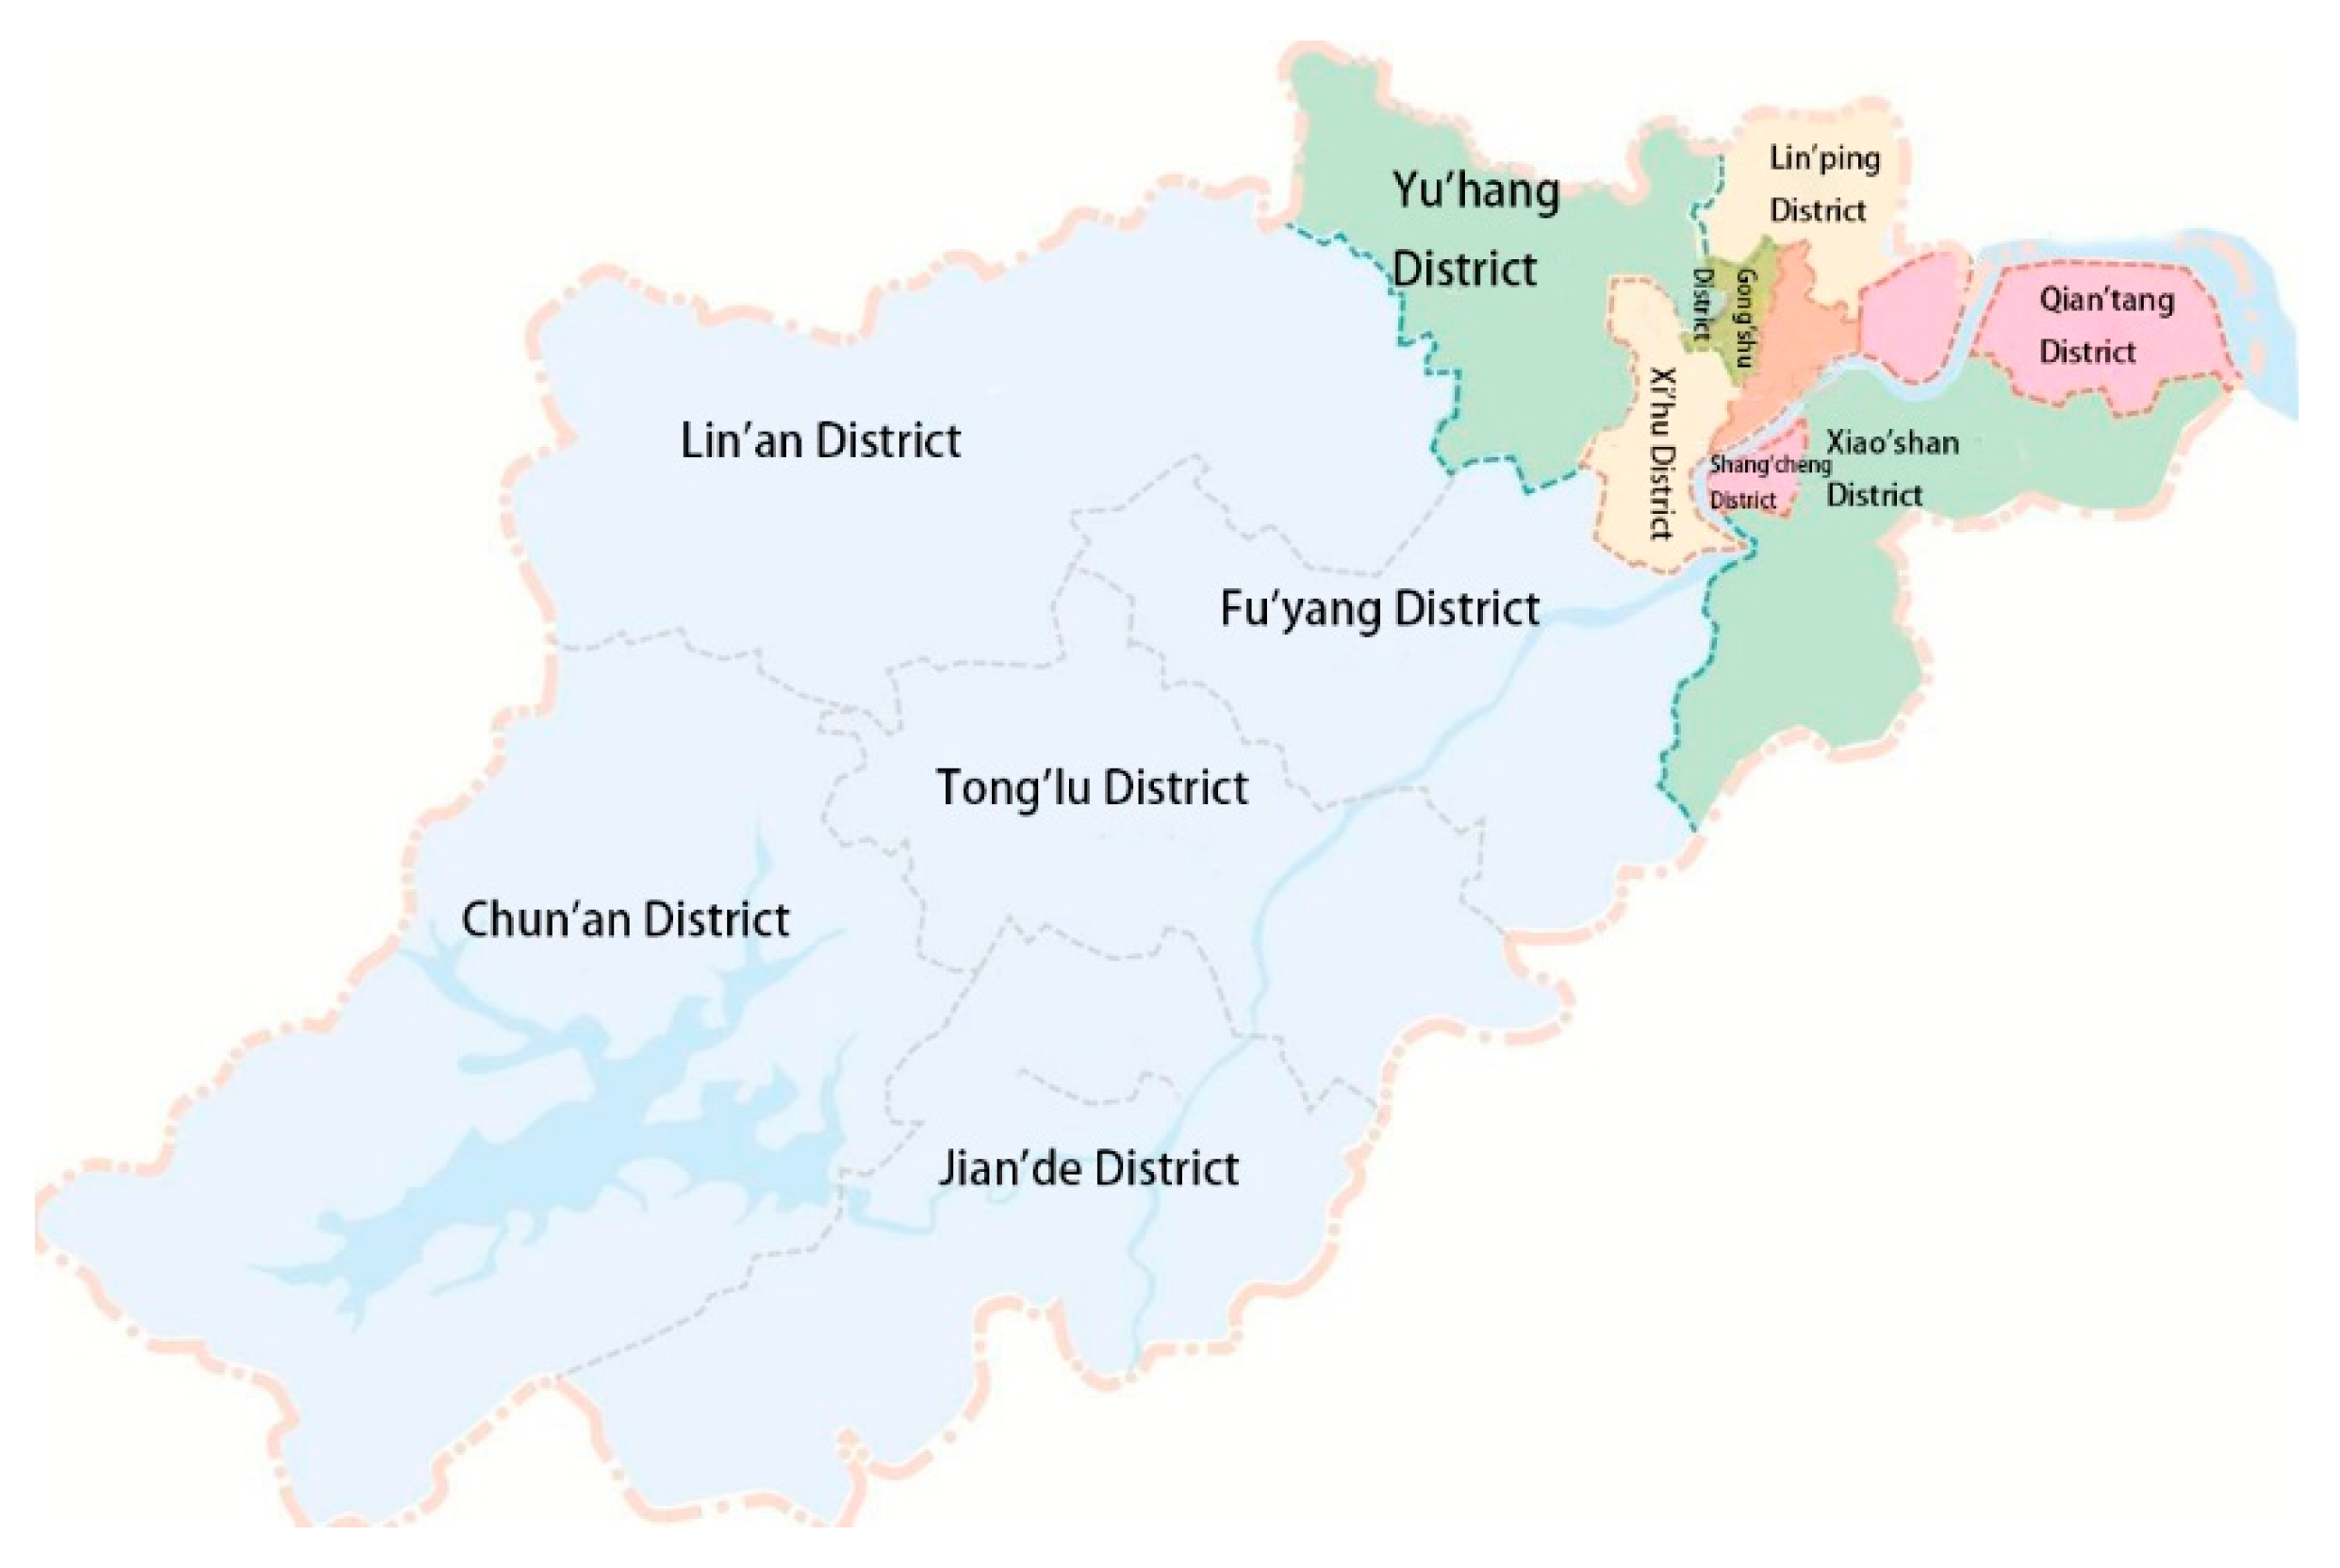
4.1. Dataset

One of the unique aspects of this study is the use of tourism note text data with geographic location tags. This type of data can now be obtained from many social media sites, such as Xiaohongshu, Weibo, Twitter, Flickr and so on. There are advantages to using Xiaohongshu tourism note text data to extract the names of tourist attractions. First, similar to Instagram, Xiaohongshu is one of China’s most popular lifestyle sharing platforms, with a large user base. The generation of notes on Xiaohongshu is relatively simple and easy, which is welcomed by users. As of March 2022, the monthly active users on Xiaohongshu exceeded 200 million. In addition, tourism is one of the most important topics on Xiaohongshu. Unlike other social media platforms, such as Sina Weibo and Twitter, there is more tourism information on Xiaohongshu, usually published in the form of short articles, which makes it more likely for the names of tourist attractions to be mentioned in Xiaohongshu’s tourism note data. Therefore, we use Xiaohongshu tourism note data as the input for the proposed framework.
Our study area is located in Hangzhou, Zhejiang Province, China. Hangzhou is the capital city of Zhejiang Province, with 10 districts, 2 counties and 1 county-level city under its jurisdiction, covering a total area of 16,850 km2 and a population of 12.376 million. Hangzhou is renowned for its cultural and historical sites, including the West Lake and its surroundings, which contain numerous natural and cultural landmarks, such as the West Lake culture, Liangzhu culture, silk culture and tea culture. Due to its beautiful scenery, Hangzhou is known as “Heaven on Earth”. The detailed geographic information is shown in Figure 4.
This study uses a total of 134,936 Xiaohongshu tourism note text data derived from Hangzhou, Zhejiang Province, China, after data cleaning and preprocessing (e.g., deleting notes without geographical location tags and duplicative notes). An example of the Xiaohongshu tourism note text data is shown in Table 1, and statistical information about the dataset is shown in Table 2.
We invited eight graduate students and experts who were familiar with the study area and had background knowledge of urban planning to read each note and label the names of the tourist attractions in it. An example of the labeled tourism text dataset is shown in Table 3.

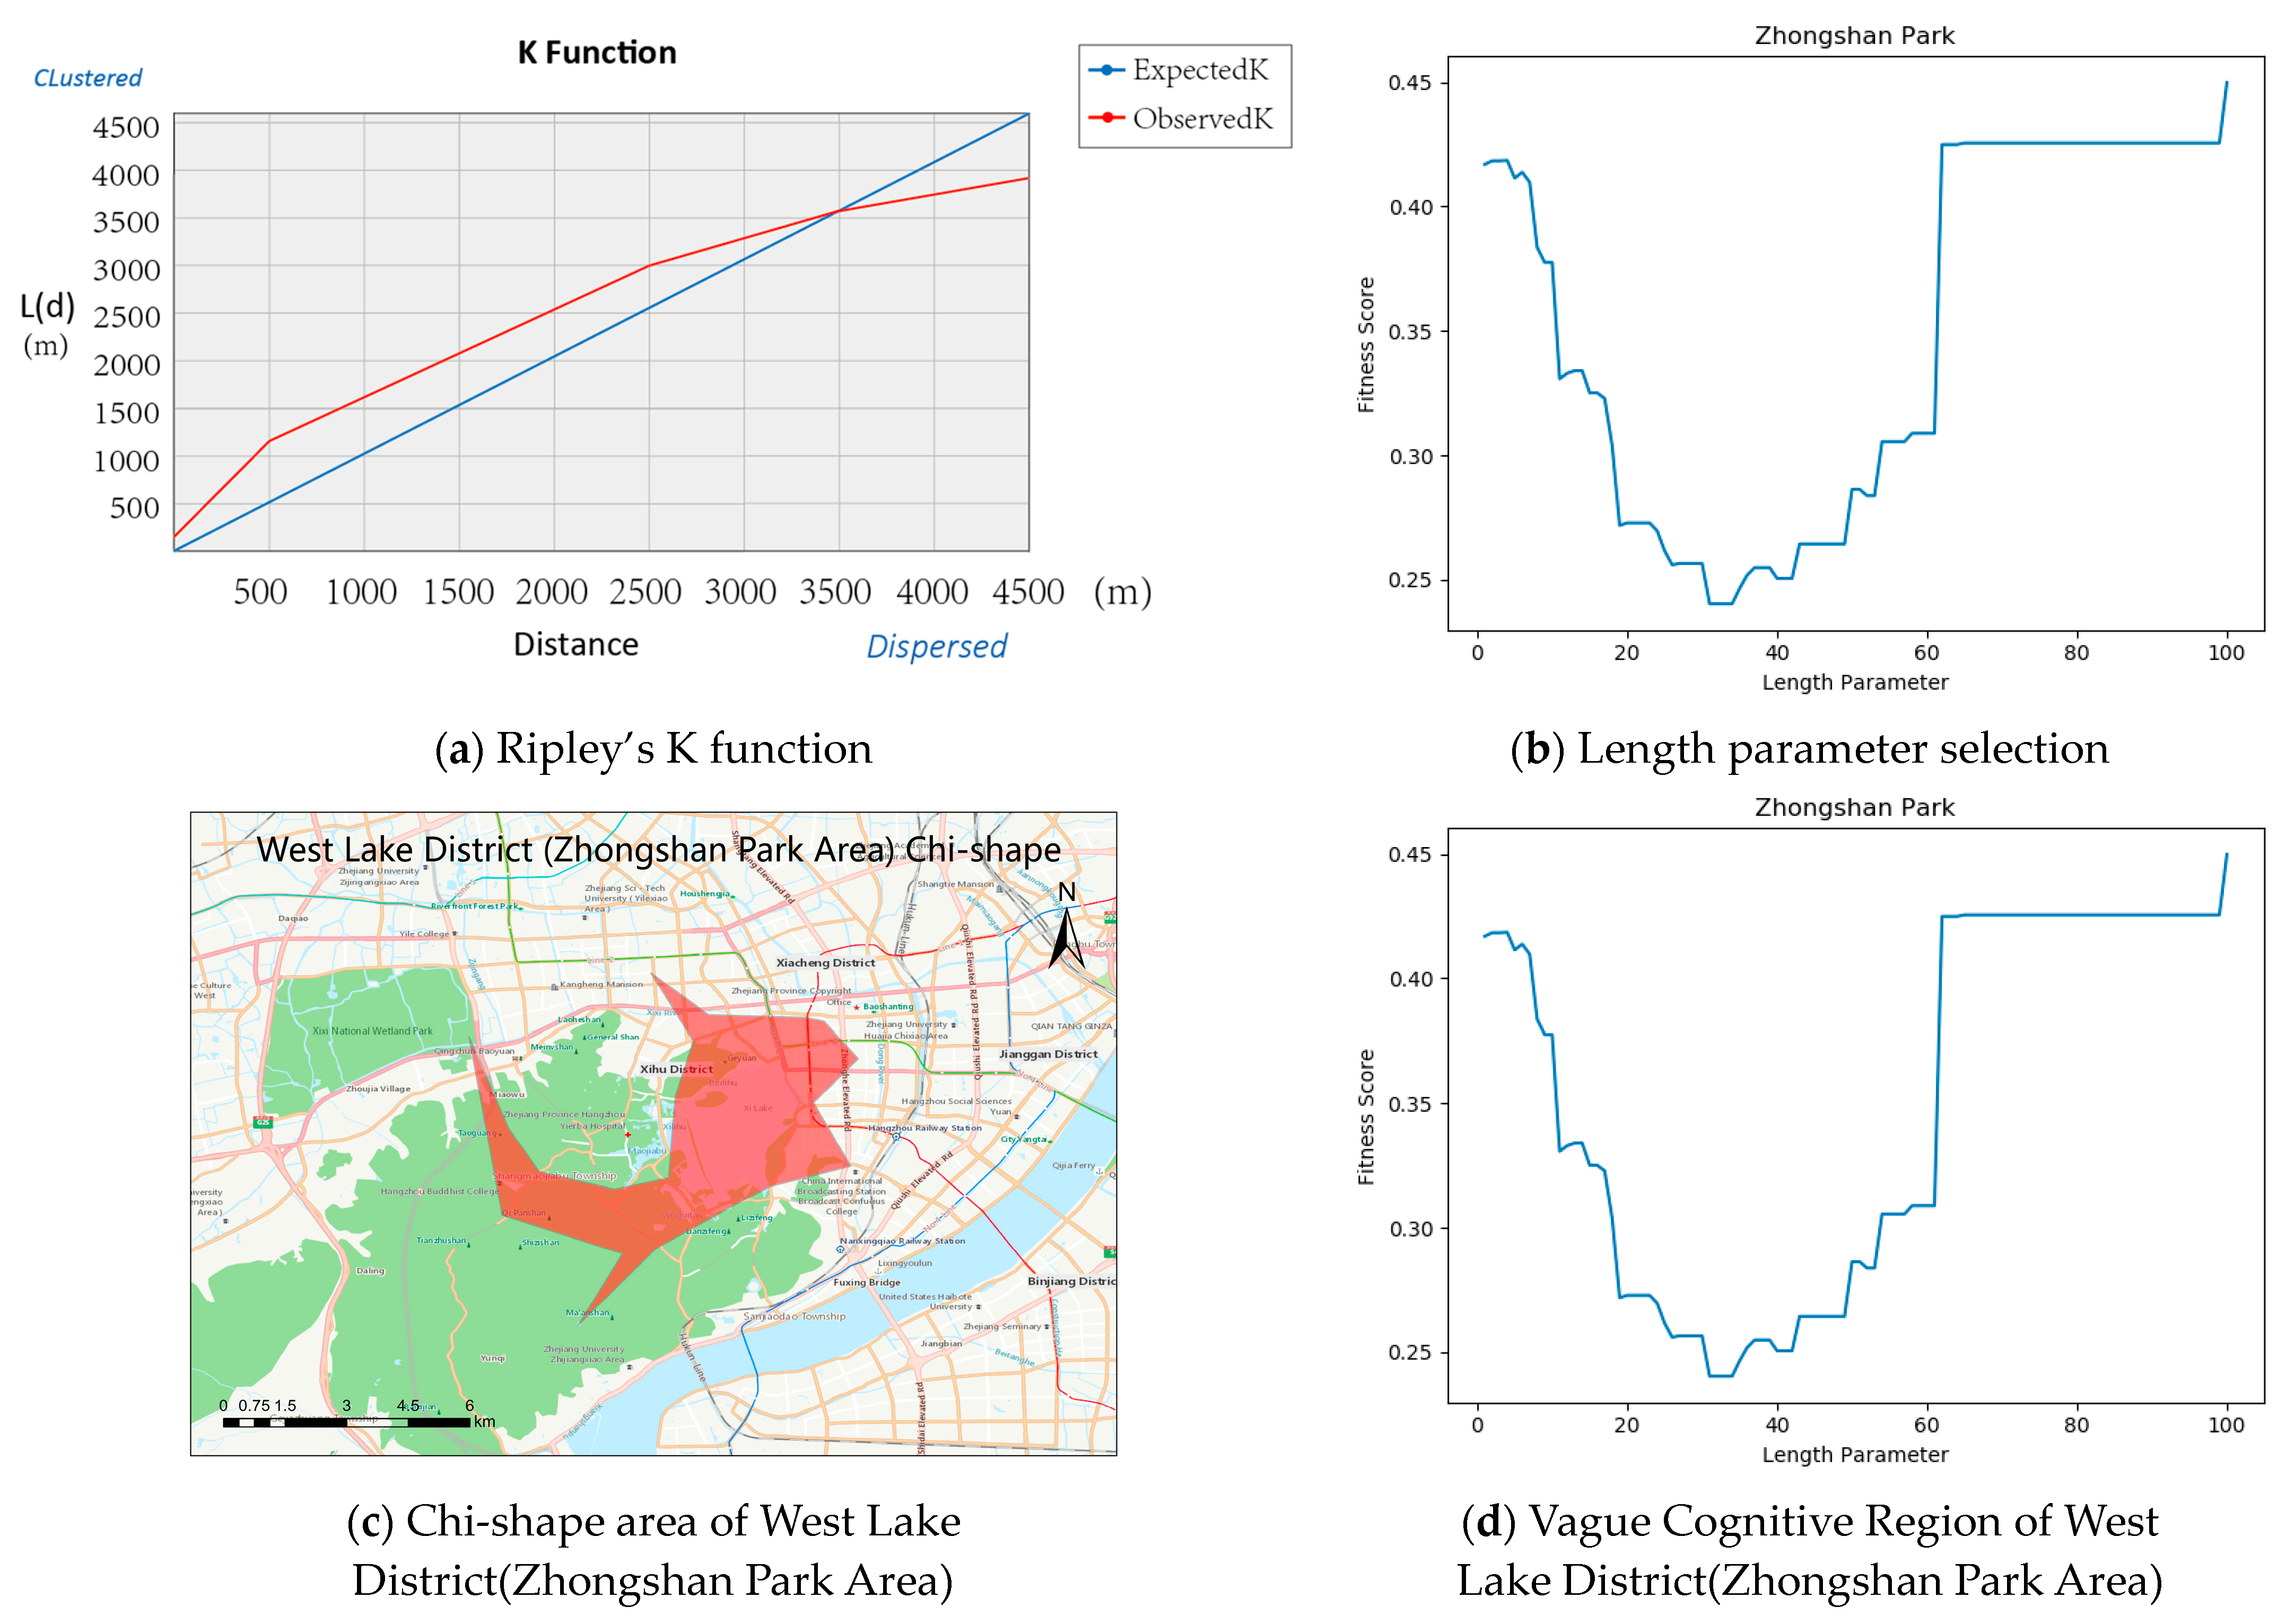
4.2. Tourist Attraction Name Extraction and Multi-Distance Spatial Clustering

Tourist attraction name extraction refers to the process of extracting geographic information related to tourist attractions from text, which can help us to quickly obtain geographic information from the text for further geographic information processing. With the continuous expansion of the geographic database, more and more address names have been added to various platforms and databases. Nowadays, with the rapid development of the tourism industry and the continuous expansion of scenic spots, new toponyms have emerged. In addition, due to an insufficient understanding of the scenic spots by tourists, inaccurate information is often posted on social media. For example, some tourists may use different names to refer to the same scenic spot, such as “Xiaosanya” referring to Jinsha Lake Park; “Xiaoxihu” referring to Zhejiang University Huajia Pond Campus, Xiang Lake and Tongjian Lake; “Xiaohuangshan” referring to Daming Mountain, etc. Some tourists may use the abbreviated names of standard locations to refer to scenic spots, such as “Santaimengji”, “Santan Yingyue”, “Xiasha Qingnianlin” and “Xianrengu” to refer to the West Lake Scenic Region. Some tourists may also use the common names or abbreviations of the scenic spots to represent them, such as “Silk Museum” representing the China Silk Museum, “Academy of Fine Arts” representing the China Academy of Fine Arts and “Nanhu Park” representing Yuhang Nanhu Park, etc. Some tourists even use celebrity names to refer to the scenic spots, such as “Huxueyan” and “Huxueyan old residence” to refer to the former residence of Hu Xueyan, and “Sudongpo” to refer to the Hangzhou Su Dongpo Memorial Hall. This study uses these alternative names, standard abbreviations and designations to expand the address set, which plays a role in expanding the entire address library.
The accuracy indicators of the model in this study include precision, recall and the F1 score, which are used to evaluate the performance of the model. Precision is the ratio of true positives to the total number of predicted positive samples; recall is the ratio of true positives to the total number of actual positive samples; and the F1 score is the harmonic mean of precision and recall.
There may be some false results in the tourist attraction names extracted by the model, so it is necessary to use Ripley’s K function to filter the tourist attraction names that meet clustering conditions. The so-called filtering refers to the removal of false results that are discretely distributed in space. For example, the model may consider “Hangzhou” as a tourist attraction name, but “Hangzhou” as an administrative region name may be mentioned in every location in the study area. Using Ripley’s K function to analyze the model-mistaken “tourist attraction name” of “Hangzhou” through multi-distance spatial clustering analysis, the results are as shown in Figure 5. From Figure 5, it can be seen that the ObservedK value of the name “Hangzhou” is smaller than the ExpectedK value at all spatial scales, indicating that the name is discretely distributed in space. Therefore, we filter out such results whose K values at all defined spatial scales are smaller than the expected values.
We conducted a multidimensional evaluation and analysis of the results before and after filtering based on different methods. The filtering was performed using Ripley’s K function for multi-distance clustering, which eliminated tourist attraction name candidates that did not meet the filtering requirements. After comparing the results before and after filtering using different models, it was found that the precision and F1 value improved significantly after filtering, indicating that the tourist attraction data filtering using Ripley’s K function was meaningful. However, the recall value slightly decreased after filtering because some true tourist attraction names were also filtered out during the process, which is difficult to avoid.
The RoBERTa model is an improvement over the BERT model, as it uses more training data and multiple training strategies during the pre-training phase to improve the overall performance of the model. The optimized model obtained by fine-tuning the pre-trained BERT model shows better performance in various natural language processing tasks, which also improves the performance in the extraction of tourist attraction names.
Table 4 shows the results of extracting tourist attraction addresses using different models, including seven mainstream toponym extraction methods and our method, in both the tourist attraction name data extracted from “Xiaohongshu” texts and its geotagged data. As shown in Table 4, our method has better extraction performance than previous methods. Compared with traditional methods, our method upgrades the BERT model algorithm with better applicability and higher accuracy. Both before and after data filtering, our method achieves good results, with the most significant improvement in the precision value after filtering, and a significant improvement in the F1 value after filtering data. Moreover, the results of the comparison experiments show that the combination of the RoBERTa algorithm with the BiLSTM algorithm and CRF algorithm is better than previous methods such as BERT, indicating that the RoBERTa algorithm can more effectively extract tourist attraction name data from text.
Compared with the BERT+BiLSTM+CRF method, our method has significantly improved the recall and F1 values both before and after data filtering. The precision difference before data filtering was 0.04 and it was 0.02 after filtering, indicating that the precision values are similar between the RoBERTa and BERT models. Compared with the RoBERTa+CRF method, most parameters of our method were greatly improved before and after filtering, proving that the addition of the BiLSTM method in the model is effective. After comparing the RoBERTa+CRF method with the RoBERTa+softmax method, it was found that the recall and F1 values were slightly improved after filtering, while the remaining values were similar, indicating that the addition of the CRF method in the model was effective. Compared with the BiLSTM+CRF method, our method incorporates the RoBERTa model, which greatly improves the precision, recall and F1 values before and after data filtering, proving that the RoBERTa model is highly effective in identifying tourist attraction names. After comparing multiple models, we determined that our adopted method had the best overall performance on most parameters. Therefore, we chose this model method for subsequent experiments.

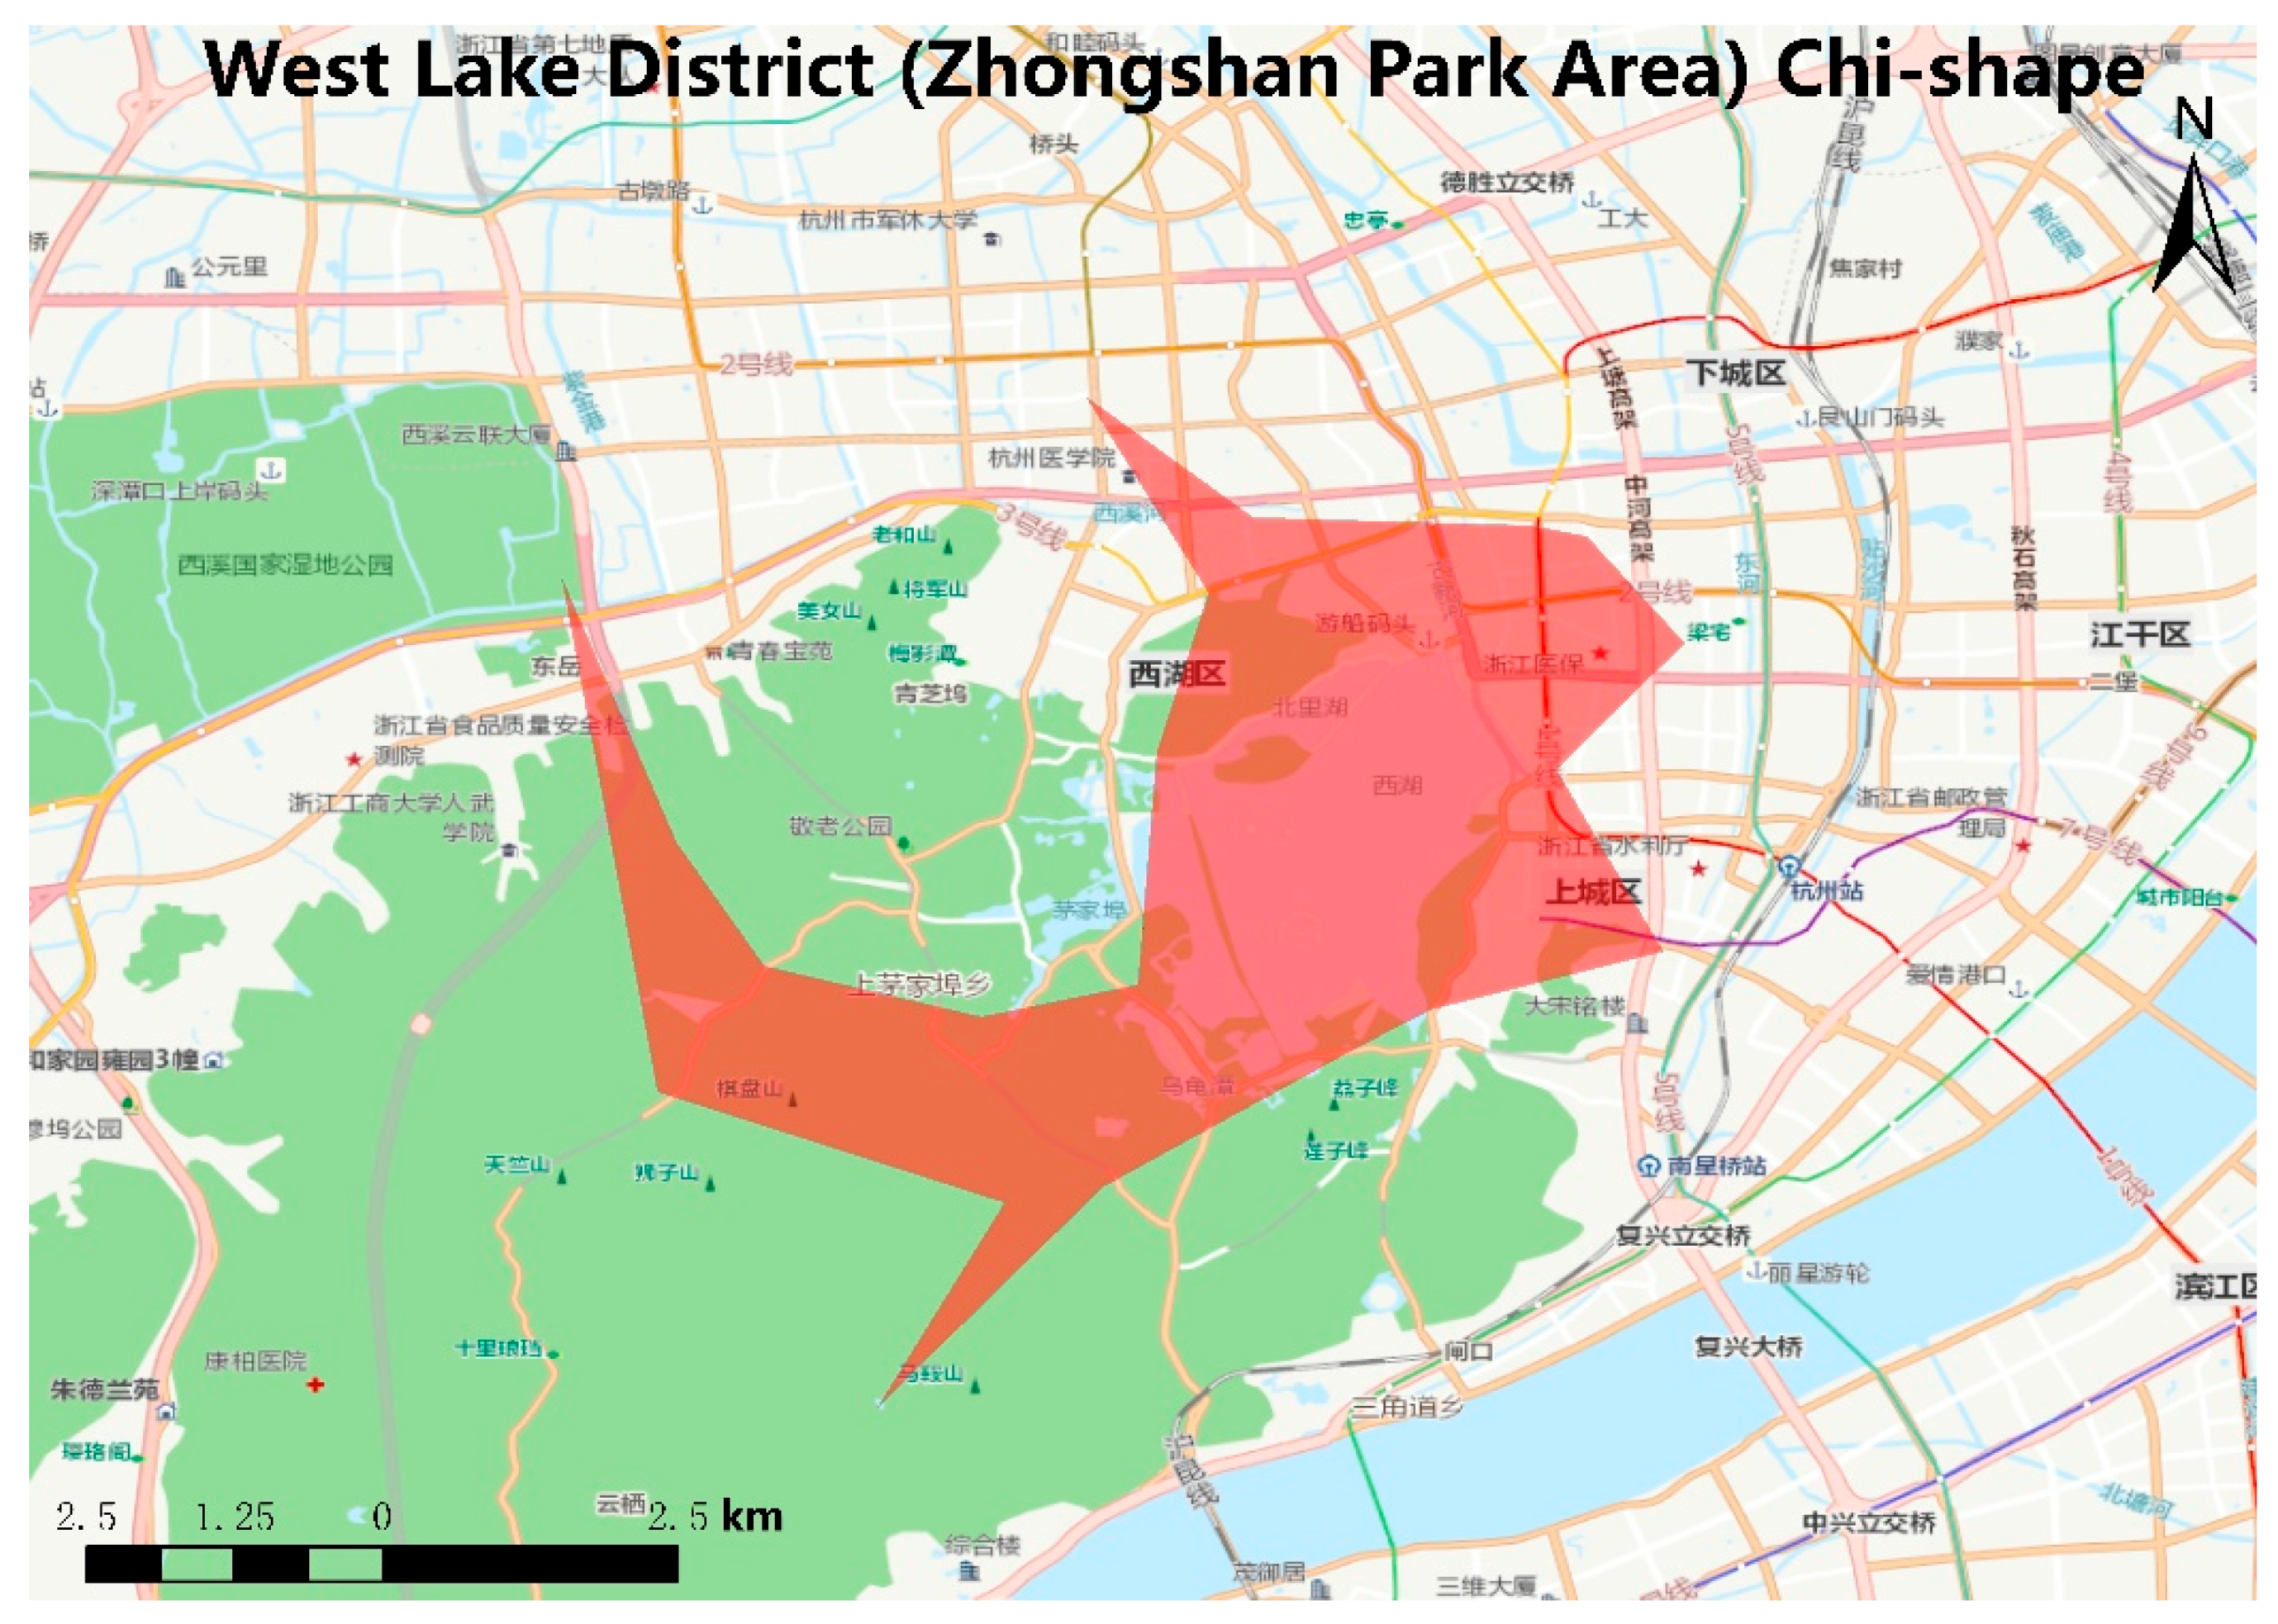
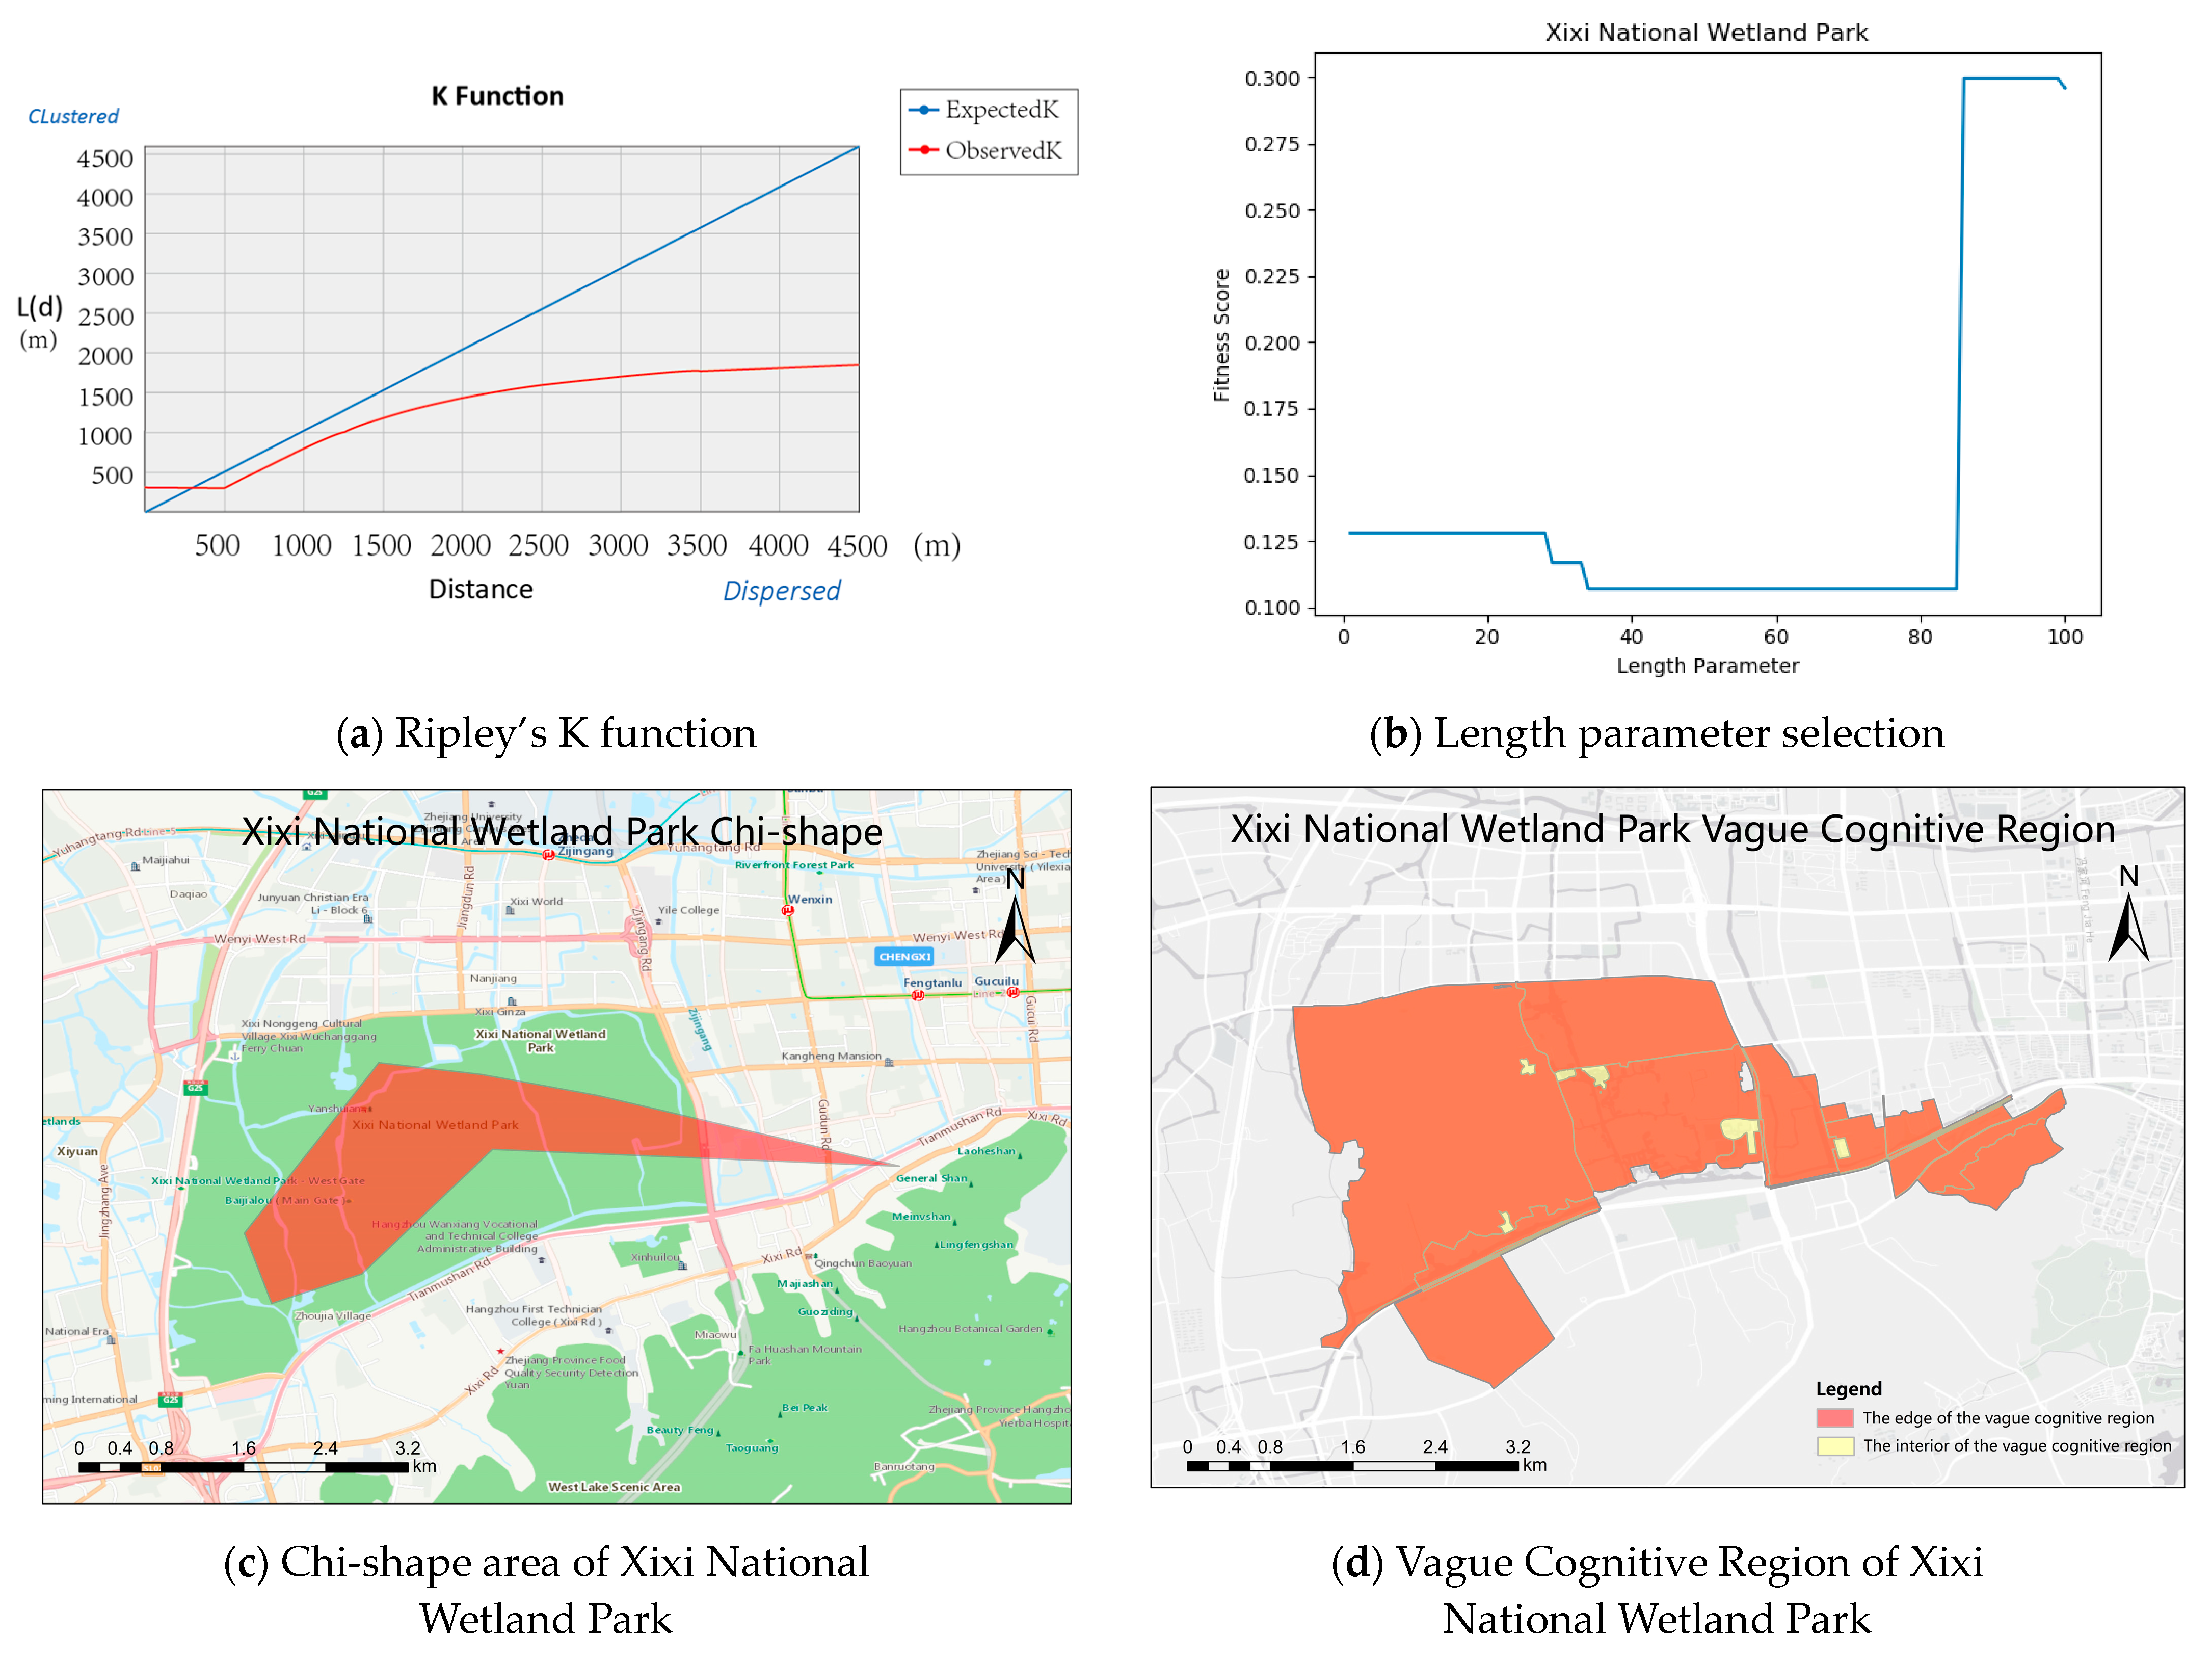
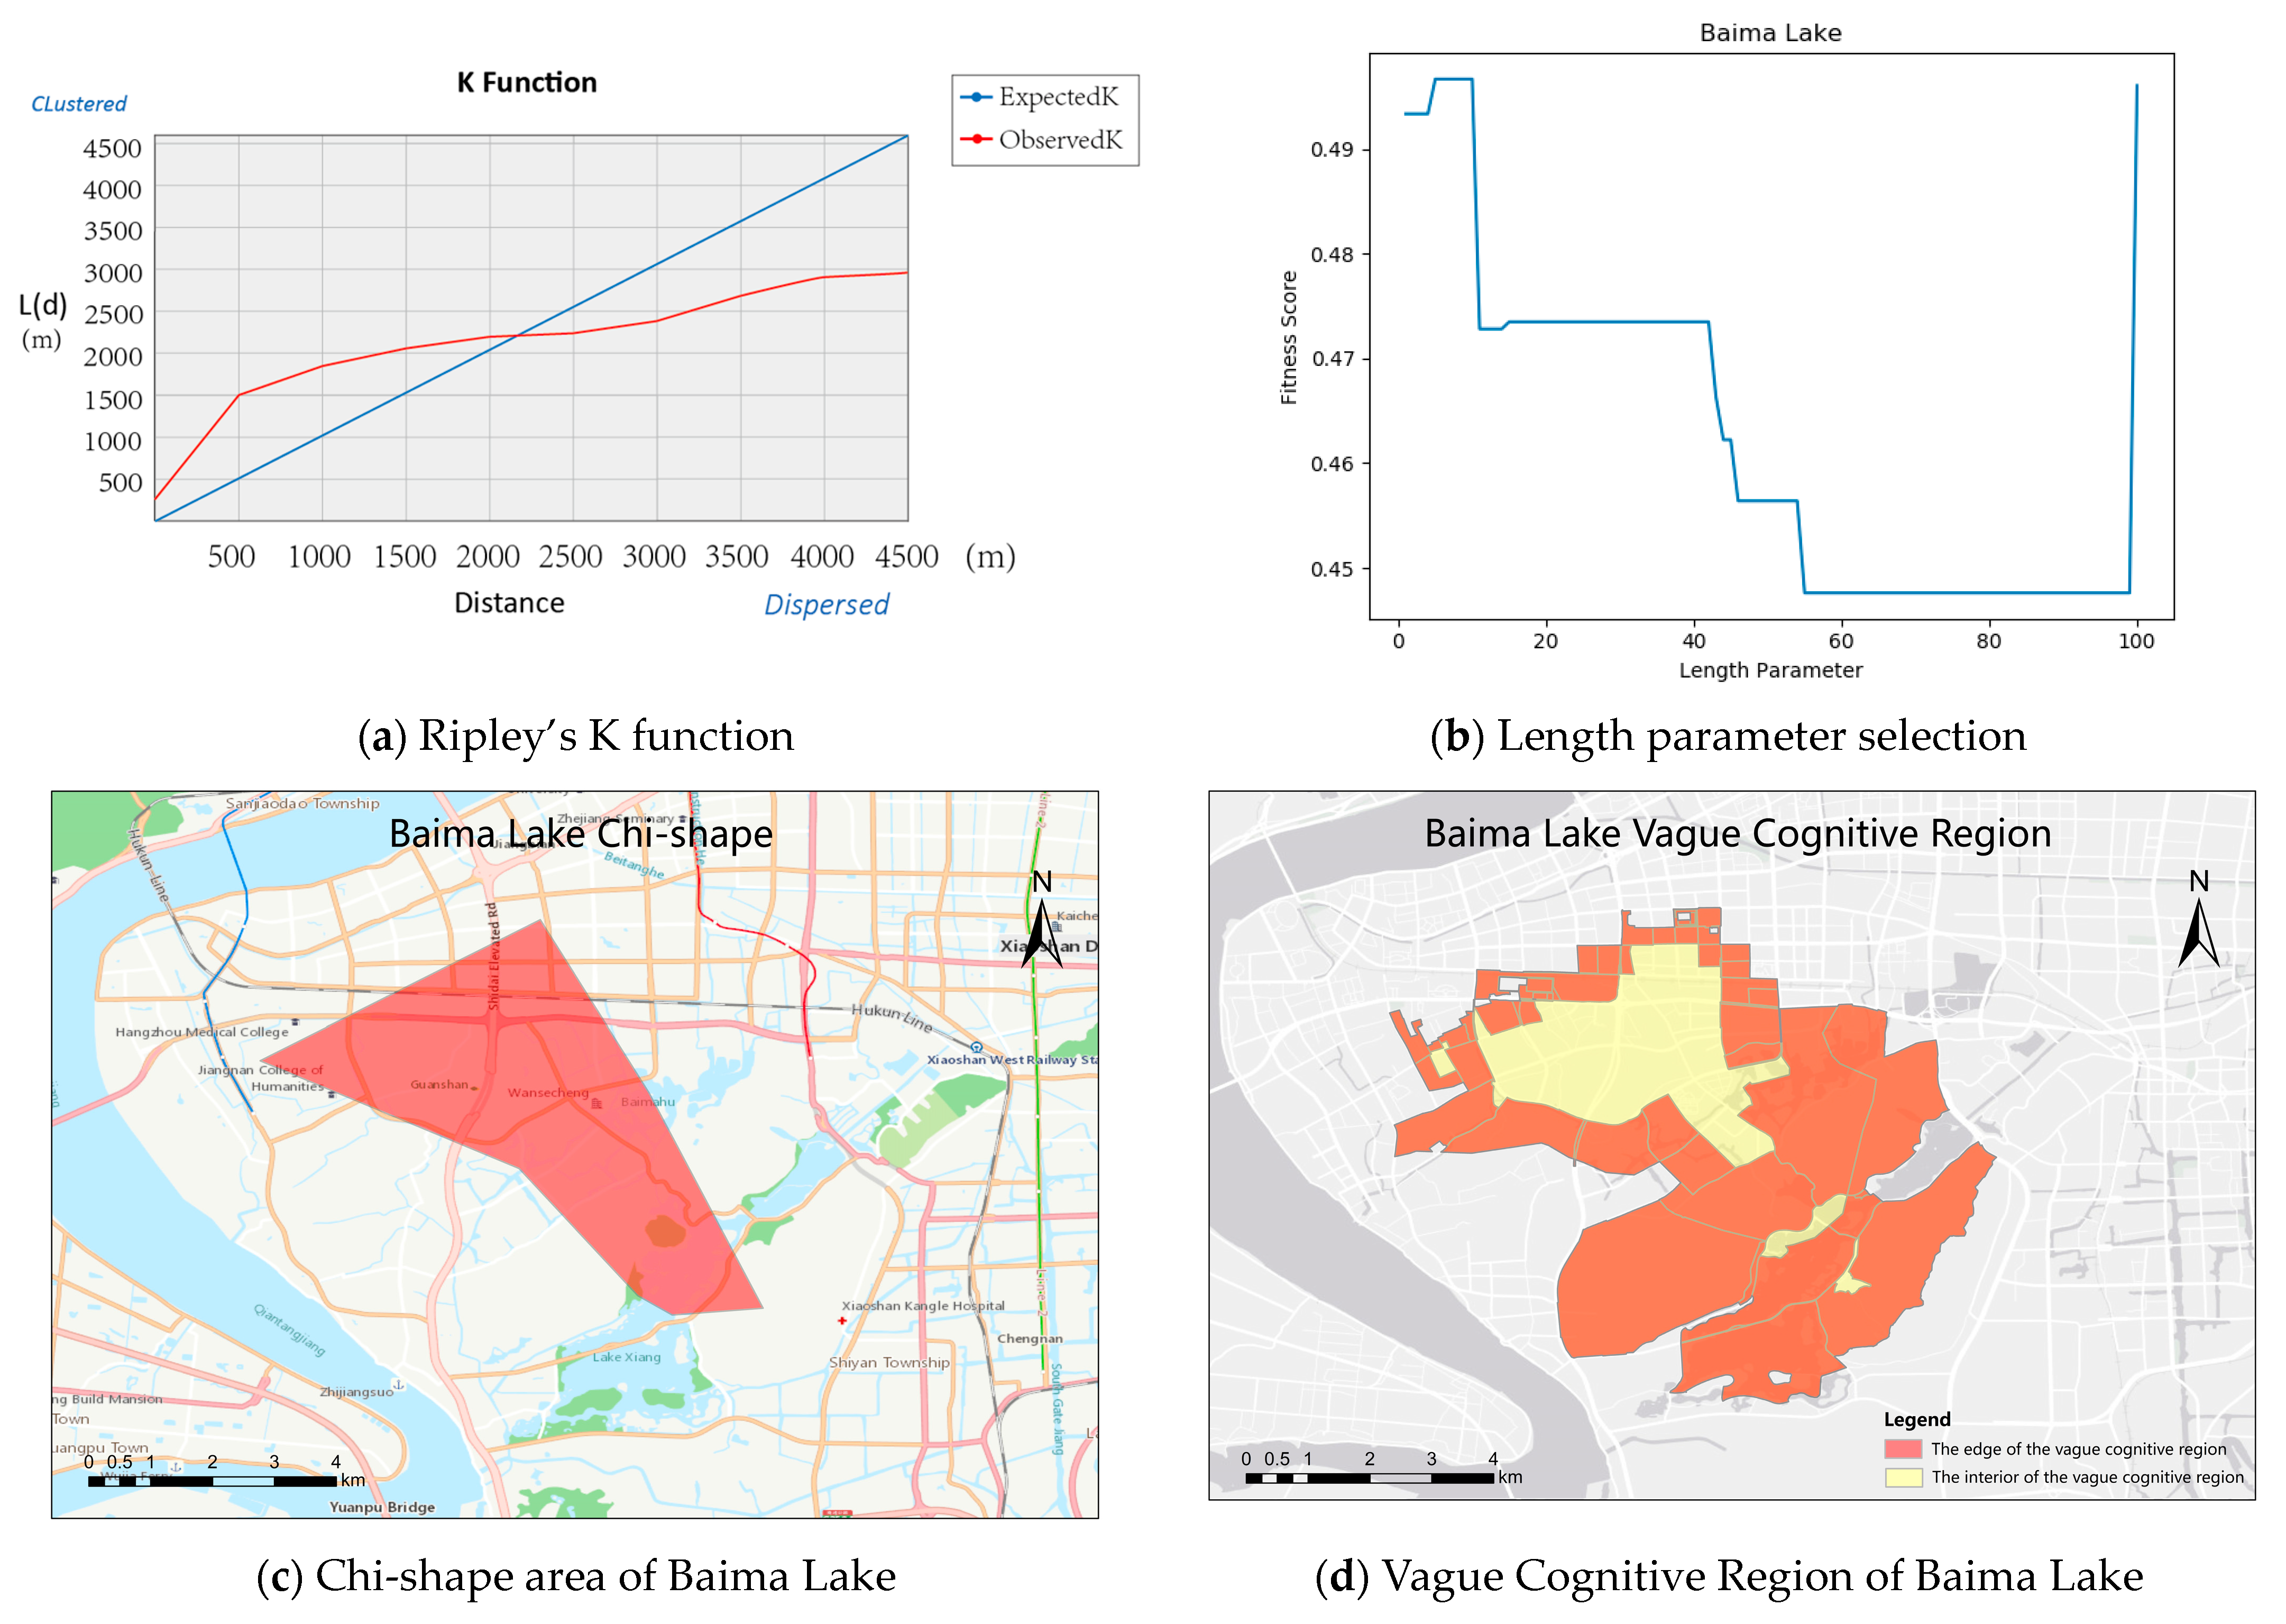
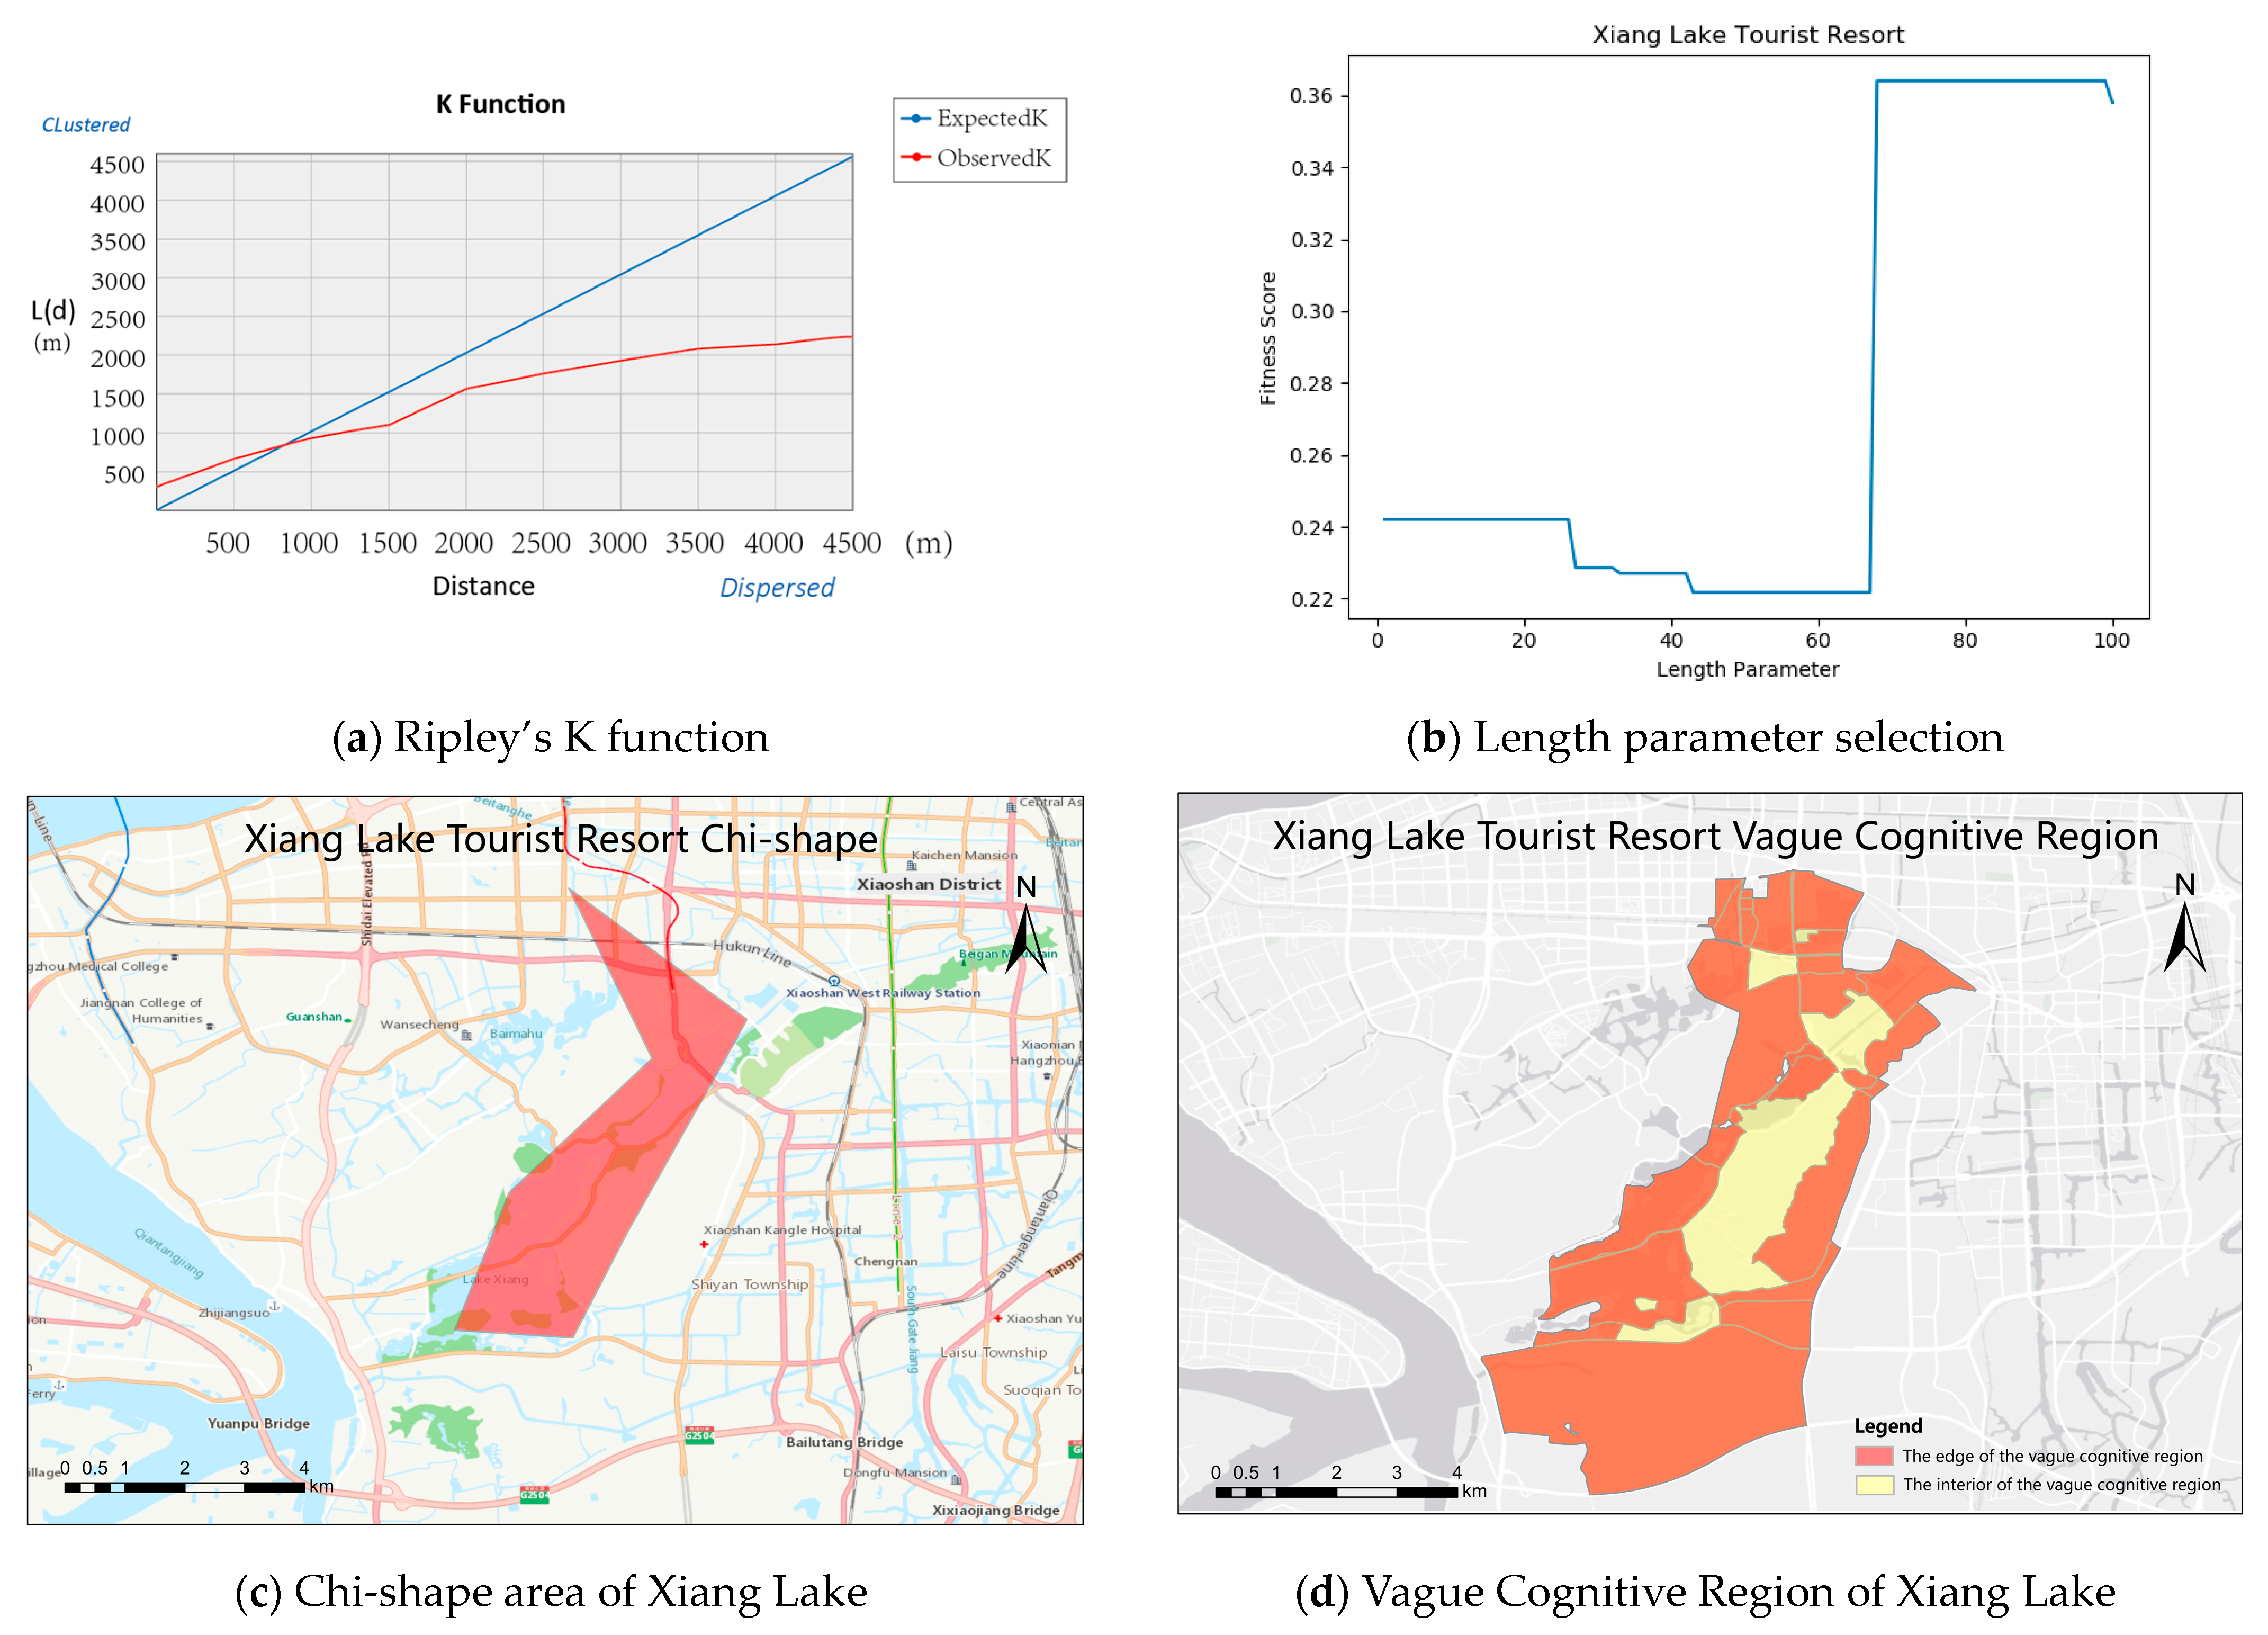
4.3. Generating Chi-Shape Regions Using the Chi-Shape Algorithm

After filtering the tourism attraction name dataset using Ripley’s K function, the remaining data points are considered to be spatially clusterable. However, there are still some outliers in the filtered dataset; for example, some users mention tourist attractions whose actual geographic location is not within the attraction’s range. Therefore, for the filtered dataset, we first exclude attraction names with less than three points. Then, for each point set corresponding to an attraction name, we calculate the centroid of the point set, rank the distance between all points and the centroid and remove the top 25% of points as outliers.
The chi-shape is composed of points based on the cleaned dataset obtained from the above steps, which contains the names of tourist attractions and their corresponding spatial coordinates in the travel notes of Xiaohongshu, as shown in Figure 6.

4.4. Intersection of Chi-Shape Regions and TAZ Regions

Generally speaking, human cognition of regions is closely related to roads. The division of regions cannot be separated from roads. Therefore, based on this, the next step is carried out.
For the study of tourism attractions, we first obtain the road network data from OpenStreetMap and select an appropriate scale of road network. We choose third-level road network data, which include primary and secondary roads as well as smaller roads. Through spatial overlay analysis, feature transformation and other operations, we finally generate Traffic Analysis Zone (TAZ) regions for tourism attractions, as shown in Figure 7. We take the intersection of the chi-shape and the TAZ corresponding to the study area as the interior of the vague cognitive region (shown as the yellow area in Figure 8). Due to the complexity of the road network, in order to make the final result more aesthetically pleasing and to demonstrate the relationship between our results and the TAZ, we first extract the names of the outer tourist attractions that determine the shape of the chi-shape, and then take the TAZ regions where these points are located as the outer edges of the vague cognitive region (shown as the red area in Figure 8). The term “vague” originates from the definition of vague boundaries in previous studies on geographic regions, which means that in addition to administrative regions that can be accurately described by geometric shapes, geographic regions usually have boundaries that are more or less vague [34].

4.5. Experimental Results and Analysis of Vague Block Extraction in Different Scenic Regions

The experimental results of vague cognitive region extraction in multiple well-known scenic regions in Hangzhou are shown in the following figures.
Experimental Results and Analysis of Cognitive Region Extraction in West Lake (Zhongshan Park Area)
Firstly, the tourist attraction name dataset obtained by the model was filtered and analyzed using Ripley’s K function. As shown in Figure 9a, the blue line represents the expected K value. When the red curve is above the blue line, it indicates that the point set of tourist attraction addresses is clustered. It is found that within the distance range of 0–3600 m, the West Lake tourist attraction is clustered.
Secondly, the range for selecting the length parameter was found based on the fitness function. As shown in Figure 9b, when the length parameter was 3 or 63 and above, the fitness value reached a higher level. According to the definition of the fitness function, the smaller the parameter value, the closer the obtained point set was to the original one, indicating a higher degree of restoration. Therefore, a chi-shape area was established with a length parameter of 3.
From the final generated cognitive region of the West Lake Scenic Region, it can be seen that the region covers well-known attractions and also includes commercial regions such as Hubin Yintai. Compared to the traditional cognitive region of the West Lake Scenic Region, the cognitive region that we extracted had a smaller coverage region. Most of the attractions in the southwest direction are forest landscapes, and the surrounding entertainment and transportation facilities are not very complete, resulting in lower traffic and a shorter number of articles. Overall, the West Lake cognitive region obtained using our method is more in line with people’s current cognition of the West Lake Scenic Region. The trend of integrating commercial regions into the scenic region also indicates the future development trend of scenic regions. The integration of business and travel may become a future development trend.
Experimental Results and Analysis of Cognitive Region Extraction in Xixi National Wetland Park
Firstly, the address dataset obtained by the model was filtered and analyzed using Ripely’s K function. As shown in Figure 10a, it is found that within a distance range of 0–295 m, the West Lake tourist attraction addresses are clustered.
In the second step, the range of selection for the length parameter was found based on the fitness function. As shown in Figure 10b, the fitness value is high when the length parameter is 86 or above. According to the definition of the fitness function, the smaller the parameter value, the closer the obtained point set is to the original point set, which means a higher degree of restoration. Therefore, a chi-shape area was established with a length parameter of 86.
From the generated cognitive region of the Xixi Wetland Scenic Region, it can be observed that the region covers almost all parts of the Xixi Wetland Scenic Region with high accuracy. It is worth noting that the protruding region in the east is not traditionally considered part of the Xixi Wetland Scenic Region. However, careful observation reveals that it is composed of the surrounding subway routes, nearby tourist attractions and some parking regions. Nowadays, more and more people travel, and locations with convenient transportation and accommodation are more popular. People also include them as part of the scenic region. Overall, the method that we adopted resulted in a more accurate cognitive region, revealing the conditions for the layout of the scenic spots. This indicates that a necessary condition for the future development of scenic regions is good transportation conditions, and the trend of integrating transportation and scenic regions will gradually deepen, with the transportation network and routes driving the expansion and development of the scenic regions.
Experimental Results and Analysis of Cognitive Region Extraction in Baima Lake
Firstly, the address dataset obtained by the model was screened and analyzed using Ripely’s K function. As shown in Figure 11a, it was found that the West Lake tourist attraction is clustered within the distance range of 0–2200 m.
In the second step, the range of length parameter selection was found according to the fitness function. As shown in Figure 11b, the fitness reached the highest value when the length parameter was between 5 and 9. According to the definition of the fitness function, the smaller the parameter value, the closer the obtained address point set is to the original point set, i.e., the higher the degree of restoration. Therefore, a chi-shape area was established with a length parameter of 5.
The resulting cognitive region of the Baima Lake Scenic Region is generally dispersed. It is not difficult to find that the transportation network and water network overlap within the cognitive region of the Baima Lake Scenic Region, which causes the cognitive region to be discontinuous. According to historical literature, since its establishment, the regional government of the Baima Lake Scenic Region has developed its economy and construction with the concept of “one city and four districts”. Therefore, the Baima Lake Scenic Region is composed of multiple districts and scenic spots. Due to the dispersion of the region, the final cognitive region also shows a dispersed situation. It is worth noting that the cognitive region in the southeast direction is relatively far from the main cognitive region, which is a tourist region formed in recent years by combining small scenic spots and sites. From the cognitive region of the Baima Lake Scenic Region, it can be seen that the extension to the southeast is more extensive, while the cognitive region of the other parts is more concentrated. Overall, the resulting cognitive region of the Baima Lake Scenic Region is also relatively accurate. At the same time, it can be seen that the construction and expansion of the scenic region is not only influenced by commerce and transportation, but also by regional government policies.
Experimental Results and Analysis of Cognitive Region Extraction in Xiang Lake
Firstly, the address dataset obtained from the model was filtered and analyzed using Ripley’s K function. As shown in Figure 12a, it is found that within the distance of 0–800 m, the Xiang Lake tourist attractions can be clustered.
Secondly, the range of length parameter selection was found based on the fitness function. As shown in Figure 12b, when the length parameter was above 68, the fitness reached the highest value. According to the definition of the fitness function, the smaller the parameter value, the closer the obtained address point set is to the original point set, i.e., the higher the degree of restoration. Therefore, a chi-shape area was established with a length parameter of 68.
Compared with other tourist attractions, the generated vague perception region of the Xiang Lake Scenic Region as a 4A-level scenic area is closer to the government-defined Xiang Lake Scenic Region. Regarding the classification of scenic spots in China, Chinese 5A-level scenic areas are the highest-rated tourist attractions designated by the National Tourism Administration, featuring world-class natural and cultural landscapes. Chinese 4A-level scenic areas also hold a prominent position among domestic tourist attractions, though slightly lower than the 5A-level ones. Both are among China’s most well-known scenic areas and enjoy a strong reputation and recognition both domestically and internationally. After comparing it with the actual region and understanding the surrounding environment of the region, it was found that as a 4A-level tourist attraction in China, the Xiang Lake Resort Scenic Region, although not large in scale, is sufficient to become the commercial core circle of the region, and there are a few similar scenic regions that can generate another commercial tourist circle. On the contrary, the small scenic spots distributed around it, although not listed as scenic spots in the Xiang Lake Scenic Region, exist as small scenic spots attached to the Xiang Lake Resort Scenic Region. In the case of an insufficient understanding the situation, tourists will unconsciously regard them as part of the Xiang Lake Resort Scenic Region and visit them for photo-taking. In other words, tourists will unconsciously regard the small scenic spots attached to Xiang Lake as part of the Xiang Lake Resort Scenic Region, so the cognitive region of the Xiang Lake Scenic Region will be slightly larger than the actual cognitive region. However, the scale of these small scenic spots is small, and they have little impact on the formation of the overall cognitive region. It can be inferred that tourists’ subjective cognition also has an impact on the final generated cognitive region of the scenic area. Overall, the generated cognitive region of the Xiang Lake Scenic Region is very similar to the actual cognitive region, proving that the effect extracted by our experiment is good.

4.6. Experiment Discussion

Firstly, the final generated cognitive region of the West Lake Scenic Region includes well-known attractions and commercial regions. Compared to the traditional cognitive region of the West Lake Scenic Region, the cognitive region that we extracted has a smaller coverage area. Most of the attractions in the southwest direction are forest landscapes, and the surrounding entertainment and transportation facilities are relatively incomplete, resulting in lower traffic and fewer articles. Overall, the cognitive region of West Lake obtained using our method aligns more with people’s current perception of the scenic region. The trend of integrating commercial regions into the scenic region also indicates the future development direction of scenic regions. The integration of business and tourism may become a future development trend.
Next, the generated cognitive region of the Xixi Wetland Scenic Region accurately covers almost all parts of the area, including a protruding region in the east that is not traditionally considered part of the scenic region. However, careful observation reveals that it includes surrounding subway routes, nearby tourist attractions and parking regions, which are considered convenient for travelers. This indicates that good transportation conditions are a necessary condition for the future development of scenic regions, and the integration of transportation and scenic regions will deepen, with transportation networks driving the expansion and development of scenic regions.
Subsequently, the cognitive region of the Baima Lake Scenic Region is generally dispersed and discontinuous due to the crisscrossing transportation and water networks. It is composed of multiple districts and scenic spots, resulting in a dispersed cognitive region. The southeast direction shows a relatively distant tourist region formed by combining small scenic spots and sites. The cognitive region is more extensive in the southeast, while other parts are more concentrated. The construction and expansion of the scenic region are influenced not only by commerce and transportation, but also by regional government policies. Overall, the resulting cognitive region is relatively accurate, indicating the impact of various factors on the development of the Baima Lake Scenic Region.
Finally, the Xiang Lake Scenic Region has a vague perception region that is closer to the government-defined Xiang Lake Scenic Region compared to other tourist attractions. The Xiang Lake Resort Scenic Region is sufficient to become the commercial core circle of the region, with small scenic spots attached to it that tourists often unconsciously regard as part of the Xiang Lake Resort Scenic Region. These small scenic spots have little impact on the overall cognitive region, but tourists’ subjective cognition does affect the generated cognitive region of the scenic area. Overall, the experiment shows that the generated cognitive region of the Xiang Lake Scenic Region is similar to the actual cognitive region, indicating good results.

5. Conclusions and Future Work

The vast amount of tourism attraction name data generated by social media use during travel makes it possible to shape people’s perceptions of a region using these data. This paper proposes a new method for generating vague perception regions of tourist attractions based on the tourism attraction name data uploaded by travelers on social media. First, tourism attraction names are extracted based on tourism note text on social media using the proposed name entity extraction model for tourist attraction names. Then, spatial clustering is applied to the tourism attraction name data for filtering, and the chi-shape algorithm is used to construct the initial vague perception region of the tourist attraction by constructing the minimum boundary geometry of the extracted tourism attraction name points. Finally, the refined Traffic Analysis Zone (TAZ) data are introduced into the study area and the chi-shape result map is intersected to obtain the final vague cognition region of the tourist attraction.
After studying the vague perception regions of several well-known tourist attractions in Hangzhou, we ultimately selected four tourist attractions as representative results. Overall, we achieved good results in obtaining the final vague perception regions using tourism attraction name data on social media, which is an effective method for the study area. In conclusion, this study proposes a new data usage and modeling method based on social media attraction name data to obtain vague perception regions corresponding to the names, enriches research in related fields and provides a reference for urban region planning.
At the same time, our research also has certain limitations, such as the relatively singular source of data, not using data from other social media and not considering the changes in the data over time. We did not extract and evaluate the temporal characteristics of the data. We also had less coverage of different age groups; the age of users using Xiaohongshu is mostly 20 to 35 years old, so the amount of data from teenagers and older users is relatively small.
Future research can consider using more data from other social media platforms to explore whether the results generated will be different. It can also introduce influence factors besides TAZ to obtain the final results, so as to explore differences in the results obtained with different influence factors.
In addition, the model and methodology of this study have some potential applications. The results of the experiment can help the government to better carry out the spatial planning of scenic areas. For example, government managers can achieve the optimal layout of tourism facilities and commercial layouts within the panorama area based on the results. On the other hand, the transportation network and building distribution in the buffer zone outside the tourist attractions can also be optimized. Moreover, the government can also plan the scenic area’s scope and land use based on the results of our research.

Author Contributions

Conceptualization: Chengkun Zhang, Yiran Zhang, Xinyu Zheng, Xingyu Xue, Yuanyuan Wang and Liuchang Xu; Methodology: Yiran Zhang, Hongjiu Liu, Tao He and Liuchang Xu; Investigation: Junwei Yao and Jing Yang; Data curation: Jiajun Zhang and Junwei Yao; Writing—original draft: Chengkun Zhang, Yiran Zhang and Liuchang Xu; Writing—review & editing: Liang Xu, Yuanyuan Wang and Liuchang Xu; Visualization: Jiajun Zhang and Liuchang Xu. All authors have read and agreed to the published version of the manuscript.

Funding

This research was funded by the National Natural Science Foundation of China, Grant No. 42050103, 42001354; the Natural Science Foundation of Zhejiang Province, Grant No. LGG22D010001, LQ19D010011, LY18G010005, LY17G020025; the Scientific Research Fund of Zhejiang Provincial Education Department, Grant No. Y202147381; the Humanity and Social Science Foundation of Ministry of Education of China, Grant No. 18YJA630030, 21YJA630054; and the Zhejiang Philosophy and Social Science Program of China, Grant No. 17NDJC262YB, 19NDJC240YB.

Informed Consent Statement

Not applicable.

Data Availability Statement

The data used to support the findings of this study are available from the corresponding author upon request.

Acknowledgments

The authors would like to thank the editor and the reviewers for their contributions.

Conflicts of Interest

The authors declare no conflict of interest. The funders had no role in the design of the study; in the collection, analysis, or interpretation of data; in the writing of the manuscript; or in the decision to publish the results.

References

  1. Rather, R.A.H.L.; Rasoolimanesh, S.M. First-time versus repeat tourism customer engagement, experience, and value cocreation: An empirical investigation. J. Travel Res. 2022, 61, 549–564. [Google Scholar] [CrossRef]
  2. Trupp, A.; Pratt, S.; Stephenson, M.L.; Matatolu, I.; Gibson, D. Representing and evaluating the travel motivations of Pacific islanders. Int. J. Tour. Res. 2022, 24, 653–666. [Google Scholar] [CrossRef]
  3. Jauhari, A.A.D.R. Analysis of Clusters Number Effect Based on K-Means Method for Tourist Attractions Segmentation. In Journal of Physics: Conference Series; IOP Publishing: Tokyo, Japan, 2022; Volume 2406, p. 012024. [Google Scholar]
  4. Shabani, A.; Keshavarz, H. Media Literacy and Social Media Information. Glob. Knowl. Mem. Commun. 2022, 71, 413–431. [Google Scholar] [CrossRef]
  5. Niu, H.; Silva, E.A. Understanding temporal and spatial patterns of urban activities across demographic groups through geotagged social media data. Comput. Environ. Urban Syst. 2023, 100, 101934. [Google Scholar] [CrossRef]
  6. Akdeniz, E.; Borschewski, K.; Breuer, J.; Voronin, Y. Sharing social media data: The role of past experiences, attitudes, Sharing social media data: The role of past experiences, attitudes, norms, and perceived behavioral control. Front. Big Data 2023, 5, 971974. [Google Scholar] [CrossRef]
  7. Devlin, J.; Chang, M.; Lee, K.; Toutanova, K. Bert: Pre-training of deep bidirectional transformers for language understanding. arXiv 2018, arXiv:1810.04805. [Google Scholar]
  8. Liu, X.; Huang, Q.; Gao, S.; Xia, J. Activity knowledge discovery: Detecting collective and individual activities with digital footprints and open source geographic data. Comput. Environ. Urban Syst. 2021, 85, 101551. [Google Scholar] [CrossRef]
  9. Zhang, C.; Xu, L.; Yan, Z.; Wu, S. A GloVe-Based POI Type Embedding Model for Extracting and Identifying Urban Functional Regions. ISPRS Int. J. Geo-Inf. 2021, 10, 372. [Google Scholar] [CrossRef]
  10. Jones, C.B.; Purves, R.S.; Clough, P.D.; Joho, H. Modelling vague places with knowledge from the Web. Int. J. Geogr. Inf. Sci. 2008, 22, 1045–1065. [Google Scholar] [CrossRef]
  11. Clough, P.; Pasley, R. Images and perceptions of neighbourhood extents. In Proceedings of the 6th Workshop on Geographic Information Retrieval, Zurich, Switzerland, 18–19 February 2010. [Google Scholar]
  12. Montello, D.R.; Goodchild, M.F.; Gottsegen, J.; Fohl, P. Where’s downtown? Behavioral methods for determining referents of vague spatial queries. Spat. Cogn. Comput. 2003, 3, 185–204. [Google Scholar]
  13. Leidner, J.L.; Lieberman, M.D. Detecting geographical references in the form of place names and associated spatial natural language. Sigspatial Spec. 2011, 3, 5–11. [Google Scholar] [CrossRef]
  14. Medway, D.; Warnaby, G. What’s in a name? Place branding and toponymic commodification. Env. Plann A 2014, 46, 153–167. [Google Scholar] [CrossRef]
  15. Zhang, W.; Gelernter, J. Geocoding location expressions in Twitter messages: A preference learning method. J. Spat. Inf. Sci. 2014, 9, 37–70. [Google Scholar]
  16. De Bruijn, J.A.; de Moel, H.; Jongman, B.; de Ruiter, M.C.; Wagemaker, J.; Aerts, J.C. A global database of historic and real-time flood events based on social media. Sci. Data 2019, 6, 311. [Google Scholar] [CrossRef] [PubMed]
  17. McKenzie, G.; Liu, Z.; Hu, Y.; Lee, M. Identifying urban neighborhood names through user-contributed online property listings. ISPRS Int. J. Geo-Inf. 2018, 7, 388. [Google Scholar] [CrossRef]
  18. Lai, J.; Lansley, G.; Haworth, J.; Cheng, T. A name-led approach to profile urban places based on geotagged Twitter data. Trans. GIS 2020, 24, 858–879. [Google Scholar] [CrossRef]
  19. Hu, Y.; Mao, H.; McKenzie, G. A natural language processing and geospatial clustering framework for harvesting local place names from geotagged housing advertisements. Int. J. Geogr. Inf. Sci. 2019, 33, 714–738. [Google Scholar] [CrossRef]
  20. Karimzadeh, M.; Pezanowski, S.; MacEachren, A.M.; Wallgrün, J.O. GeoTxt: A scalable geoparsing system for unstructured text geolocation. Trans. GIS 2019, 23, 118–136. [Google Scholar] [CrossRef]
  21. Won, M.; Murrieta-Flores, P.; Martins, B. ensemble named entity recognition (ner): Evaluating ner Tools in the identification of Place names in historical corpora. Front. Digit. Humanit. 2018, 5, 2. [Google Scholar] [CrossRef]
  22. Aldana-Bobadilla, E.; Molina-Villegas, A.; Lopez-Arevalo, I.; Reyes-Palacios, S.; Muñiz-Sanchez, V.; Arreola-Trapala, J. Adaptive Geoparsing Method for Toponym Recognition and Resolution in Unstructured Text. Remote Sens. 2020, 12, 3041. [Google Scholar] [CrossRef]
  23. Davari, M.; Kosseim, L.; Bui, T.D. Toponym Identification in Epidemiology Articles-A Deep Learning Approach. arXiv 2019, arXiv:1904.11018. [Google Scholar]
  24. Molina-Villegas, A.; Muñiz-Sanchez, V.; Arreola-Trapala, J.; Alcántara, F. Geographic Named Entity Recognition and Disambiguation in Mexican News using word embeddings. Expert Syst. Appl. 2021, 176, 114855. [Google Scholar] [CrossRef]
  25. Wang, S.; Zhang, X.; Ye, P.; Du, M. Deep belief networks based toponym recognition for Chinese text. ISPRS Int. J. Geo-Inf. 2018, 7, 217. [Google Scholar] [CrossRef]
  26. Hu, X.; Al-Olimat, H.S.; Kersten, J.; Wiegmann, M.; Klan, F.; Sun, Y.; Fan, H. GazPNE: Annotation-free deep learning for place name extraction from microblogs leveraging gazetteer and synthetic data by rules. Int. J. Geogr. Inf. Sci. 2022, 36, 310–337. [Google Scholar] [CrossRef]
  27. Wang, J.; Hu, Y.; Joseph, K. NeuroTPR: A neuro-net toponym recognition model for extracting locations from social media messages. Trans. GIS 2020, 24, 719–735. [Google Scholar] [CrossRef]
  28. Cadorel, L.; Blanchi, A.; Tettamanzi, A.G. Geospatial Knowledge in Housing Advertisements: Capturing and Extracting Spatial Information from Text. In Proceedings of the 11th on Knowledge Capture Conference, Virtual, 2–3 December 2021. [Google Scholar]
  29. Kew, T.; Shaitarova, A.; Meraner, I.; Goldzycher, J.; Clematide, S.; Volk, M. Geotagging a Diachronic Corpus of Alpine Texts: Comparing Distinct Approaches to Toponym Recognition. In Proceedings of the Workshop on Language Technology for Digital Historical Archives in Conjuction with RANLP, Varna, Bulgaria, 5 September 2019. [Google Scholar]
  30. Liu, H.; Qiu, Q.; Wu, L.; Li, W.; Wang, B.; Zhou, Y. Few-shot learning for name entity recognition in geological text based on GeoBERT. Earth Sci. Inform. 2022, 15, 979–991. [Google Scholar] [CrossRef]
  31. Ma, K.; Tan, Y.; Xie, Z.; Qiu, Q.; Chen, S. Chinese toponym recognition with variant neural structures from social media messages based on BERT methods. J. Geogr. Syst. 2022, 24, 143–169. [Google Scholar] [CrossRef]
  32. Qiu, Q.; Xie, Z.; Wang, S.; Zhu, Y.; Lv, H.; Sun, K. ChineseTR: A weakly supervised toponym recognition architecture based on automatic training data generator and deep neural network. Trans. GIS 2022, 26, 1256–1279. [Google Scholar] [CrossRef]
  33. Xu, L.; Du, Z.; Mao, R.; Zhang, F.; Liu, R. GSAM: A deep neural network model for extracting computational representations of Chinese addresses fused with geospatial feature. Comput. Environ. Urban Syst. 2020, 81, 101473. [Google Scholar] [CrossRef]
  34. Gao, S.; Janowicz, K.; Montello, D.R.; Hu, Y.; Yang, J.-A.; McKenzie, G.; Ju, Y.; Gong, L.; Adams, B.; Yan, B. A data-synthesis-driven method for detecting and extracting vague cognitive regions. Int. J. Geogr. Inf. Sci. 2017, 31, 1245–1271. [Google Scholar] [CrossRef]
  35. Brindley, P.; Goulding, J.; Wilson, M.L. Generating vague neighbourhoods through data mining of passive web data. Int. J. Geogr. Inf. Sci. 2018, 32, 498–523. [Google Scholar] [CrossRef]
  36. Montello, D.R.; Friedman, A.; Phillips, D.W. Vague cognitive regions in geography and geographic information science. Int. J. Geogr. Inf. Sci. 2014, 28, 1802–1820. [Google Scholar] [CrossRef]
  37. Chen, M.; Arribas-Bel, D.; Singleton, A. Understanding the dynamics of urban regions of interest through volunteered geographic information. J. Geogr. Syst. 2019, 21, 89–109. [Google Scholar] [CrossRef]
  38. Akdag, F.; Eick, C.F.; Chen, G. Creating polygon models for spatial clusters. In Foundations of Intelligent Systems, In Proceedings of the 21st International Symposium, ISMIS 2014, Roskilde, Denmark, 25–27 June 2014; Springer International Publishing: Cham, Switzerland, 2014. [Google Scholar]
  39. Liu, K.; Qiu, P.; Gao, S.; Lu, F.; Jiang, J.; Yin, L. Investigating urban metro stations as cognitive places in cities using points of interest. Cities 2020, 97, 102561. [Google Scholar] [CrossRef]
  40. Cai, M.; Hong, L.; Xiong, C. Data-driven traffic zone division in smart city: Framework and technology. Sustain. Energy Technol. Assess. 2022, 52, 102251. [Google Scholar] [CrossRef]
  41. Chen, Y.; Zhang, Z.; Liang, T. Assessing urban travel patterns: An analysis of traffic analysis zone-based mobility patterns. Sustainability 2019, 11, 5452. [Google Scholar] [CrossRef]
  42. Shao, H.; Zhang, Y.; Li, W. Extraction and analysis of city’s tourism districts based on social media data. Comput. Environ. Urban Syst. 2017, 65, 66–78. [Google Scholar] [CrossRef]
  43. Xu, L.; Mao, R.; Zhang, C.; Wang, Y.; Zheng, X.; Xue, X.; Xia, F. Deep Transfer Learning Model for Semantic Address Matching. Appl. Sci. 2022, 12, 10110. [Google Scholar] [CrossRef]
  44. Peng, X.; Huang, Z. A novel popular tourist attraction discovering approach based on geo-tagged social media big data. ISPRS Int. J. Geo-Inf. 2017, 6, 216. [Google Scholar] [CrossRef]
  45. Devkota, B.; Miyazaki, H.; Witayangkurn, A.; Kim, S.M. Using volunteered geographic information and nighttime light remote sensing data to identify tourism regions of interest. Sustainability 2019, 11, 4718. [Google Scholar] [CrossRef]
  46. Devkota, B.; Miyazaki, H.; Pahari, N. Utilizing User Generated Contents to Describe Tourism Regions of Interest. In Proceedings of the 2019 First International Conference on Smart Technology & Urban Development (STUD), Chiang Mai, Thailand, 13–14 December 2019. [Google Scholar]
  47. Karayazi, S.S.; Dane, G.; Vries, B.D. Utilizing urban geospatial data to Understand heritage attractiveness in Amsterdam. ISPRS Int. J. Geo-Inf. 2021, 10, 198. [Google Scholar] [CrossRef]
  48. Maeda, T.N.; Yoshida, M.; Toriumi, F.; Ohashi, H. Extraction of tourist destinations and comparative analysis of preferences between foreign tourists and domestic tourists on the basis of geotagged social media data. ISPRS Int. J. Geo-Inf. 2018, 7, 99. [Google Scholar] [CrossRef]
  49. Liu, Y.; Ott, M.; Goyal, N.; Du, J.; Joshi, M.; Chen, D.; Levy, O.; Lewis, M.; Zettlemoyer, L.; Stoyanov, V. Roberta: A robustly optimized bert pretraining approach. arXiv 2019, arXiv:1907.11692. [Google Scholar]
  50. Kan, Z.; Kwan, M.P.; Tang, L. Ripley’s K-function for network-constrained flow data. Geogr. Anal. 2021, 54, 769–788. [Google Scholar] [CrossRef]
  51. Shakiba, M.; Lake, L.W.; Gale, J.F.; Pyrcz, M.J. Multiscale spatial analysis of fracture arrangement and pattern reconstruction using Ripley’s K-function. J. Struct. Geol. 2022, 155, 104531. [Google Scholar] [CrossRef]
  52. Duckham, M.; Kulik, L.; Worboys, M.; Galton, A. Efficient generation of simple polygons for characterizing the shape of a set of points in the plane. Pattern Recogn. 2008, 41, 3224–3236. [Google Scholar] [CrossRef]
  53. Hu, Y.; Gao, S.; Janowicz, K.; Yu, B.; Li, W.; Prasad, S. Extracting and understanding urban regions of interest using geotagged photos. Comput. Environ. Urban Syst. 2015, 54, 240–254. [Google Scholar] [CrossRef]
Figure 1. Location map of West Lake Scenic Region.
Ijgi 12 00196 g001
Figure 2. Overall architecture of the proposed three-stage framework.
Ijgi 12 00196 g002
Figure 3. Overall architecture of the name entity extraction model for tourist attraction names.
Ijgi 12 00196 g003
Figure 4. Administrative district map of Hangzhou.
Ijgi 12 00196 g004
Figure 5. Multi-distance spatial clustering analysis of “Hangzhou”.
Ijgi 12 00196 g005
Figure 6. Chi-shape area of West Lake District (Zhongshan Park Area).
Ijgi 12 00196 g006
Figure 7. TAZ area of Hangzhou and its central city.
Ijgi 12 00196 g007
Figure 8. Vague cognitive region.
Ijgi 12 00196 g008
Figure 9. Experimental results and analysis of cognitive region extraction in West Lake (Zhongshan Park Area).
Ijgi 12 00196 g009
Figure 10. Experimental results and analysis of cognitive region extraction in Xixi National Wetland Park.
Ijgi 12 00196 g010
Figure 11. Experimental results and analysis of cognitive region extraction in Baima Lake.
Ijgi 12 00196 g011
Figure 12. Experimental results and analysis of cognitive region extraction in Xiang Lake.
Ijgi 12 00196 g012
Table 1. Example of Xiaohongshu tourism note text data.
Original Note TitleEnglish Translation of the Note TitleOriginal Note ContentEnglish Translation of the Note ContentLatitude/
Longitude
你喝过西湖十景吗?无法抗拒的西湖元素?Have you ever tried the “Ten Scenes of West Lake”? The irresistible elements of West Lake?苏堤春晓、断桥残雪、满陇桂雨…这家店竟然以西湖十景命名咖啡在杭州 没有人会拒绝西湖吧-这家创意咖啡店藏在嘉里中心旁边的居民楼下Su Causeway in Spring, Snow on the Broken Bridge, Osmanthus Rain at Manjuelong...This café in Hangzhou is named after the ten scenic spots of West Lake. Who could refuse West Lake? This creative coffee shop is hidden under a residential building next to Kerry Center.30.2613902
120.162644
Table 2. Statistical information on a travel notebook text dataset.
Statistical ItemsStatistical Values
Maximum length of the notes2169
Minimum length of the notes1
Average length of the notes325.087
Table 3. Example of labeled tourism text dataset.
Original TextEnglish TranslationOriginal LabelEnglish Label
过一个月,青山湖的水上森林将会出现期待已久的红杉林,上帝仿佛在这里打翻了调色盘,小伙伴们记得来打卡哦In another month, the long-awaited redwood forest will appear in the water forest of Qing Shan Lake. It’s as if God spilled his paint palette here. Friends, remember to come and take a photo!‘scene’: {‘青山湖’: [6,8], ’水上森林’: [10,13], ‘红杉林’: [23,25]}‘scene’: {‘Qing Shan Lake’: [6,8], ’water forest’: [10,13], ‘redwood forest‘: [23,25]}
Table 4. Experimental results of extracting tourist attraction addresses using different modeling methods.
 MethodsRoBERTa+BiLSTM+CRFBERT+BiLSTM+CRFRoBERTa+CRFRoBERTa+SoftmaxBiLSTM+CRFCRFRNN+CRFFully Connected CRF
Metric 
Precision before filtering0.5668 0.60320.5008 0.5426 0.3510 0.3519 0.3405 0.3333
Recall before Filtering0.75100.3638 0.6245 0.5817 0.3093 0.1662 0.2782 0.1751
F1 before filtering0.64600.4539 0.5558 0.5615 0.3289 0.2258 0.3062 0.2296
Precision after filtering0.7371 0.75780.7468 0.7541 0.6062 0.5019 0.7111 0.6641
Recall after filtering0.69260.3288 0.5739 0.5370 0.2665 0.0711 0.2490 0.1654
F1 after filtering0.71410.4586 0.6491 0.6273 0.3703 0.1245 0.3689 0.2647
Disclaimer/Publisher’s Note: The statements, opinions and data contained in all publications are solely those of the individual author(s) and contributor(s) and not of MDPI and/or the editor(s). MDPI and/or the editor(s) disclaim responsibility for any injury to people or property resulting from any ideas, methods, instructions or products referred to in the content.

