1. Introduction
Landslides are prevalent geological phenomena that can have severe adverse effects on property, the environment, and the economy. With the rapid development of society and the economy, human activities have increasingly destabilized natural slopes, resulting in more frequent landslides. This has drawn the attention of researchers worldwide.
Landslide susceptibility assessment (LSA) is an important tool in geological hazard research [
1,
2,
3], which is of great value for studying regional landslide probability distribution and correlation between landslides and environmental factors [
4,
5,
6]. The machine learning method has an excellent effect on solving nonlinear problems and has been widely used in landslide susceptibility evaluation.
The two most common approaches to LSA are knowledge-driven model and data-driven model [
7,
8,
9,
10,
11]. The knowledge-driven approach is a straightforward and practical means of comprehending landslide hazards, without the need for data samples. This approach yields results that can more effectively illustrate the underlying mechanisms of these events. However, the current knowledge base on landslide hazards is incomplete and lacks the capacity for transforming data into useful knowledge. Moreover, the identification of environmental factors affecting landslide hazards is reliant on expert judgment, making it challenging to adapt to diverse geographic areas and disaster scenarios. In contrast, data-driven models employ algorithms and data to generate predictions. Machine learning models are a type of data-driven model that are increasingly being applied to LSA [
2,
3].
In the field of machine learning, data are more important than models. Unlike traditional machine learning tasks, the number of positive and negative samples in LSA often varies widely. The performance of machine learning models is contingent, to some extent, on the quantity and quality of data available for training. Neglecting to address the issue of data balance can result in suboptimal model performance and low model recall, as was evidenced in this study. The results show that the three models of the mAP score only 0.5, or a 50% probability of obtaining the correct judgment, at the same time, the G-mean score is also meager, and the Recall score is 0. Therefore, it can be concluded that the models cannot be used to customize policies for landslide disaster prevention.
The issue of imbalanced data in landslide susceptibility modeling has been recognized by scholars in previous studies, prompting further research into potential solutions. For instance, some studies have proposed the use of advanced techniques such as combining XGBoost, LightGBM, and dice cross-entropy loss function to improve model performance [
12]. Other studies have explored the use of data augmentation techniques such as the SMOTE algorithm to expand the sample size [
13], or under-sampling the original dataset to create a balanced dataset [
14].
In this study, we tackle the imbalanced data problem in landslide susceptibility analysis by treating it as a special dichotomous problem. Specifically, we approach the problem from the perspective of the dataset, working to address imbalances between sample classes. By adopting such a novel approach, we aim to enhance the accuracy and efficacy of landslide susceptibility modeling, improve the robustness [
15,
16,
17] of the model, and provide practical and theoretical guidance for disaster prevention and mitigation policies, ultimately contributing to more effective disaster prevention and mitigation efforts.
The following three methods have been generally used in the past to deal with the sample class imbalance problem. (1) A balanced sampling method is used, in which an equal number of non-slip points (negative samples) are randomly selected from the study area after obtaining data on the slip points (positive samples) to build a dataset for training and prediction [
13,
18]. This approach is practical, but can result in wasted data and prevent the model from performing as well as it should. (2) Think of the problem as a misclassification cost-sensitive learning problem, where the misclassification weights of the model are set based on sample proportions or expertise. Misclassification cost-sensitive learning aims to mitigate the effects of sample category imbalance by using a modified loss function that sets a non-equal misclassification cost per category. This cost can be thought of as a penalty factor introduced during the training of the classifier with the aim of increasing the importance of a few classes (landslide samples) [
19,
20,
21]. By imposing a stricter penalty for errors in a given class, we force the classifier training process (which aims to minimise the total cost) to concentrate on samples from this distribution. This approach is somewhat subjective and relies on the expertise of the researcher. (3) Model training is performed directly using the original imbalanced dataset after a simple cleaning. Due to the small number of positive samples (landslide), the model tends to judge the samples as negative (non-landslide) already for the purpose of maximum accuracy. However, the recall [
22] and G-mean [
23] scores of this model are low and cannot be used for practical applications.
In this paper, two data processing strategies, over-sampling and under-sampling, are used to address the above problems, so that the original sample data become balanced data. The advantages and disadvantages of these two processing strategies are also compared. Finally, some research results with reference values for disaster prevention and mitigation work are derived.
2. Study Area and Data
In this paper, Wanzhou District [
24,
25] of Chongqing City is taken as the research target. As shown in
Figure 1, the thumbnail located at the bottom of this image provides a revealing glimpse into the selection process for the study area, which was carefully chosen from the Three Gorges reservoir area in the middle section of the Yangtze River in China.
Wanzhou District is under the jurisdiction of Chongqing, in the upper Yangtze River, northeast of Chongqing, and the heart of the Three Gorges reservoir area [
26]. In the Wanzhou district rivers, streams cut deep, there is a significant drop, and a branch distribution is the Yangtze River system. Wanzhou District is in the subtropical monsoon humid belt, with four distinct seasons, long frost-free periods, abundant rainfall, and frost and snow scarcity. The geological age of outcrop strata in the Wanzhou district is mainly found in the Triassic and Jurassic of the Mesozoic era. Jurassic is the most widely distributed, followed by Triassic. In addition, some places have Permian strata of the Paleozoic era and Quaternary strata of the Cenozoic era. During the July 1982 rainstorm, more than 80,000 landslides occurred in Wanzhou District, Chongqing. It destroyed 36,000 houses and left 14,000 families homeless. A major landslide occurred in July and August 1993. There were 11,000 landslides that destroyed 198,000 mu of farmland and 56,300 houses, causing economic losses of 1.8 billion yuan. On 5 September 2004, a landslide occurred in Wanzhou Ji’an [
27], with an area of
and a volume of about
. The landslide destroyed a critical local market town, road and highway under construction. From 16–23 July 2020, more than 40 landslides occurred in Wanzhou, Chongqing [
28]. Wanzhou District in Chongqing, China, is an ideal area for studying landslides due to its unique geographical features. The region is characterized by numerous mountains and waterways, as well as its proximity to the Three Gorges dam and the Yangtze River. These factors make the area particularly susceptible to landslide disasters, which can have severe consequences for both the environment and the local population. Studying landslides in this area can provide valuable insights into the underlying mechanisms and causes of such events, as well as the most effective methods for mitigating their impacts. In summary, using Wanzhou District as a study area for landslides is a scientifically sound approach due to the region’s unique geological characteristics and susceptibility to such disasters.
The dataset of the experimental model is mainly derived from the Remote Sensing Image supplied by Google Earth and the landslide geological survey. The satellite image of Landsat-8 received on 12 August 2013 was used as the primary remote sensing data. Landsat 8 is a satellite launched by NASA in 2013 as part of the Landsat program. It carries two sensors, OLI and TIRS, and provides global coverage every 16 days. The data are freely available to the public in a standard format. The data are freely available to the public through the United States Geological Survey (USGS) EarthExplorer website. Aster GDEM provides digital elevation model data (DEM) with a resolution of 30 × 30 m. The data types and sources are shown in
Table 1.
Table 2 displays the 12 landslide factors and their types, and
Figure 2 illustrates the 12 controlling factors and influencing factors of landslide development in the study area.
A Geological Topographic Map gives the lithology data and distances to rivers. Landsat 8 OLI images provide the NDVI/NDWI data. The Bureau of Meteorology provides rainfall data, and land use data were obtained from Landsat 8 OLI images and the geological survey.
The twelve factors mentioned are commonly considered as potential contributors to landslides. The relationship between these factors and landslides is complex and multifaceted, as each of these factors can individually or collectively affect the likelihood and severity of landslides.
Elevation, slope, and aspect are physical characteristics of the terrain that have a significant impact on the stability of soil and rock. Higher elevations and steeper slopes can increase the potential for landslides [
29,
30,
31], while south-facing slopes tend to be more prone to landslides due to increased solar radiation and soil moisture loss [
32]. Terrain curvature is another terrain factor that can influence the likelihood of landslides. The structure and shape of the terrain are indicated by its Terrain curvature [
33]. Distance to river is also a crucial factor that can impact the occurrence of landslides. Landslides tend to occur more frequently in areas closer to rivers due to the increased water content and erosion caused by the river flow. NDVI (Normalized Difference Vegetation Index) and NDWI (Normalized Difference Water Index) are remote sensing indices that measure the amount of vegetation and water content in a particular area [
34]. Low NDVI values and high NDWI values can indicate areas of high landslide susceptibility, as they suggest high water content and low vegetation cover [
35]. Rainfall is a critical trigger for landslides, as heavy rainfall events can increase soil saturation and trigger slope failures. Seismic intensity is also a significant factor that can increase the likelihood of landslides, particularly in areas with high seismic activity. Land use, TRI (Terrain Roughness Index) and lithology are also factors that can influence landslide occurrence. Human engineering activities, such as mining, construction, deforestation, and land use changes, can alter the natural slope stability of an area and increase the risk of landslides, while TRI and lithology can help to identify areas with high water content and unstable soil or rock [
36,
37].
These 12 landslide factors were selected because they are widely recognized as among the major factors influencing landslide occurrence and have been extensively explored in past studies. For example, many studies have shown that factors such as high elevation, steep slopes, south-facing slopes, and hydrologic conditions increase the risk of landslides. In addition, many studies have explored the relationship between vegetation cover, landform curvature, seismic activity, and other factors and landslides [
38,
39,
40].
3. Methodology
This paper uses three classical machine learning algorithms combined with two sampling methods to train models for unbalanced datasets.
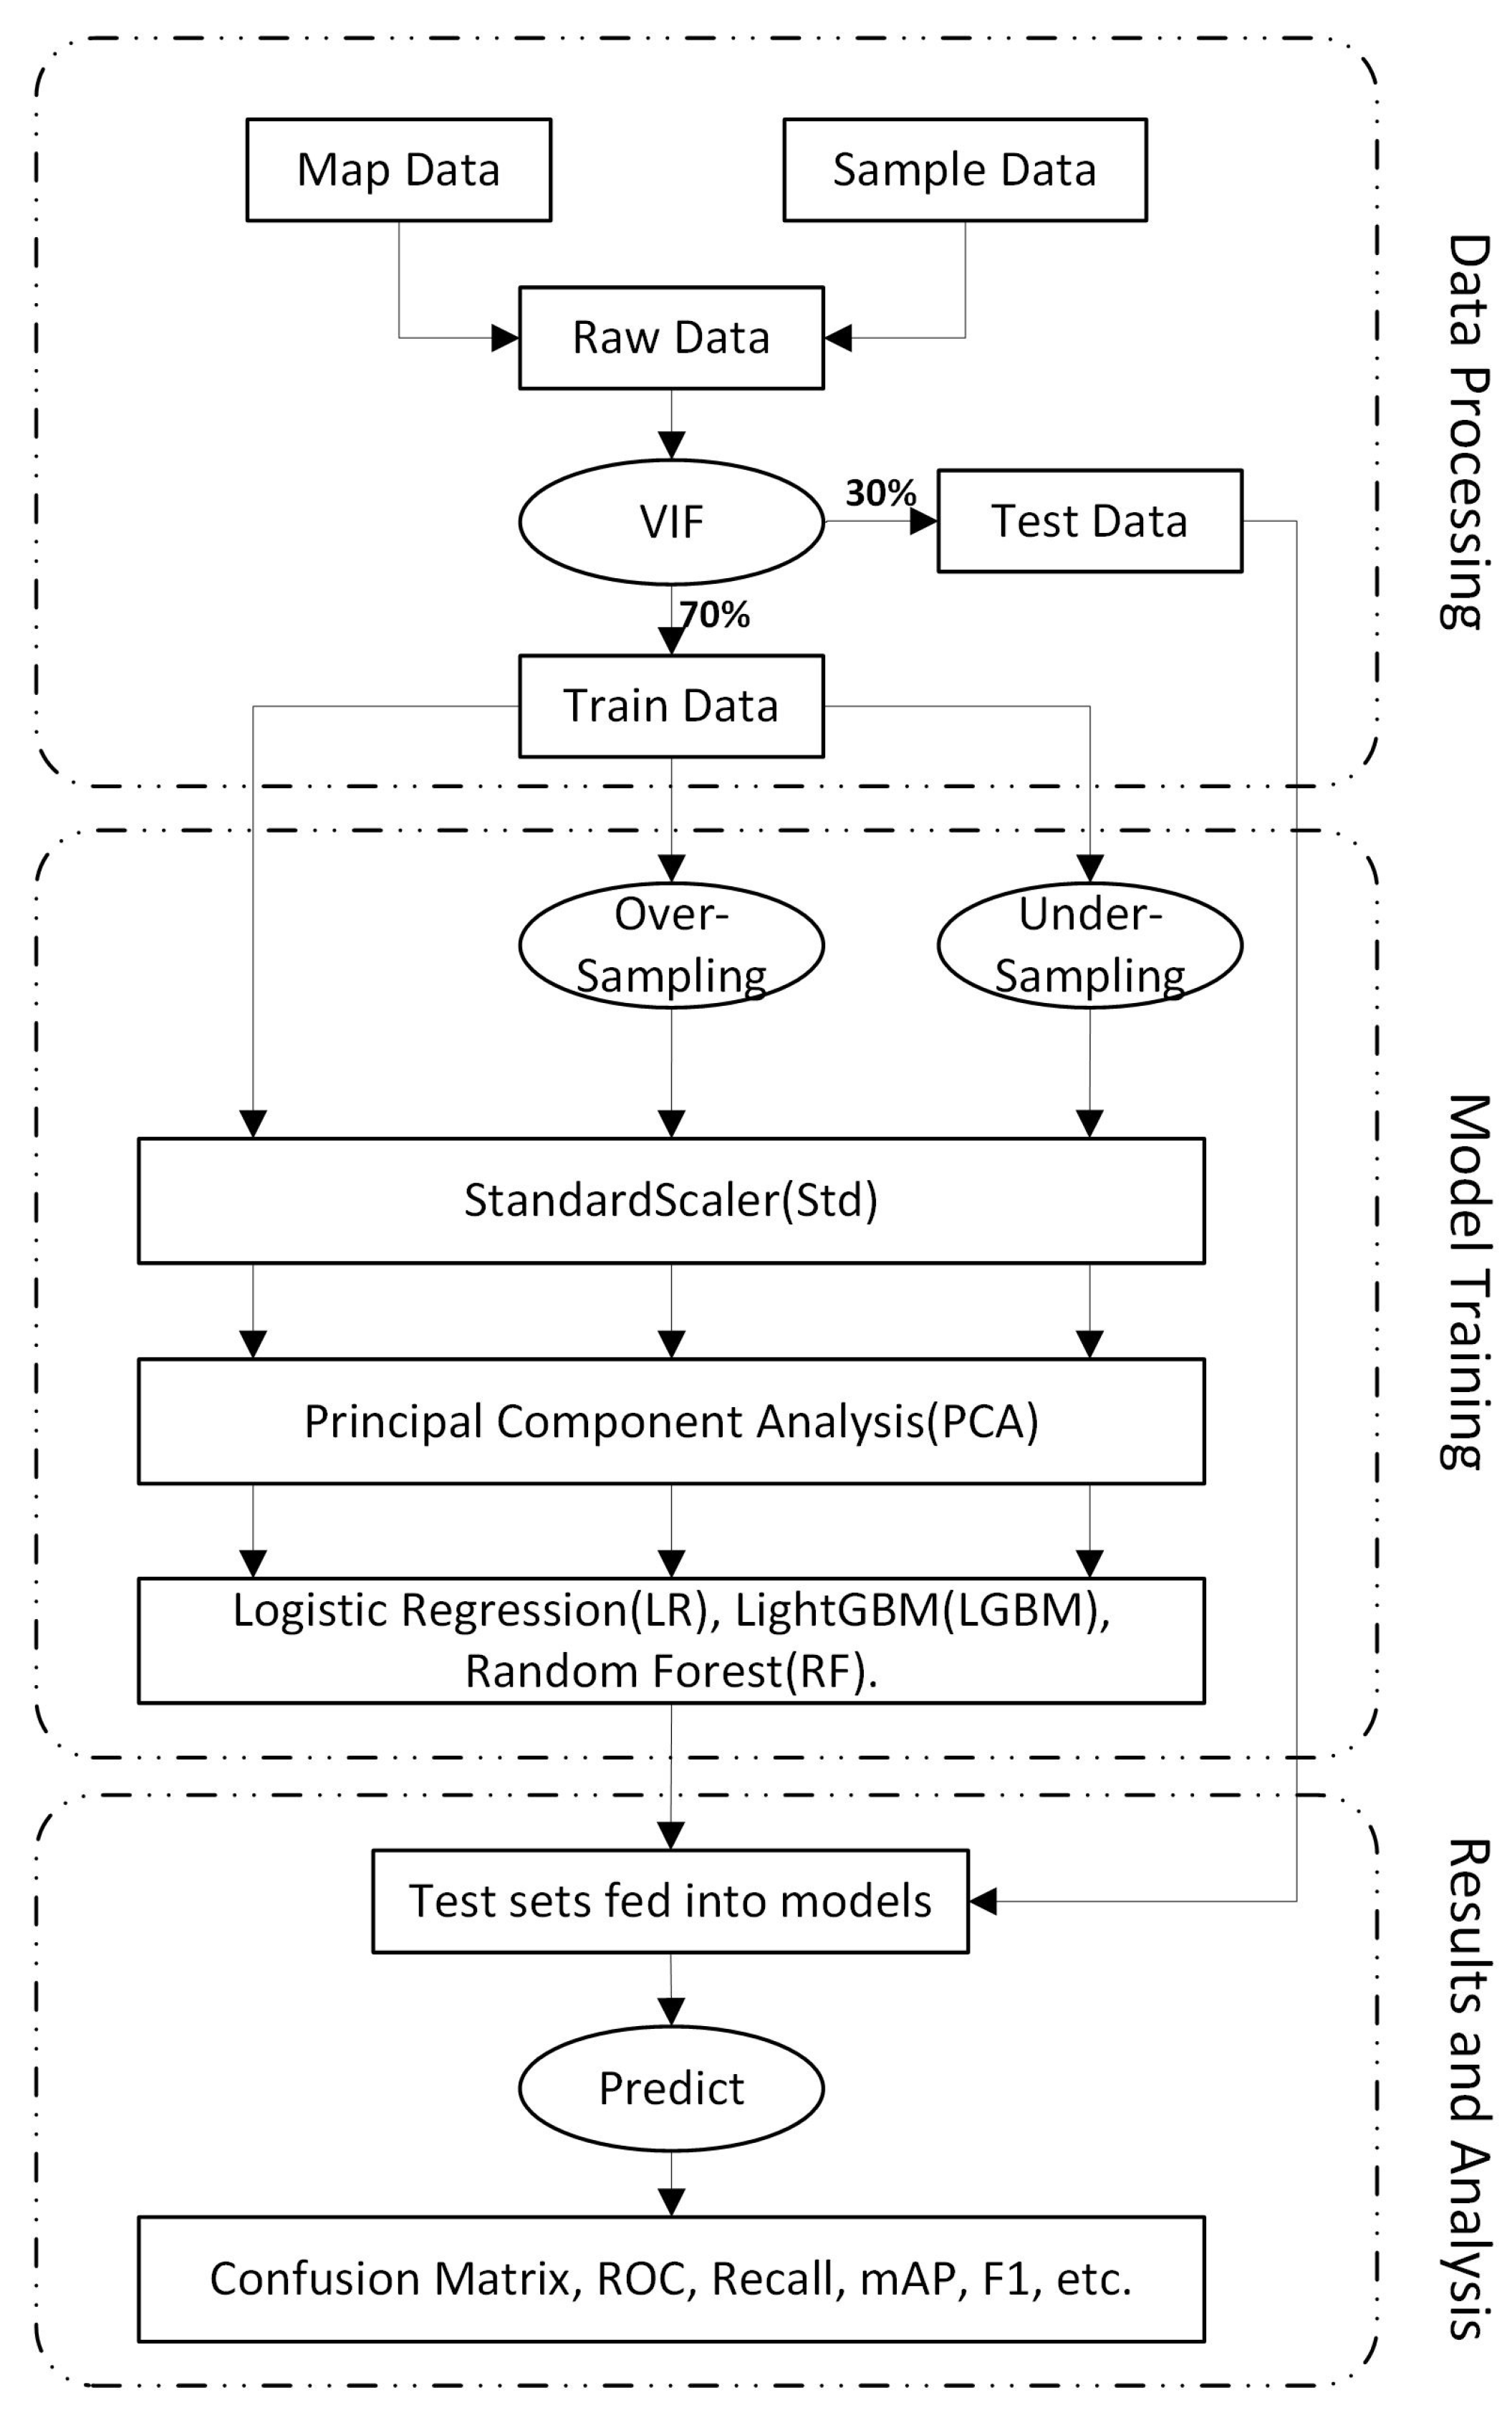
In order to highlight the influence of the balanced dataset on the training model, conventional preprocessing methods are used to process the dataset. The main process is shown in
Figure 3. The algorithms and formulas involved in the workflow will be described in detail in the later part of this chapter.
In general, the process of machine learning model building consists of two phases: training and testing. In the training phase, features are fed into the model together with the target and the internal parameters of the model are tuned according to certain rules. In the testing phase, only the features are fed into the trained model, and the model is allowed to predict the target by the features, and the model’s performance is analyzed based on the prediction results. Representative machine learning methods are Support Vector Machines (SVM), Logistic Regression (LR), Random Forest (RF), Bayesian Networks (BN), Back Propagation Networks (BP), etc. These models are the so-called shallow machine learning methods, which are able to handle more complex data compared to knowledge-based models [
7]. In addition, the reliability of LSA models can be improved by combining machine learning methods for quantitative analysis with qualitative analysis.
The first step in the workflow is to complete the data preparation. Firstly, the landslide sample point data are combined with the geographic information of the study area to obtain the original dataset, which is done so that it is clear which location in the study area is represented by the landslide susceptibility of a certain sample point after the training is completed. Then the dataset was subjected to a VIF test to check whether collinearity existed in the features of the selected samples. Finally, the dataset is divided into 70% training set and 30% test set. The 70/30 split is a commonly used ratio, but it is not a hard and fast rule. This step uses the train_test_split method in the Sklearn toolkit to divide the dataset after setting the division ratio and related parameters.
The second step involves training the model. The test set is used to evaluate the performance of the model, while the training set undergoes three types of processing before being sent to the training pipeline. The three data processing methods are no processing, over-sampling processing, and under-sampling processing. The datasets are then processed in the pipeline using the StandardScaler and Principal Component Analysis (PCA) techniques before being sent to three classical machine learning models for training. Following these steps, three datasets and three algorithms are cross-trained, resulting in nine models being obtained.
Finally, the nine models were used to predict the test set divided in the first step, and the confusion matrix and other prediction results of the nine models were obtained, and the results were analyzed.
3.1. Model Training Algorithm
Three classical machine learning algorithms were selected to help us experiment. They are Logistic Regression (LR), LightGBM (LGBM), and Random Forest (RF).
LR often handles regression problems where the dependent variable is categorical. The dependent variable of logistic regression can be binary or multiclass. In order to avoid overfitting, the regularization method is introduced in Logistic Regression. The regularizer increases as the complexity of the model increases; the more complex the model, the higher the regularization term. LGBM (Light Gradient Boosting Machine) [
41,
42] is a framework that enables the application of the GBDT (Gradient Boosting Decision Tree) [
42] algorithm, supporting efficient parallel training. Moreover, it boasts a faster training speed, lower memory requirement, enhanced accuracy, distributed support capability and faster processing of large amounts of data. It is usually used for CTR prediction, multi-classification, sort search, and other tasks. RF is a particular Bagging [
16] method that uses the Decision-Trees models in Bagging. First, some training sets were developed by Bootstrap [
43]. Then, per the training set, a Decision-Tree is constructed. The Random Forest has the idea of integration in which samples and features are sampled to avoid overfitting. We found that RF classifiers always lead to good models, as in a landslide susceptibility prediction article that finally found that RF classifiers worked best [
44].
These three algorithms are selected in this study because they are classic and powerful, simple in principle but rigorous in logic, and significantly influence machine learning. At the same time, this study aims to highlight the improvement effect of balanced datasets on model training, so it is appropriate to choose these three classical algorithms. A comparison of the advantages and disadvantages of the three algorithms is shown in
Table 3.
3.2. Over-Sampling and Under-Sampling
For imbalanced datasets, the simplest over-sampling method is randomly replicating new samples from the minority class [
45,
46]. This study used the SMOTE (Synthetic Minority over-Sampling Technique) [
47,
48] algorithm to sample the dataset. The principle is to sample the minority class a, randomly select a nearest neighbor sample b according to its eigenvalue distribution, and then take the attachment point c between a and b as a randomly selected point on the new sample, that is, the new sample.
There are two schemes for under-sampling dataset manipulation [
17,
49], prototype generation and prototype selection. Prototype generation algorithms will reduce the number of samples in the dataset. The samples are generated from the original dataset. The prototype selection algorithm is most directly obtained from the original dataset class samples. This study employs a prototype selection scheme for under-sampling.
3.3. Model Evaluation
The evaluation method is to provide decision-making services for the whole experiment, which needs to be selected based on actual tasks and datasets. Therefore, different evaluation criteria will produce significant differences in experimental results for different problems.
In this experiment, the dataset shows a vast difference in the number of positive and negative samples. The purpose of modeling is to detect a tiny number of positive samples in the entire dataset. Therefore, this experiment should focus on how many positive samples the model finds in the test set: the recall rate. If the model finds no abnormal samples, the recall rate is 0. In addition, this experiment introduced ROC [
50], mean Average Precision (mAP) [
51], F1-score and G-mean as evaluation criteria. These metrics can be used to evaluate experimental models more comprehensively.
ROC is a tool used to measure non-equilibrium in classification. For example, the ROC curve and AUC [
52] are often used to evaluate the merits and demerits of a binary classifier. A nice feature of the ROC curve is that it can remain constant when there is a class imbalance in the dataset, i.e., there are many more negative samples than positive ones (or vice versa). However, the ROC curve is unable to provide a cost-sensitive evaluation of the model’s performance; for a more detailed assessment we can use metrics such as mAP and G-mean provided by Sklearn. The F1 score is a commonly used metric in machine learning for evaluating the performance of binary classification models. It is a measure of the balance between precision and recall, two important metrics for assessing the accuracy of a model. In such cases, accuracy alone may not be a sufficient metric for evaluating model performance, as a model that always predicts the majority class will have high accuracy but poor recall. The F1 score provides a more balanced measure of model performance, taking into account both precision and recall. When the dataset is balanced, the Precision index and mean Average Precision are equivalent. However, mAP reflects the model’s problems more when unbalanced dataset. Similarly, the G-mean score [
23,
53] is of great reference value when unbalanced data. A typical binary classification confusion matrix [
54,
55,
56] is a 2 × 2 matrix, respectively: true positive (TP), false positive (FP), true negative (TN), and false-negative (FN).
The equations of G-mean score, Accuracy, and Recall are Equations (
1)–(
3). The mAP Equation (
5) comes from averaging AP (
4) over all classes, where AP is the area covered under the PR curve. The PR curve is obtained using Recall as the X-axis and Precise as the Y-axis. The F1_score Equation (
6) is derived from both Recall and Precision.
3.4. Data Processing
Multicollinearity verifies, in multiple regression models, that there is a specific linear relationship between explanatory variables. Suppose the linear relationship between variables is too strong. In that case, the parameters are no longer practical estimators, or even the parameters cannot be identified. This eventually leads to inaccurate test results and a decrease in model accuracy.
In this study, the Variance Inflation Factor (VIF) is utilized to assess whether the multicollinearity among the explanatory variables is severe.
Equation (
7) is the variance of the parameter estimator, where
is the ith explanatory variable as the dependent variable, and Equation (
8) can be obtained by taking the latter part of the formula alone. The higher the degree of collinearity between
and other explanatory variables, the more prominent
is, the higher the VIF value will be, and the more significant the VIF value is. Generally, VIF > 10, and we believe this variable has collinearity problems with other variables.
The collinearity analysis results of the selected datasets in this study are shown in
Table 4. There is no severe problem of collinearity among the explanatory variables.
The StandardScaler algorithm can normalize the mean and variance of each characteristic dimension of the sample, so that the processed data are more aligned with the standard normal distribution, with a mean of 0 and a standard deviation of 1. Its conversion function is shown in Equation (
9), where
is the mean value of all sample data and
is the standard deviation.
The Principal Component Analysis (PCA) is applied to the original data for processing. The algorithm aims to transform the original N-dimensional features into a K-dimensional feature space, which consists of a new orthogonal feature and a K-dimensional feature generated from the original N-dimensional features, k ≤ n. This can reduce the noise and redundancy of the samples and reduce the possibility of overfitting the model.
4. Results
4.1. Consequences of Landslide Sensitivity Prediction
This study uses both a sample balanced dataset and a sample unbalanced dataset when training the model in order to compare the results and highlight the findings.
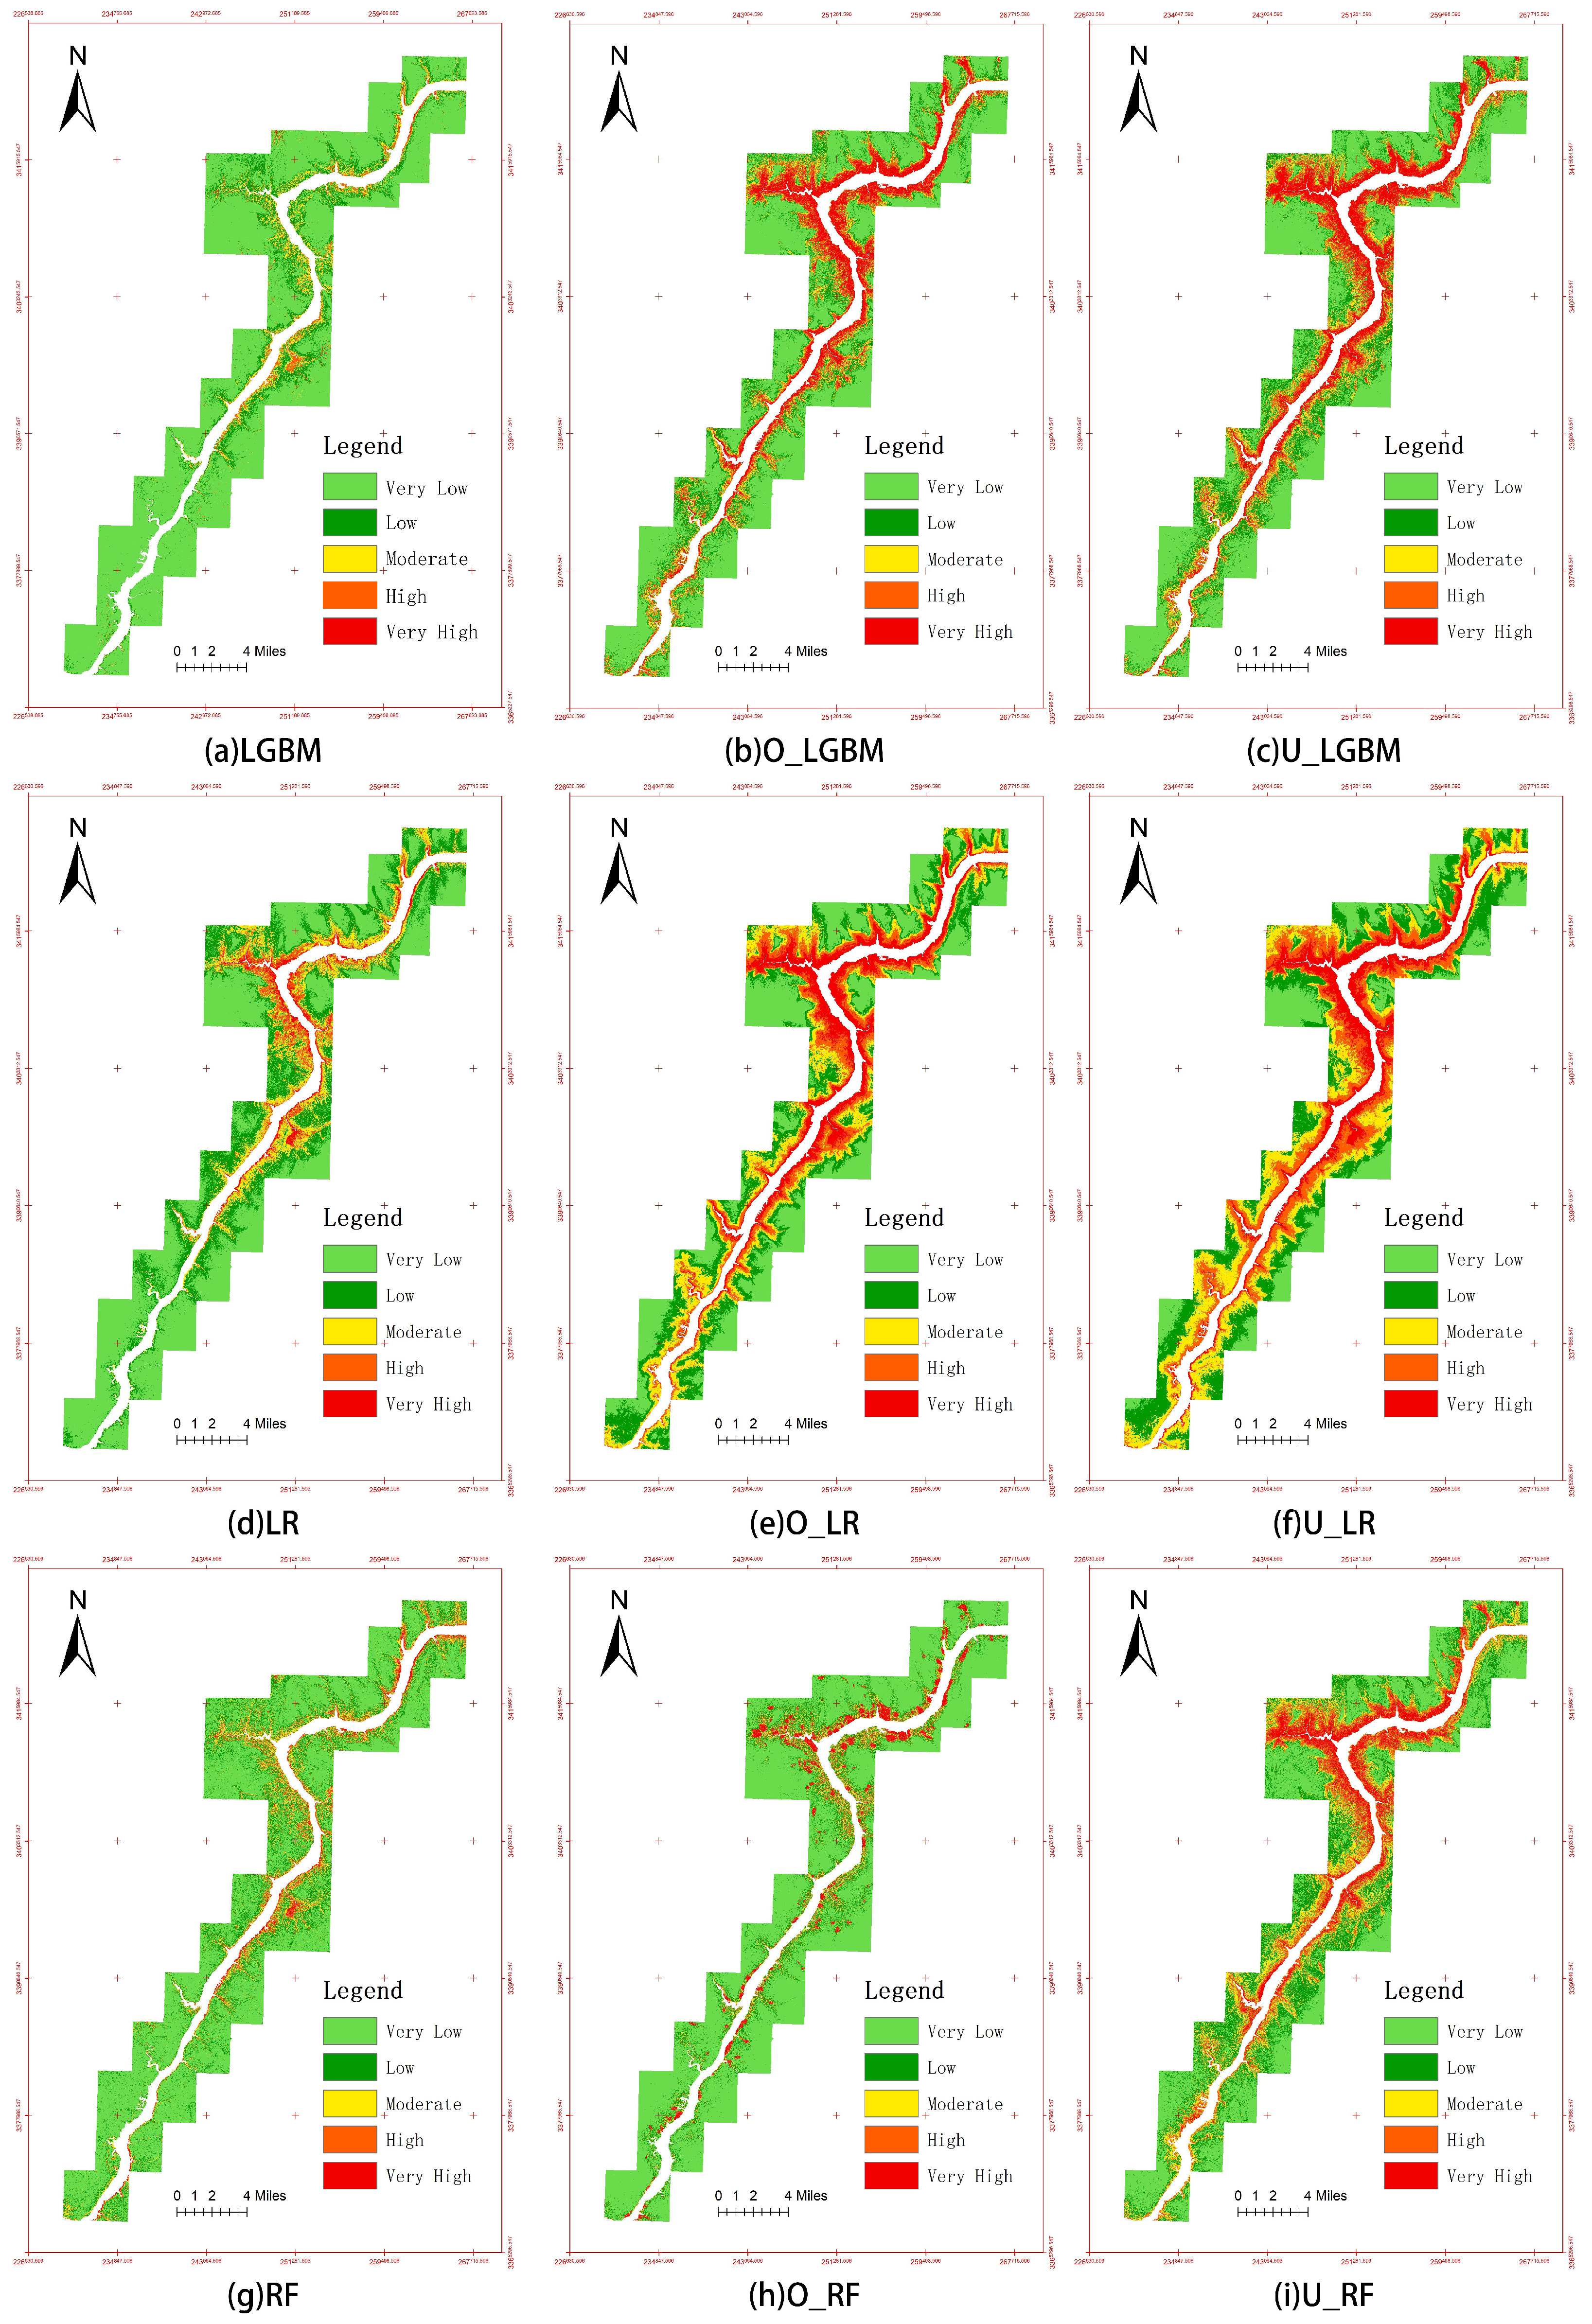
Using Logistic Regression, Random Forest, and LightGBM algorithm models, three sampling methods (original dataset, under-sampling dataset, and over-sampling dataset) were applied, respectively, to make landslide susceptibility predictions. The 12 landslide factors mentioned in Chapter 2 were selected as input variables in this study, such as elevation, curvature, aspect, NDVI, NDWI, slope, distance to river, rainfall, land use, earthquake power, topographic roughness index (TRI), and lithology [
19], as inputs. Furthermore, the predicted values obtained are 0 and 1, via the Landslide Prediction Index (LPI). Finally, the predictions of the nine models for the landslide samples were derived and combined with the geographical information of the study area to obtain a picture of the landslide susceptibility of the area. It is shown in
Figure 4.
Figure 5 shows the area proportion of landslide prediction results of nine models.
4.2. Validation and Comparison of Models
Figure 6 shows the ROC curves of the nine trained models. The AUC indices of the three models are sorted by original data, under-sampling, and over-sampling. From the ROC curve, the sample equilibrium model is superior to the original unbalanced data model. The model with the highest AUC value was the RF model with the over-sampling method (AUC = 93.2%).
The ROC curves depict the true positive and false positive rates at different classification thresholds. By comparing the ROC curves of two or more models, we can assess their relative performance in distinguishing between positive and negative instances. However, if we want to obtain a fuller picture of the actual performance of these nine models, we need some other metrics as well.
Table 5 shows the mean Average Precision, G-mean, Recall, Accuracy, F1_score, Precision and AUC of the nine models. A model with a Recall of about 0 is of no practical significance because we are more concerned with how many positive sample points of landslides can be found in the model among all sampling points in the test set with a sample ratio of 1:19. The three models with an approximate Recall value of 0 were trained from the original unbalanced dataset, and the other models scored very well. The accuracy of the three unbalanced dataset models is about 0.95. However, this is not because of their excellent performance, but because of the problems of these models. Their recall rate is 0. G-mean scores also show this point, among which three original data models have extremely low scores. The G-mean scores of the remaining six models are normal, among which the LGBM model with over-sampled balanced dataset has the highest score.
The accuracy metric is represented by TP/(TP+FP), where TP represents the number of slipped samples correctly predicted by the model and FP represents the number of non-slipped samples correctly predicted. However, considering the ratio of positive to negative samples in the test set of 1:19, the value of TP is significantly smaller than the value of FP, which leads to a low accuracy score of the model. The F1 metric formula is derived from the recall and precision formulae. In this case, the low accuracy value resulted in a lower F1 score for the model. Nevertheless, these two metrics are sufficient for comparing the performance merits of the models.
There are issues with models directly trained from unbalanced datasets. If disaster prevention and mitigation policies are based on such models, there is a risk of missed judgments and security issues. Models derived from balanced datasets are superior to the former and can be used to formulate more effective disaster prevention and mitigation policies. In the balanced dataset model, the highest AUC score was attained by O_RF with a value of 0.932. The highest G-mean score was recorded by O_LGBM with a value of 0.81, while the highest mAP score was achieved by O_RF with a score of 0.811. The highest Accuracy score was obtained by O_RF with a value of 0.907. The Recall score was highest for O_LGBM with a value of 0.826. Consequently, the two best-performing models are O_LGBM and O_RF. Therefore, these models can be considered for practical application.
5. Discussion
In this study, we compare the impact of sample balanced and unbalanced datasets on the performance of three traditional machine learning models in the field of landslide susceptibility research. The results demonstrate a significant improvement in the AUC, from 0.913 to 0.932, and accuracy, from 0.793 to 0.907, compared to the latest research in the field based on the same dataset [
19].
These findings underscore the importance of training machine learning models on balanced datasets to achieve optimal performance. Moreover, the research results have practical implications for the development of regional disaster prevention and mitigation policies. The study also introduces the idea of combining unbalanced datasets with machine learning to solve practical problems, which opens up new avenues for research in the field. In addition, the findings of this study provide valuable insights into the application of machine learning in landslide susceptibility research and its potential for improving disaster prevention and mitigation efforts.
5.1. Limitations or Shortcomings of This Study
Only one unbalanced landslide dataset was used in this study, but no additional high-quality unbalanced datasets were collected for the experiments, which may limit the generalizability of the results.
In this study, we trained three models using an unbalanced dataset and six models using a balanced dataset. With some metrics, we can visually compare the performance strengths and weaknesses of the models obtained from the training of these two datasets. However, we failed to use a suitable comprehensive metric to compare the two models, just as one cannot use the same set of rules to compare different things. This is a limitation of this study, and future research needs to explore more comprehensive metrics to evaluate the performance of the models.
It was found that models trained on an unbalanced dataset and models trained on a downsampled balanced dataset achieved similar values for several evaluation metrics, suggesting the need to investigate the relationship between the two models in greater depth.
All three algorithms chosen for this study are classical machine learning algorithms because they are well-interpretable compared to neural-network-based algorithms, such as Deep Residual Shrinkage Network [
57] and Squeeze-and-Excitation Network [
58] (SENet). Neural network algorithms change too much and are not reproducible during the learning training process, and even with the same environment and parameters, the models obtained the next time are often very different. However, the main idea of this study is to use the control variables method to highlight the influence of the dataset on the model, so the neural network-based algorithm is not applicable to this study. Nevertheless, future research could explore the possibility of using neural network algorithms in similar studies, which would help to extend the range of algorithm choices and improve the performance of the models.
5.2. Future Research Directions
The authors have generated some conjectures in the course of their research, which may be investigated in depth next.
Conjecture 1 is proposed based on the dataset size. The poor performance of the models trained from unbalanced datasets is due to the fact that the models do not extract enough features from a small number of class samples. If an unbalanced dataset with a sufficient number of minority class samples is used to train the model, perhaps the effect of the dataset on the model can be eliminated.
Conjecture 2 proposes an improved idea of the over-sampling algorithm SOMTE, whose core idea is to randomly select the feature values of two minority class samples and obtain new features in the interval of the two feature values to generate new samples. That is, the minority class samples are clustered according to certain rules, and the samples are randomly selected from the samples that meet the clustering conditions, and feature extraction is performed in these samples with a view to obtaining new samples of higher quality.
These conjectures provide useful insights for future research and can provide more ideas and directions for solving the imbalance problem of datasets.
6. Conclusions
This paper presents an evaluation method for predicting landslide susceptibility by performing sample equalization on machine learning models trained on unbalanced datasets. The models trained using two data equalization methods and three machine learning algorithms are analyzed and validated against measured data from the Wanzhou district of Chongqing city.
The study highlights the importance of sample equalization in machine learning model training, providing insights for practitioners working with unbalanced datasets. The research framework presented in this paper can serve as a reference for predicting landslide sensitivity on unbalanced datasets in the future, potentially mitigating the damage caused by landslides.
Overall, this study makes an important contribution to the field of machine learning and landslide prediction. It demonstrates the effectiveness of sample equalization in improving machine learning model performance and offers a useful framework for future research in this area.
Author Contributions
Yingze Song implemented all proposed methods and conducted the experiments. Degang Yang and Yingxu Song oversaw the study and contributed to the editing and review of the manuscript. Weicheng Wu, Xin Zhang, Jie Zhou, Zhaoxu Tian and Chencan Wang discussed some key issues in the model sum and provided very useful suggestions for improving our work. All authors have read and agree to the published version of the manuscript.
Funding
This paper is jointly funded by the Open Fund from Engineering Research Center for Seismic Disaster Prevention and Engineering Geological Disaster Detection of Jiangxi Province (No. SDGD202203); the Open Fund from Key Laboratory for Digital Land and Resources of Jiangxi Province, East China University of Technology (No. DLLJ202204); the Science and Technology Research Proiect of Jiangxi Provincial Department of Education (No. GJJ200748), and Education science planning project at the university level of East China University of Technology (No. 22XYB21).
Data Availability Statement
Readers who need data for an in-depth study of this paper can contact the corresponding author for access.
Acknowledgments
We would like to express our heartfelt appreciation to the funding organizations that supported our research and provided financial assistance for this article. Without their generous support, this study would not have been possible. We extend our sincere gratitude to the following funding projects: the Open Fund from the Engineering Research Center for Seismic Disaster Prevention and Engineering Geological Disaster Detection of Jiangxi Province (No. SDGD202203), the Open Fund from the Key Laboratory for Digital Land and Resources of Jiangxi Province, East China University of Technology (No. DLLJ202204), the Science and Technology Research Project of Jiangxi Provincial Department of Education (No. GJJ200748), and the Education Science Planning Project at the University Level of East China University of echnology (No. 22XYB21). The financial support provided by these projects has been instrumental in conducting our research, analyzing the data, and disseminating the findings. We are truly grateful for their investment in our work and their commitment to advancing scientific knowledge in our field. Once again, we would like to express our sincere appreciation to the aforementioned funding organizations for their support. Their contributions have significantly contributed to the success of this study.
Conflicts of Interest
The authors declare that they have no known competing financial interest or personal relationships that could have appeared to influence the work reported in this paper.
References
- Merghadi, A.; Yunus, A.P.; Dou, J.; Whiteley, J.; ThaiPham, B.; Bui, D.T.; Avtar, R.; Abderrahmane, B. Machine learning methods for landslide susceptibility studies: A comparative overview of algorithm performance. Earth-Sci. Rev. 2020, 207, 103225. [Google Scholar] [CrossRef]
- Azarafza, M.; Azarafza, M.; Akgün, H.; Atkinson, P.M.; Derakhshani, R. Deep learning-based landslide susceptibility mapping. Sci. Rep. 2021, 11, 24112. [Google Scholar] [CrossRef] [PubMed]
- Nikoobakht, S.; Azarafza, M.; Akgün, H.; Derakhshani, R. Landslide susceptibility assessment by using convolutional neural network. Appl. Sci. 2022, 12, 5992. [Google Scholar] [CrossRef]
- Ahmed, N.; Firoze, A.; Rahman, R.M. Machine learning for predicting landslide risk of Rohingya refugee camp infrastructure. J. Inf. Telecommun. 2020, 4, 175–198. [Google Scholar] [CrossRef] [Green Version]
- Shirzadi, A.; Shahabi, H.; Chapi, K.; Bui, D.T.; Pham, B.T.; Shahedi, K.; Ahmad, B.B. A comparative study between popular statistical and machine learning methods for simulating volume of landslides. Catena 2017, 157, 213–226. [Google Scholar] [CrossRef]
- Tehrani, F.S.; Calvello, M.; Liu, Z.; Zhang, L.; Lacasse, S. Machine learning and landslide studies: Recent advances and applications. Nat. Hazards 2022, 114, 1197–1245. [Google Scholar] [CrossRef]
- Xu, S.; Song, Y.; Hao, X. A Comparative Study of Shallow Machine Learning Models and Deep Learning Models for Landslide Susceptibility Assessment Based on Imbalanced Data. Forests 2022, 13, 1908. [Google Scholar] [CrossRef]
- Wang, L.J.; Sawada, K.; Moriguchi, S. Landslide susceptibility analysis with logistic regression model based on FCM sampling strategy. Comput. Geosci. 2013, 57, 81–92. [Google Scholar] [CrossRef]
- Nanehkaran, Y.A.; Mao, Y.; Azarafza, M.; Kockar, M.K.; Zhu, H.H. Fuzzy-based multiple decision method for landslide susceptibility and hazard assessment: A case study of Tabriz, Iran. Geomech. Eng. 2021, 24, 407–418. [Google Scholar]
- Azarafza, M.; Ghazifard, A.; Akgün, H.; Asghari-Kaljahi, E. Landslide susceptibility assessment of South Pars Special Zone, southwest Iran. Environ. Earth Sci. 2018, 77, 1–29. [Google Scholar] [CrossRef]
- Sharma, A.; Prakash, C.; Manivasagam, V. Entropy-based hybrid integration of random forest and support vector machine for landslide susceptibility analysis. Geomatics 2021, 1, 399–416. [Google Scholar] [CrossRef]
- Zhang, S.; Wang, Y.; Wu, G. Earthquake-Induced Landslide Susceptibility Assessment Using a Novel Model Based on Gradient Boosting Machine Learning and Class Balancing Methods. Remote Sens. 2022, 14, 5945. [Google Scholar] [CrossRef]
- Gupta, S.K.; Shukla, D.P. Handling data imbalance in machine learning based landslide susceptibility mapping: A case study of Mandakini River Basin, North-Western Himalayas. Landslides 2022, 20, 933–949. [Google Scholar] [CrossRef]
- Wang, Y.; Wu, X.; Chen, Z.; Ren, F.; Feng, L.; Du, Q. Optimizing the predictive ability of machine learning methods for landslide susceptibility mapping using SMOTE for Lishui City in Zhejiang Province, China. Int. J. Environ. Res. Public Health 2019, 16, 368. [Google Scholar] [CrossRef] [Green Version]
- Shamsudin, H.; Yusof, U.K.; Jayalakshmi, A.; Khalid, M.N.A. Combining oversampling and undersampling techniques for imbalanced classification: A comparative study using credit card fraudulent transaction dataset. In Proceedings of the 2020 IEEE 16th International Conference on Control & Automation (ICCA), Sapporo, Japan, 9–11 October 2020; pp. 803–808. [Google Scholar]
- Yap, B.W.; Abd Rani, K.; Abd Rahman, H.A.; Fong, S.; Khairudin, Z.; Abdullah, N.N. An Application of Oversampling, Undersampling, Bagging and Boosting in Handling Imbalanced Datasets. In Proceedings of the First International Conference on Advanced Data and Information Engineering (DaEng-2013), Kuala Lumpur, Malaysia, 3–5 June 2014; Springer: Singapore, 2014; pp. 13–22. [Google Scholar]
- Junsomboon, N.; Phienthrakul, T. Combining over-sampling and under-sampling techniques for imbalance dataset. In Proceedings of the 9th International Conference on Machine Learning and Computing, Singapore, 24–26 February 2017; pp. 243–247. [Google Scholar]
- Dou, J.; Yunus, A.P.; Merghadi, A.; Shirzadi, A.; Nguyen, H.; Hussain, Y.; Avtar, R.; Chen, Y.; Pham, B.T.; Yamagishi, H. Different sampling strategies for predicting landslide susceptibilities are deemed less consequential with deep learning. Sci. Total Environ. 2020, 720, 137320. [Google Scholar] [CrossRef] [PubMed]
- Zhang, H.; Song, Y.; Xu, S.; He, Y.; Li, Z.; Yu, X.; Liang, Y.; Wu, W.; Wang, Y. Combining a class-weighted algorithm and machine learning models in landslide susceptibility mapping: A case study of Wanzhou section of the Three Gorges Reservoir, China. Comput. Geosci. 2022, 158, 104966. [Google Scholar] [CrossRef]
- Lee, S.; Ryu, J.H.; Won, J.S.; Park, H.J. Determination and application of the weights for landslide susceptibility mapping using an artificial neural network. Eng. Geol. 2004, 71, 289–302. [Google Scholar] [CrossRef]
- Armaş, I. Weights of evidence method for landslide susceptibility mapping. Prahova Subcarpathians, Romania. Nat. Hazards 2012, 60, 937–950. [Google Scholar] [CrossRef]
- Buckland, M.; Gey, F. The relationship between recall and precision. J. Am. Soc. Inf. Sci. 1994, 45, 12–19. [Google Scholar] [CrossRef]
- Ri, J.; Kim, H. G-mean based extreme learning machine for imbalance learning. Digit. Signal Process. 2020, 98, 102637. [Google Scholar] [CrossRef]
- Wang, M.; Qiao, J.p. Reservoir-landslide hazard assessment based on GIS: A case study in Wanzhou section of the Three Gorges Reservoir. J. Mt. Sci. 2013, 10, 1085–1096. [Google Scholar] [CrossRef]
- Huang, C.; Zhou, Q.; Zhou, L.; Cao, Y. Ancient landslide in Wanzhou District analysis from 2015 to 2018 based on ALOS-2 data by QPS-InSAR. Nat. Hazards 2021, 109, 1777–1800. [Google Scholar] [CrossRef]
- Wu, S.; Shi, L.; Wang, R.; Tan, C.; Hu, D.; Mei, Y.; Xu, R. Zonation of the landslide hazards in the forereservoir region of the Three Gorges Project on the Yangtze River. Eng. Geol. 2001, 59, 51–58. [Google Scholar] [CrossRef]
- Li, S.; Li, X.; Dong, Y. Study on Ji’an landslide characters and origin in Wanzhou Chongqing. Chin. J. Rock Mech. Eng. 2005, 24, 3159–3164. [Google Scholar]
- Song, Y.; Niu, R.; Xu, S.; Ye, R.; Peng, L.; Guo, T.; Li, S.; Chen, T. Landslide susceptibility mapping based on weighted gradient boosting decision tree in Wanzhou section of the Three Gorges Reservoir Area (China). ISPRS Int. J.-Geo-Inf. 2018, 8, 4. [Google Scholar] [CrossRef] [Green Version]
- Zhou, C.; Yin, K.; Cao, Y.; Ahmed, B.; Li, Y.; Catani, F.; Pourghasemi, H.R. Landslide susceptibility modeling applying machine learning methods: A case study from Longju in the Three Gorges Reservoir area, China. Comput. Geosci. 2018, 112, 23–37. [Google Scholar] [CrossRef] [Green Version]
- Pourghasemi, H.R.; Pradhan, B.; Gokceoglu, C. Application of fuzzy logic and analytical hierarchy process (AHP) to landslide susceptibility mapping at Haraz watershed, Iran. Nat. Hazards 2012, 63, 965–996. [Google Scholar] [CrossRef]
- Moayedi, H.; Mehrabi, M.; Mosallanezhad, M.; Rashid, A.S.A.; Pradhan, B. Modification of landslide susceptibility mapping using optimized PSO-ANN technique. Eng. Comput. 2019, 35, 967–984. [Google Scholar] [CrossRef]
- Montgomery, D.R.; Dietrich, W.E. A physically based model for the topographic control on shallow landsliding. Water Resour. Res. 1994, 30, 1153–1171. [Google Scholar] [CrossRef]
- Kalantar, B.; Pradhan, B.; Naghibi, S.A.; Motevalli, A.; Mansor, S. Assessment of the effects of training data selection on the landslide susceptibility mapping: A comparison between support vector machine (SVM), logistic regression (LR) and artificial neural networks (ANN). Geomat. Nat. Hazards Risk 2018, 9, 49–69. [Google Scholar] [CrossRef]
- Jaafari, A.; Najafi, A.; Pourghasemi, H.; Rezaeian, J.; Sattarian, A. GIS-based frequency ratio and index of entropy models for landslide susceptibility assessment in the Caspian forest, northern Iran. Int. J. Environ. Sci. Technol. 2014, 11, 909–926. [Google Scholar] [CrossRef] [Green Version]
- Hua, Y.; Wang, X.; Li, Y.; Xu, P.; Xia, W. Dynamic development of landslide susceptibility based on slope unit and deep neural networks. Landslides 2021, 18, 281–302. [Google Scholar] [CrossRef]
- Hong, H.; Liu, J.; Bui, D.T.; Pradhan, B.; Acharya, T.D.; Pham, B.T.; Zhu, A.X.; Chen, W.; Ahmad, B.B. Landslide susceptibility mapping using J48 Decision Tree with AdaBoost, Bagging and Rotation Forest ensembles in the Guangchang area (China). Catena 2018, 163, 399–413. [Google Scholar] [CrossRef]
- Roodposhti, M.S.; Rahimi, S.; Beglou, M.J. PROMETHEE II and fuzzy AHP: An enhanced GIS-based landslide susceptibility mapping. Nat. Hazards 2014, 73, 77–95. [Google Scholar] [CrossRef]
- Gong, W.; Hu, M.; Zhang, Y.; Tang, H.; Liu, D.; Song, Q. GIS-Based Landslide Susceptibility Mapping using Ensemble Methods for Fengjie County in the Three Gorges Reservoir Region, China; Springer: Berlin/Heidelberg, Germany, 2021. [Google Scholar]
- Van Westen, C.; Rengers, N.; Soeters, R. Use of geomorphological information in indirect landslide susceptibility assessment. Nat. Hazards 2003, 30, 399–419. [Google Scholar] [CrossRef]
- Cheng, J.; Dai, X.; Wang, Z.; Li, J.; Qu, G.; Li, W.; She, J.; Wang, Y. Landslide susceptibility assessment model construction using typical machine learning for the Three Gorges Reservoir Area in China. Remote Sens. 2022, 14, 2257. [Google Scholar] [CrossRef]
- Wang, D.; Zhang, Y.; Zhao, Y. LightGBM: An effective miRNA classification method in breast cancer patients. In Proceedings of the 2017 International Conference on Computational Biology and Bioinformatics, Newark, NJ, USA, 18–20 October 2017; pp. 7–11. [Google Scholar]
- Ke, G.; Meng, Q.; Finley, T.; Wang, T.; Chen, W.; Ma, W.; Ye, Q.; Liu, T.Y. Lightgbm: A highly efficient gradient boosting decision tree. Adv. Neural Inf. Process. Syst. 2017, 30. [Google Scholar]
- Freedman, D.A. Bootstrapping regression models. Ann. Stat. 1981, 9, 1218–1228. [Google Scholar] [CrossRef]
- Wu, W.; Zhang, Q.; Singh, V.P.; Wang, G.; Zhao, J.; Shen, Z.; Sun, S. A Data-Driven Model on Google Earth Engine for Landslide Susceptibility Assessment in the Hengduan Mountains, the Qinghai–Tibetan Plateau. Remote Sens. 2022, 14, 4662. [Google Scholar] [CrossRef]
- Castellanos, F.J.; Valero-Mas, J.J.; Calvo-Zaragoza, J.; Rico-Juan, J.R. Oversampling imbalanced data in the string space. Pattern Recognit. Lett. 2018, 103, 32–38. [Google Scholar] [CrossRef] [Green Version]
- Liu, A.; Ghosh, J.; Martin, C. Generative Oversampling for Mining Imbalanced Datasets. In Proceedings of the DMIN, Prague, Czech Republic, 23–30 June 2007; pp. 66–72. [Google Scholar]
- Chawla, B.; Chawla, N.V.; Bowyer, K.W.; Hall, L.O.; Kegelmeyer, W.P. SMOTE: Synthetic minority over-sampling technique. J. Artif. Intell. Res. 2002, 16, 321–357. [Google Scholar] [CrossRef]
- Fernández, A.; Garcia, S.; Herrera, F.; Chawla, N.V. SMOTE for learning from imbalanced data: Progress and challenges, marking the 15-year anniversary. J. Artif. Intell. Res. 2018, 61, 863–905. [Google Scholar] [CrossRef]
- Liu, X.Y.; Wu, J.; Zhou, Z.H. Exploratory undersampling for class-imbalance learning. IEEE Trans. Syst. Man, Cybern. Part B 2008, 39, 539–550. [Google Scholar]
- Fawcett, T. An introduction to ROC analysis. Pattern Recognit. Lett. 2006, 27, 861–874. [Google Scholar] [CrossRef]
- Brodersen, K.H.; Ong, C.S.; Stephan, K.E.; Buhmann, J.M. The balanced accuracy and its posterior distribution. In Proceedings of the 2010 20th International Conference on Pattern Recognition, Istanbul, Turkey, 23–26 August 2010; pp. 3121–3124. [Google Scholar]
- Huang, J.; Ling, C.X. Using AUC and accuracy in evaluating learning algorithms. IEEE Trans. Knowl. Data Eng. 2005, 17, 299–310. [Google Scholar] [CrossRef] [Green Version]
- Ri, J.H.; Tian, G.; Liu, Y.; Xu, W.h.; Lou, J.g. Extreme learning machine with hybrid cost function of G-mean and probability for imbalance learning. Int. J. Mach. Learn. Cybern. 2020, 11, 2007–2020. [Google Scholar] [CrossRef]
- Lobo, J.M.; Jiménez-Valverde, A.; Real, R. AUC: A misleading measure of the performance of predictive distribution models. Glob. Ecol. Biogeogr. 2008, 17, 145–151. [Google Scholar] [CrossRef]
- Townsend, J.T. Theoretical analysis of an alphabetic confusion matrix. Percept. Psychophys. 1971, 9, 40–50. [Google Scholar] [CrossRef]
- Visa, S.; Ramsay, B.; Ralescu, A.L.; Van Der Knaap, E. Confusion matrix-based feature selection. Maics 2011, 710, 120–127. [Google Scholar]
- Zhao, M.; Zhong, S.; Fu, X.; Tang, B.; Pecht, M. Deep residual shrinkage networks for fault diagnosis. IEEE Trans. Ind. Inform. 2019, 16, 4681–4690. [Google Scholar] [CrossRef]
- Hu, J.; Shen, L.; Sun, G. Squeeze-and-excitation networks. In Proceedings of the IEEE Conference on Computer Vision and Pattern Recognition, Salt Lake City, UT, USA, 18–23 June 2018; pp. 7132–7141. [Google Scholar]
| Disclaimer/Publisher’s Note: The statements, opinions and data contained in all publications are solely those of the individual author(s) and contributor(s) and not of MDPI and/or the editor(s). MDPI and/or the editor(s) disclaim responsibility for any injury to people or property resulting from any ideas, methods, instructions or products referred to in the content. |
© 2023 by the authors. Licensee MDPI, Basel, Switzerland. This article is an open access article distributed under the terms and conditions of the Creative Commons Attribution (CC BY) license (https://creativecommons.org/licenses/by/4.0/).


 ,
, 


