Article

Identifying Spatiotemporal Patterns of Multiscale Connectivity in the Flow Space of Urban Agglomeration in the Yellow River Basin

1
Key Laboratory of Geospatial Technology for the Middle and Lower Yellow River Regions, Henan University, Ministry of Education, Kaifeng 475004, China
2
College of Geography and Environmental Science, Henan University, Kaifeng 475004, China
3
Henan Industrial Technology Academy of Spatiotemporal Big Data, Henan University, Zhengzhou 450046, China
4
Urban Big Data Institute, Henan University, Kaifeng 475004, China
5
Henan Technology Innovation Center of Spatiotemporal Big Data, Henan University, Zhengzhou 450046, China
6
School of Future Technology, China University of Geosciences, Wuhan 430074, China
*
Author to whom correspondence should be addressed.
ISPRS Int. J. Geo-Inf. 2023, 12(11), 447; https://doi.org/10.3390/ijgi12110447
Submission received: 25 August 2023 / Revised: 10 October 2023 / Accepted: 26 October 2023 / Published: 30 October 2023

Abstract

:
The United Nations Sustainable Development Goals (SDGs) and the rise of global sustainability science have led to the increasing recognition of basins as the key natural geographical units for human–land system coupling and spatial coordinated development. The effective measurement of spatiotemporal patterns of urban connectivity within a basin has become a key issue in achieving basin-related SDGs. Meanwhile, China has been actively working toward co-ordinated regional development through in-depth implementation of the Yellow River Basin’s ecological protection and high-quality development. Urban connectivity has been trending in urban planning, and significant progress has been made on different scales according to the flow space theory. Nevertheless, few studies have been conducted on the multiscale spatiotemporal patterns of urban agglomeration connectivity. In this study, the urban network in the Yellow River Basin was constructed using Tencent population migration data from 2015 and 2019. It was then divided into seven distinct communities to enable analysis at both the basin and community scales. Centrality, symmetry, and polycentricity indices were employed, and the multiscale spatiotemporal patterns of urban agglomerations in the Yellow River Basin were identified using community detection, complex networks, and the migration kaleidoscope method. Community connectivity was notably concentrated at the basin scale with a centripetal pattern and spatial heterogeneity. Additionally, there was a symmetrical and co-ordinated relationship in population migration between the eastern and western regions of the basin, as well as between the internal and external parts of the basin. At the community scale, there was significant variation in the extent of central agglomeration among different communities, with few instances of similar-level, long-distance, and interregional bilateral links. The utilization of multiscale spatiotemporal patterns has the potential to enhance the comprehension of economic cooperation between various cities and urban agglomerations. This understanding can aid decision-makers in formulating sustainable development policies that foster the spatial integration of the basin.

1. Introduction

In the context of globalization and informatization, transformations to the network paradigm are occurring in urban relations. With the continuous development of regional transportation and information infrastructure, the effect of space–time compression between cities has become increasingly significant, and various elements are frequently exchanged between cities across physical distances, thus allowing “flow space” [1,2]. Combining the “flow space” theory with the study of world cities to address the “attributes but not connections” limitation, Taylor innovatively used inter-enterprise relational data to research world city networks [3]. Since then, many scholars have used multisource data, such as traffic flow [4,5,6], population flow [7,8], information flow [9,10,11], and enterprise flow [12,13,14], to describe the urban network structure, functional connections between cities, organizational models, and impact mechanisms from different dimensions. Most of these studies have focused on the hierarchical differences in urban connection strength; however, the description of the connection direction needs to be further expanded. Using the gravity model, Chen et al. [15] simulated and analyzed the directional characteristics of interactions among cities. Alderson et al. [16] investigated the prestige and power of different cities in the world’s urban system through in-degree and out-degree. To characterize the asymmetry of intercity element exchanges, the concepts and quantification methods, such as node symmetry and link symmetry, were proposed to compensate for the limitation in research on urban networks, i.e., “emphasizing the strength of connection and neglect the direction of connection” [17].
The network embedding ability of cities (clusters) in multiscale regions has attracted increasing attention. The functional connections of cities in multiscale areas are not completely independent, and the interactive networking of enterprises within cities helps to improve the status of cities in the global network, which in turn can attract more elements to a city, resulting in a strong multiplier effect [18]. Urban agglomerations have gradually become the basic unit in which countries participate in global competitions and have come to play an important role in shifting the world’s economic center of gravity. Many studies have focused on the spatial connections among cities at different scales and within urban agglomerations. Ni et al. [19] measured the strength of Chinese cities’ external connections and the connection levels in the global city network on a global scale based on the office locations of multinational corporations. Some scholars have quantitatively analyzed China’s urban network and urban connections nationally based on the geographical distribution of the headquarters and branches of large financial enterprises such as banks within the country [20,21]. Additionally, the spatial connections within urban agglomerations are primarily concentrated in more mature urban agglomerations, such as the Yangtze River Delta, the Pearl River Delta, and the Beijing–Tianjin–Hebei region. Few multiscale studies analyzing urban agglomeration connections use agglomerations as the base unit. Fortune China Top 500 Enterprises data have been used to analyze the spatial connections between 19 urban agglomerations and 41 major cities in China [22]. Zhao and Cao et al. [23,24] conducted in-depth research on the functional differentiation and interaction effects of cross-scale networks in urban agglomerations. Hu et al. [25] analyzed the spatial structure, scale structure, and network node structure among five urban agglomerations, i.e., the Yangtze River Delta, the Pearl River Delta, Beijing–Tianjin–Hebei, the middle reaches of the Yangtze River, and Chengdu–Chongqing, based on origin–destination (OD) data on China’s railways.
Due to the constraints of traditional localism and the “administrative area economy”, regional units often physically separate the integrity of the natural geographical units set by mobile resource elements, resulting in the fragmentation of regional governance and imbalances in social, economic, and environmental development [26,27]. To meet the need for high-quality development and ecological civilization construction, the Chinese government has attached increasing importance to the high-quality development of natural geographical units, such as deltas, bay areas, and basins. To study urban networks, administrative, azimuth, type, and policy areas have been expanded to geographic unit areas dominated by natural geographical or system units [28,29]. In 2019, as a major national strategy, China proposed the ecological protection and high-quality development of the Yellow River Basin. However, the basin still faces problems, such as insufficient overall development, unbalanced regional development, and insufficient innovation and radiation ability of central cities. It is necessary to scientifically analyze the multiscale network connections of the Yellow River Basin urban agglomerations, clarify the functional positioning of the core cities and urban agglomerations, promote the spatial integration of urban agglomerations with network integration, and provide a more effective spatial organization foundation for the implementation of ecological protection and high-quality development strategies in the Yellow River Basin than there are at present [30]. This paper focuses on identifying spatiotemporal patterns in multiscale connectivity in urban networks. Based on the Tencent population migration data in 2015 and 2019, the network was constructed and then divided into communities, allowing for analysis at both the basin and community scales. Centrality, symmetry, and polycentricity indices were employed, and the multiscale spatiotemporal patterns of urban agglomerations in the Yellow River Basin were identified using community detection, complex networks, and the migration kaleidoscope method.
The remainder of this paper is organized as follows. Section 2 describes our study area and data. Section 3 introduces the methodology frameworks. Section 4 examines the spatiotemporal patterns in multiscale connectivity on the flow space of urban agglomerations in the Yellow River Basin. Section 5 discusses the paper’s findings. Section 6 provides a concise summary of the paper.
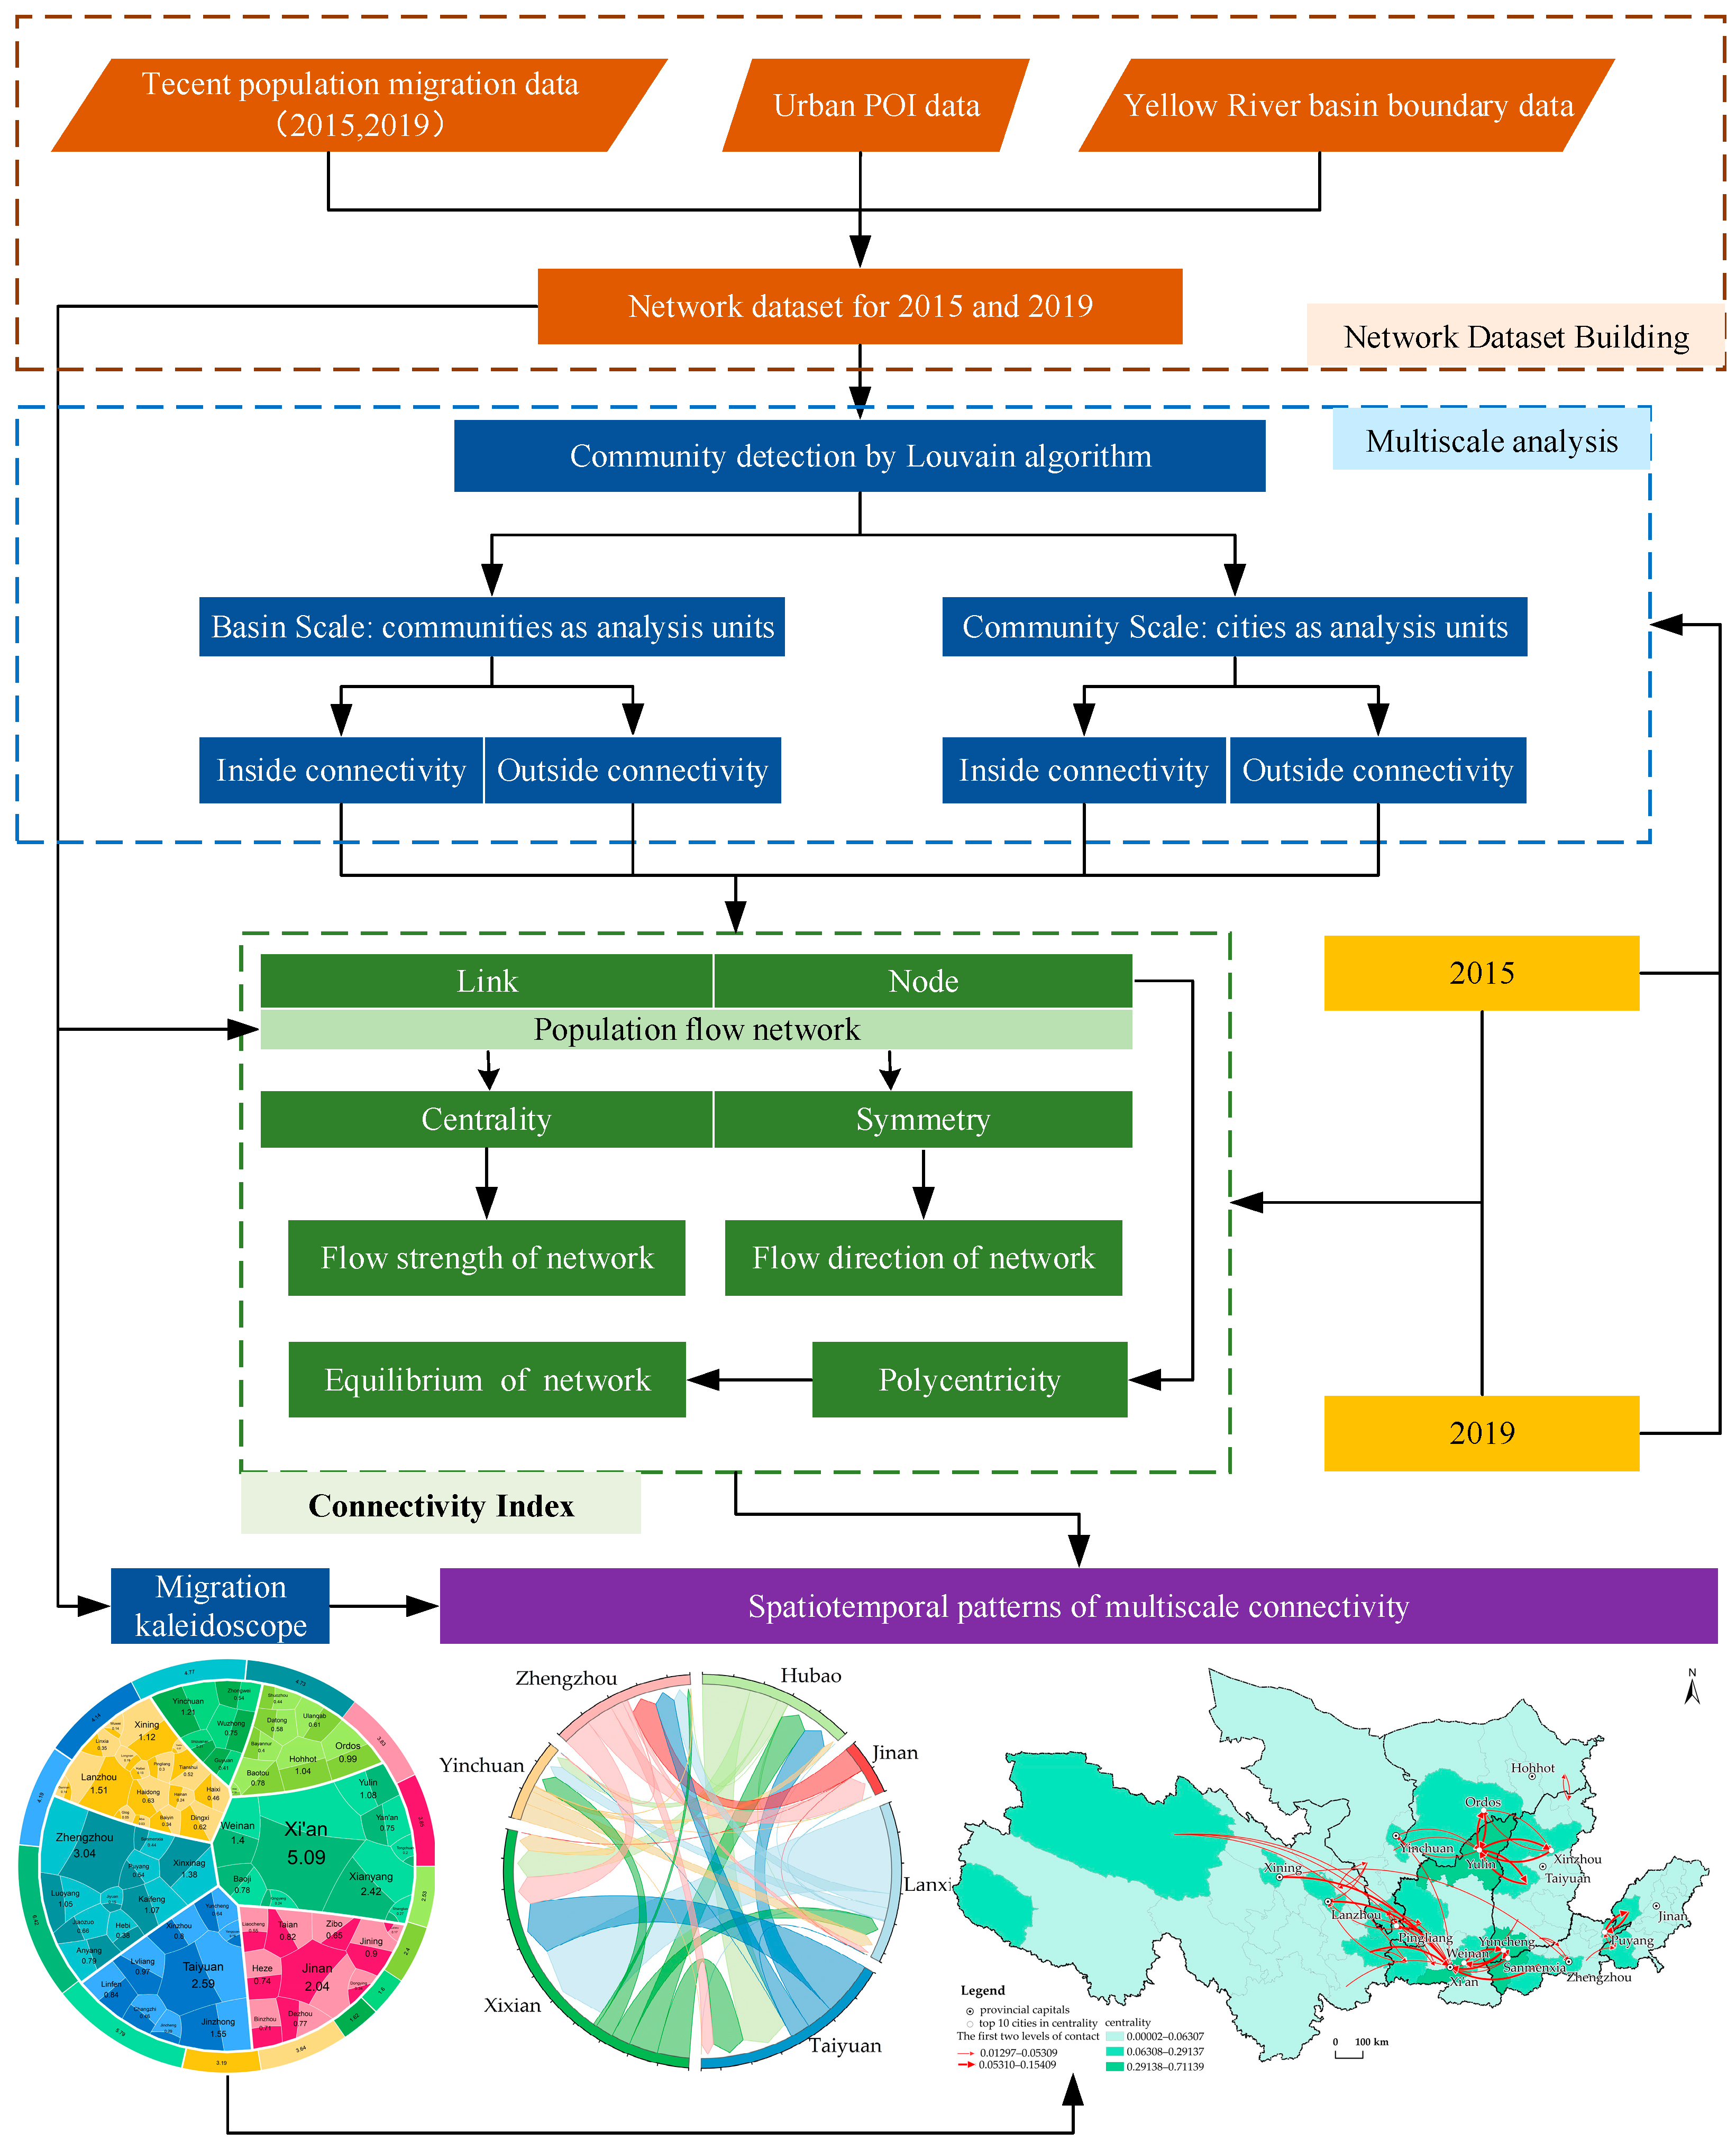
2. Study Area and Data

2.1. Study Area

The Yellow River Basin is the birthplace of Chinese civilization. It spans China’s three major economic zones and nine provincial-level administrative regions from west to east, with a total length of 5464 km and a basin area of 795,000 km2. The overall development level of the Yellow River Basin is low, and the regional development is imbalanced [31]. By the end of 2021, the permanent population of the nine provinces along the river was 420 million, accounting for 29.79% of the national total; the regional gross domestic product (GDP) was CNY 28.7 trillion, accounting for 24.97% of the national GDP; the per capita GDP in the basin was CNY 68,000, which was CNY 12,000 lower than the national average; and the range in the provincial per capita GDP of the nine provinces was CNY 44,000. The urban agglomerations that support the high-quality development of the Yellow River Basin present a “3 + 4” spatial organization pattern [32]; the Shandong peninsula urban agglomeration, Central Plain urban agglomeration, and Guanzhong Plain urban agglomeration are three regional urban agglomerations with a relatively high degree of development and are distributed in the middle and lower reaches of the Yellow River. The Jinzhong urban agglomeration, Hubao–Eyu urban agglomeration, Ningxia urban agglomeration, and Lanxi urban agglomeration are four local urban agglomerations that are relatively poorly developed and are distributed in the middle and upper reaches of the Yellow River. Based on the scope of the Yellow River Basin delimited by the Yellow River Conservancy Commission (YRCC) of the Ministry of Water Resource, China, the study area includes 68 prefecture-level cities (autonomous prefectures and leagues) in nine provinces (autonomous regions), i.e., Shandong, Henan, Shanxi, Shaanxi, Inner Mongolia, Ningxia, Gansu, Qinghai, and Sichuan. Due to the administrative regions of these 68 cities overlapping with the scope of the basin, they are defined as cities within the basin. On the contrary, 295 cities with no overlap between the administrative regions and the basin scope were identified as cities outside the basin. We employed boundary data from the Resource and Environment Science and Data Center of the Chinese Academy of Sciences (https://www.resdc.cn/ (accessed on 1 June 2022)) to create Figure 1.

2.2. Data Sources and Processing

To comprehensively reveal the spatial connections among cities and urban agglomerations of different scales in the Yellow River Basin, in this study, the top ten migration data for 363 cities in 2015 and 2019 with various modes of transportation, such as rail, road, and air (from 1 January to 30 June) were crawled on the Tencent Location Big Data service platform (https://heat.qq.com/qianxi.php (accessed on 5 June 2022)). Tencent, a prominent Internet corporation in China, holds significant influence within the digital landscape and boasts a broad user base encompassing nearly all Chinese smartphone users. In December 2019 and June 2023, Tencent WeChat had 1.151 and 1.327 billion monthly active user accounts, respectively. In other words, most of China’s population uses WeChat at least once a month (https://www.statista.com/statistics/255778/number-of-active-wechat-messenger-accounts (accessed on 5 June 2022)). The dataset captures the mobile trajectory of users’ travel patterns, making it well-suited for assessing the intercity migration of the population in the Yellow River Basin [33]. The data attributes include the year, o_code, o_city, d_code, d_city, busvalue, trainvalue, airvalue, and allvalue. Gephi software was employed to merge the inflow and outflow population migration data, and the standardized “allvalue” was selected to represent the strength of intercity connections [34,35]. Consequently, 16,162 directed connections in 2015 and 19,678 in 2019 were obtained (Table 1 and Table 2). The connection from o_city to d_city is regarded as an outflow connection, while the connection from d_city to o_city is regarded as an inflow connection [36]. Both o_city and d_city are located inside the basin, thus classifying this urban connection as intercity connections inside the basin (898 records in 2015 and 852 records in 2019). If only one of o_city or d_city is inside the basin, this urban connection is identified as the external connection of cities inside the basin (3106 records in 2015 and 3480 records in 2019). If neither o_city nor d_city is inside the basin, this urban connection is identified as the intercity connection of cities outside the basin (12,158 records in 2015 and 15,346 records in 2019) [37]. In addition, in January 2019, Jinan City and Laiwu City merged to form the new Jinan City. To maintain the coherence and accuracy of the data, in this study, Laiwu City is still regarded as a separate prefecture-level city. The AMap platform (https://ditu.amap.com/ (accessed on 20 June 2022)) provides POI data from 363 city government sites. Taking POI as the network nodes and urban population migration as the network connections, we constructed a multiscale-directed network of urban agglomeration in the Yellow River Basin.

3. Methodology

The study framework is shown in Figure 2. Based on the urban POI data and Tencent population migration data from 2015 and 2019, a directed urban network in the Yellow River Basin is constructed. Second, the Louvain algorithm is used to identify the community structure of the urban network, and two network analysis scales of basin and community are formed. Finally, with communities and cities as analysis units, the indices of centrality, symmetry, and polycentricity are used to reflect the strength, direction, and equilibrium of the internal and external connections of the basin and community. Combined with spatial analysis and migration kaleidoscope visualization, the multiscale spatiotemporal patterns of urban agglomeration connections in the Yellow River Basin are identified.

3.1. Community Detection

In a complex network, a community refers to a network cluster with closely connected internal nodes and a specific organizational relationship; these network clusters embody the functional attributes of the system, and their essential characteristics are “high cohesion” and “low coupling” [38]. Community is sometimes referred to as “clustering” in sociology and computer science [39]. In urban geography, scholars use community to describe tightly connected urban groups [34,40]. The current mainstream community detection algorithms include Girvan–Newman, Fast-greedy, Label Propagation, Louvain, and Infomap. Among these, the Louvain algorithm proposed by Blondel et al. is based on graph clustering to optimize modularity at multiple levels and can effectively extract the inherent community structure in the mobile network [41]. Unlike other community detection algorithms, Louvain’s algorithm divides the community under the condition of unsupervised classification, which does not limit the number of communities, and its community detection results have high objectivity and practicability [42]. Modularity is usually used to measure the quality of community division; the formula is as follows:
Q = 1 2 m ij A i j k i k j 2 m δ ( c i c j )
where  m  is the total number of links in the network,  A ij  is the flow from node  i  to node  j k i  is the degree of node  i C i  represents an assigned community of node  i , and  Q  is modularity. The closer the value is to 1, the more pronounced the network’s community structure and the better the division’s quality.

3.2. Centrality and Symmetry

Centrality and symmetry describe the multiscale network connection characteristics of the urban agglomeration in the Yellow River Basin from the strength and direction. Centrality is the sum of in-degree and out-degree and is used to reflect the status of cities and urban agglomerations in the network. The urban network of the Yellow River Basin is a directed weighted network. The in-degree and out-degree mentioned in this paper are the weighted in-degree and weighted out-degree, respectively. Limtanakool et al. [17,43] used symmetry to characterize the element relationships between cities and embody the flow elements’ directional attributes. Node symmetry describes the symmetrical relationship between the in-degree and the out-degree of a city; the formula is as follows:
NS I i = I i O i I i + O i ,
where  I i  is the in-degree of city  i O i  is the out-degree of city  I , and  NS I i  is the nodal symmetry of city  i , with a range of  [ 1 ,   1 ] . The more the node symmetry tends toward 0, the more symmetrical the node; if the node symmetry is greater than 0, there is a net inflow of the population, and if the node symmetry is less than 0, there is a net outflow of the population.
Link symmetry identifies the asymmetry level of urban links. To highlight the advantages of link symmetry in vector descriptions, the link symmetry modified by Liu Zheng [36] is used. The formula is:
LS Γ ij = 2 f ij 1 ,
where  f ij  is the flow ratio from node  i  to node  j  to the total flow between the two nodes. When  LS Γ ij < 0 , the flow from node  i  to node  j  is smaller than the flow from node  j  to node  i ; when  LS Γ ij = 0 , there is a bidirectional equivalent flow, and when  LS Γ ij > 0 , the flow from node  i  to node  j  is larger than the flow from node  j  to node  i . The range of  LS Γ ij  is  [ 1 ,   1 ] .

3.3. Polycentricity

Polycentricity is mainly employed as a metric to assess the level of equilibrium in the interconnections within an urban network. The measurement of polycentricity in scholarly research is primarily conducted through two methods: rank-size regression analysis on city centrality, as demonstrated by Burger and Meijers [44,45], or the utilization of the Gini coefficient, as explored by Huang et al. [46] and Li et al. [47]. However, these approaches have not adequately captured the polycentricity structure in terms of network interactions. Asymmetry is a defining feature of urban systems that are fully monocentric, wherein specialized functions are concentrated in a limited number of cities that solely receive flows without reciprocating them. On the other hand, symmetry characterizes fully polycentric systems, where the absence of dominant nodes in the network allows for horizontal flows of elements [17,48,49]. Hence, polycentricity may also be articulated as follows:
P = 1 i = 1 n NS I i n ,
where  NS I ij  is the node symmetry for city  i ,  and  P  is polycentric, with a range of  [ 0 ,   1 ] . The closer the value is to 1, the stronger the polycentricity is.

3.4. Migration Kaleidoscope

Chordal graphs have gained significant attention in the study of network topology in recent years [50,51,52]. However, these graphs do not provide a comprehensive representation of the directional and multilevel linkages inherent in complex network connections. Hence, this study employs the migration kaleidoscope developed by Gu et al. [53] to integrate the Voronoi-based kaleidoscope for network topology visualization. This approach aims to depict the comparative position of each node within the network as either an origin or a destination, thereby facilitating an understanding of the spatiotemporal evolution of urban network connections from multiple scales, regions, and periods.

4. Results

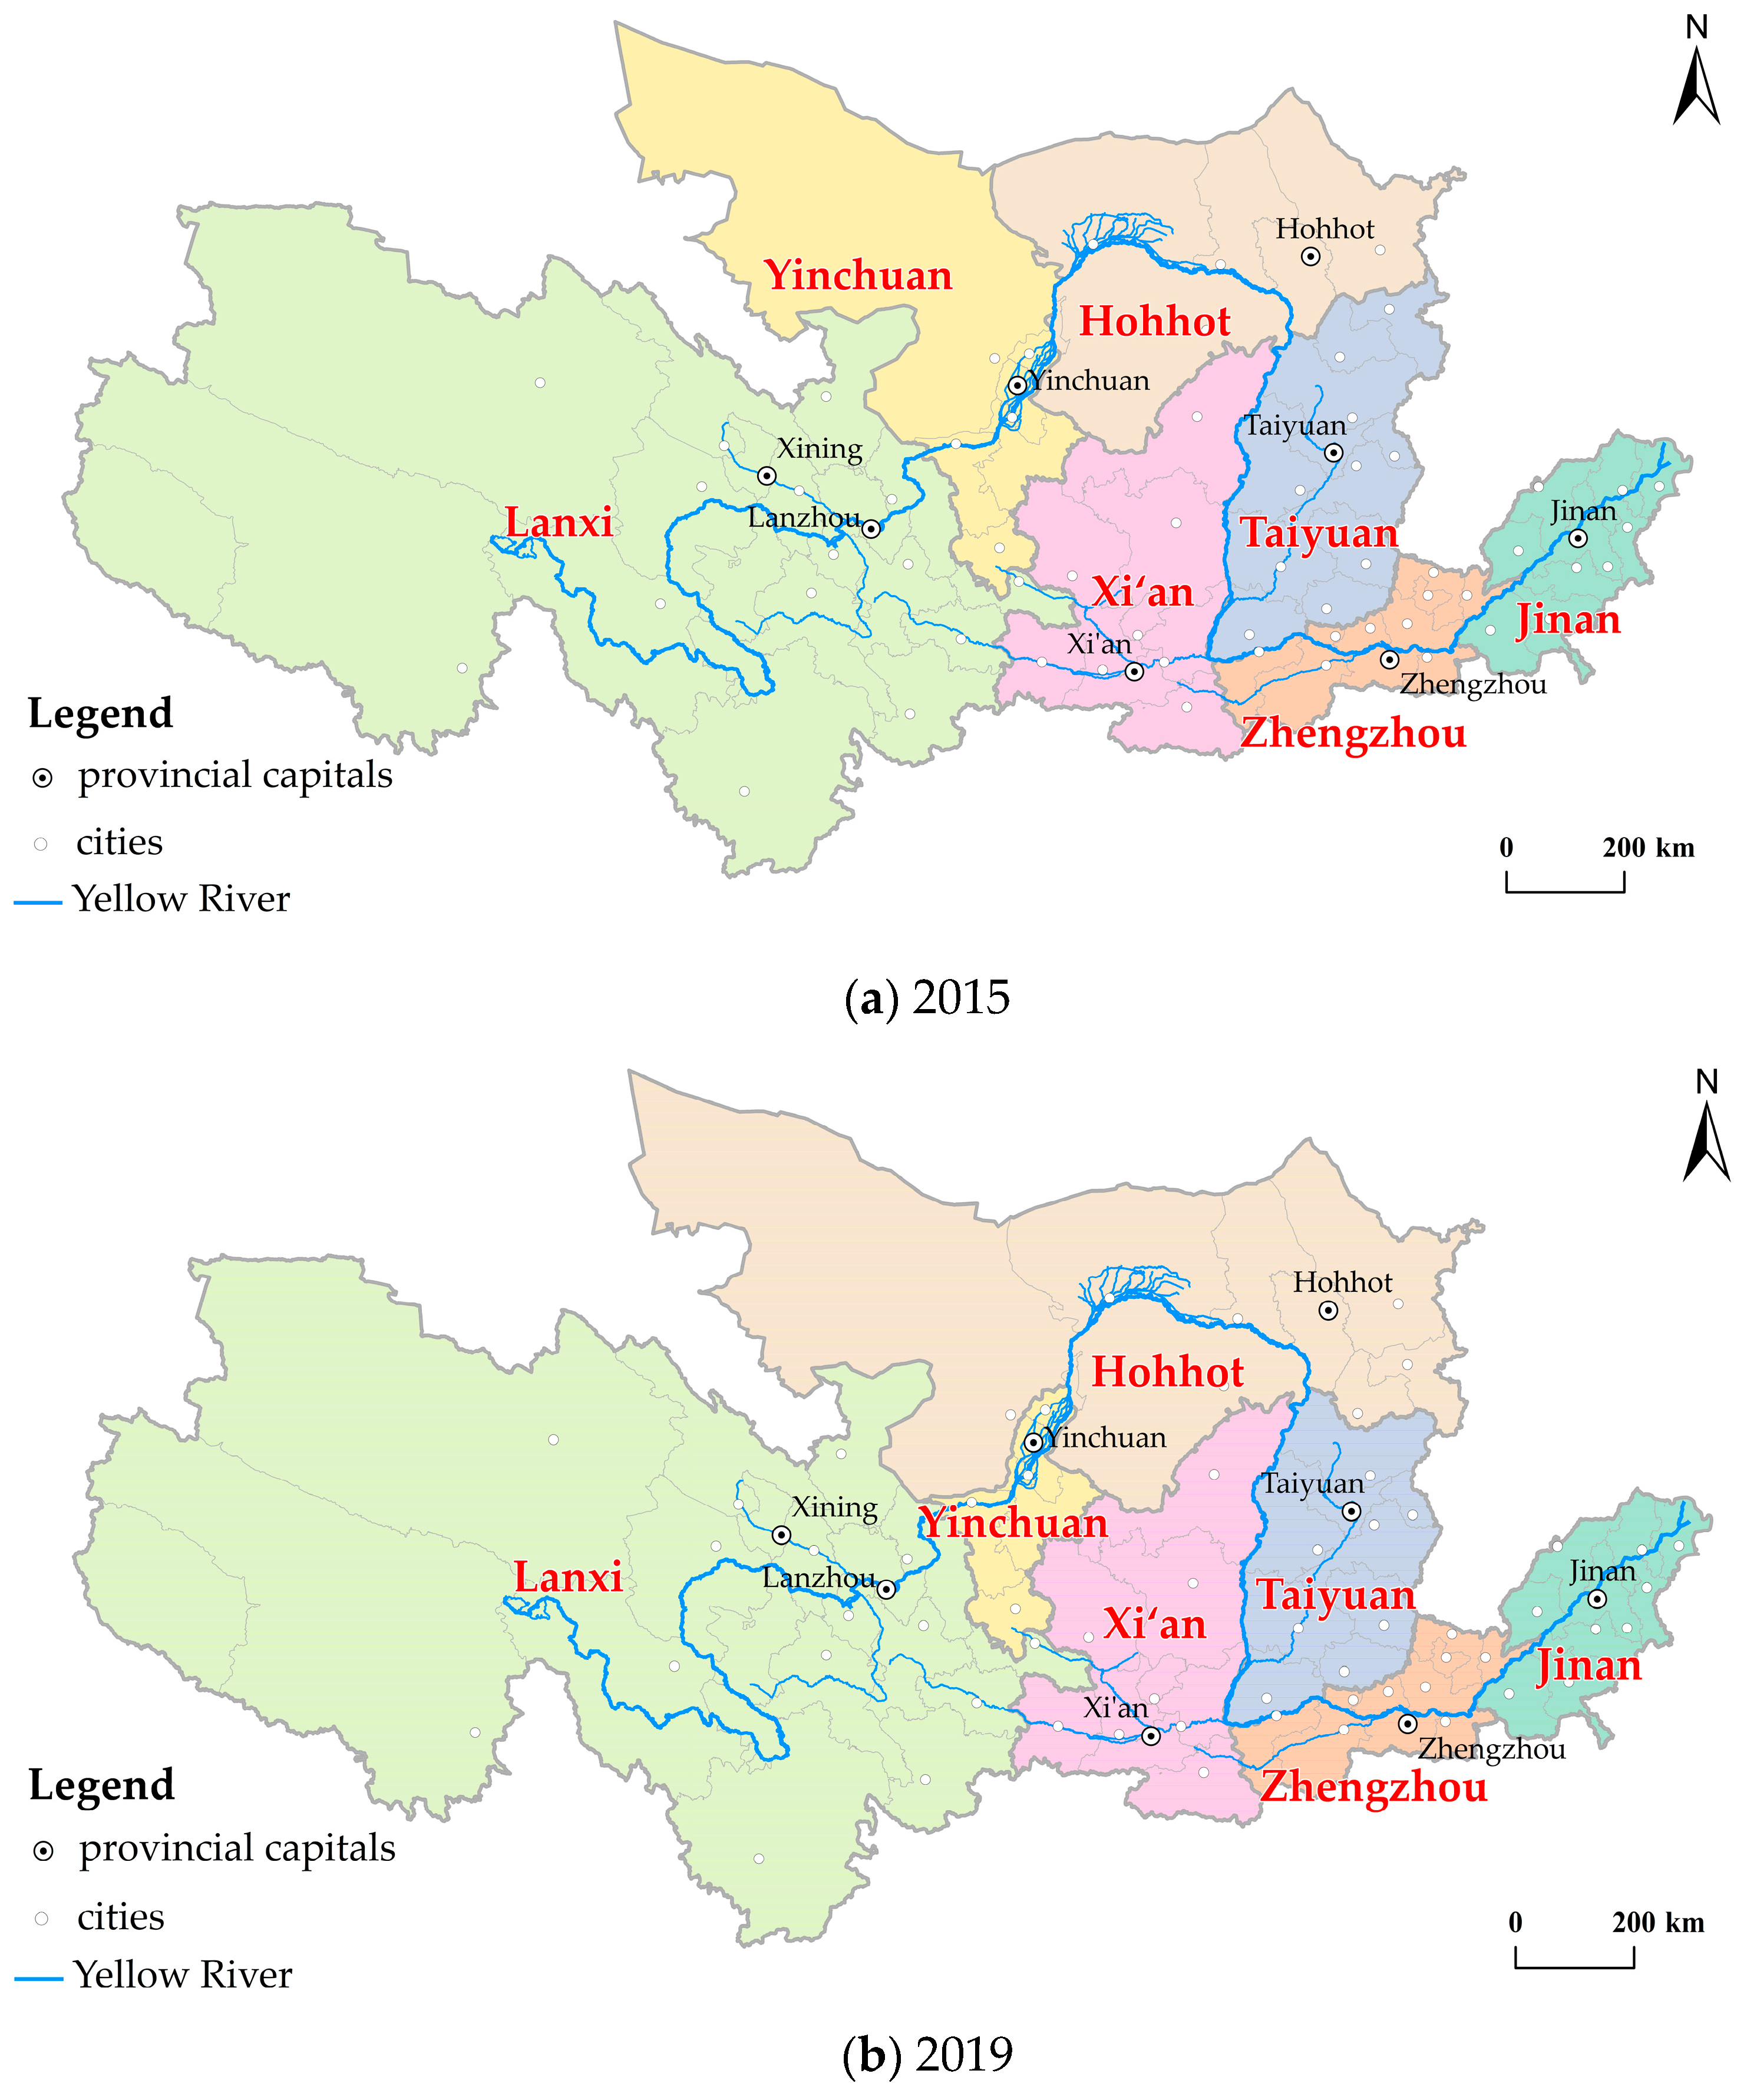
4.1. Urban Network Community Detection

The modularity values obtained by utilizing Gephi software for community detection in 2019 reveal a maximum modularity of 0.698 for in-basin communities and 0.491 for outside-basin communities (Table 3). These findings indicate the presence of distinct community structures within the Yellow River basin network and its surrounding areas. The basin consists of seven communities, namely, Jinan, Zhengzhou, Taiyuan, Xi’an, Lanxi, Yinchuan, and Hohhot (community names are based on the distribution of provincial capitals), which exhibit strong internal organization and limited exterior links (Figure 3). The majority of these communities adhere to the provincial administrative boundaries, exhibiting distinct economic features associated with administrative areas. Notably, the division outcomes for urban communities and urban agglomerations in the middle and lower regions of the Yellow River Basin demonstrate a considerable level of consistency. These findings are aligned with those of Zhao et al. [54], which indicate that interprovincial administrative divisions serve as the main obstacle to the unrestricted flow and integrated development of various production factors within the Yellow River Basin. In 2019, the strength of urban connections within the urban agglomerations and provinces accounted for 68.44% and 88.63% of the urban network inside the basin. Regarding evolutionary patterns, the modularity values observed in 2015 and 2019 were 0.708 and 0.698, respectively, indicating a progressive strengthening of inter-community relationships. Specifically, the Alxa League, Datong, and Shuozhou have recently become part of the Hohhot community, which was previously composed of the Yinchuan and Taiyuan communities. As a result, their levels of integration with the Hohhot community have experienced notable increases of 22.77%, 55.51%, and 34.55%, respectively. A significant enhancement in the agglomeration effect of the Hubao–Egyu urban agglomeration on the urban network is illustrated.

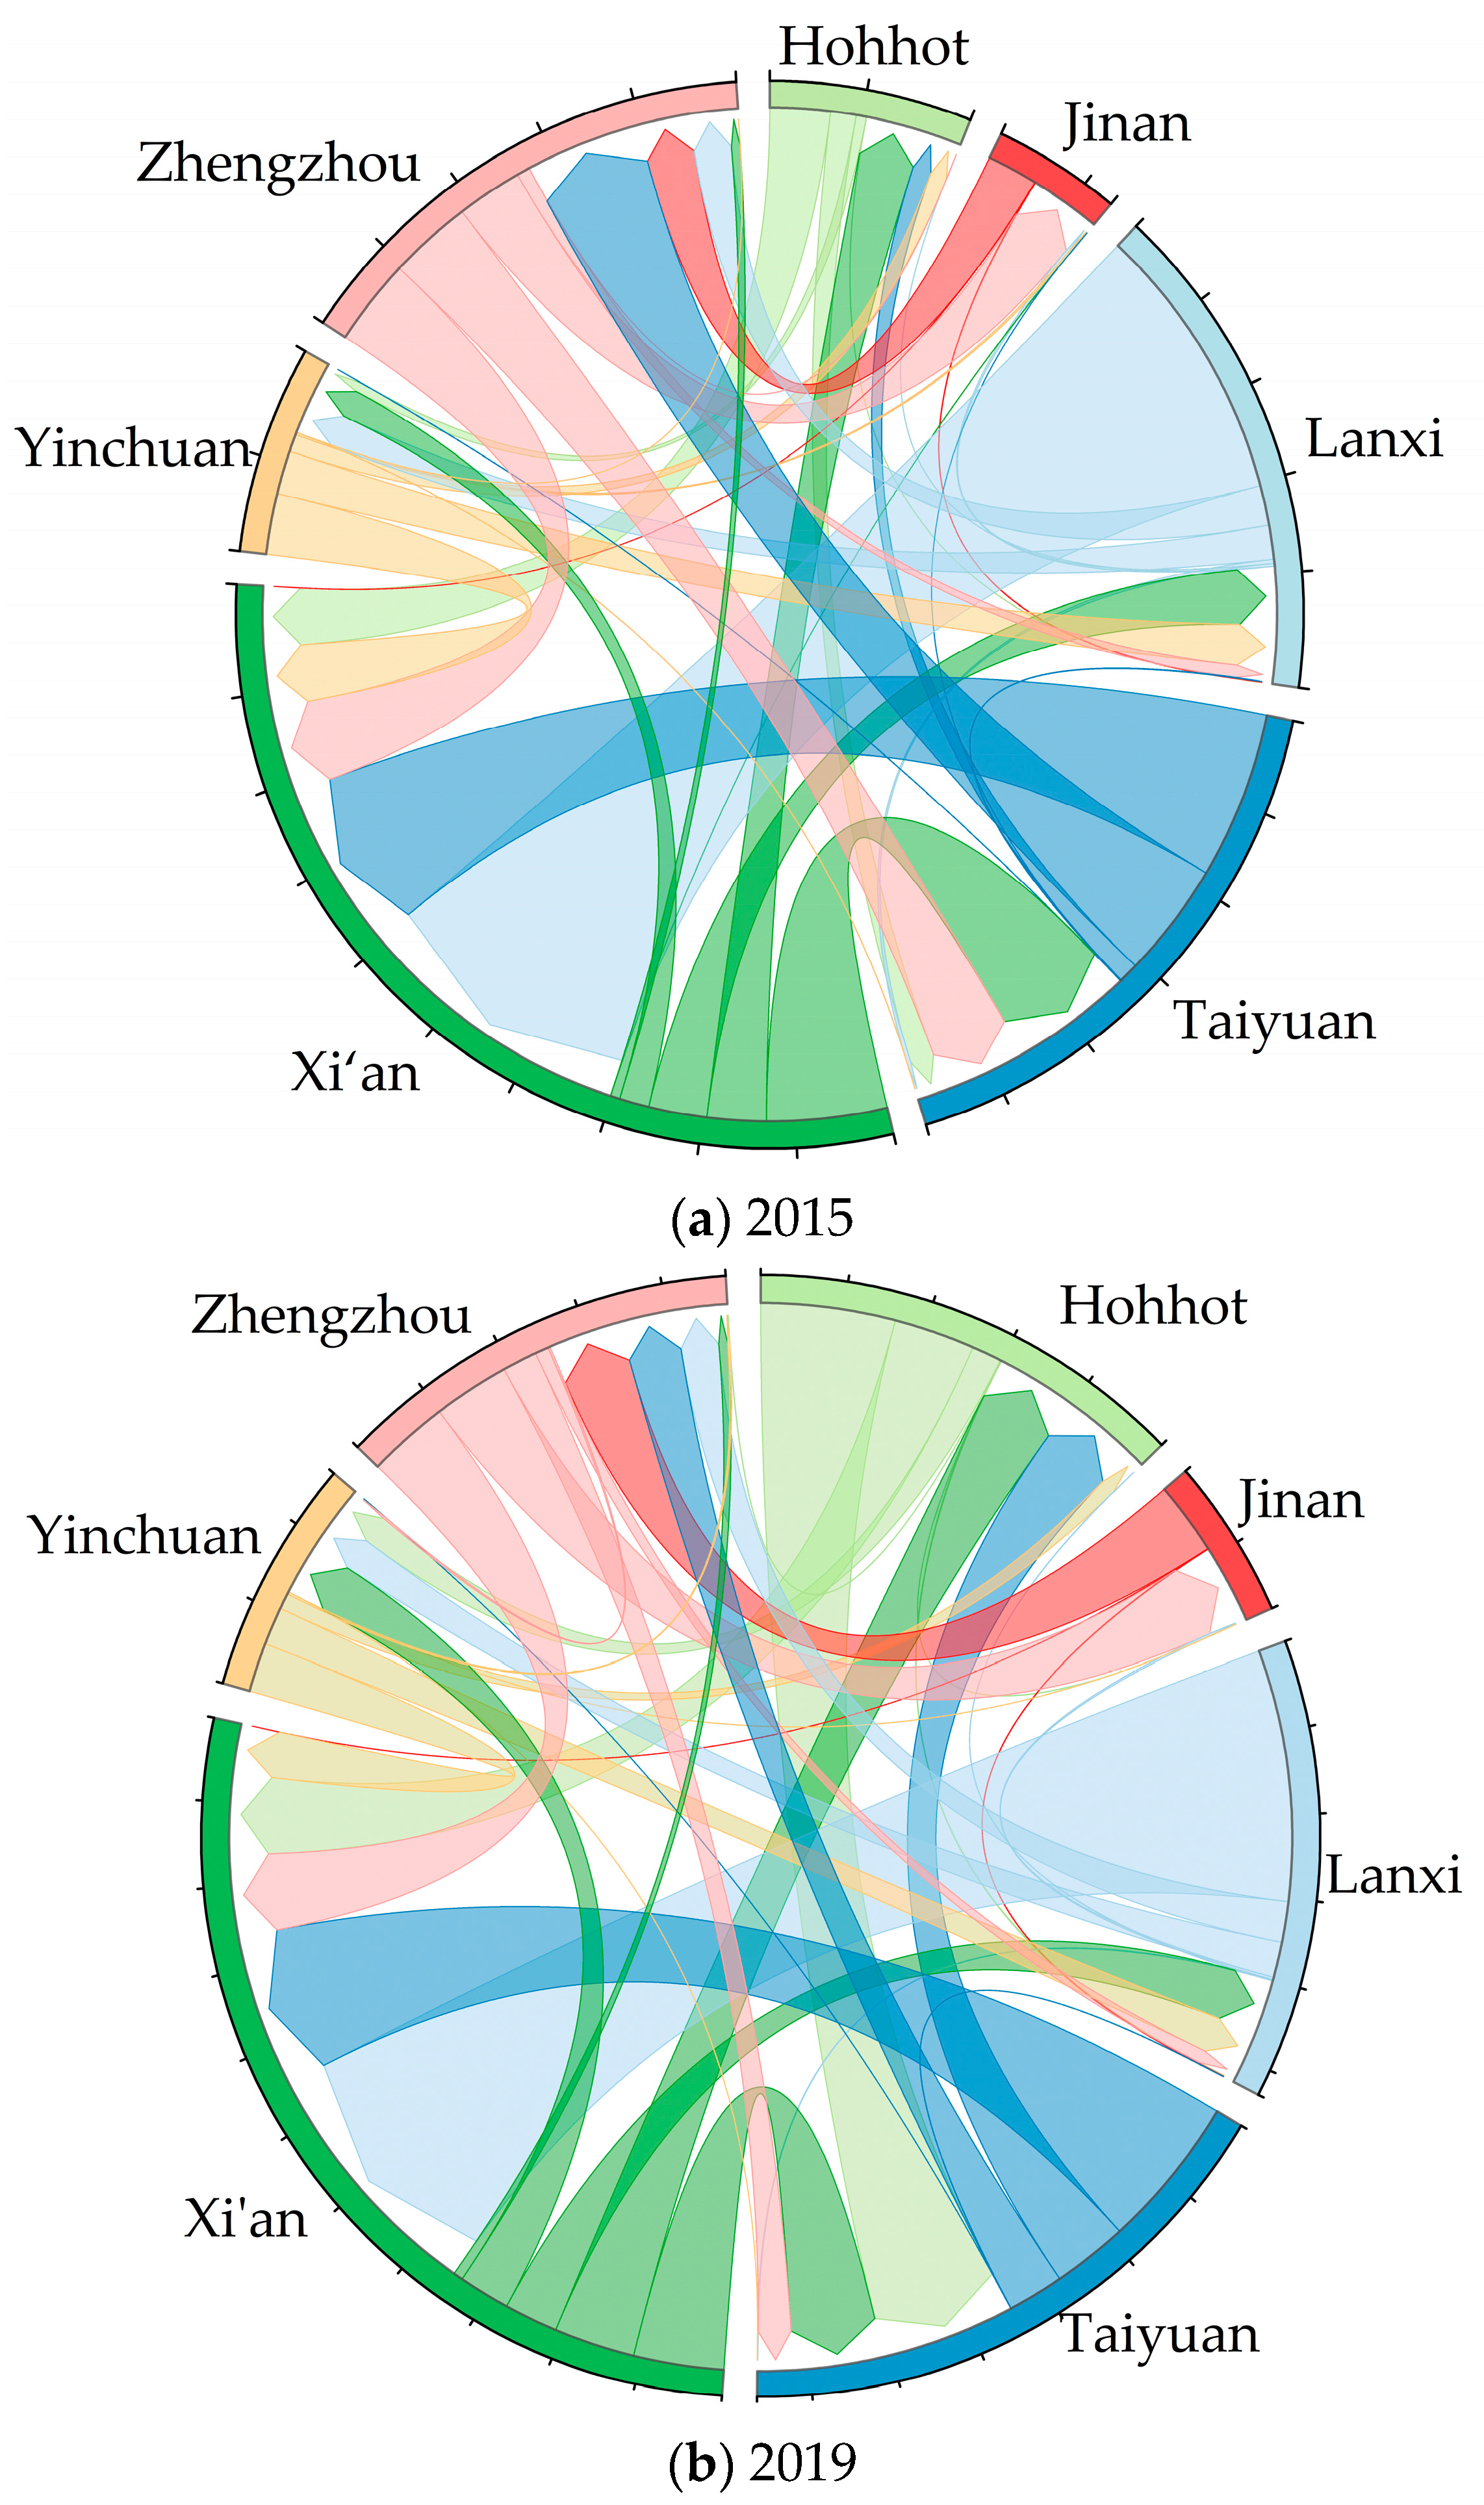
4.2. Community Connectivity inside the Basin

Taking the community as the unit of analysis, the chord diagram is used to visualize network connections between communities within the Yellow River Basin in 2015 and 2019 (Figure 4).
The community network connections inside the basin show prominent centripetal agglomeration characteristics. The Xi’an community is at the core of the community network in the basin, and its node centrality is 1.73, accounting for 29.37% of the community network (Table 4). The first connections of Zhengzhou, Taiyuan, Lanxi, and Yinchuan are directed to Xi’an, especially Lanxi, which has a particularly significant link asymmetry with the Xi’an community; the link symmetry is 0.65, and the net migration scale is 0.38, accounting for 59.36% of the net in-degree in Xi’an.
The proximity-oriented features are apparent. The centrality of the Taiyuan community and Lanxi community in the middle and upper reaches of the basin is relatively high, and the primary contact communities of Taiyuan are neighboring communities, i.e., Hohhot, Xi’an, and Zhengzhou. The centrality of the Zhengzhou and Jinan communities in the basin’s middle and lower reaches is relatively low. In particular, the Jinan community has the weakest connection with other communities in the basin, and the first connection with Jinan is the neighboring Zhengzhou community.
Population migration exhibits a clear and distinct asymmetrical pattern. The Xi’an community is a notable recipient of net inflow, exhibiting a node symmetry value of 0.36. Furthermore, a substantial proportion of the net out-degree in the Yellow River basin, specifically 94.22%, is directed toward the Xi’an community. The Lanxi and Hohhot communities, which are adjacent to the Xi’an community, exhibit clear patterns in net outflow. Specifically, the Lanxi community has a node symmetry of −0.51, while the Hohhot community has a node symmetry of −0.18. Notably, these two communities contribute 85.24% of the net out-degree within the Yellow River Basin. The Taiyuan, Zhengzhou, and Jinan communities in the middle and lower reaches of the basin exhibit limited symmetric linkages, as indicated in Table 5. Some population flows between communities are dominated by outflows, such as those from the Hohhot community to the Jinan and Zhengzhou communities and from the Yinchuan to the Jinan community (Table 6 and Table 7). For example, the flow from Jinan and Zhengzhou to Hohhot, as well as from Jinan to Yinchuan, is almost equal to 0; according to Equation (3), the ratio of the flow from Hohhot to Jinan and Zhengzhou, and from Yinchuan to Jinan to the total flow between them is 1, so the link symmetry is 1. However, the strength of these one-way connections is less than 0.0005, indicating limited population migration in the urban agglomerations of the Shandong Peninsula, the Central Plain, and the basin’s upper reaches.
The polycentric structure of the community network is enhanced. The node symmetry of the Xi’an community decreases from 0.41 to 0.36, and the radiation effect becomes increasingly significant; for marginal communities such as Hohhot, Jinan, and Yinchuan, the proportion of their centrality in the community network increases from 17.58% to 25.93%, and the network polarization is significantly weakened. From the perspective of community connections, the vertical relationship of the community network in the Yellow River Basin was more prominent in 2015. Except for Jinan, the first connections of other communities all point to Xi’an, and the link symmetry is greater than 0; by 2019, the polycentricity of the community network increased by 3.75%, and the link symmetry between the Yinchuan community and Xi’an community reduced from 0.35 to −0.03.

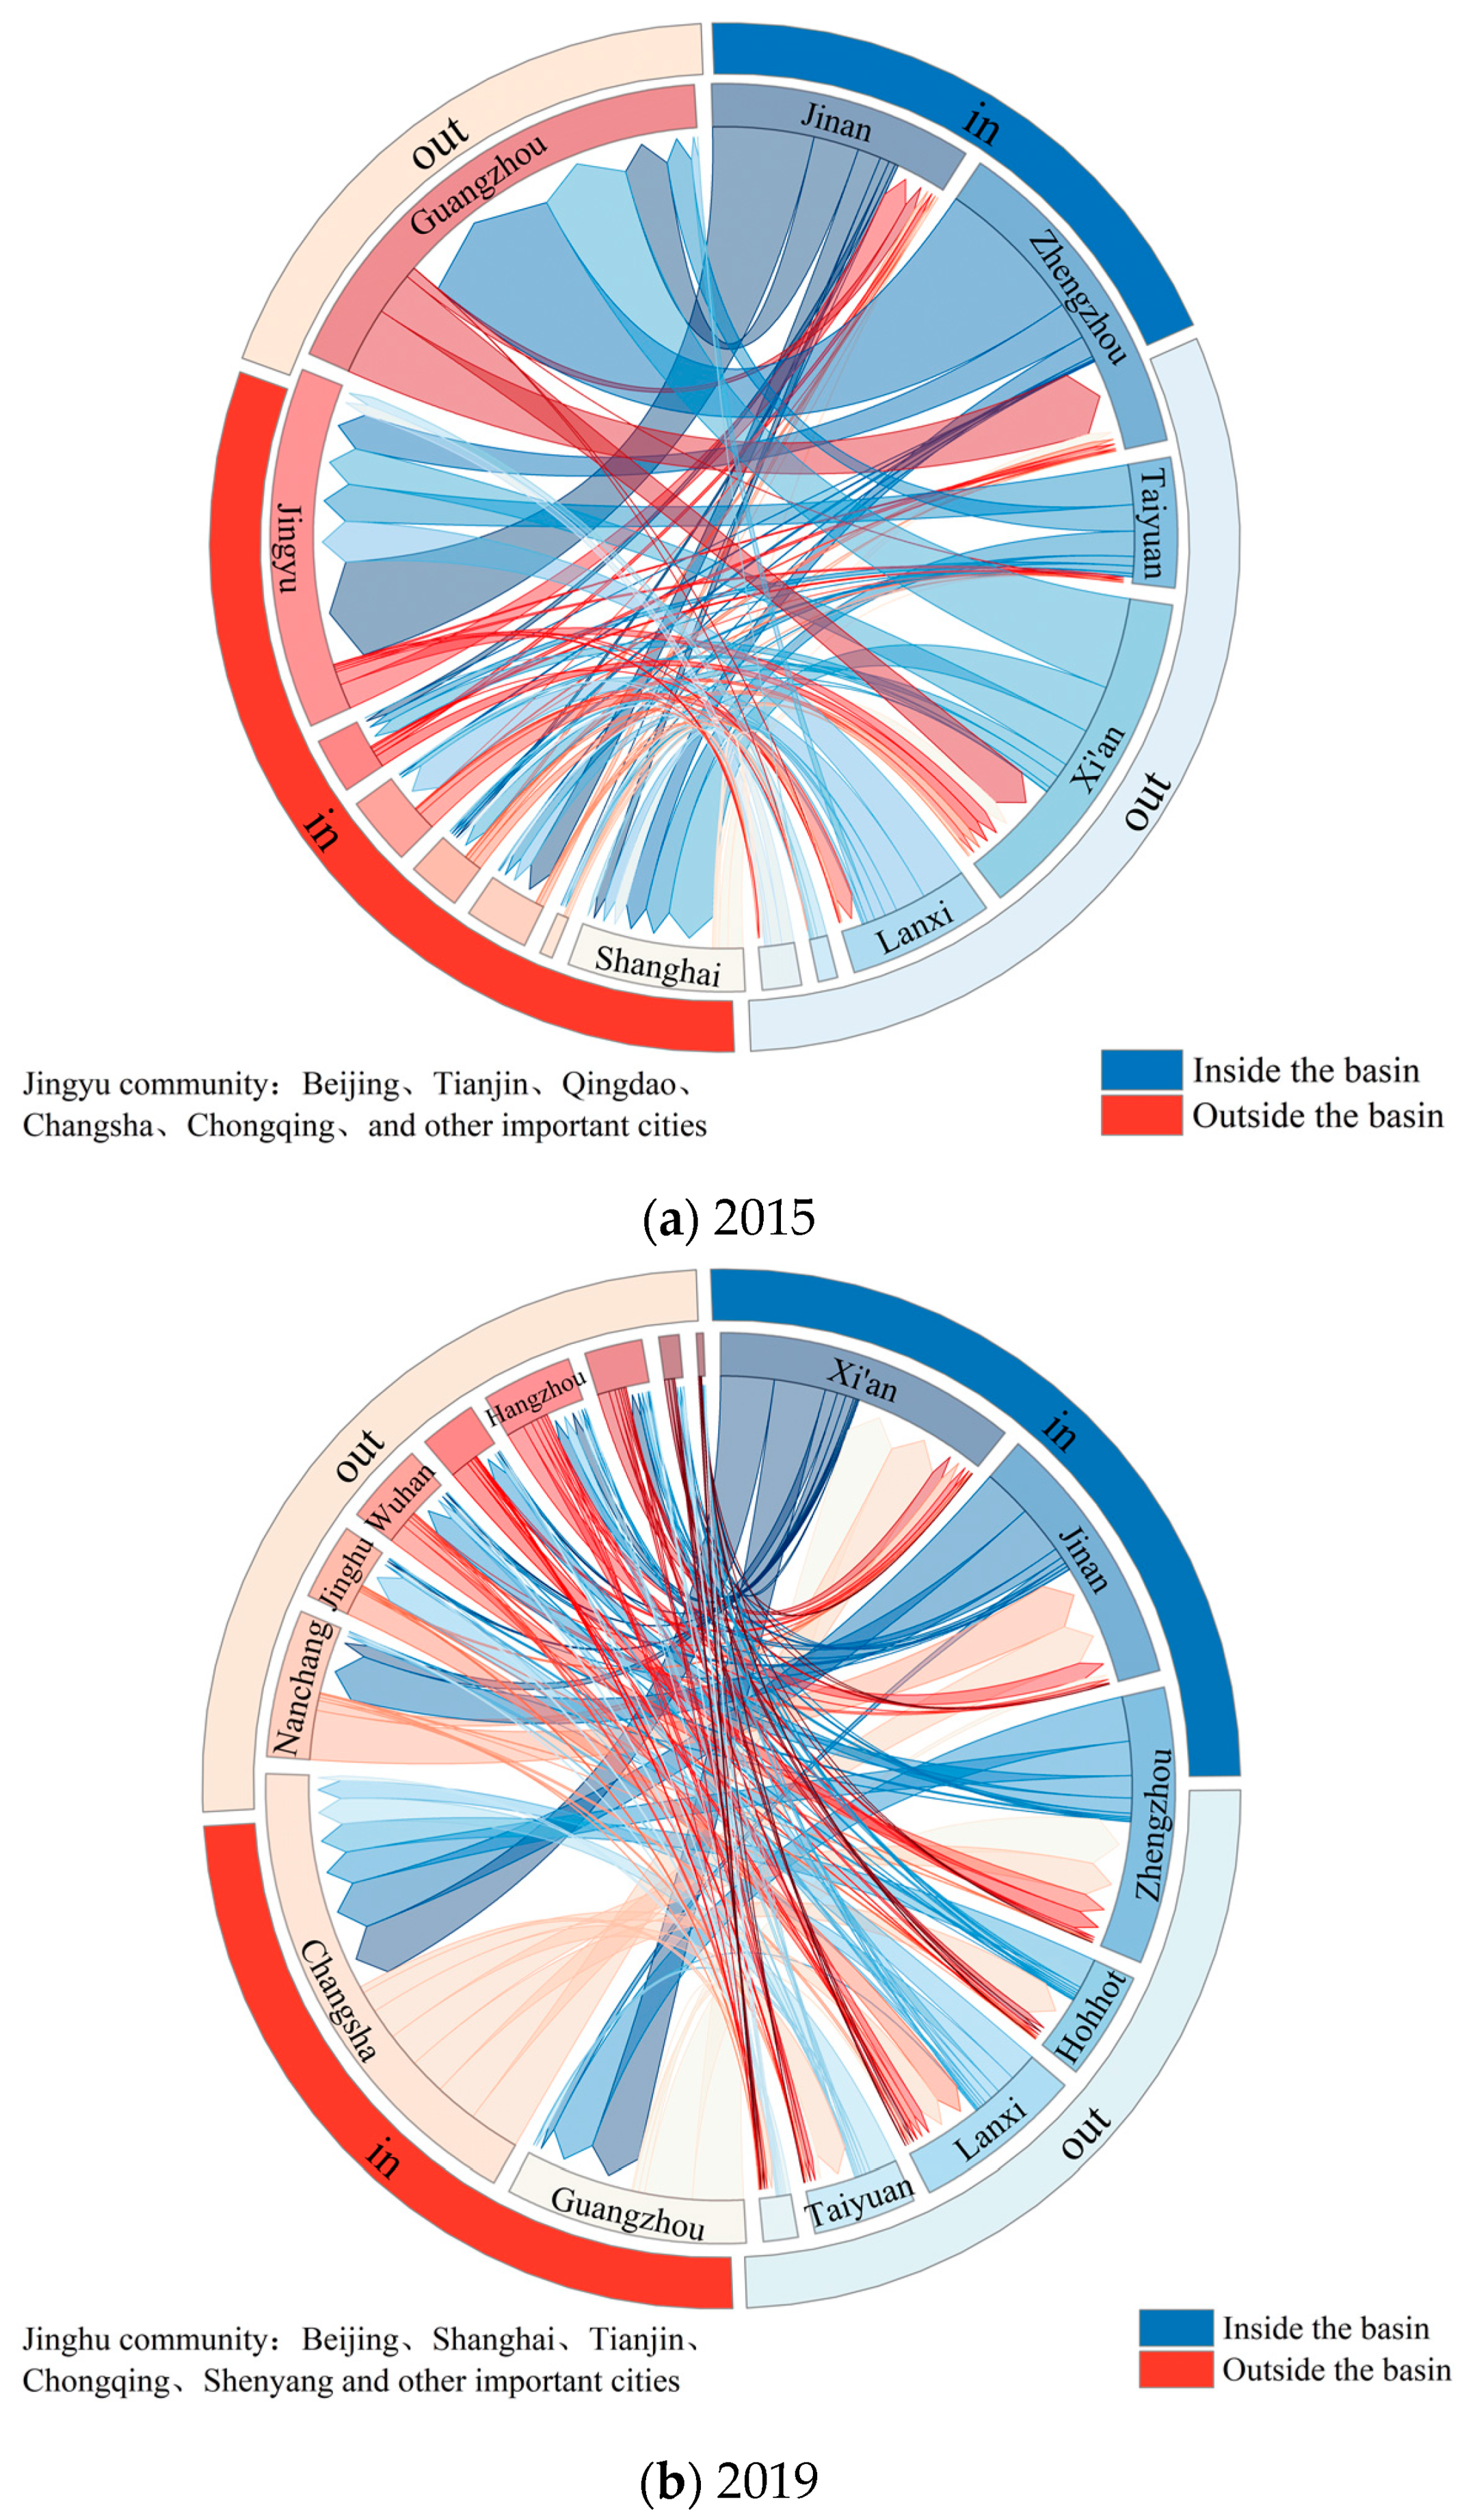
4.3. External Connectivity of Communities in the Basin

The external connection spatial patterns of communities in the upper and lower reaches of the basin are different (Figure 5). Jinan, Zhengzhou, and Xi’an in the middle and lower reaches of the basin have strong connection abilities with outside-basin communities and prominent spatial agglomeration characteristics (Table 8). The node centrality of the three communities ranks among the top three in the basin. Based on the national–local index described by Wei et al. [55], the basin-community index of the three communities is less than 0. The spatial agglomeration characteristics of the external connections of the three communities are apparent, and the first 30% of the connections control 85.64% of the connection strength, which mainly flows to the Guangzhou and Changsha communities. Taiyuan, Hohhot, Yinchuan, and Lanxi, which are in the middle and upper reaches of the river basin, have poor connection ability with the communities outside the basin. In particular, Yinchuan’s basin-community index is 0.42, indicative of a typical internal-oriented community. The external connections of these communities are relatively scattered, and the main connection directions are outside-basin communities such as Changsha, Beijing-Shanghai, Guangzhou, and Hangzhou. The external connection of the basin community is clearly spatially oriented. From the perspective of the outflow connection of the basin, the first connections of the seven communities in the basin all point to the major railway lines running through the north and the south, such as Beijing–Guangzhou, Beijing–Kowloon, and Beijing–Shanghai, showing prominent traffic orientation characteristics. In particular, the in-degree of Guangzhou and Changsha in the southern section of the Beijing–Guangzhou Line is the highest, reaching 16.62, and accounting for 57.71% of the out-degree in the basin. From the perspective of the inflow connection of the basin, the first connections of the communities outside the basin are concentrated in Xi’an, Zhengzhou, and Jinan in the middle and lower reaches of the Yellow River Basin. These communities are the economically developed areas of the Yellow River Basin and control 65.74% of the in-degree of the basin, showing a solid economic orientation.
The relationship between population movement in regions inside and beyond the basin exhibits increased symmetry and coordination. The level of symmetry in linkages between communities inside the basin and communities outside the basin decreases from 0.24 to −0.02. This shift indicates a change from a significant net outflow to a small net inflow. The main factor contributing to this transition is the notable improvement in the ability of communities in the western part of the basin to establish connections with areas outside the basin. Specifically, the link symmetry between these communities and those outside the basin decreases from 0.63 to −0.05, while the net in-degree reaches 1.02. This indicates a significant reduction in the economic disparity between the economically underdeveloped western portion of the Yellow River Basin and the regions outside the basin. Additionally, there is obvious population backflow in the western region of the basin.

4.4. Urban Connectivity within Communities

To further investigate the intracommunity network connection characteristics in the Yellow River Basin, the intracommunity network is extracted to analyze the strength and direction of the intracommunity network connections in different communities. In the symmetry analysis, considering that the “city pair” with a small intercity population migration scale has a certain degree of contingency in its link symmetry, a “city pair” with a connection strength greater than 0.0003 is used as the research object. Each community in the basin presents prominent centripetal agglomeration characteristics. The internal network connections of the communities in the basin all point to provincial capitals or economically developed cities, including Jinan, Zhengzhou, Taiyuan, Xi’an, Xianyang, Lanzhou, Xining, Yinchuan, Hohhot, and Baotou. In particular, Lanxi, Xi’an, Jinan, and Zhengzhou show obvious single-center agglomeration, mainly pointing to the provincial capital in each community. These provincial capitals control approximately 30% of the connection strength in the communities, and the node symmetry also ranks at the top. The network connection between Yinchuan and Hohhot in the middle and upper reaches shows a weak dual-center structure, and the agglomeration centers are mainly provincial capitals and economically developed cities.
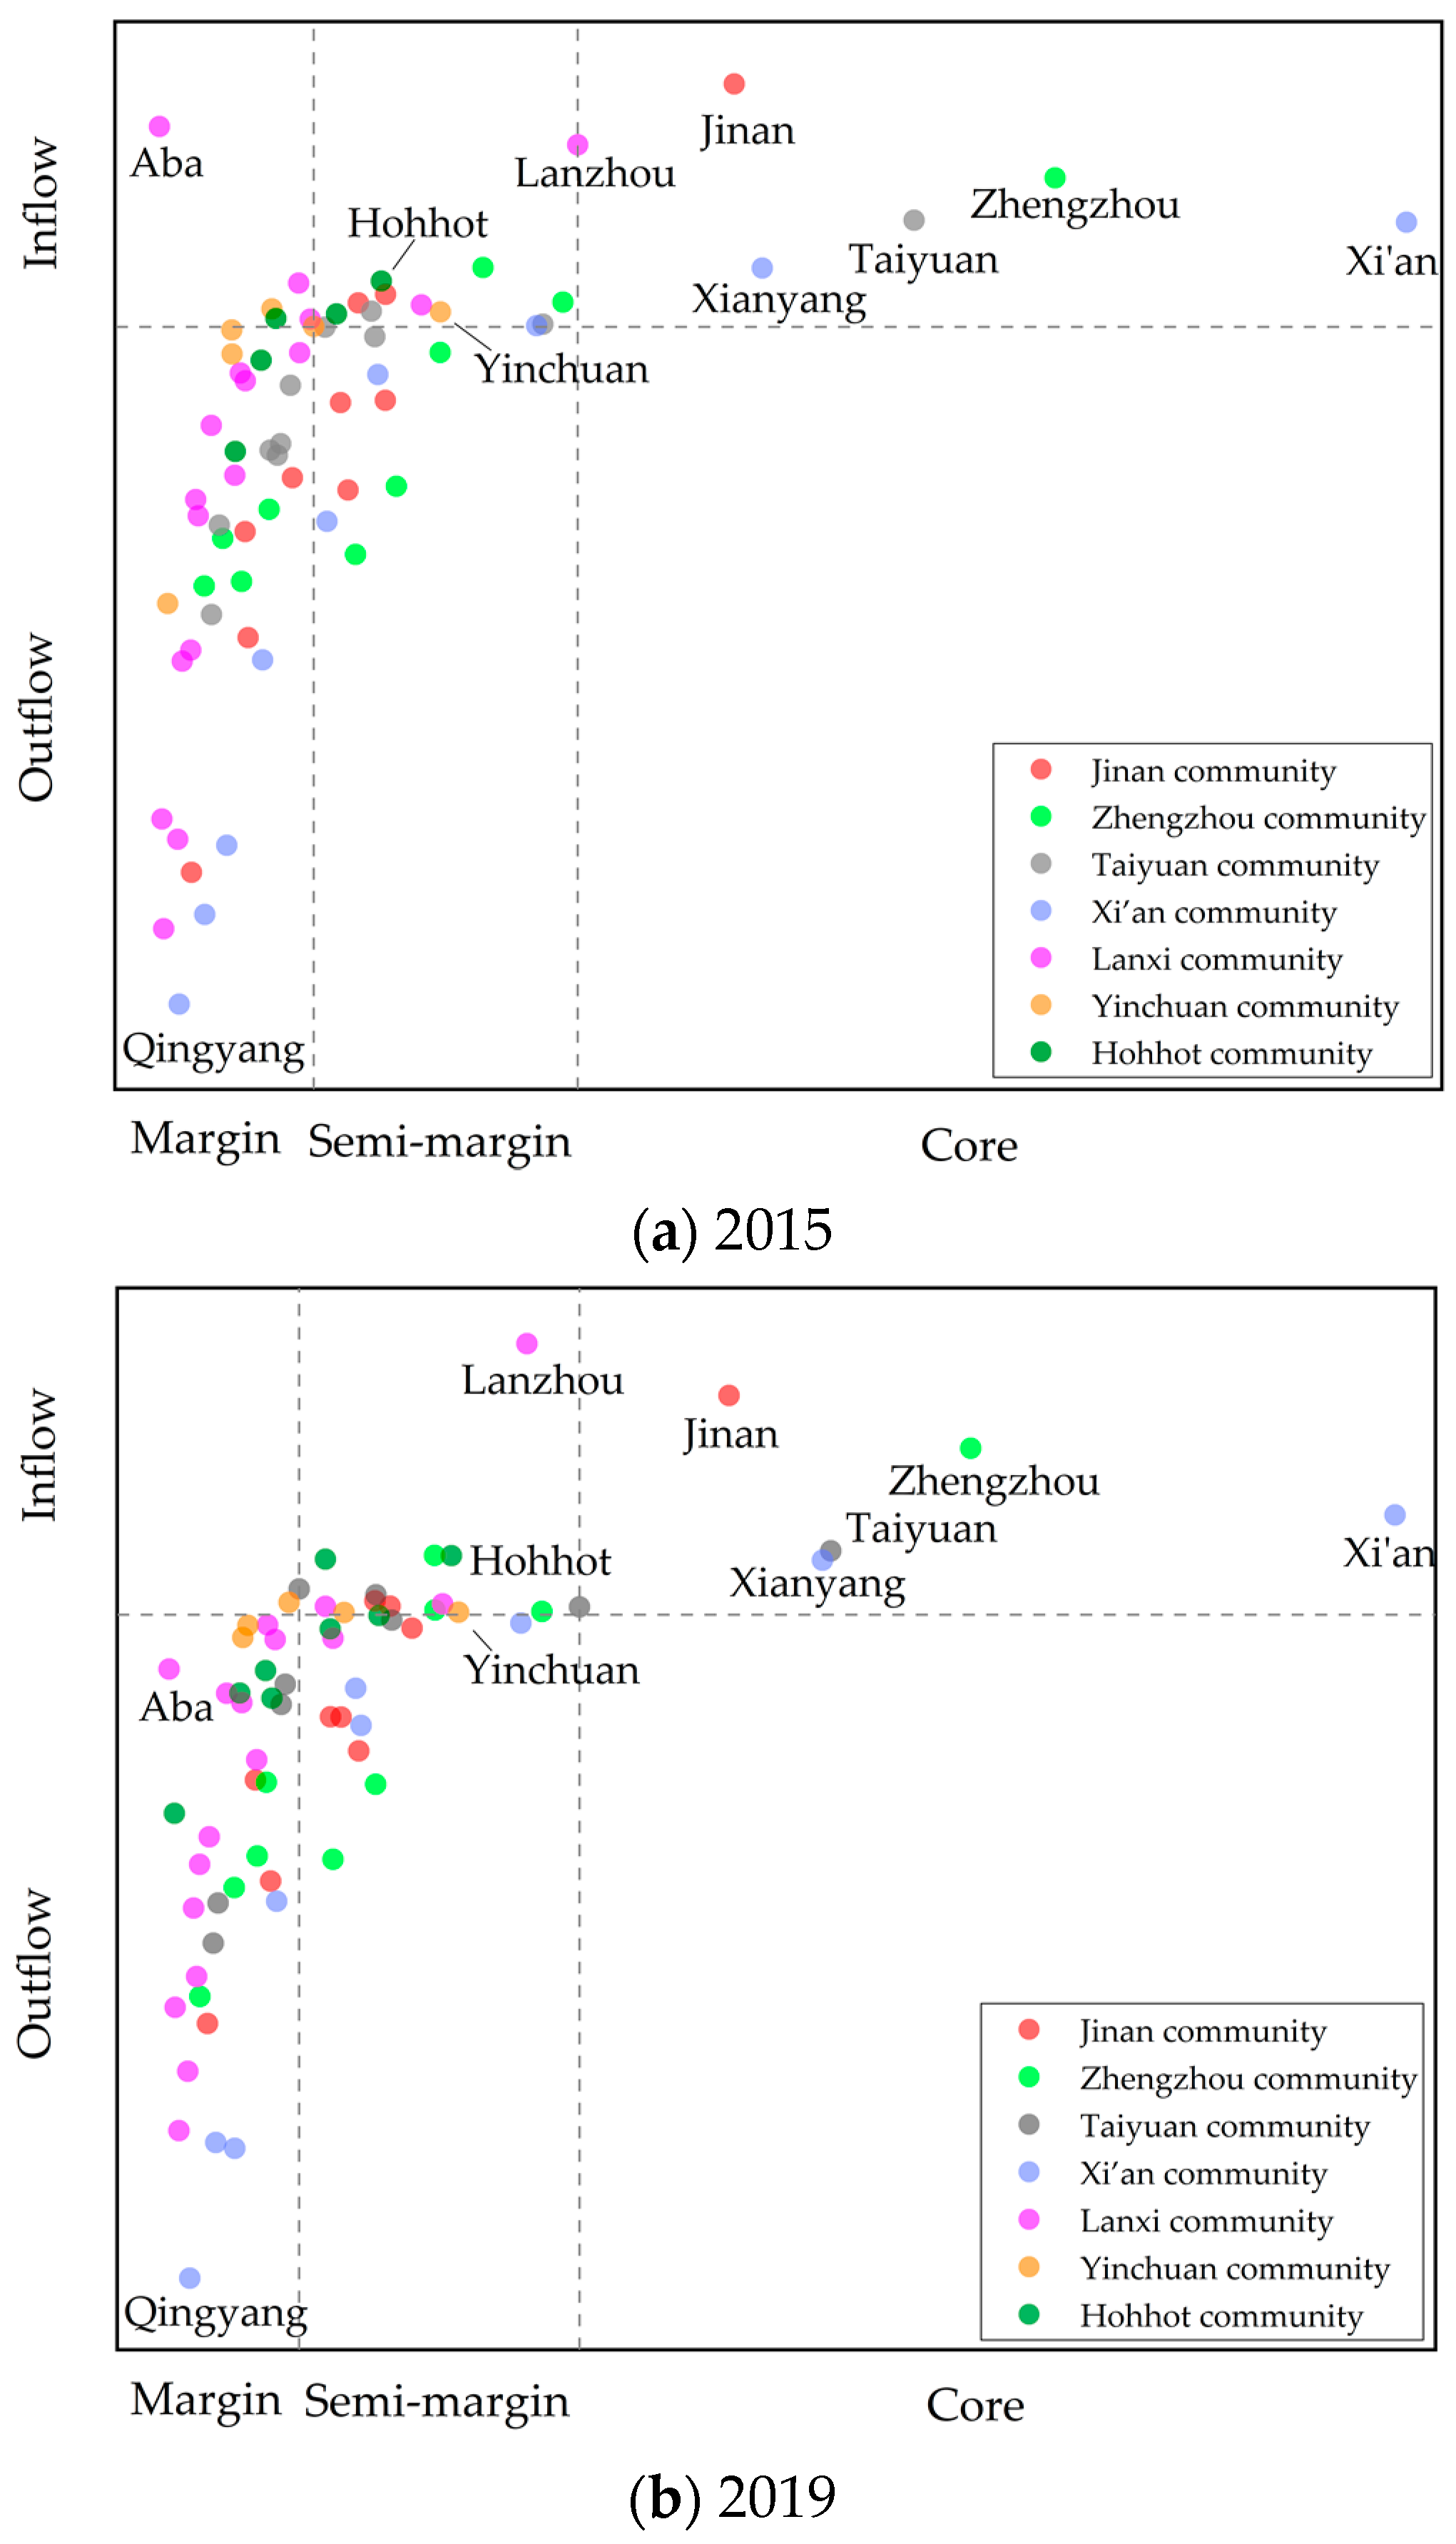
The central agglomeration of communities varies greatly. To further explore the hierarchical relationship and functional types of cities in the community, the urban centrality of each community is uniformly divided into three levels, i.e., core, semi-marginal, and marginal, using the natural breakpoint method, and inflow and outflow are defined using the symmetry of 0 as the boundary, which is used to characterize the agglomeration and diffusion functions of cities (Figure 6). The central agglomeration of the Lanxi, Zhengzhou, Jinan, and Xi’an communities is strong. The node symmetry of their core cities is 0.33, 0.27, 0.2, and 0.12, respectively, controlling more than 40% of the first connections, and the average link symmetry is greater than 0.48. Specifically, Zhengzhou has the largest net in-degree, reaching 0.59. The proportion of semi-marginal or marginal outflow cities in these communities is generally higher than 60%, reflecting their prominent core–marginal structure and the strong asymmetry of inflow and outflow between cities. The central agglomeration of the Yinchuan, Hohhot, and Taiyuan communities is relatively weak (Table 9); the polycentricity ranks among the basin’s top three, and the core city’s highest node symmetry is only 0.08.

4.5. External Connectivity of Cities in the Communities

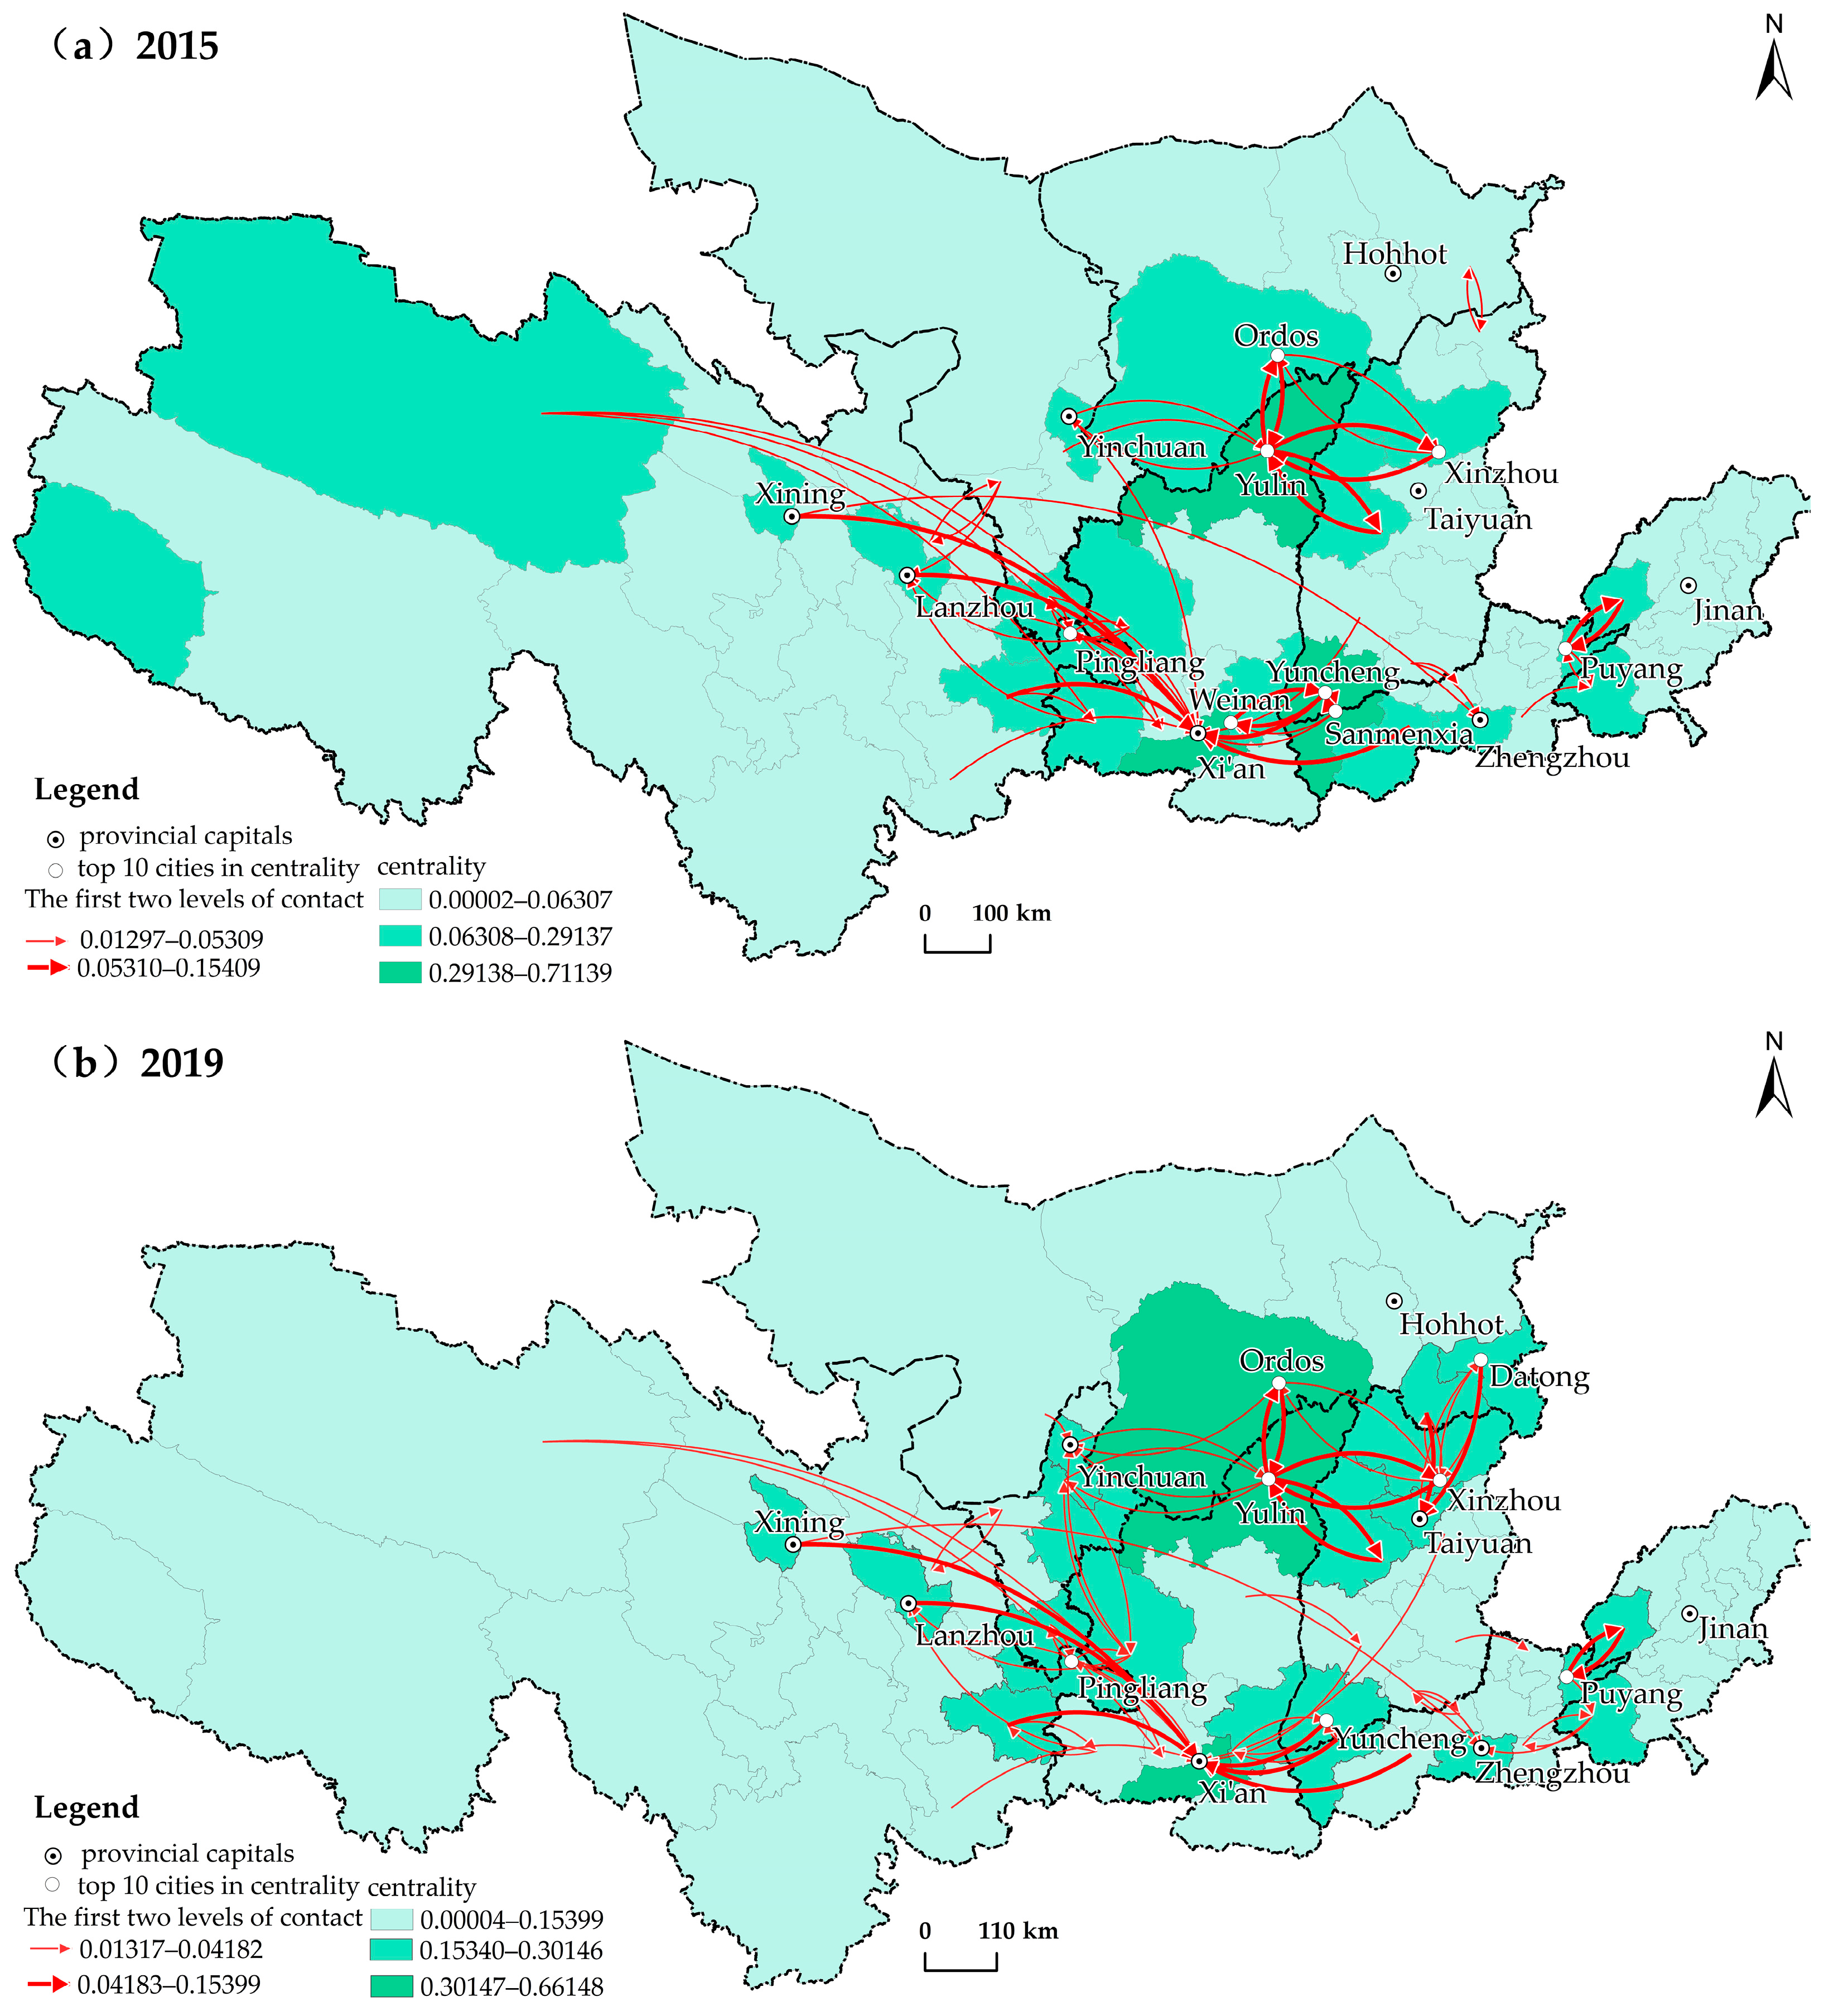
To further analyze the characteristics of the external connection between the node cities in the basin community, the cities inside and outside the community are taken as the unit of analysis; the natural breakpoint method in ArcGIS software is used to divide the centrality and connection strength of the external network into three levels (Figure 7). The overall network connection pattern is the Xi’an single-center agglomeration. From the perspective of network nodes, the node centralities of both Xi’an and Yulin belong to the first level, and their centrality differs only by 0.00002; however, the node symmetries of the two cities are 0.98 and −0.005, respectively. Xi’an has a solid ability to agglomerate the population, with an in-degree of 0.65, ranking first in the basin. Yulin exhibits apparent nodal symmetry (Table 10). From the perspective of urban connections, Xi’an has two outflow connections and 49 inflow connections. In the first-level network, 37.5% of the connections flow to the core city of Xi’an, and these connections mainly come from cities such as Lanzhou, Xining, Luoyang, and Sanmenxia.
The external connections of community cities are mainly contact connections. On the one hand, core cities, such as Zhengzhou, Jinan, Xining, and Hohhot, are mainly closely connected with cities within the community and relatively weakly connected with cities outside the community; their external connections account for less than 20% of the community. On the other hand, cities with strong external connections are located at the boundary of the community, and Yulin, Ordos, Xinzhou, Datong, and Pingliang rank in the top 10 in the basin in terms of external connections. A total of 58.46% of connections of the first two-level city networks occur in the junction areas of the Jinan community–Zhengzhou community, Taiyuan community–Hohhot community, and Yinchuan community–Xi’an community. These connections show apparent symmetry, among which the connection strengths between Ordos–Yulin, Liaocheng–Puyang, and Lvliang–Yulin are the strongest; their link symmetry is approximately 0.01.
The interregional connection capacity of core cities is significantly enhanced. From the point of view of network nodes, the relative centrality of core cities, such as Zhengzhou, Taiyuan, Yinchuan, and Hohhot, increases by 5.18%, 11.87%, 35.97%, and 3.32%, respectively. Taiyuan ranks in the top 10 in the basin in terms of centrality, and Zhengzhou ranks third in the basin, as its betweenness centrality increases to 837.28 (Table 3). From the perspective of urban connections, the number of connections flowing to core cities in the first two levels of networks increases by 2.61%, of which the first-level network increases by 20.59%, and cross-regional, long-distance and large-scale urban connections, such as Yinchuan–Qingyang, Xi’an–Jinzhong, and Zhengzhou–Heze, increase significantly. Zhengzhou, with a newly emerging high-speed rail and an aviation hub in the Yellow River Basin, can effectively overcome the challenges associated with geographical distance; the membership degrees of Zhengzhou’s connections with Jinan, Lanxi, and Yinchuan increase by 4.44%, 1.40%, and 1.10%, respectively, and the community’s external contacts expand to 29 cities in the basin, indicating that Zhengzhou is gradually becoming a subcenter city connecting the east and west of the basin.

5. Discussion

5.1. Multiscale Analysis for Urban Network Connectivity

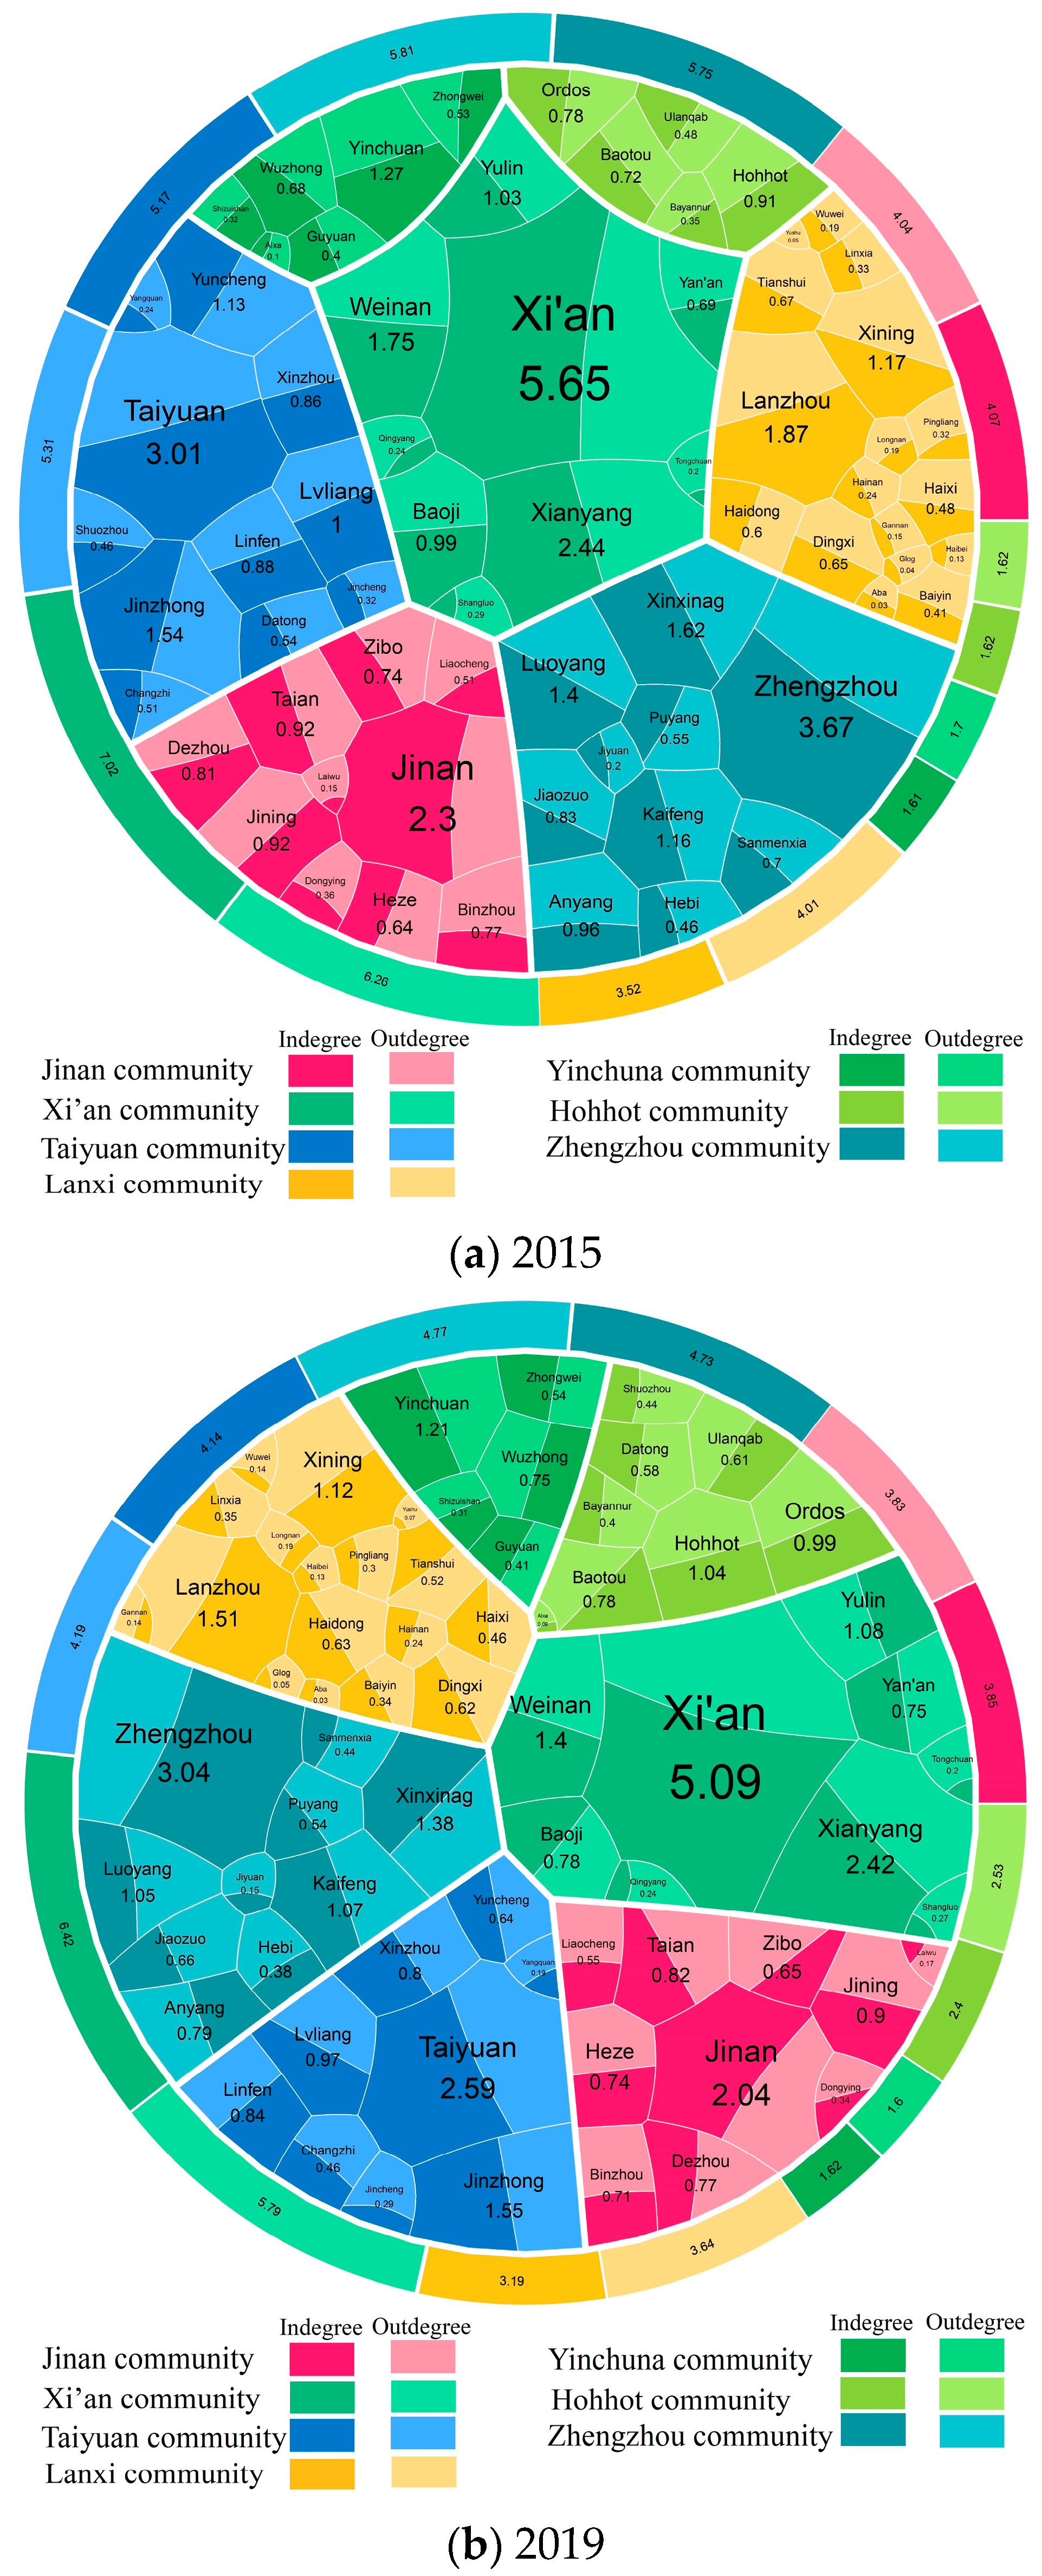
Multiscale analysis is helpful for determining the spatial heterogeneity of urban agglomeration connectivity. In the migration kaleidoscope, we assigned different colors to the seven communities inside the basin, using deep and light shades to differentiate between in-degree and out-degree. The centrality of cities and communities can be represented by the size and labels of the polygons (Figure 8). We separately extracted connectivity patterns at different scales from the urban network of the Yellow River Basin. Utilizing the migration kaleidoscope, we offer a comprehensive description of the urban network, disclosing the interaction effect between the urban and community networks. In general, urban connectivity at both the basin and community scales exhibits significant spatial heterogeneity, with the Xi’an community serving as the network’s hub, and there are some disparities in population inflows and outflows between communities or cities. At the basin scale, urban connectivity presents an asymmetric pattern of “strong in the east and weak in the west”, which is consistent with studies of urban connection at a single scale [37,56]. We further found that the Zhengzhou community and Jinan community, in the middle and lower reaches of the basin, have strong external connection abilities and are obviously traffic-oriented, while the Taiyuan community and Lanxi community, in the middle and upper reaches of the basin, have a high community network status in the basin, but their external connections are poor and scattered. This statement supports Rozenblat’s perspective on the interaction effect of multiscale urban networks at a specific level [18]. The urban networks of the Jinan, Zhengzhou, and Xi’an communities in the eastern part of the basin are dominated by net inflows and have a high degree of development, which can boost the ability of these communities to connect with other communities outside the basin. On the other hand, the urban networks of the Taiyuan and Lanxi communities, located in the western region of the basin, exhibit a predominant net outflow pattern and demonstrate a relatively low level of growth. However, they present a notable proximity in terms of traffic and information with the Xi’an community [54]. The enhancement and improvement of the Taiyuan and Lanxi communities’ standing within the urban network can be achieved using the concept of “borrowing size”, as proposed by Meijers and Burger [57].
At the community scale, the degree of central agglomeration exhibits significant variation between different communities, with urban connectivity primarily concentrated in provincial capitals or cities with solid economic foundations. The existing research has profoundly revealed the changing rules of the functional polycentricity of urban agglomerations in different urban networks [47,58]. This paper mainly supplements and describes the spatial heterogeneity of the polycentricity of different urban agglomerations in the region. The findings indicate that the communities in Lanxi, Xi’an, Jinan, and Zhengzhou are single-center agglomeration patterns, while the Yinchuan community and Hohhot community are double-center structures with loose internal connections. The external connections of community cities are mainly contact connections, which are concentrated in community boundary cities and have strong link symmetry. Lin et al. [43] found that the provincial administrative boundaries of the Yangtze River Delta can aggravate the asymmetry of the urban network. The Yangtze River Delta is one of several regions with the highest degree of regional integration in China; it has many interprovincial urban connections characterized by long distances between them [59]. In contrast, the Yellow River Basin exhibits limited cross-community urban connections characterized by short distances. Additionally, the core cities of Jinan, Zhengzhou, and Taiyuan display weak cross-regional connections and population agglomeration capabilities, which result in fewer asymmetric connections in the external urban network of these communities.

5.2. Network Equilibrium Based on Polycentricity

The polycentricity index based on the perspective of network interaction can effectively identify the equilibrium degree of the network. Polycentricity is commonly assessed in existing research through rank-size regression or the Gini coefficient [44,45,47]. The main indicator of rank-size regression is the slope of the best-fit regression line. The slope is easily affected by the number of samples, and the goodness of fit of the regression line is low, so it is difficult to fully reflect the actual situation of the data [60]. The Lorenz curve, as the best-fitting regression line of the Gini coefficient, has a higher R-square value. However, the Gini coefficient cannot decompose regional differences at multiple spatial scales [61], meaning that it is not conducive to revealing the reasons for imbalances in urban connection distributions. These methods mainly reflect the spatial difference in urban network status by calculating the statistical dispersion degree of centrality. Scholars commonly employ symmetry to depict the interplay across cities when describing urban interactions, with symmetry being a characteristic of fully polycentric systems within urban contexts [17,43]. This study uses the mean absolute value of symmetry as a metric to quantify the level of symmetry in the entire network. Subsequently, the negative value of the mean is calculated and incremented by one, ensuring that the directional trend of the metric aligns with the concept of polycentricity. The polycentricity index based on the perspective of network interaction partially addresses the limitation of neglecting the direction of connections in urban network studies. In the context of empirical research, the small strength of urban connections yields a certain degree of contingency in link symmetry, which may interfere with the polycentricity of urban networks with low development levels.

5.3. Implications for Improving Urban Connectivity in the Yellow River Basin

Based on the concept of basin integrity and the use of population migration data that reflect mobility and relatedness, network connectivity inside and outside the basin is analyzed at the basin and community scales, as are their spatiotemporal patterns. From the standpoint of natural geographic divisions, the Yellow River’s meandering pattern and restricted shipping capacity have resulted in a relatively diminished network connectivity inside the basin. Consequently, the central region’s significance is more pronounced than that of other areas, with Xi’an and Xi’an community emerging as the primary hubs for intercity and intercommunity connectivity inside the basin. It is imperative for the Xi’an and Xi’an communities to leverage their pivotal positions and actively contribute to the holistic advancement of the surrounding regions. There is a need to enhance the division of urban functions, particularly by reinforcing the division of labor among core cities and core communities situated in the middle and lower sections of the river. Additionally, it is imperative to expedite the development and establishment of metropolitan areas surrounding the core cities located in the upper reaches of the Yellow River Basin. Finally, it is crucial to strengthen the interconnectivity and collaboration between cities and communities inside the basin by leveraging the transportation axes.
An analysis of the external connectivity of basin communities shows that the communities of Jinan, Zhengzhou, and Xi’an, located in the middle and lower reaches of the basin, exhibit higher connectivity with external cities. Conversely, the communities situated in the middle and upper reaches of the basin, as well as those with east–west external links, demonstrate comparatively low levels of external connectivity. Hence, it is imperative to fully leverage the potential of the Jinan community seaward corridor and the Zhengzhou community transport hub, thus enhancing the core city’s capacity for acting as a leader and driving regional development. This would be an endeavor that aims to establish a nationally significant economic growth center and facilitate stronger external connections for the basin. The Xi’an community is a crucial point for expanding toward the western region. The community aims to enhance its collaborative advantages and foster synergistic development with neighboring areas. Additionally, the Xi’an community seeks to reinforce its role as a gateway to the Silk Road, facilitating connectivity among communities in the basin, particularly in the east–west direction.

6. Conclusions

Promoting integrated development inside the Yellow River Basin is an essential prerequisite for achieving co-ordinated development inside the basin. The paper utilizes Tencent’s population migration data from 2015 and 2019 to establish an urban connectivity network within the Yellow River Basin. The Louvain algorithm is employed to identify the community structure within this network. Subsequently, cities and communities are selected as analysis units to conduct multiscale analysis on the internal and external network connections, as well as on the evolutionary characteristics of these different analysis units. There are seven urban communities in the Yellow River Basin with close internal organization and few external connections. Most of these communities follow the provincial administrative boundaries, showing strong administrative area economic characteristics; furthermore, the divided urban communities and agglomerations in the Yellow River Basin’s middle and lower reaches are relatively consistent. The connection tightness between communities gradually increases.
The network connectivity is detailed at two different scales. At the basin scale, the community network exhibits a pronounced centripetal concentration and notable spatial heterogeneity. The Xi’an community serves as the central hub inside the community network, with the first links of the Zhengzhou, Taiyuan, Lanxi, and Yinchuan communities converging toward the Xi’an community. Over time, the Xi’an community has experienced the emergence of external radiation phenomena, resulting in a drop in node symmetry from 0.41 to 0.36. The Zhengzhou and Jinan communities, located in the middle and lower regions of the basin, exhibit relatively low network centrality. However, they demonstrate a strong capacity for external connections and clear traffic orientation characteristics. There has been a notable enhancement in the capacity of communities located in the middle and upper regions of the basin to establish connections with communities outside the basin. A trend of population backflow occurs in the middle and upper reaches of the basin. At the community scale, each community has obvious centripetal agglomeration characteristics, and the connections mostly point to provincial capitals or economically developed cities. The central agglomeration of different communities varies greatly. The Lanxi, Xi’an, Jinan, and Zhengzhou communities show apparent single-center agglomeration, and the central agglomeration of Yinchuan and Hohhot in the middle and upper reaches is relatively weak; the network connection shows a weak dual-center structure. For the external connection of community cities, there is an overall network connection pattern of a single-center agglomeration in Xi’an. The external connections are mainly concentrated in the border cities of the community and show obvious connection symmetry.
This paper provides a reference for clarifying the functional positioning of core cities and urban agglomerations in the Yellow River Basin and promoting the development of spatial integration. However, to gain more insights and arrive at more conclusions, further studies of the following three topics should be performed: (i) the dynamic changes in network connections from an evolutionary process perspective, (ii) the identification of influence factors for the urban network connections in the Yellow River Basin, and (iii) the interaction of these factors on urban network connections and quantitative outcomes.

Author Contributions

Conceptualization, Caihui Cui and Yaohui Chen; methodology, Yaohui Chen and Zhigang Han; software, Yaohui Chen and Feng Liu; validation, Caihui Cui and Zhigang Han; formal analysis, Caihui Cui; investigation, Yaohui Chen and Qirui Wu; resources, Feng Liu and Qirui Wu; data curation, Yaohui Chen and Wangqin Yu; writing—original draft preparation, Yaohui Chen; writing—review and editing, Caihui Cui and Zhigang Han; visualization, Yaohui Chen and Wangqin Yu; supervision, Caihui Cui; project administration, Zhigang Han; funding acquisition, Zhigang Han. All authors have read and agreed to the published version of the manuscript.

Funding

This research was funded by the National Natural Science Foundation of China, grant number 42371433 and U21A2014; National Key Project of High-Resolution Earth Observation System of China, grant number 80Y50G19900122/23; National Key Research and Development Program of China, grant number 2021YFE0106700; Foundation of Key Laboratory of Soil and Water Conservation on the Loess Plateau of Ministry of Water Resources under Grant WSCLP202301; Science and Technology Foundation of Henan Province, grant number 212102310421; Natural Resources Science and Technology Innovation Project of Henan Province, China, grant number 202016511.

Data Availability Statement

Data are available on request in order to protect research participant privacy.

Acknowledgments

Special thanks go to the editor and anonymous reviewers of this paper for their constructive comments.

Conflicts of Interest

The authors declare no conflict of interest.

References

  1. Castells, M. The Information Age: Economy, Society and Culture; Blackwell: Oxford, UK, 1996; pp. 371–395. [Google Scholar]
  2. Taylor, P.J.; Hoyler, M.; Verbruggen, R. External Urban Relational Process: Introducing Central Flow Theory to Complement Central Place Theory. Urban Stud. 2010, 47, 2803–2818. [Google Scholar] [CrossRef]
  3. Taylor, P.J. Specification of the World City Network. Geogr. Anal. 2001, 33, 181–194. [Google Scholar] [CrossRef]
  4. Mahutga, M.C.; Xiulian, M.; Smith, D.A.; Timberlake, M. Economic Globalisation and the Structure of the World City System: The Case of Airline Passenger Data. Urban Stud. 2010, 47, 1925–1947. [Google Scholar] [CrossRef]
  5. Jiao, J.; Wang, J.; Jin, F. Impacts of high-speed rail lines on the city network in China. J. Transp. Geogr. 2017, 60, 257–266. [Google Scholar] [CrossRef]
  6. Zhang, L.; Du, H.; Zhao, Y.; De Maeyer, P.; Dessein, B.; Zhang, X. Drawing topological properties from a multi-layered network: The case of an air transport network in “the Belt and Road” region. Habitat Int. 2019, 93, 102044. [Google Scholar] [CrossRef]
  7. Pan, J.H.; Lai, J.B. Spatial pattern of population mobility among cities in China: Case study of the National Day plus Mid-Autumn Festival based on Tencent migration data. Cities 2019, 94, 55–69. [Google Scholar] [CrossRef]
  8. Cui, C.; Wu, X.; Liu, L.; Zhang, W. The spatial-temporal dynamics of daily intercity mobility in the Yangtze River Delta: An analysis using big data. Habitat Int. 2020, 106, 102174. [Google Scholar] [CrossRef]
  9. Krings, G.; Calabrese, F.; Ratti, C.; Blondel, V.D. Urban gravity: A model for inter-city telecommunication flows. J. Stat. Mech. Theor. Exp. 2009, 2009, L07003. [Google Scholar] [CrossRef]
  10. Kang, C.; Zhang, Y.; Ma, X.; Liu, Y. Inferring properties and revealing geographical impacts of intercity mobile communication network of China using a subnet data set. Inter. J. Geogr. Inf. Sci. 2013, 27, 431–448. [Google Scholar] [CrossRef]
  11. Fang, C.; Yu, X.; Zhang, X.; Fang, J.; Liu, H. Big data analysis on the spatial networks of urban agglomeration. Cities 2020, 102, 102735. [Google Scholar] [CrossRef]
  12. Alderson, A.S.; Beckfield, J.; Sprague-Jones, J. Intercity Relations and Globalisation: The Evolution of the Global Urban Hierarchy, 1981–2007. Urban Stud. 2010, 47, 1899–1923. [Google Scholar] [CrossRef]
  13. Neal, Z. Structural Determinism in the Interlocking World City Network. Geogr. Anal. 2012, 44, 162–170. [Google Scholar] [CrossRef]
  14. Zhang, Y.; Wang, T.; Supriyadi, A.; Zhang, K.; Tang, Z. Evolution and Optimization of Urban Network Spatial Structure: A Case Study of Financial Enterprise Network in Yangtze River Delta, China. ISPRS Int. J. Geo-Inf. 2020, 9, 611. [Google Scholar] [CrossRef]
  15. Chen, Y.; Liu, J. Derivation and generalization of the urban gravitational model using fractal idea with an application to the spatial cross-correlation bet ween Beijing and Tianjin. Geogr. Res. 2002, 21, 742–752. (In Chinese) [Google Scholar]
  16. Alderson Arthur, S.; Beckfield, J. Power and Position in the World City System. Am. J. Sociol. 2004, 109, 811–851. [Google Scholar] [CrossRef]
  17. Limtanakool, N.; Dijst, M.; Schwanen, T. A Theoretical Framework and Methodology for Characterising National Urban Systems on the Basis of Flows of People: Empirical Evidence for France and Germany. Urban Stud. 2007, 44, 2123–2145. [Google Scholar] [CrossRef]
  18. Rozenblat, C. Opening the Black Box of Agglomeration Economies for Measuring Cities’ Competitiveness through International Firm Networks. Urban Stud. 2010, 47, 2841–2865. [Google Scholar] [CrossRef]
  19. Ni, P.; Liu, K.; Peter, T. China’s urban linkage: Measurement based on interlocking network model. Comp. Econ. Soc. Syst. 2011, 6, 96–103. [Google Scholar]
  20. Ma, X.; Li, L. Network spatial connection structure of Chinese cities based on bank branches data. Prog. Geogr. 2017, 36, 393–403. (In Chinese) [Google Scholar]
  21. Yin, J.; Zhen, F.; Wang, C. China’s city network pattern: An empirical analysis based on financial enterprises layout. Econ. Geogr. 2011, 31, 754–759. (In Chinese) [Google Scholar]
  22. Li, Y.; Sun, Y.; Yao, S. Urban network linkages of Chinese urban agglomerations based on an analysis of the Fortune China Top 500 Enterprises. Geogr. Res. 2020, 39, 1548–1564. (In Chinese) [Google Scholar]
  23. Zhao, X.; Li, Q.; Rui, Y.; Liu, X.; Li, T. The characteristics of urban network of China: A study based on the Chinese companies in the Fortune Global 500 list. Acta Geogr. Sin. 2019, 74, 694–709. (In Chinese) [Google Scholar]
  24. Cao, Z.; Derudder, B.; Dai, L.; Peng, Z. ‘Buzz-and-pipeline’ dynamics in Chinese science: The impact of interurban collaboration linkages on cities’ innovation capacity. Reg. Stud. 2021, 56, 290–306. [Google Scholar] [CrossRef]
  25. Hu, H.; Huang, X.; Li, P.; Zhao, P. Comparison of Network Structure Patterns of Urban Agglomerations in China from the Perspective of Space of Flows: Analysis based on Railway Schedule. J. Geoinf. Sci. 2022, 24, 1525–1540. (In Chinese) [Google Scholar]
  26. Su, S.; Liu, Z.; Xu, Y.; Li, J.; Pi, J.; Weng, M. China’s megaregion policy: Performance evaluation framework, empirical findings and implications for spatial polycentric governance. Land Use Policy 2017, 63, 1–19. [Google Scholar] [CrossRef]
  27. Wang, D.; Wang, Y.; Gou, X. The study of cooperative governance mechanisms of urban agglomeration in the perspective of regional public goods. Chin. Public Adm. 2015, 363, 6–12. (In Chinese) [Google Scholar]
  28. Hui, E.C.M.; Li, X.; Chen, T.; Lang, W. Deciphering the spatial structure of China’s megacity region: A new bay area—The Guangdong-Hong Kong-Macao Greater Bay Area in the making. Cities 2020, 105, 102168. [Google Scholar] [CrossRef]
  29. Fan, J.; Wang, Y.; Wang, Y. High quality regional development research based on geographical units:discuss on the difference in development conditions and priorities of the Yellow River Basin compared to the Yangtze River Basin. Econ. Geogr. 2020, 40, 1–11. (In Chinese) [Google Scholar] [CrossRef]
  30. Miao, C. Essential features and high-quality development approach of urban agglomerations in the Yellow River Basin. Frontiers 2022, 22, 62–69. (In Chinese) [Google Scholar] [CrossRef]
  31. Zhang, P.; Pang, B.; Li, Y.; He, J.; Hong, X.; Qin, C.; Zheng, H. Analyzing spatial disparities of economic development in Yellow River Basin, China. GeoJournal 2018, 84, 303–320. [Google Scholar] [CrossRef]
  32. Fang, C. Spatial organization pattern and high-quality development of urban agglomeration in the Yellow River Basin. Econ. Geogr. 2020, 40, 1–8. (In Chinese) [Google Scholar] [CrossRef]
  33. Zhang, W.; Chong, Z.; Li, X.; Nie, G. Spatial patterns and determinant factors of population flow networks in China: Analysis on Tencent Location Big Data. Cities 2020, 99, 102640. [Google Scholar] [CrossRef]
  34. Xu, J.; Li, A.; Li, D.; Liu, Y.; Du, Y.; Pei, T.; Ma, T.; Zhou, C. Difference of urban development in China from the perspective of passenger transport around Spring Festival. Appl. Geogr. 2017, 87, 85–96. [Google Scholar] [CrossRef]
  35. Gao, Y.; Nan, Y.; Song, S. High-speed rail and city tourism: Evidence from Tencent migration big data on two Chinese golden weeks. Growth Chang. 2021, 25, 1012–1036. [Google Scholar] [CrossRef]
  36. Liu, Z.; Wang, S.; Zhao, M.; Wu, K. Exploratory analysis of directed weighted network of city. Geogr. Res. 2013, 32, 1253–1268. (In Chinese) [Google Scholar]
  37. Liu, H.; Wang, L.; Li, Q.; Yan, C. Spatial and Temporal Patterns of City Connection Networks in the Yellow River Basin Based on Tencent’s Big Data of Population Migration. Econ. Geogr. 2020, 40, 28–37. (In Chinese) [Google Scholar] [CrossRef]
  38. Girvan, M.; Newman, M.E.J. Community structure in social and biological networks. Proc. Natl. Acad. Sci. USA 2002, 99, 7821–7826. [Google Scholar] [CrossRef]
  39. Clauset, A.; Newman, M.E.J.; Moore, C. Finding community structure in very large networks. Phys. Rev. E 2004, 70 Pt 2, 066111. [Google Scholar] [CrossRef]
  40. Chen, W.; Liu, W.; Ke, W.; Wang, N. Understanding spatial structures and organizational patterns of city networks in China: A highway passenger flow perspective. J. Geogr. Sci. 2018, 28, 477–494. [Google Scholar] [CrossRef]
  41. Zhang, L.; Lu, J.; Zhou, J.; Zhu, J.; Li, Y.; Wan, Q. Complexities’ day-to-day dynamic evolution analysis and prediction for a Didi taxi trip network based on complex network theory. Mod. Phys. Lett. B 2018, 32, 1850062. [Google Scholar] [CrossRef]
  42. Hou, H.; Liu, Y.; Liu, Y.; Wei, X.; He, Q.; He, Q. Using inter-town network analysis in city system planning: A case study of Hubei Province in China. Habitat Int. 2015, 49, 454–465. [Google Scholar] [CrossRef]
  43. Lin, J.; Wu, K.; Yang, S.; Liu, Q. The Asymmetric Pattern of Population Mobility during the Spring Festival in the Yangtze River Delta Based on Complex Network Analysis: An Empirical Analysis of “Tencent Migration” Big Data. ISPRS Int. J. Geo-Inf. 2021, 10, 582. [Google Scholar] [CrossRef]
  44. Burger, M.; Meijers, E. Form Follows Function? Linking Morphological and Functional Polycentricity. Urban Stud. 2011, 49, 1127–1149. [Google Scholar] [CrossRef]
  45. Meijers, E. Measuring Polycentricity and its Promises. Eur. Plan. Stud. 2008, 16, 1313–1323. [Google Scholar] [CrossRef]
  46. Huang, X.; Ma, H.; Miao, C. Connectivity characteristics for city networks in China based on innovative enterprises. Acta Geogr. Sin. 2021, 76, 835–852. (In Chinese) [Google Scholar]
  47. Li, Y.; Phelps, N.A. Knowledge polycentricity and the evolving Yangtze River Delta megalopolis. Reg. Stud. 2016, 51, 1035–1047. [Google Scholar] [CrossRef]
  48. Kloosterman, R.C.; Musterd, S. The Polycentric Urban Region: Towards a Research Agenda. Urban Stud. 2001, 38, 623–633. [Google Scholar] [CrossRef]
  49. Sinclair, R. Changing spatial trends at the national, regional and metropolitan levels of the settlement system in developed Western countries. Geogr. Polon. 1983, 47, 101–117. [Google Scholar]
  50. Qi, W.; Abel, G.J.; Muttarak, R.; Liu, S. Circular visualization of China’s internal migration flows 2010–2015. Environ. Plan. A 2017, 49, 2432–2436. [Google Scholar] [CrossRef]
  51. Huo, D.; Chen, Y.; Hung, K.; Ouyang, R.; Sun, B.; Cai, Y. Quality Management of E-business: A Key Node Analysis of Ecological Network in Digital Economy by Using Artificial Intelligence. J. Econ. Forecast. 2019, 22, 166–179. [Google Scholar]
  52. Gu, H.; Xu, Z.; Zheng, J.; Shen, T. Visualising global currents of international students between 1999 and 2018. Environ. Plan. A 2021, 54, 3–6. [Google Scholar] [CrossRef]
  53. Gu, H.; Xu, Z. Kaleidoscope visualisation of China’s internal migration, 1985–2020. Environ. Plan. B 2022, 49, 1341–1344. [Google Scholar] [CrossRef]
  54. Zhao, J.; Zhang, X.; Ren, J.; Chen, X. Spatial Structure and Influencing Factors of Urban Network in the Yellow River Basin Based on Multiple Flows. Sci. Geogr. Sin. 2022, 42, 1778–1787. (In Chinese) [Google Scholar] [CrossRef]
  55. Wei, Y.; Wang, J.; Zhang, S.; Sono, D.; Xiu, C. Urban positionality in the regional urban network: Through the lens of alter-based centrality and national-local perspectives. Habitat Int. 2022, 126, 102617. [Google Scholar] [CrossRef]
  56. Xiong, Y.; Tang, H.; Xu, T. High-Speed Railway Access Pattern and Spatial Overlap Characteristics of the Yellow River Basin Urban Agglomeration. ISPRS Int. J. Geo-Inf. 2022, 12, 3. [Google Scholar] [CrossRef]
  57. Meijers, E.J.; Burger, M.J. Stretching the concept of ‘borrowed size’. Urban Stud. 2015, 54, 269–291. [Google Scholar] [CrossRef]
  58. Ma, H.; Huang, X.; Li, Y. The evolution and mechanisms of megalopolitan knowledge polycentricity of Guangdong-Hong Kong-Macao Greater Bay Area. Acta Geogr. Sin. 2018, 73, 2297–2314. (In Chinese) [Google Scholar]
  59. Li, Y.; Phelps, N.A. Megalopolitan glocalization: The evolving relational economic geography of intercity knowledge linkages within and beyond China’s Yangtze River Delta region, 2004–2014. Urban Geogr. 2019, 40, 1310–1334. [Google Scholar] [CrossRef]
  60. Li, Y.; Phelps, N.A. Megalopolis unbound: Knowledge collaboration and functional polycentricity within and beyond the Yangtze River Delta Region in China, 2014. Urban Stud. 2018, 55, 443–460. [Google Scholar] [CrossRef]
  61. Liu, H. Regional inequality measurement: Methods and evaluations. Geogr. Res. 2006, 25, 710–718. (In Chinese) [Google Scholar]
Figure 1. Location, economic pattern, and landform zoning map of the Yellow River Basin.
Ijgi 12 00447 g001
Figure 2. The methodology framework.
Ijgi 12 00447 g002
Figure 3. Community structure of urban networks in 2015 and 2019 in the Yellow River Basin.
Ijgi 12 00447 g003
Figure 4. Community connectivity inside the basin in 2015 and 2019.
Ijgi 12 00447 g004
Figure 5. External connectivity of communities in the basin in 2015 and 2019.
Ijgi 12 00447 g005
Figure 6. Hierarchical relationship and functional types of cities in 2015 and 2019.
Ijgi 12 00447 g006
Figure 7. External connectivity of cities in the communities in 2015 and 2019.
Ijgi 12 00447 g007
Figure 8. Urban network visualization by migration kaleidoscopes in 2015 and 2019.
Ijgi 12 00447 g008
Table 1. Samples of Tencent location big data.
20152019
o_coded_codeAllvalueo_coded_codeAllvalue
62300036010024,70362020041010016,208
6230003607001705620200620700321,661
62040061010157,4706204061010197,850
··················
Table 2. Detailed description of the migration data.
YearInside the BasinOutside the Basin
CitiesIntercity ConnectionsExternal Connections of CitiesCitiesIntercity Connections
201568898310629512,158
201968852348029515,346
Table 3. Results of community detection.
YearInside the BasinOutside the Basin
Number of CommunitiesModularityNumber of CommunitiesModularity
201570.70880.380
201970.698100.491
Table 4. Node centrality of the community.
CommunityInside the BasinOutside the Basin
2015201920152019
Jinan0.240.291.534.28
Zhengzhou0.920.752.114.43
Taiyuan1.061.050.661.65
Xi’an1.841.732.184.85
Lanxi0.940.840.822.74
Yinchuan0.390.430.110.56
Hohhot0.380.800.371.74
Table 5. Node symmetry of the community.
CommunityInside the BasinOutside the Basin
2015201920152019
Jinan0.160.04−0.30
Zhengzhou−0.07−0.07−0.080.01
Taiyuan−0.13−0.04−0.80.08
Xi’an0.410.36−0.02−0.02
Lanxi−0.51−0.51−0.440.01
Yinchuan−0.250.06−0.910.07
Hohhot0−0.18−0.650.09
Table 6. Community connections inside the basin (2015).
Origin CommunityDestination CommunityStrength of ConnectionOrigin CommunityDestination CommunityStrength of Connection
ZhengzhouXi’an0.17TaiyuanZhengzhou0.23
ZhengzhouTaiyuan0.16TaiyuanHohhot0.04
ZhengzhouJinan0.13TaiyuanLanxi0
ZhengzhouLanxi0.03TaiyuanYinchuan0
ZhengzhouHohhot0TaiyuanJinan0
YinchuanXi’an0.12LanxiXi’an0.55
YinchuanLanxi0.09LanxiZhengzhou0.08
YinchuanHohhot0.03LanxiYinchuan0.07
YinchuanJinan0LanxiTaiyuan0.01
YinchuanTaiyuan0LanxiJinan0.01
YinchuanZhengzhou0LanxiHohhot0
Xi’anTaiyuan0.24JinanZhengzhou0.10
Xi’anHohhot0.12JinanLanxi0
Xi’anLanxi0.12JinanXi’an0
Xi’anYinchuan0.06HohhotXi’an0.12
Xi’anZhengzhou0.02HohhotTaiyuan0.05
Xi’anJinan0HohhotYinchuan0.02
TaiyuanXi’an0.33HohhotLanxi0
Table 7. Community connections inside the basin (2019).
Origin CommunityDestination CommunityStrength of ConnectionOrigin CommunityDestination CommunityStrength of Connection
ZhengzhouXi’an0.16TaiyuanZhengzhou0.11
ZhengzhouJinan0.15TaiyuanLanxi0
ZhengzhouTaiyuan0.07TaiyuanYinchuan0
ZhengzhouLanxi0.03LanxiXi’an0.48
ZhengzhouYinchuan0LanxiZhengzhou0.08
YinchuanXi’an0.09LanxiYinchuan0.07
YinchuanLanxi0.07LanxiJinan0
YinchuanHohhot0.03LanxiTaiyuan0
YinchuanZhengzhou0LanxiHohhot0
YinchuanJinan0JinanZhengzhou0.14
YinchuanTaiyuan0JinanLanxi0
Xi’anTaiyuan0.17JinanXi’an0
Xi’anHohhot0.16HohhotTaiyuan0.26
Xi’anLanxi0.10HohhotXi’an0.16
Xi’anYinchuan0.10HohhotYinchuan0.06
Xi’anZhengzhou0.02HohhotLanxi0
TaiyuanXi’an0.29HohhotJinan0
TaiyuanHohhot0.14HohhotZhengzhou0
Table 8. External connections of communities in the basin.
20152019
Origin CommunityDestination CommunityStrength of ConnectionOrigin CommunityDestination CommunityStrength of Connection
Xi’anGuangzhou0.96Xi’anChangsha0.94
LanxiJingyu0.46ChangshaJinan0.74
JingyuJinan0.53GuangzhouZhengzhou0.85
Xi’anShanghai0.50ChangshaXi’an0.88
GuangzhouXi’an0.90LanxiJinghu0.49
··················
Table 9. Polycentrality of urban connectivity within communities.
Community20152019
Jinan0.760.82
Zhengzhou0.800.79
Taiyuan0.880.88
Xi’an0.630.68
Lanxi0.730.77
Yinchuan0.930.98
Hohhot0.940.92
Table 10. Top 10 cities in terms of community external connection characteristics in 2019.
RankingCitiesCentralityCitiesBetweenness
Centrality
CitiesNet in-Degree
1Xi’an0.66148Zhongwei965.16Xi’an0.64781
2Yulin0.66146Datong859.66Zhengzhou0.12309
3Ordos0.39723Zhengzhou843.35Taiyuan0.10927
4Xinzhou0.30146Glog727.98Yinchuan0.10419
5Datong0.20012Yulin650.93Xianyang0.04234
6Pingliang0.19988Yinchuan433.96Anyang0.01053
7Yuncheng0.19567Haixi390.52Ordos0.01044
8Puyang0.19385Xi’an282.63Heze0.00748
9Lanzhou0.19265Taiyuan277.62Xinxiang0.00702
10Taiyuan0.18404Lvliang262.3Weinan0.00357
Disclaimer/Publisher’s Note: The statements, opinions and data contained in all publications are solely those of the individual author(s) and contributor(s) and not of MDPI and/or the editor(s). MDPI and/or the editor(s) disclaim responsibility for any injury to people or property resulting from any ideas, methods, instructions or products referred to in the content.

