1. Introduction
In recent decades, numerous countries globally have undergone a profound and rapid process of urbanization. With socio-economic development and population growth, urbanization directly promotes the aggregation of various urban elements. In 2022, China reached a significant urbanization rate of 65.2%, which represents a notable increment of 24.1% compared to the level observed in 2012 [
1]. In Africa, certain countries like South Africa and Tunisia have reached urbanization rates surpassing 60%. This achievement has greatly promoted local productivity development and economic innovation capacity [
2].
Element agglomeration refers to the geographic process wherein various elements are centrally agglomerated under the influence of socio-economic costs, service groups, and scale effects [
3,
4,
5,
6]. With the continuous agglomeration of urban elements and population, scale effects gradually intensify, leading to a significant enhancement in the efficiency of regional industrialization and urbanization [
7,
8,
9]. However, the irrational spatial agglomeration of urban spatial elements has also led to an imbalanced distribution of urban spatial elements, exhibiting unreasonable concentration and dispersion across different scales [
10,
11]. For example, the imbalance in facility allocation and job-housing has given rise to numerous urban issues and compromised the quality of urbanization [
12,
13]. Analyzing the spatial agglomeration pattern and the evolutionary characteristics of urban elements facilitates a rational understanding of development rules and trends, as well as the recognition of urban development challenges, thus achieving the healthy and sustainable development of cities.
Element agglomeration during urbanization has attracted considerable attention among researchers, with a primary focus on the composition, spatial distribution, and evolving features of these elements. Many studies have examined the spatial agglomeration of urban elements, including land use, industrial elements, and public service elements. Land use is usually used to reveal the process of urban expansion across different scales, along with corresponding constraints, regulations [
14,
15], and models [
16,
17,
18,
19]. Among these, land use density and intensity may serve as indicators of regional function agglomeration. Manufacturing and productive services are the focus of industrial element research and have been proved to have a positive effect on economic growth because of their capacity to reduce production costs. However, they have negative effects on the surrounding environment. The spatial agglomeration and inequity of various public service elements is another crucial issue in urban studies, including ecosystem services provided by green spaces [
20,
21], educational services offered by schools [
22], healthcare services provided by hospitals [
23,
24], and other services [
25]. However, the majority of previous studies focused on a singular aspect of various elements, potentially failing to explore the distinction and convergence of comprehensive spatial patterns of urban elements across different regions.
The proliferation of big data, represented by Points of Interest (POIs), has provided an opportunity for a more comprehensive understanding of the distribution patterns of various urban elements and services [
26,
27,
28,
29]. For example, Jiao investigated the features of the distribution pattern of urban spatial agglomeration elements, observing the distribution, degree, and pattern of agglomeration [
30]. Based on POI data, Hu used the method of spatial point pattern analysis to characterize the territorial spatial agglomeration in Ningbo, China [
31]. Lu used the industry classification of POI data to analyze the spatial cluster-discrete distribution of economic geographic elements in Lanzhou, China [
32]. He identified the polycentric spatial structure of urban agglomeration in the Pearl River Delta based on the fusion of nighttime light data, POI data, and Tencent migration data [
33]. Zeng investigated the spatial heterogeneity of producer service agglomeration and carbon emissions based on POI data and remote sensing data from China’s Yangtze River Economic Belt [
34]. By extracting industry-related points of interest (POIs), Yu emphasized the spatial–functional roles of regional agglomeration and their network behaviors in China’s Greater Bay Area [
35].
For the measurement of agglomeration, previous studies have primarily employed spatial analysis approaches, including Kernel Density Estimation (KDE), Standard Deviation Ellipse (SDE), the Getis-Ord Gi* statistic, and Moran’s I, which mainly focus on the density attributes of spatial elements [
36,
37,
38,
39,
40]. However, the importance of spatial interaction between these elements may be overlooked, as it serves as a primary driving force for urban element aggregation and urban expansion [
28,
29,
41]. Various embedding models, including word2Vec [
42], place2Vec [
43], and Block2Vec [
44], have been proposed to investigate the spatial interactions among different elements using natural language processing (NLP) techniques. However, the link between them and the spatial agglomeration of urban elements has not been thoroughly examined.
To address the above problem, Wuhan, a rapidly developing megacity situated in the center of China, was selected as a case study. Based on an embedding model that utilizes NLP techniques, an assessment process framework of urban element agglomeration is proposed that combines the volume of spatial elements and their spatial interaction. POI data, the Block2Vec model, machine learning, and GIS spatial analysis were employed to measure the spatial and temporal evolution of urban element agglomeration. The specific objectives of the study were (1) to unify the quantities and spatial interactions of spatial elements into a consistent assessment process and compare spatial agglomeration, and (2) to investigate the temporal evolution of urban elements through the measurement of element agglomeration over multiple years. Theoretically, the proposed framework could emphasize the volumes and spatial interactions of urban elements, thereby enabling a more comprehensive understanding of their agglomeration situation. This is crucial in accurately capturing the spatial evolution of urban elements. The remaining research is organized as follows:
Section 2 details the study area and data sources;
Section 3 introduces the research methods;
Section 4 presents the research results, followed by a discussion in
Section 5; and conclusions are presented in
Section 6.
2. Study Area and Data Sources
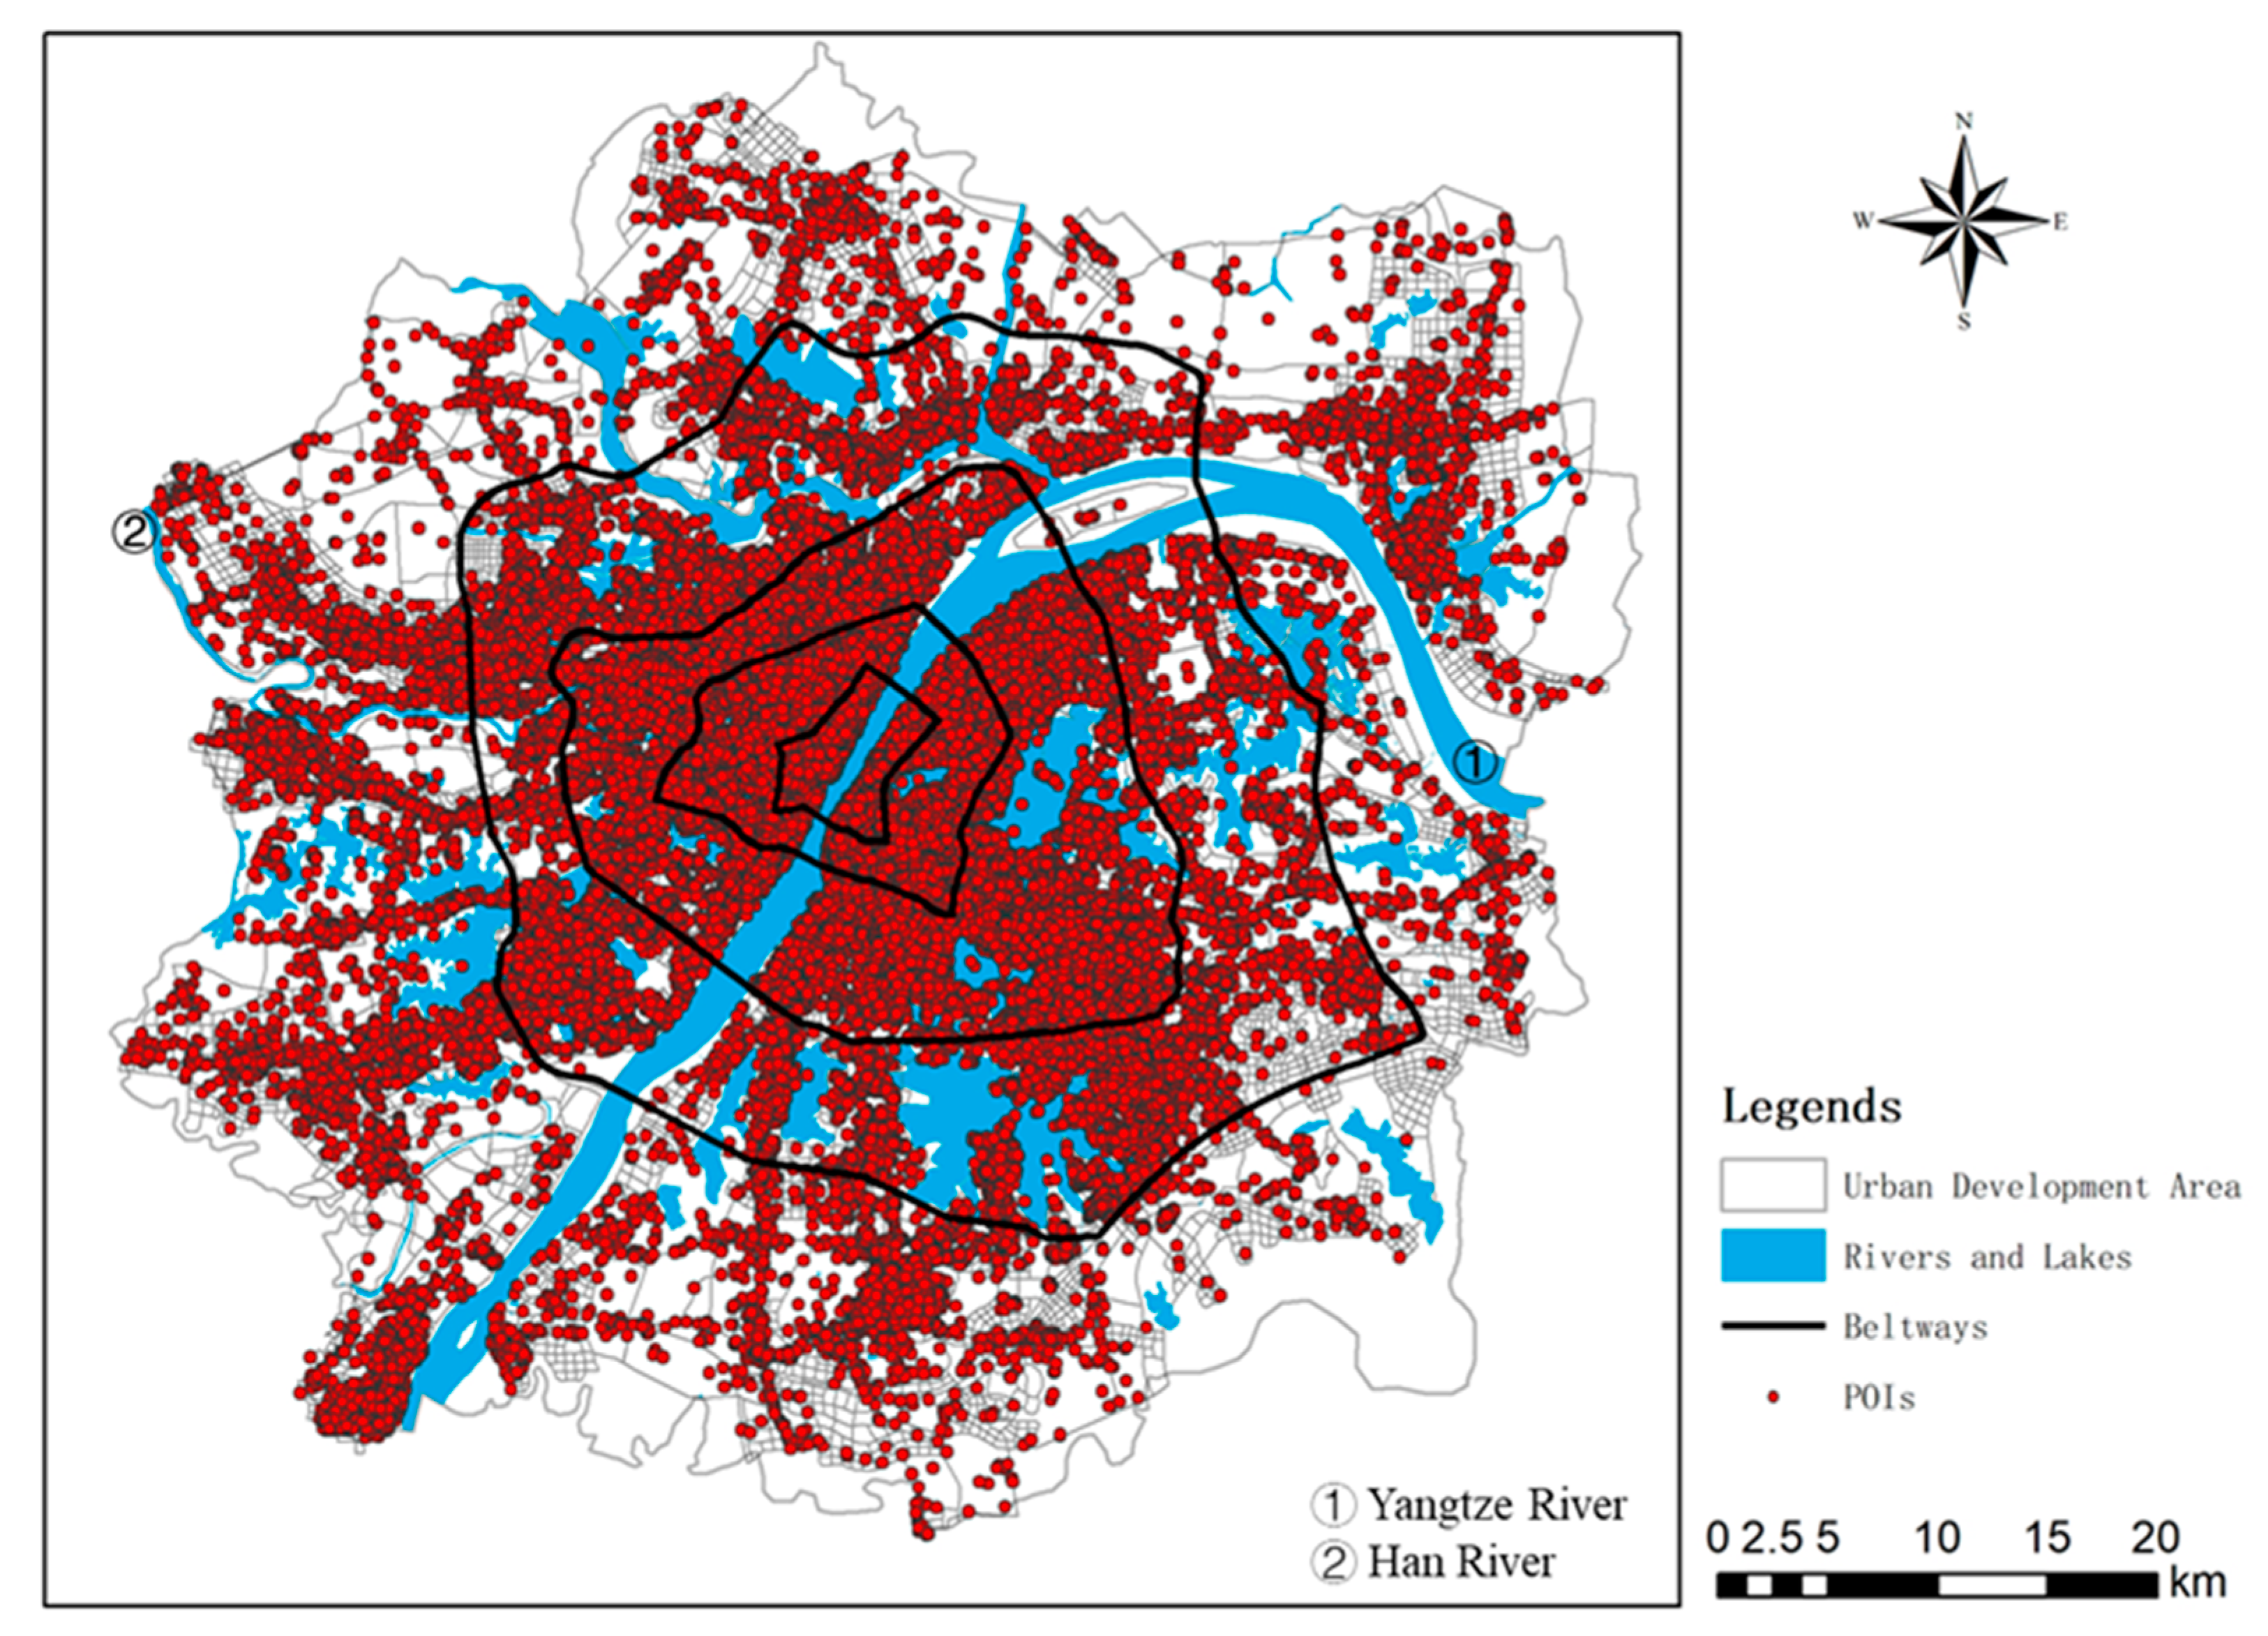
The urban development area of Wuhan was used as the study area; it is the main area for the concentration of urban spatial elements and spatial expansion [
45]. By 2020, Wuhan had a resident population of 11.12 million and an administrative area of 8569 km
2, of which the urban development area is 1045 km
2. Based on the regional coordinated development strategy of a rational division of labor and optimal development, the government proposed an effective strategy during the 14th Five-Year Plan period to promote multi-centered, networked, and clustered development of the city with a view to building a spatial development pattern of “one main city and four sub-cities” and integrated urban and rural development [
46].
In order to capture the spatial characteristics of element agglomeration at the micro-scale and dynamically between years, the planned road network was used to delineate the Traffic Analysis Zones (TAZs), which formed the minimum research unit in this study. The planned road network data were acquired from the Wuhan Municipal Bureau of Natural Resources and Planning.
The division of TAZs and the distribution of POI data in Wuhan are shown in
Figure 1. The Point of Interest (POI) data were collected through Amap Development Platform continuously from 2017 to 2021. Within the urban development area, an average of 537,511 POI data were acquired over five years (as shown in
Table 1). Each of these POI data contained its type classification and geographic coordinate information. Meanwhile, according to the three-level type division provided by Amap (
https://lbs.amap.com/ (accessed on 28 April 2022), three hierarchical types were obtained for each POI datum. Among them, the first-level classification includes 20 primary categories such as food service, shopping service, living service, etc. (
Table 2). In the second-level classification, the middle categories mainly include 93 types such as Chinese restaurant, western restaurant, shopping mall, etc. The third-level classification includes subdivision types such as hotpot restaurant, special restaurant, etc., with 493 types in total.
In addition, 1-meter-resolution remote sensing images from different years were used to compare the land cover across the years. Images for each year were taken from Google Earth map data.
3. Methodology
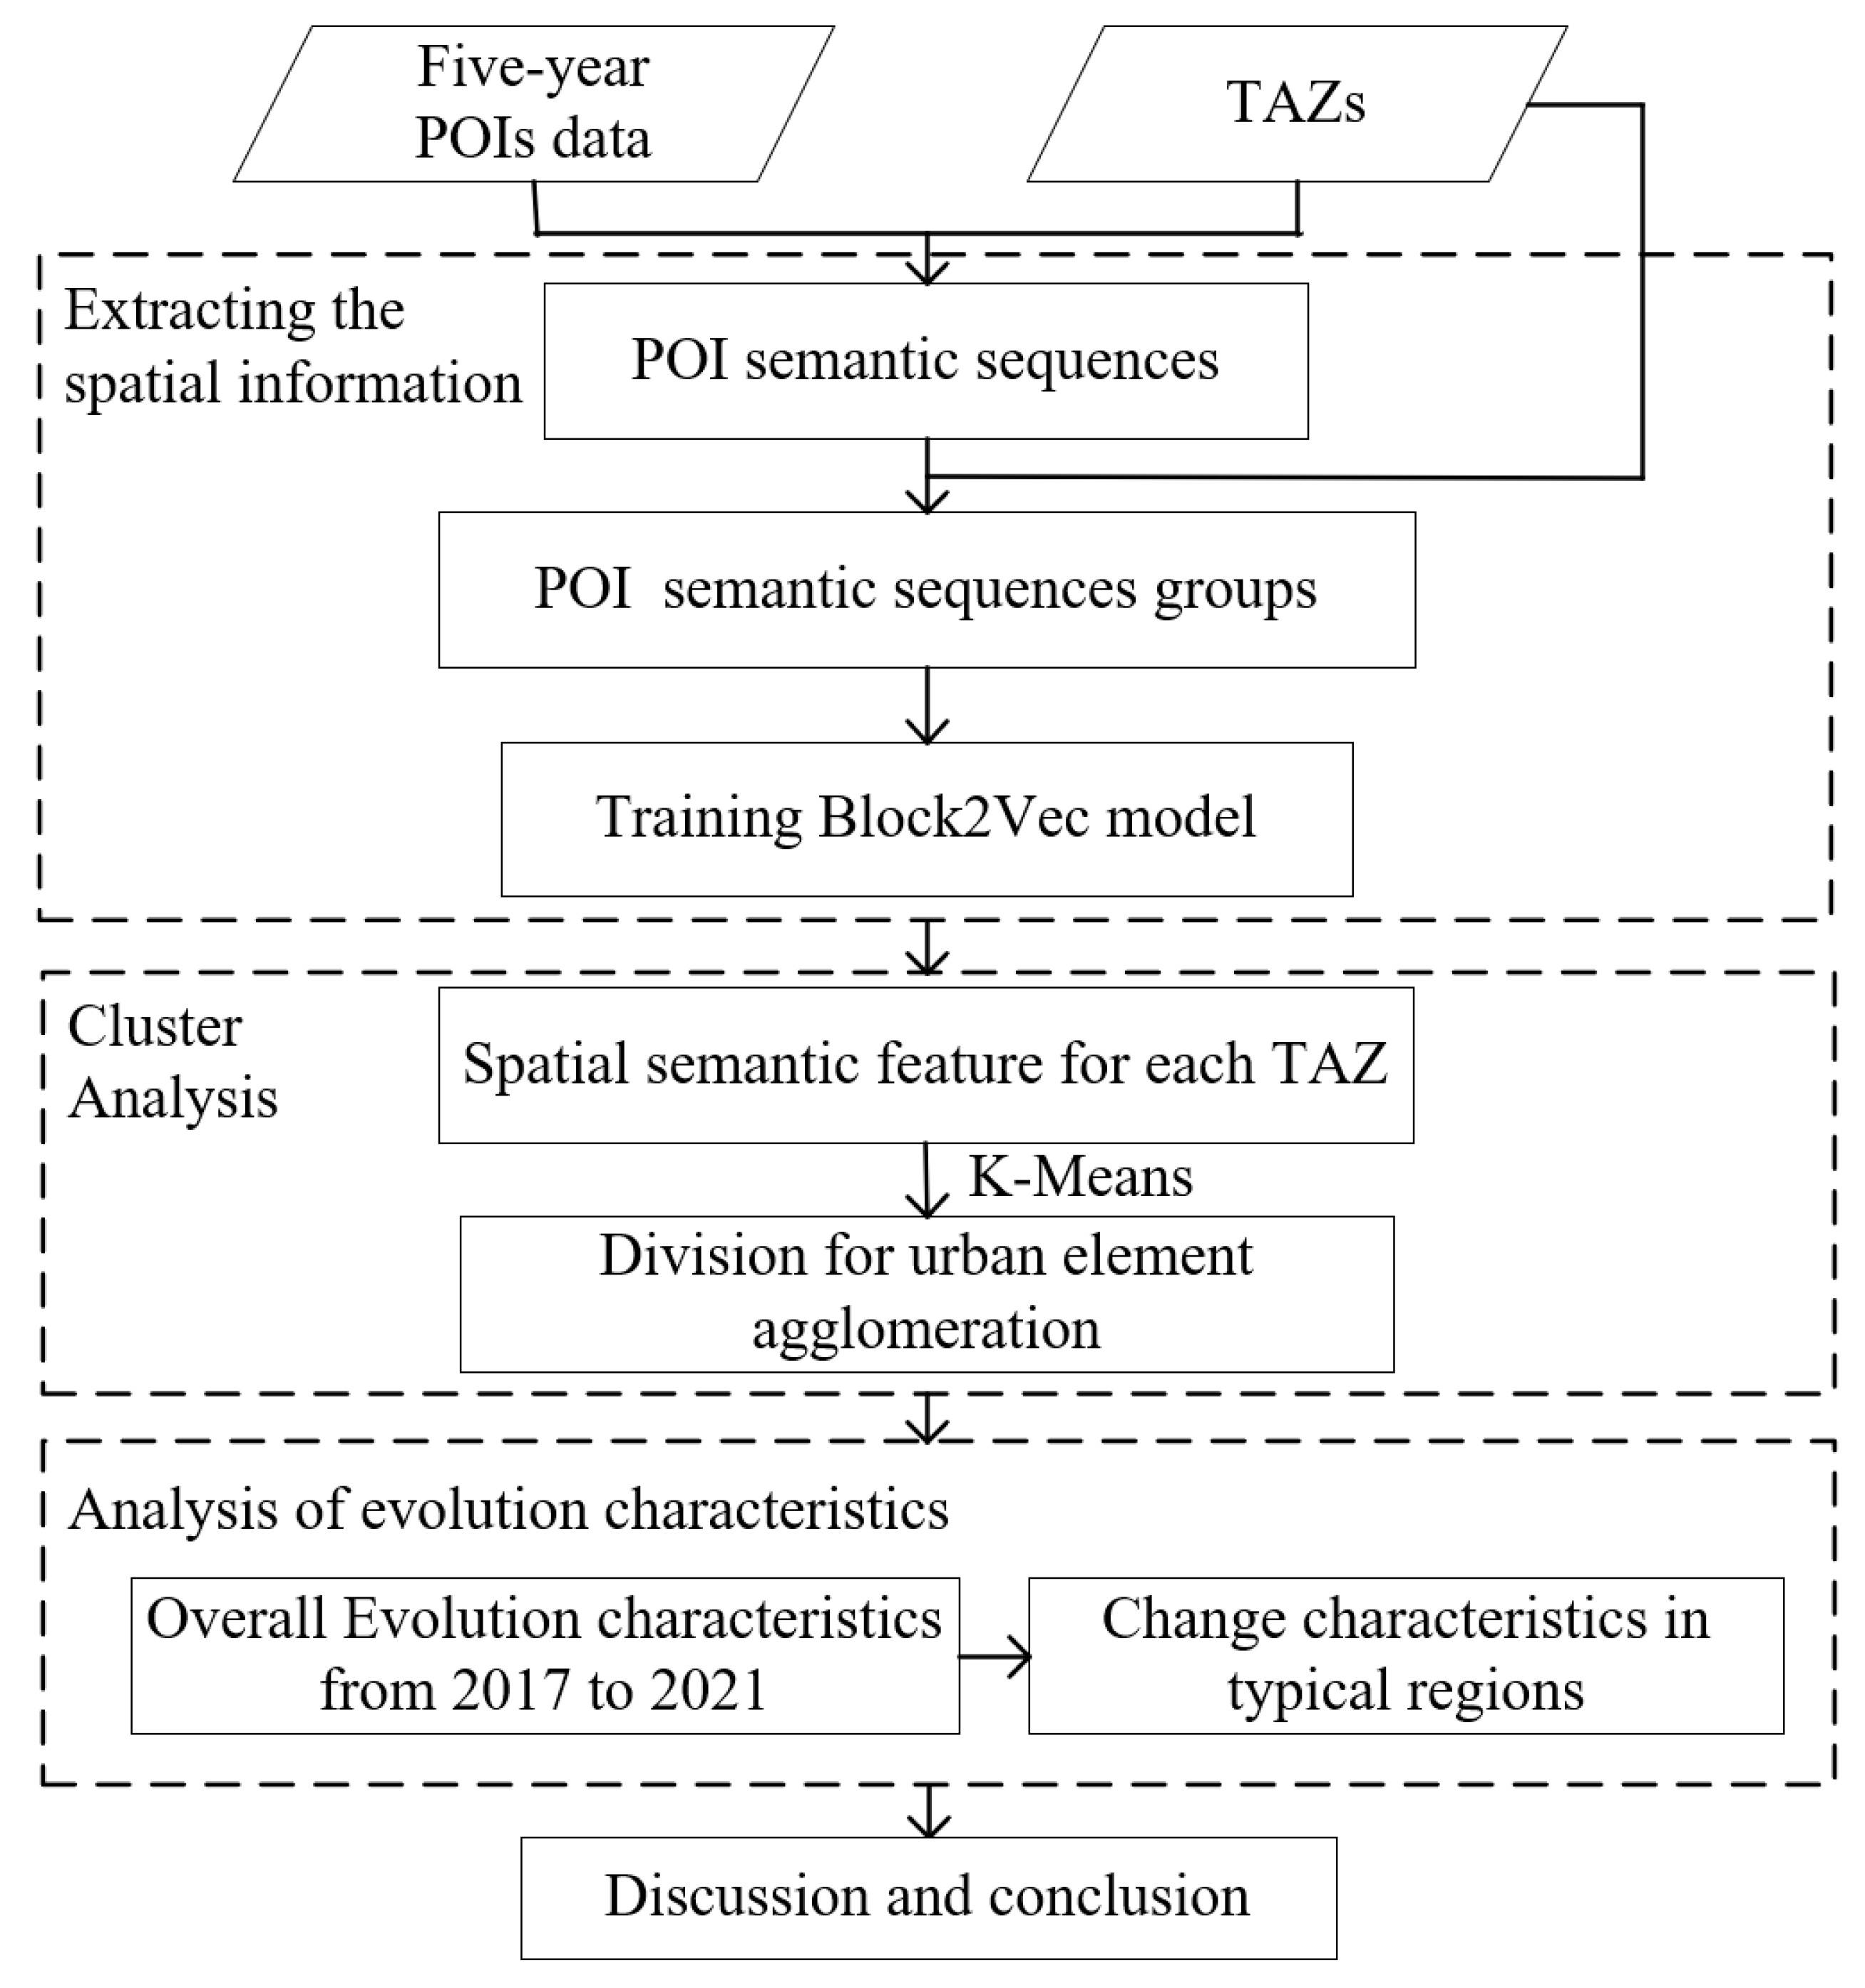
The aim of this study was to investigate the spatial agglomeration pattern of urban elements during different time periods. The overall framework is shown in
Figure 2. Firstly, the Block2Vec model was employed for extracting spatial features from the POI data; this model mainly considers the spatial features between each POI within a specific TAZ and the spatial interaction features between TAZs. Second, TAZs with different agglomeration features could be obtained by performing K-Means clustering analysis on the extracted spatial features. Finally, a spatial–temporal comparison analysis of these categories across different time periods was performed, and the changes in spatial distribution of various agglomerative features were analyzed using spatial autocorrelation statistics.
3.1. Spatial Feature Extraction Model
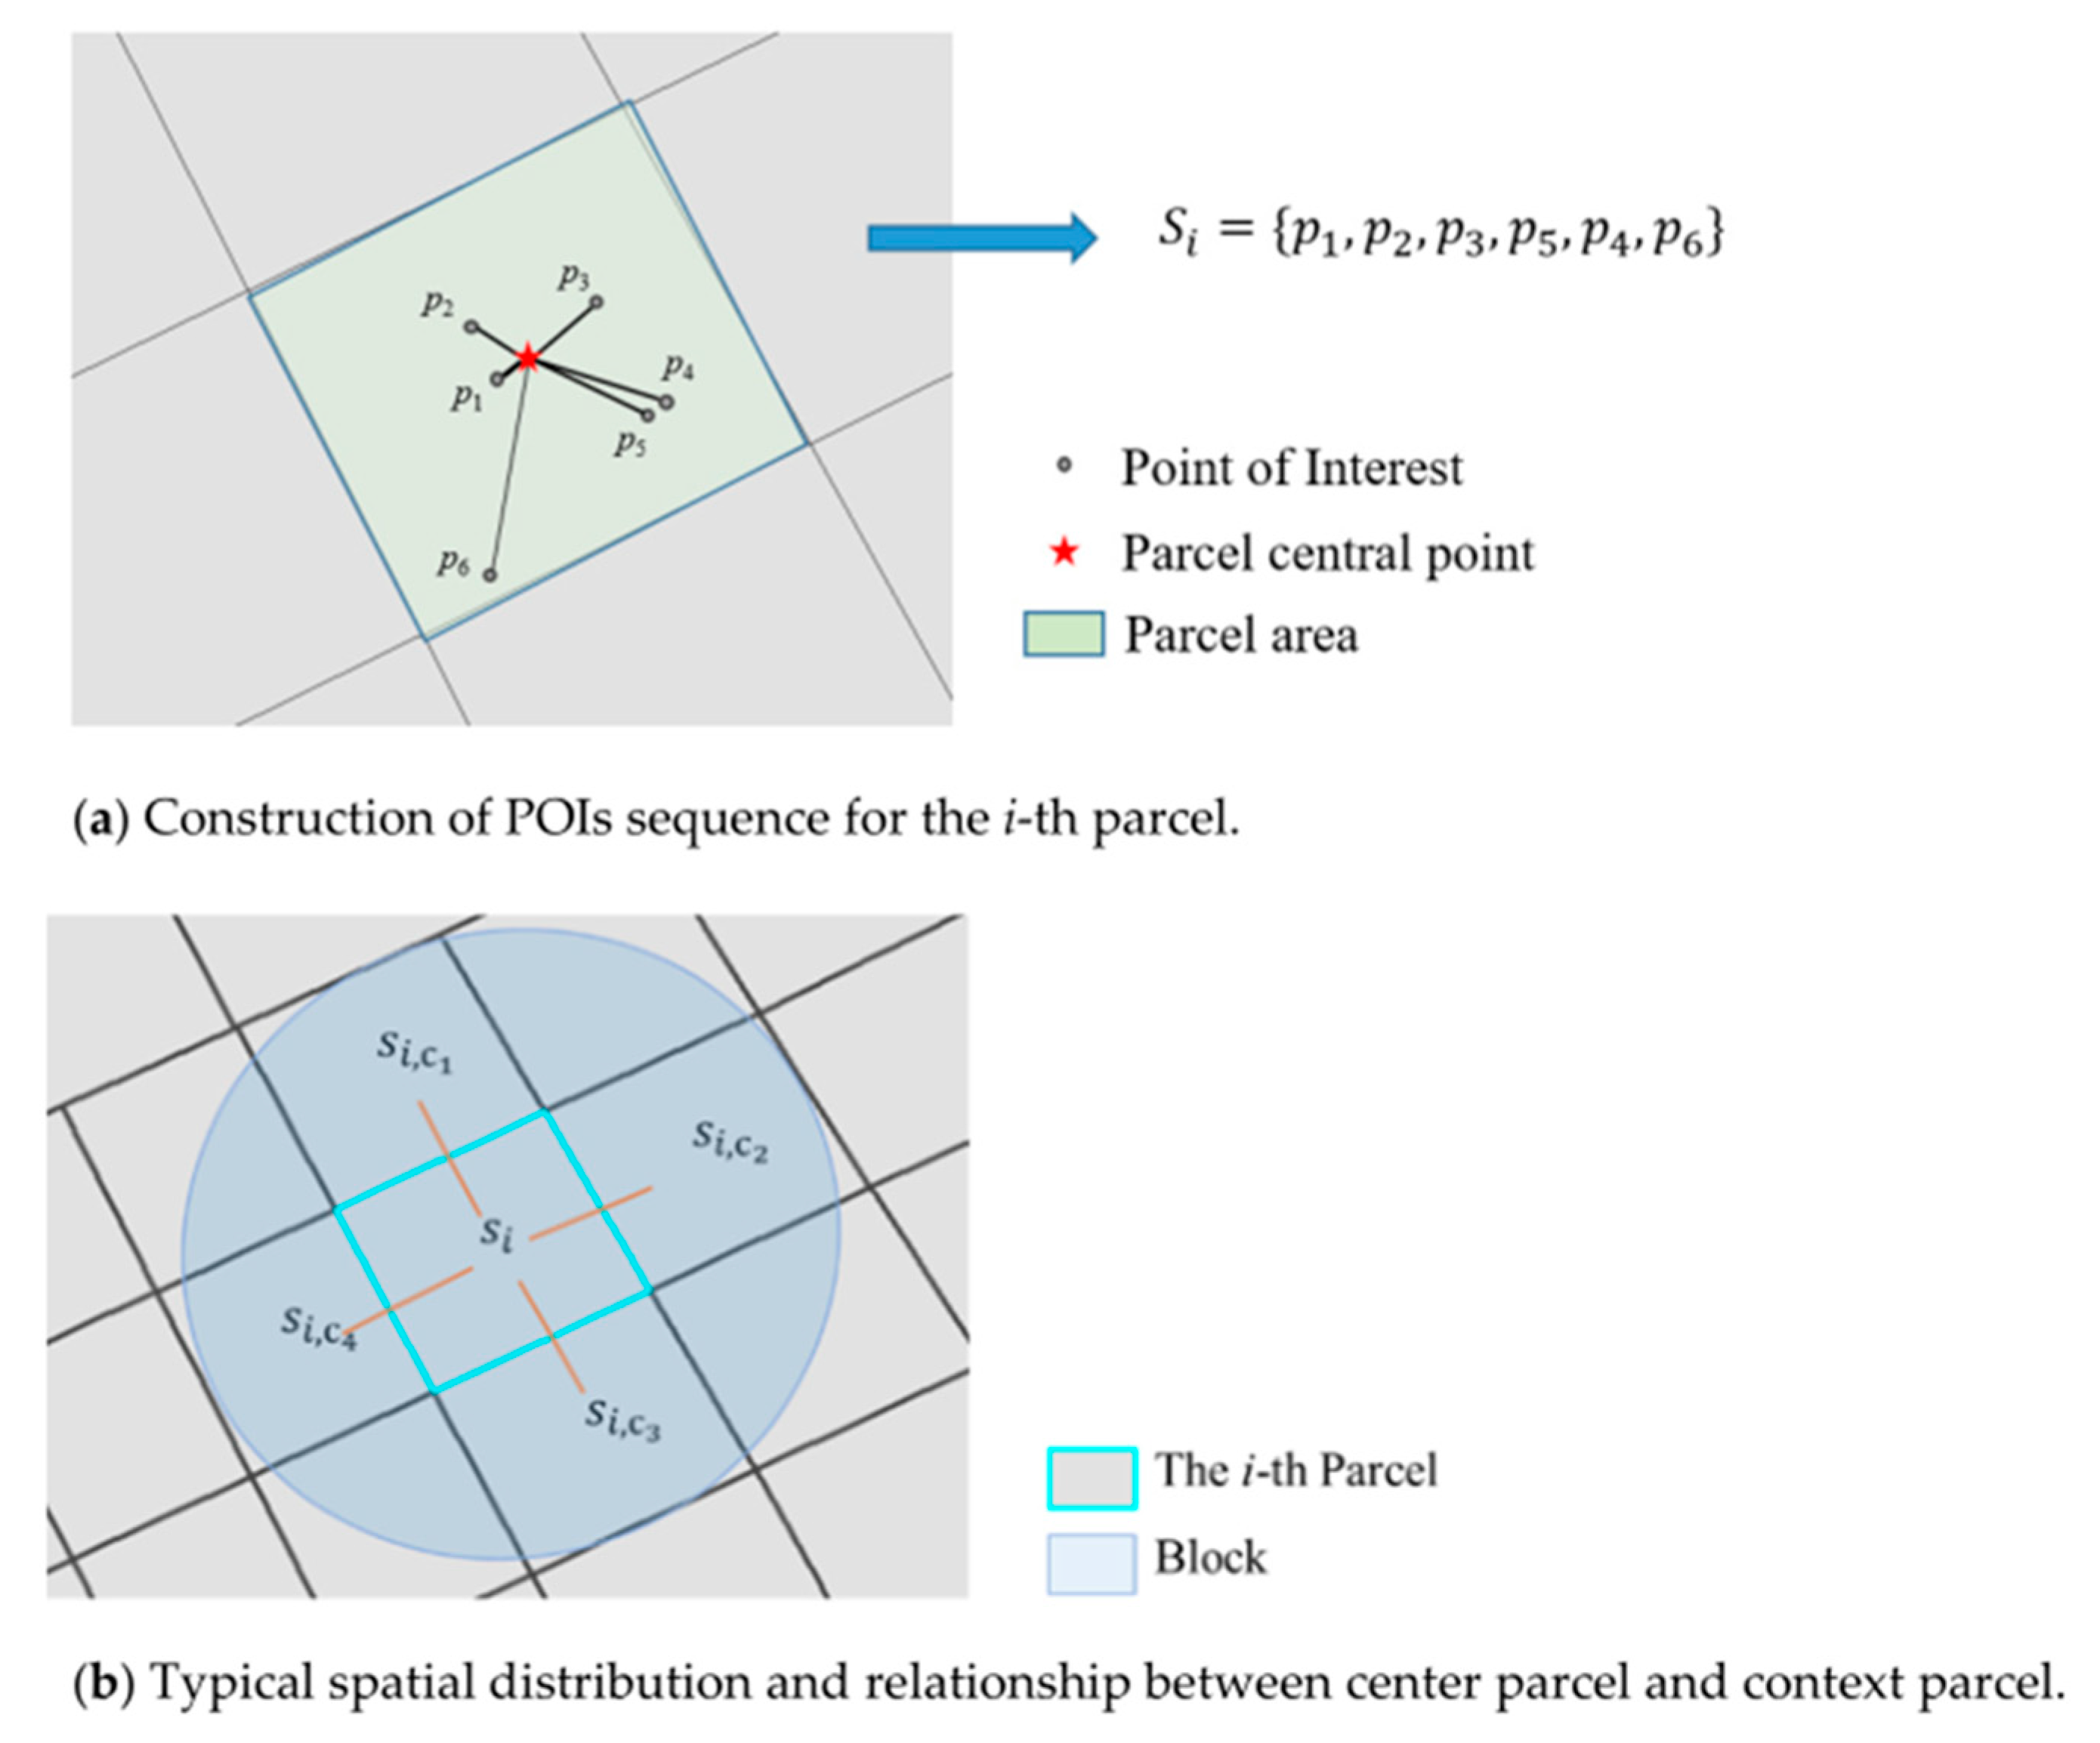
Different urban elements tend to cluster or be mutually exclusive in geographical space, indicating the presence of spatial information between spatial elements that can enhance the understanding of spatial interaction [
28,
41]. In this study, the Block2Vec model was used to establish the spatial semantic sequences and the central-context block spatial correspondence for all the TAZs. Taking the central TAZ depicted in
Figure 3 as an example, the POI sequence
Si was constructed based on the distance from the POI location to the center of this TAZ. The semantic sequence group
)] of this special TAZ was then constructed based on the spatial proximity between this TAZ and the surrounding TAZs. Inspired by the skip-gram framework in natural language processing [
47], the Block2Vec model was constructed using an encoder and four decoders based on a Long Short-Term Memory (LSTM) network. A detailed description of this model can be found in previous studies [
44].
The Block2Vec model was implemented using Python and related open-source machine learning modules, including Scikit-Learn, Pytorch, the Gensim module etc. In this study, both the encoder and decoder LSTM network layers were set to 1, and the dimension of latent semantic features was set to 200. Furthermore, the batch size for model training was set to 64, and the number of iterations was set to 150.
3.2. Feature Clustering Analysis
The K-Means method is an efficient unsupervised classification method and is widely used in related research [
42,
48]. In this study, the POI semantic sequences of TAZs were mapped onto a high-dimensional latent semantic feature vector space using the above spatial feature extraction model. When two TAZs have similar spatial elements, such as dense urban elements, their spatial features are expected to be close to each other in the high-dimensional space. Regarding this, different spatial distance calculation methods could be used to measure their spatial distance. Due to the high dimensionality of the spatial features in this study, the cosine distance was utilized to measure the similarity between different TAZs; this distance measure has been verified in related research [
42,
44]. Consequently, the K-Means method with cosine distance was used to aggregate these TAZs with different spatial features.
3.3. Analysis of Spatial and Temporal Evolution
The POI sequences obtained from 2017 to 2021 were used to compare and analyze the temporal evolution characteristics of each cluster over time. Firstly, the annual samples of POI sequences were aggregated for clustering analysis as described above. Then, the clustering results for each year were analyzed individually. For the temporal dimension, the number of different classes of TAZs was calculated for all years, enabling a longitudinal comparative analysis of the temporal evolution characteristics of these different classes of TAZs. In terms of the spatial dimension, the agglomeration distribution characteristics in 2017 and 2021 were compared at TAZ scale. The Moran’s I and Local Moran’s I were employed to analyze the variation in their spatial distribution characteristics.
4. Results
Due to the presence of many undeveloped areas on the periphery of the city, there are no POI data in the TAZ where they are located. Therefore, to ensure the reliability of model training, the TAZs within the main urban area were used as training samples for the Block2Vec model in this study. Then, the POI sequences within the urban development area were extracted.
4.1. POI Sequence Construction
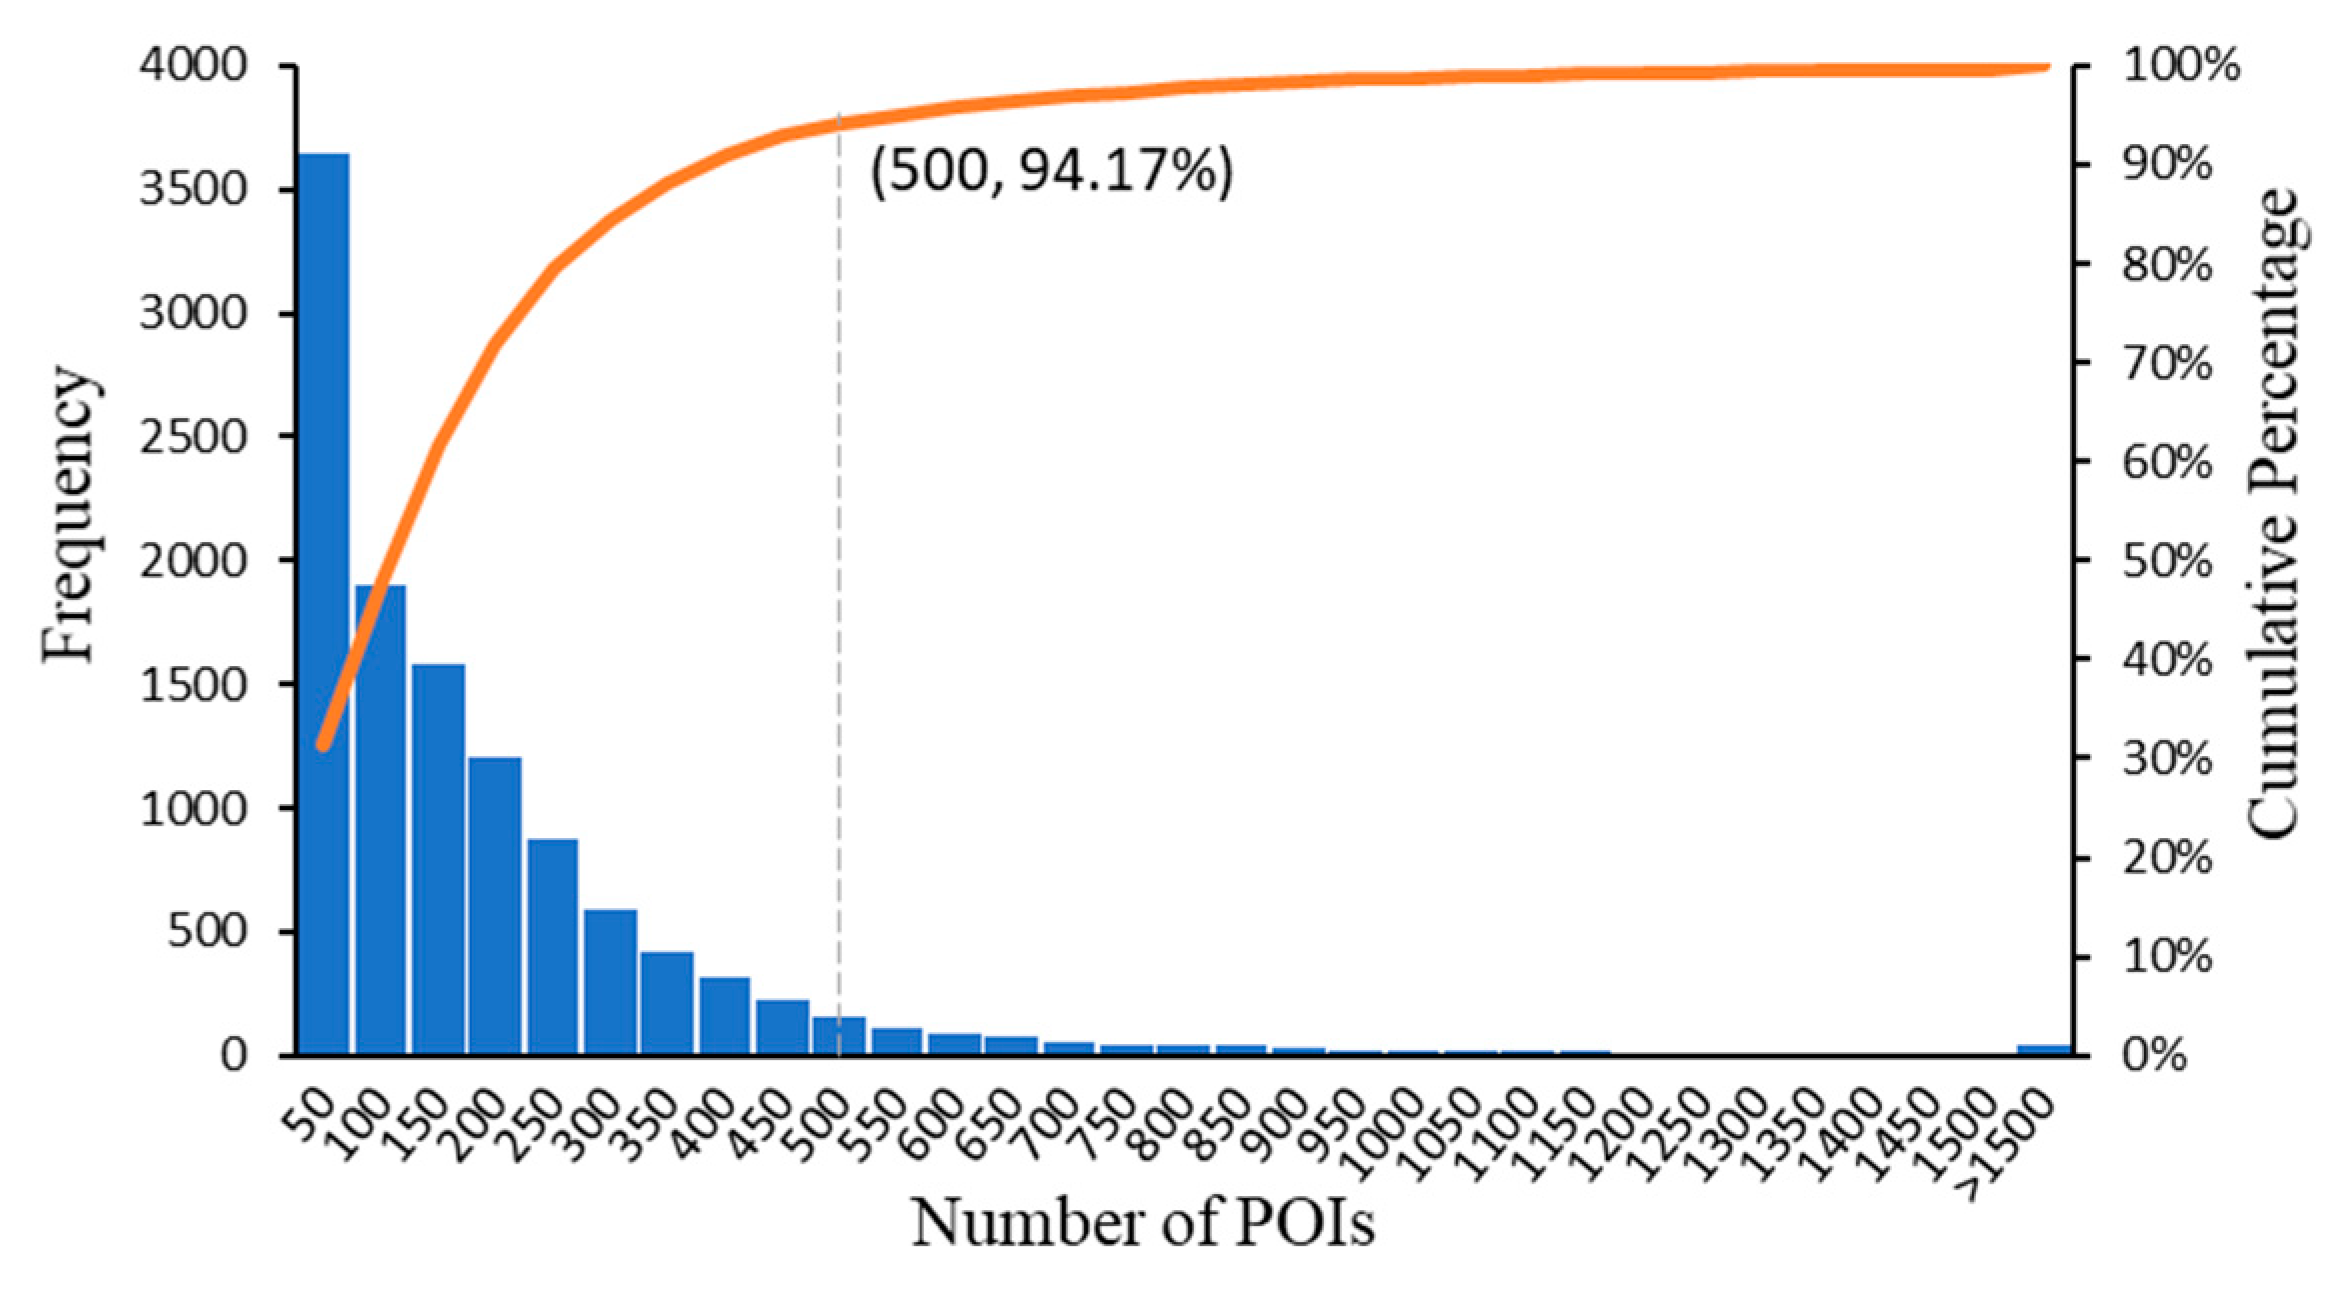
POI data spanning five years were utilized to construct POI sequences based on the three-level categories. A total of 29,254 sequences were obtained in the urban development area, while 11,586 spatial groups corresponding to the main urban area were acquired.
Figure 4 illustrates a long-tailed distribution pattern with most POI sequence lengths being relatively short. Excluding TAZs without available POIs, the range of TAZs’ POI sequences varied from a minimum of 1 to a maximum of 3074, with an average length of 170. Furthermore, as 94.17% of all TAZs had sequence lengths of less than 500, a sequence length of 500 was chosen for this study.
4.2. Spatial Agglomeration Characteristics of Urban Elements
The K-Means algorithm was used to aggregate different TAZs into
k-many categories. Previous studies have shown that when the value of
k is small, the clustering results better reflect the overall aggregation differences within the region [
44]. Therefore, the value of
k was set to three in this paper.
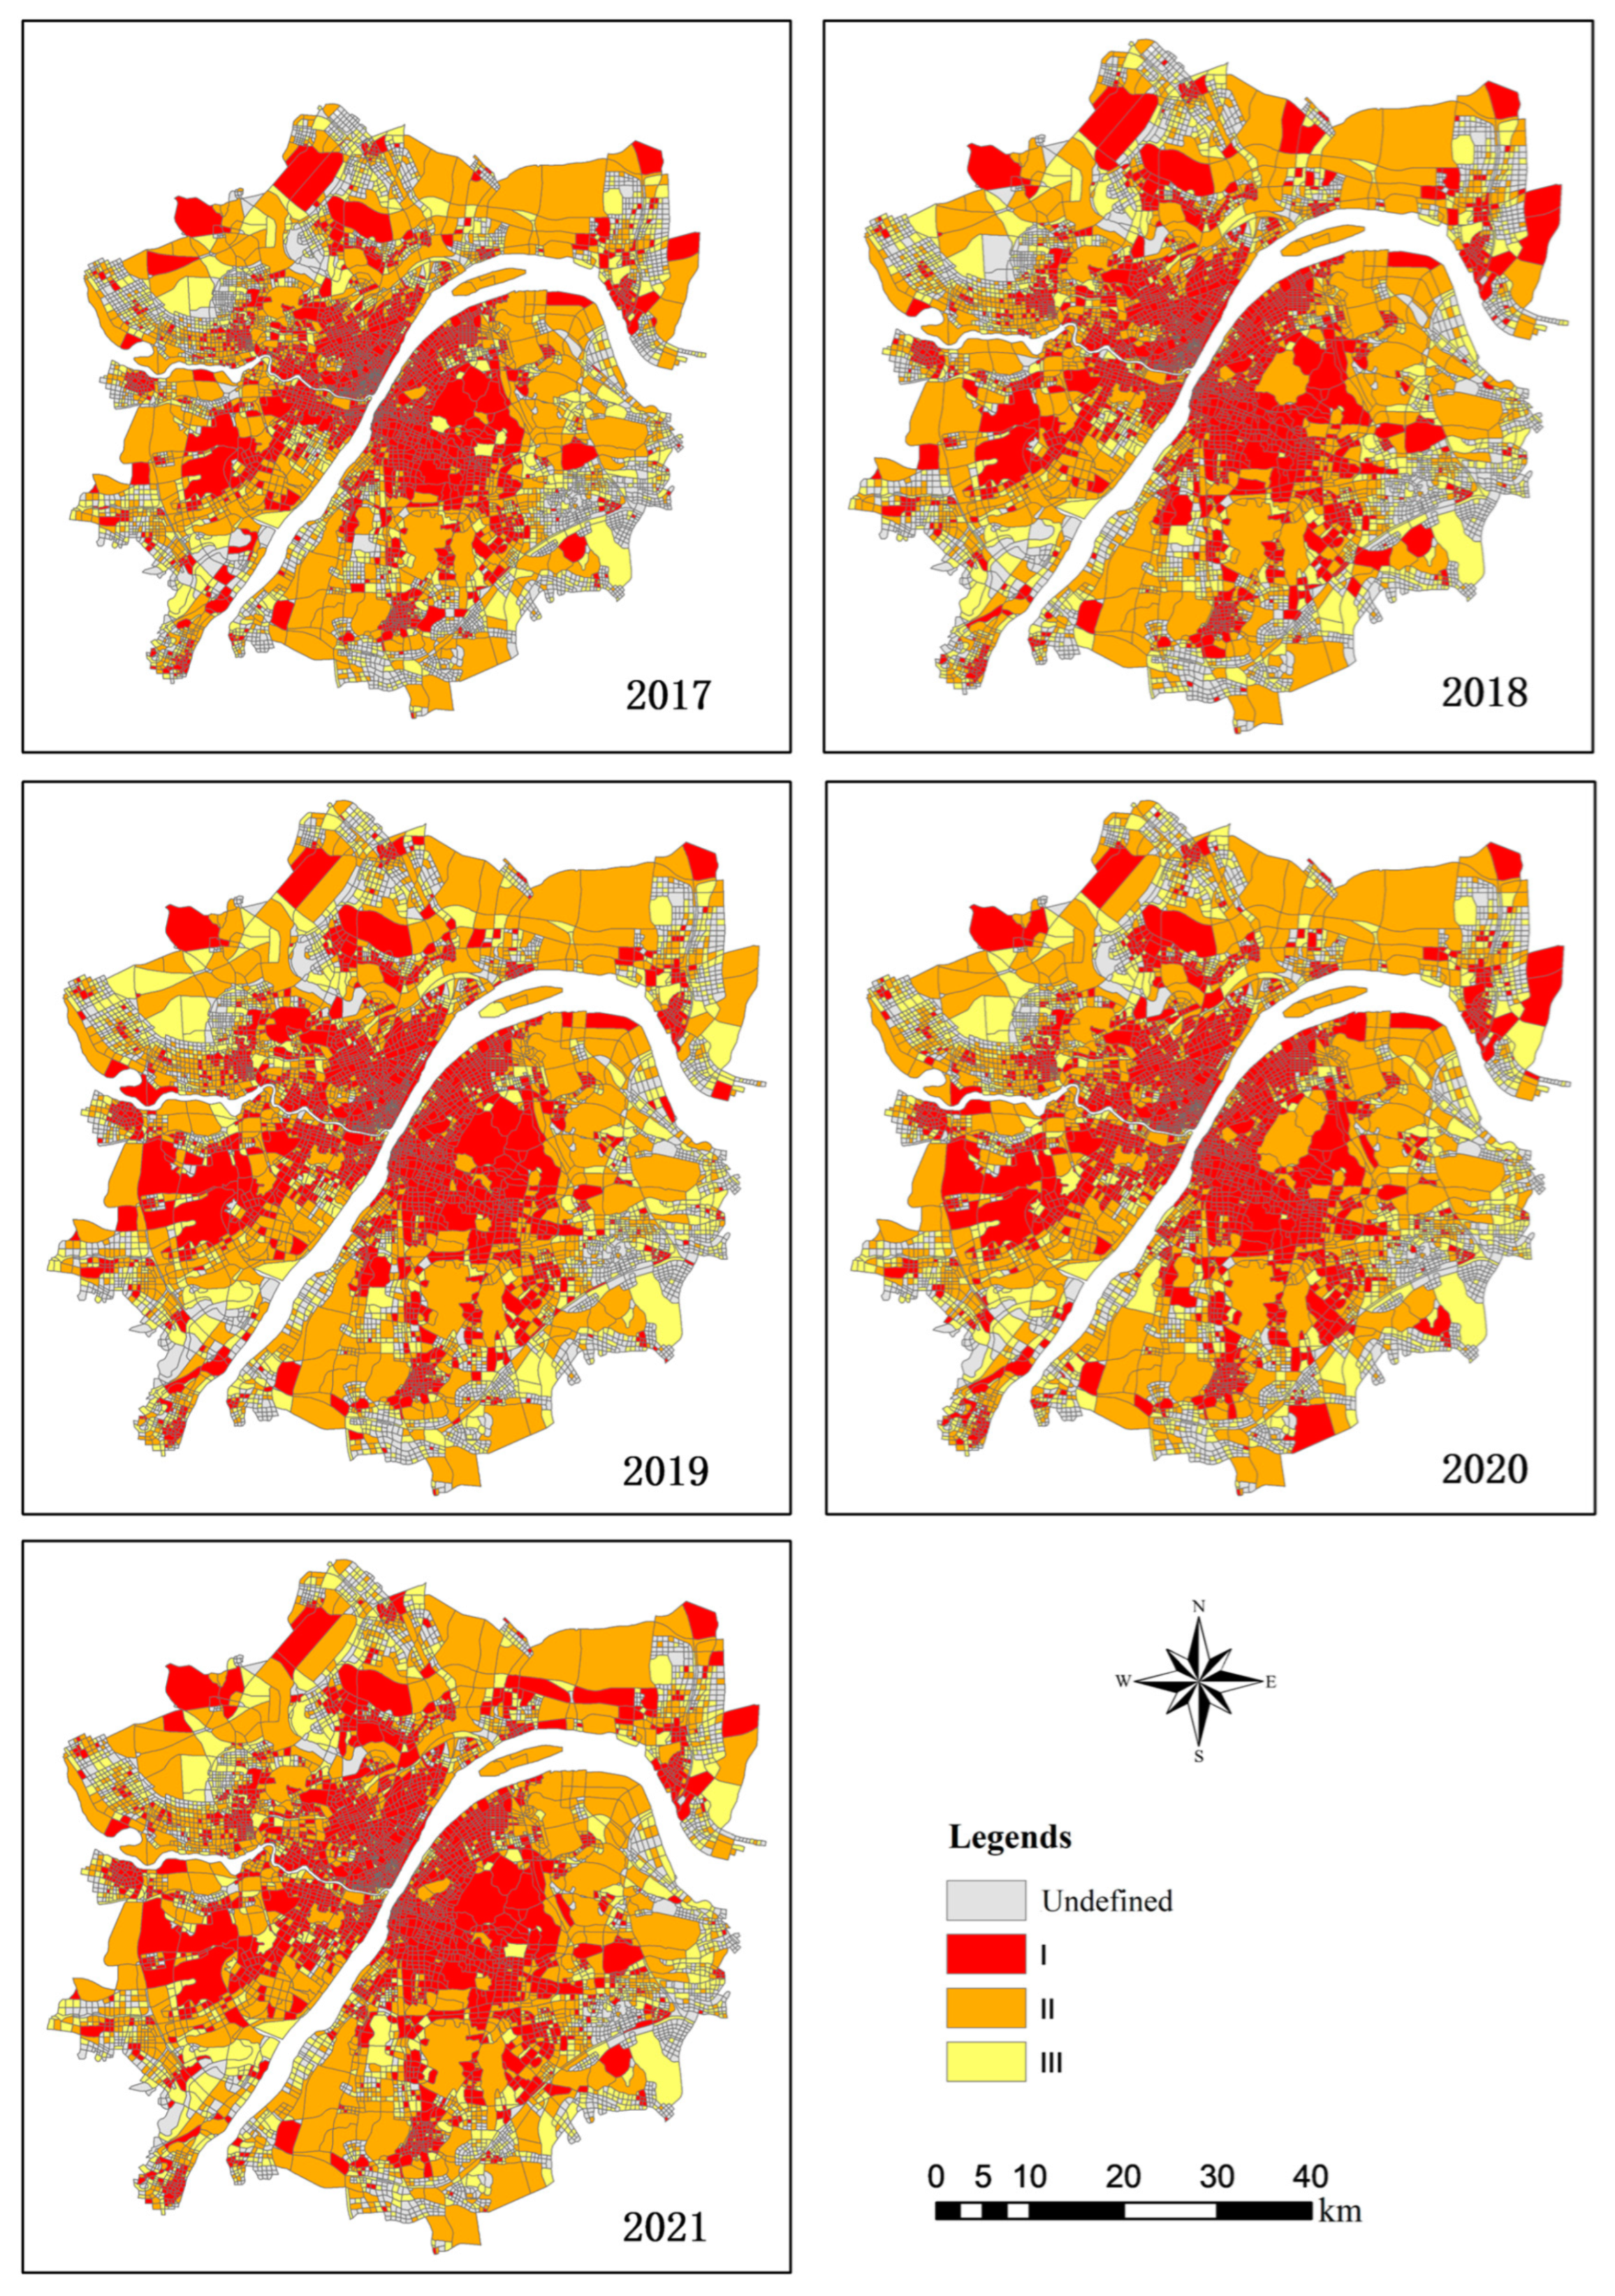
Figure 5 shows the spatial distribution of K-Means results for TAZs within the study area from 2017 to 2021. These TAZs were aggregated into three classes—category I, category II, and category III—and undefined classes with no available POI data.
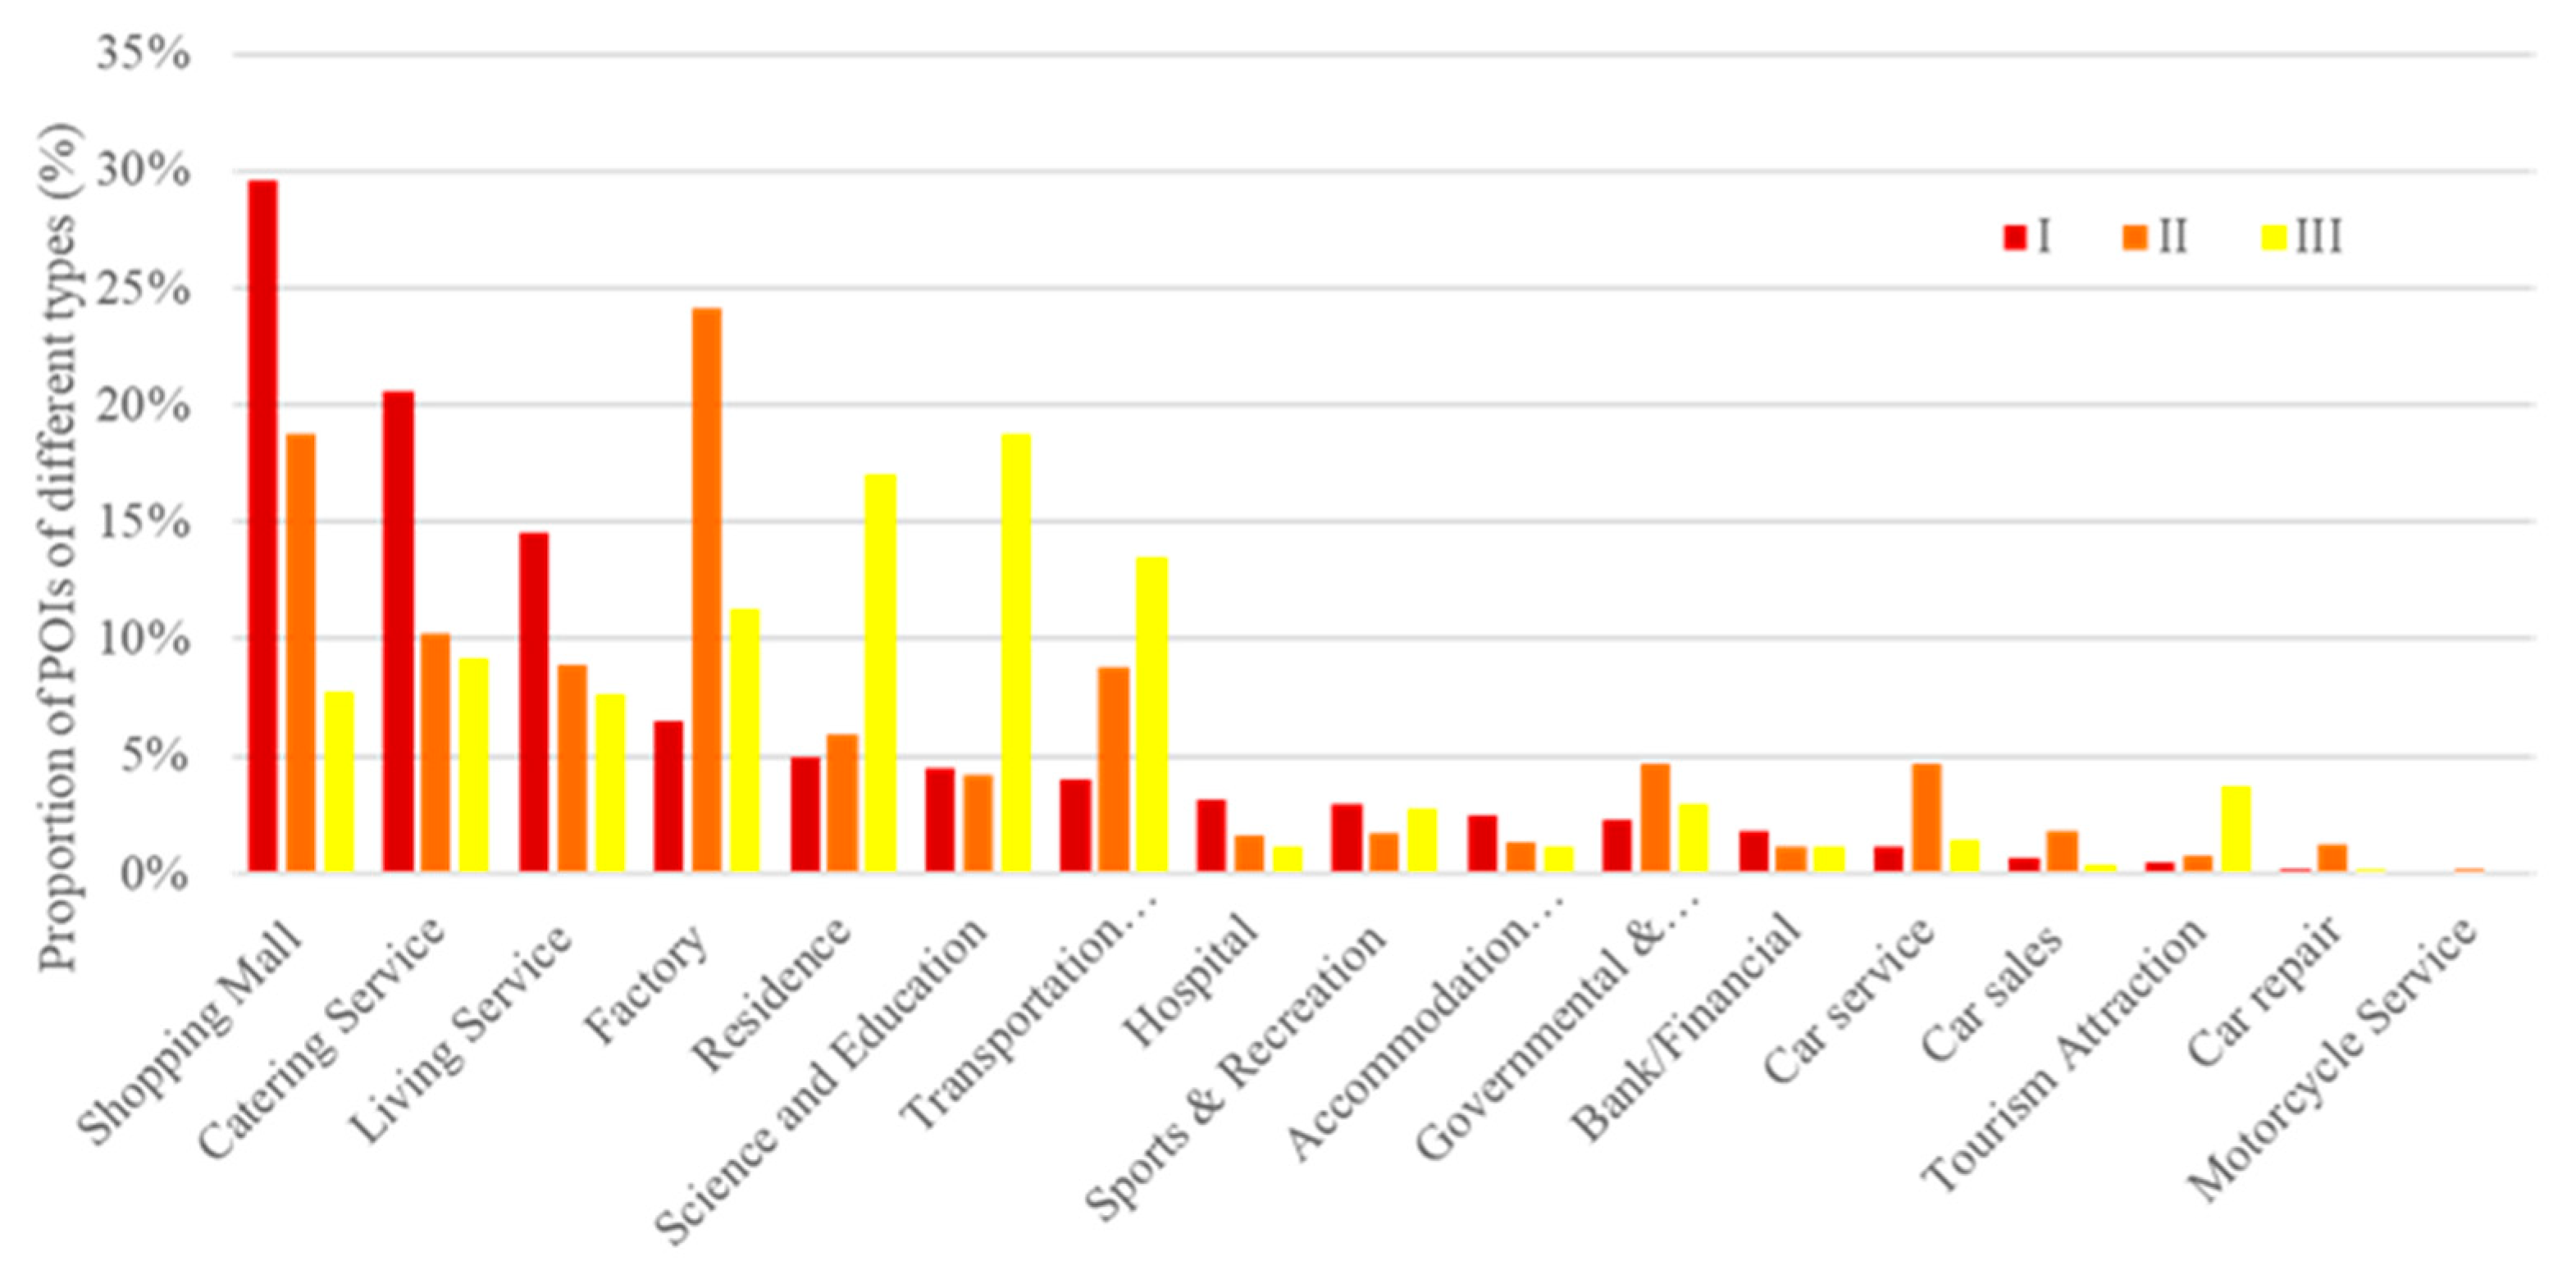
Figure 6 shows the distribution of the percentage of POI primary-level classification types for different clustering classes. The following descriptions define the results for the three classes:
Category I: High-concentration areas, which are primarily located in the city center but exhibit clusters in surrounding areas as well. These areas are characterized by a high proportion of entertainment elements, such as catering services, shopping services, and living services. Business and residential elements, as well as scientific and educational services, also contribute significantly to this category. This indicates a well-developed service infrastructure and a high agglomeration of urban elements in these areas.
Category II: Medium-concentration areas, which are mainly distributed continuously in the peri-urban areas. This category has a high proportion of POI types, with corporate enterprise elements being the most common, followed by shopping services, catering services, transportation facilities, and others. This indicates that these areas have relatively better facilities for all types of services in the process of urban development.
Category III: Low-concentration areas, which are scattered in the peripheral areas of the city. The POI categories with a high proportion of types include science and education facilities, business and residential, and transportation facilities. This indicates that this category is mainly focused on living and working purposes, with relatively incomplete recreational facilities. This suggests that the degree of agglomeration of various urban elements is relatively low in these areas.
4.3. Analysis of the Time-Series Evolution of Urban Element Agglomeration
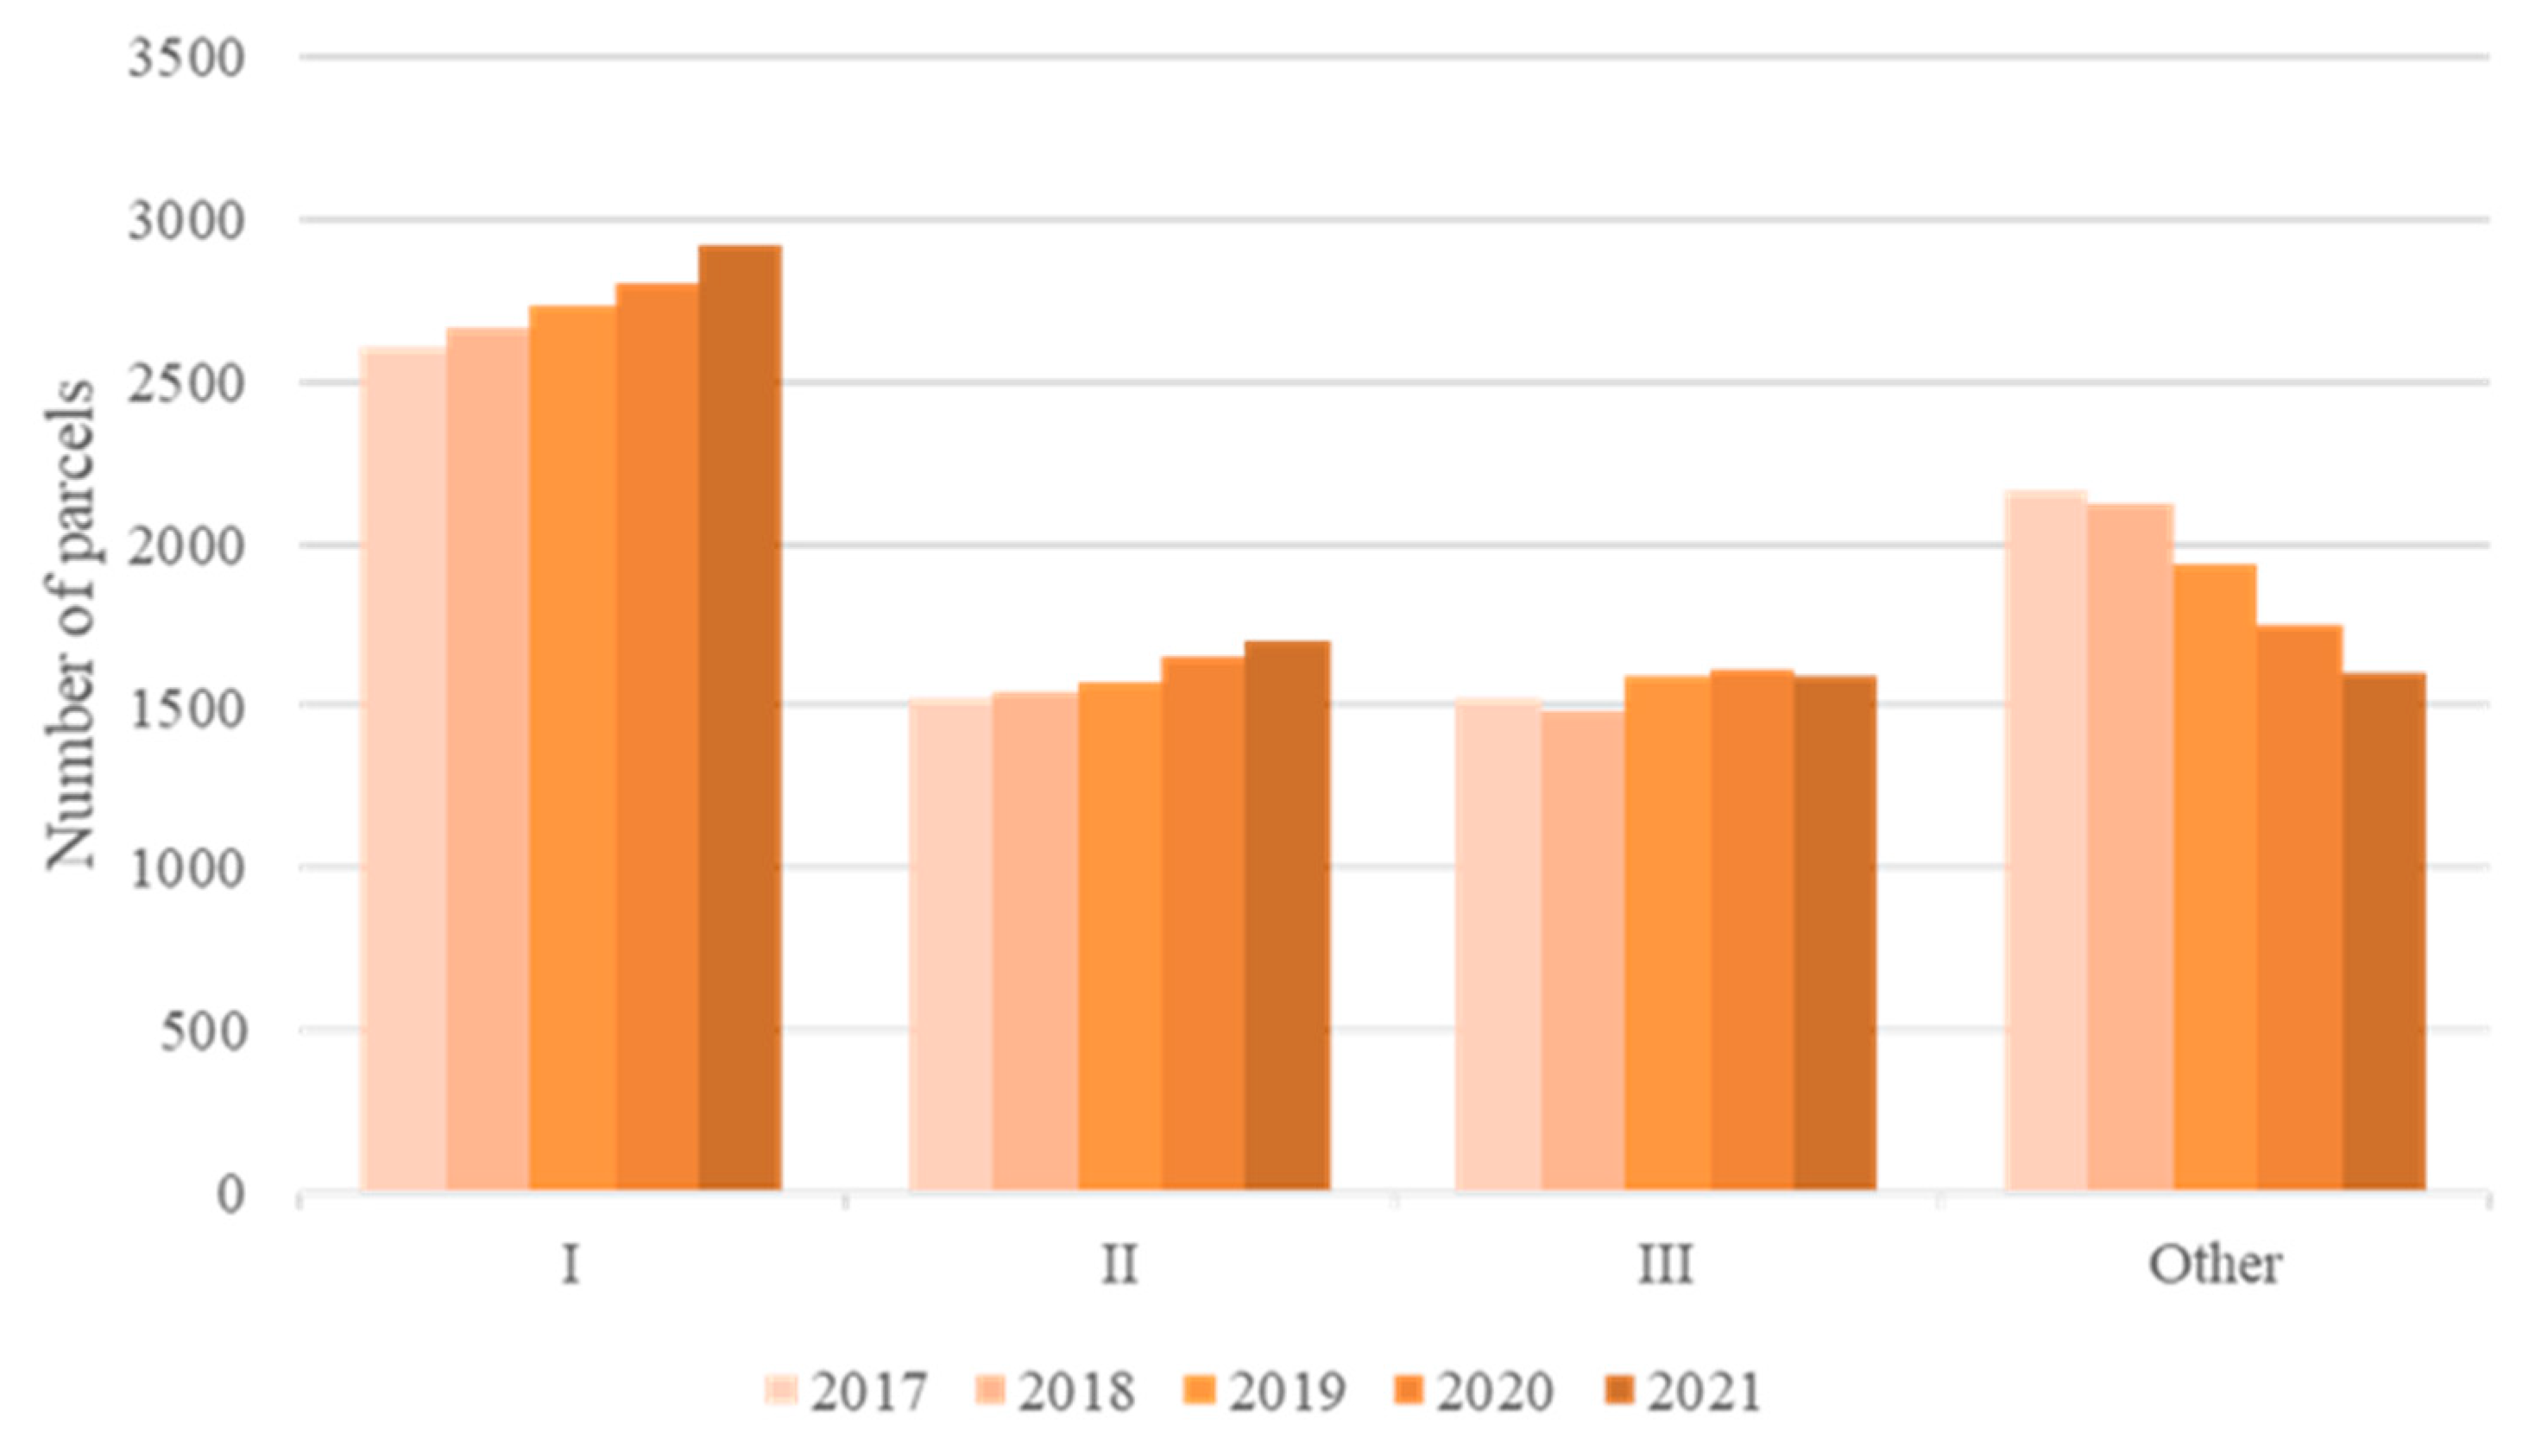
Figure 7 shows the change in the number in each class for the years 2017–2021, with the “other” class representing TAZs for which POI data are unavailable. A significant difference can be clearly observed in the trends of change among the various classes. Over time, the number of TAZs without POI data gradually decreased. At the same time, the number of TAZs with both high and medium agglomeration (category I and category II in
Figure 7) increased to varying degrees, whereas the number of TAZs with low agglomeration (category III) experienced a slight increase. By combining the spatial distribution characteristics in
Figure 5, it was found that during the urban development and expansion, areas with a low agglomeration of elements surrounding the city underwent significant development. The overall service integrity gradually improved, resulting in a transformation into medium or high agglomeration. Meanwhile, previously undeveloped areas gradually developed, ultimately evolving into areas with low agglomeration.
4.4. Analysis of Spatial Changes in Urban Element Agglomeration
The preceding analysis revealed that the three categories of clustering findings may embody distinct attributes of element agglomeration within urban space, representing varying phases of urban advancement. Thus, if a TAZ progressed from low agglomeration (category III) to either high (category I) or medium (category II) agglomeration over an interval, it could be perceived as a substantial escalation in urban elements. If a TAZ moves from a high-concentration area (category I) to a low-concentration area (category III), it suggests a substantial decrease in urban elements within the TAZ.
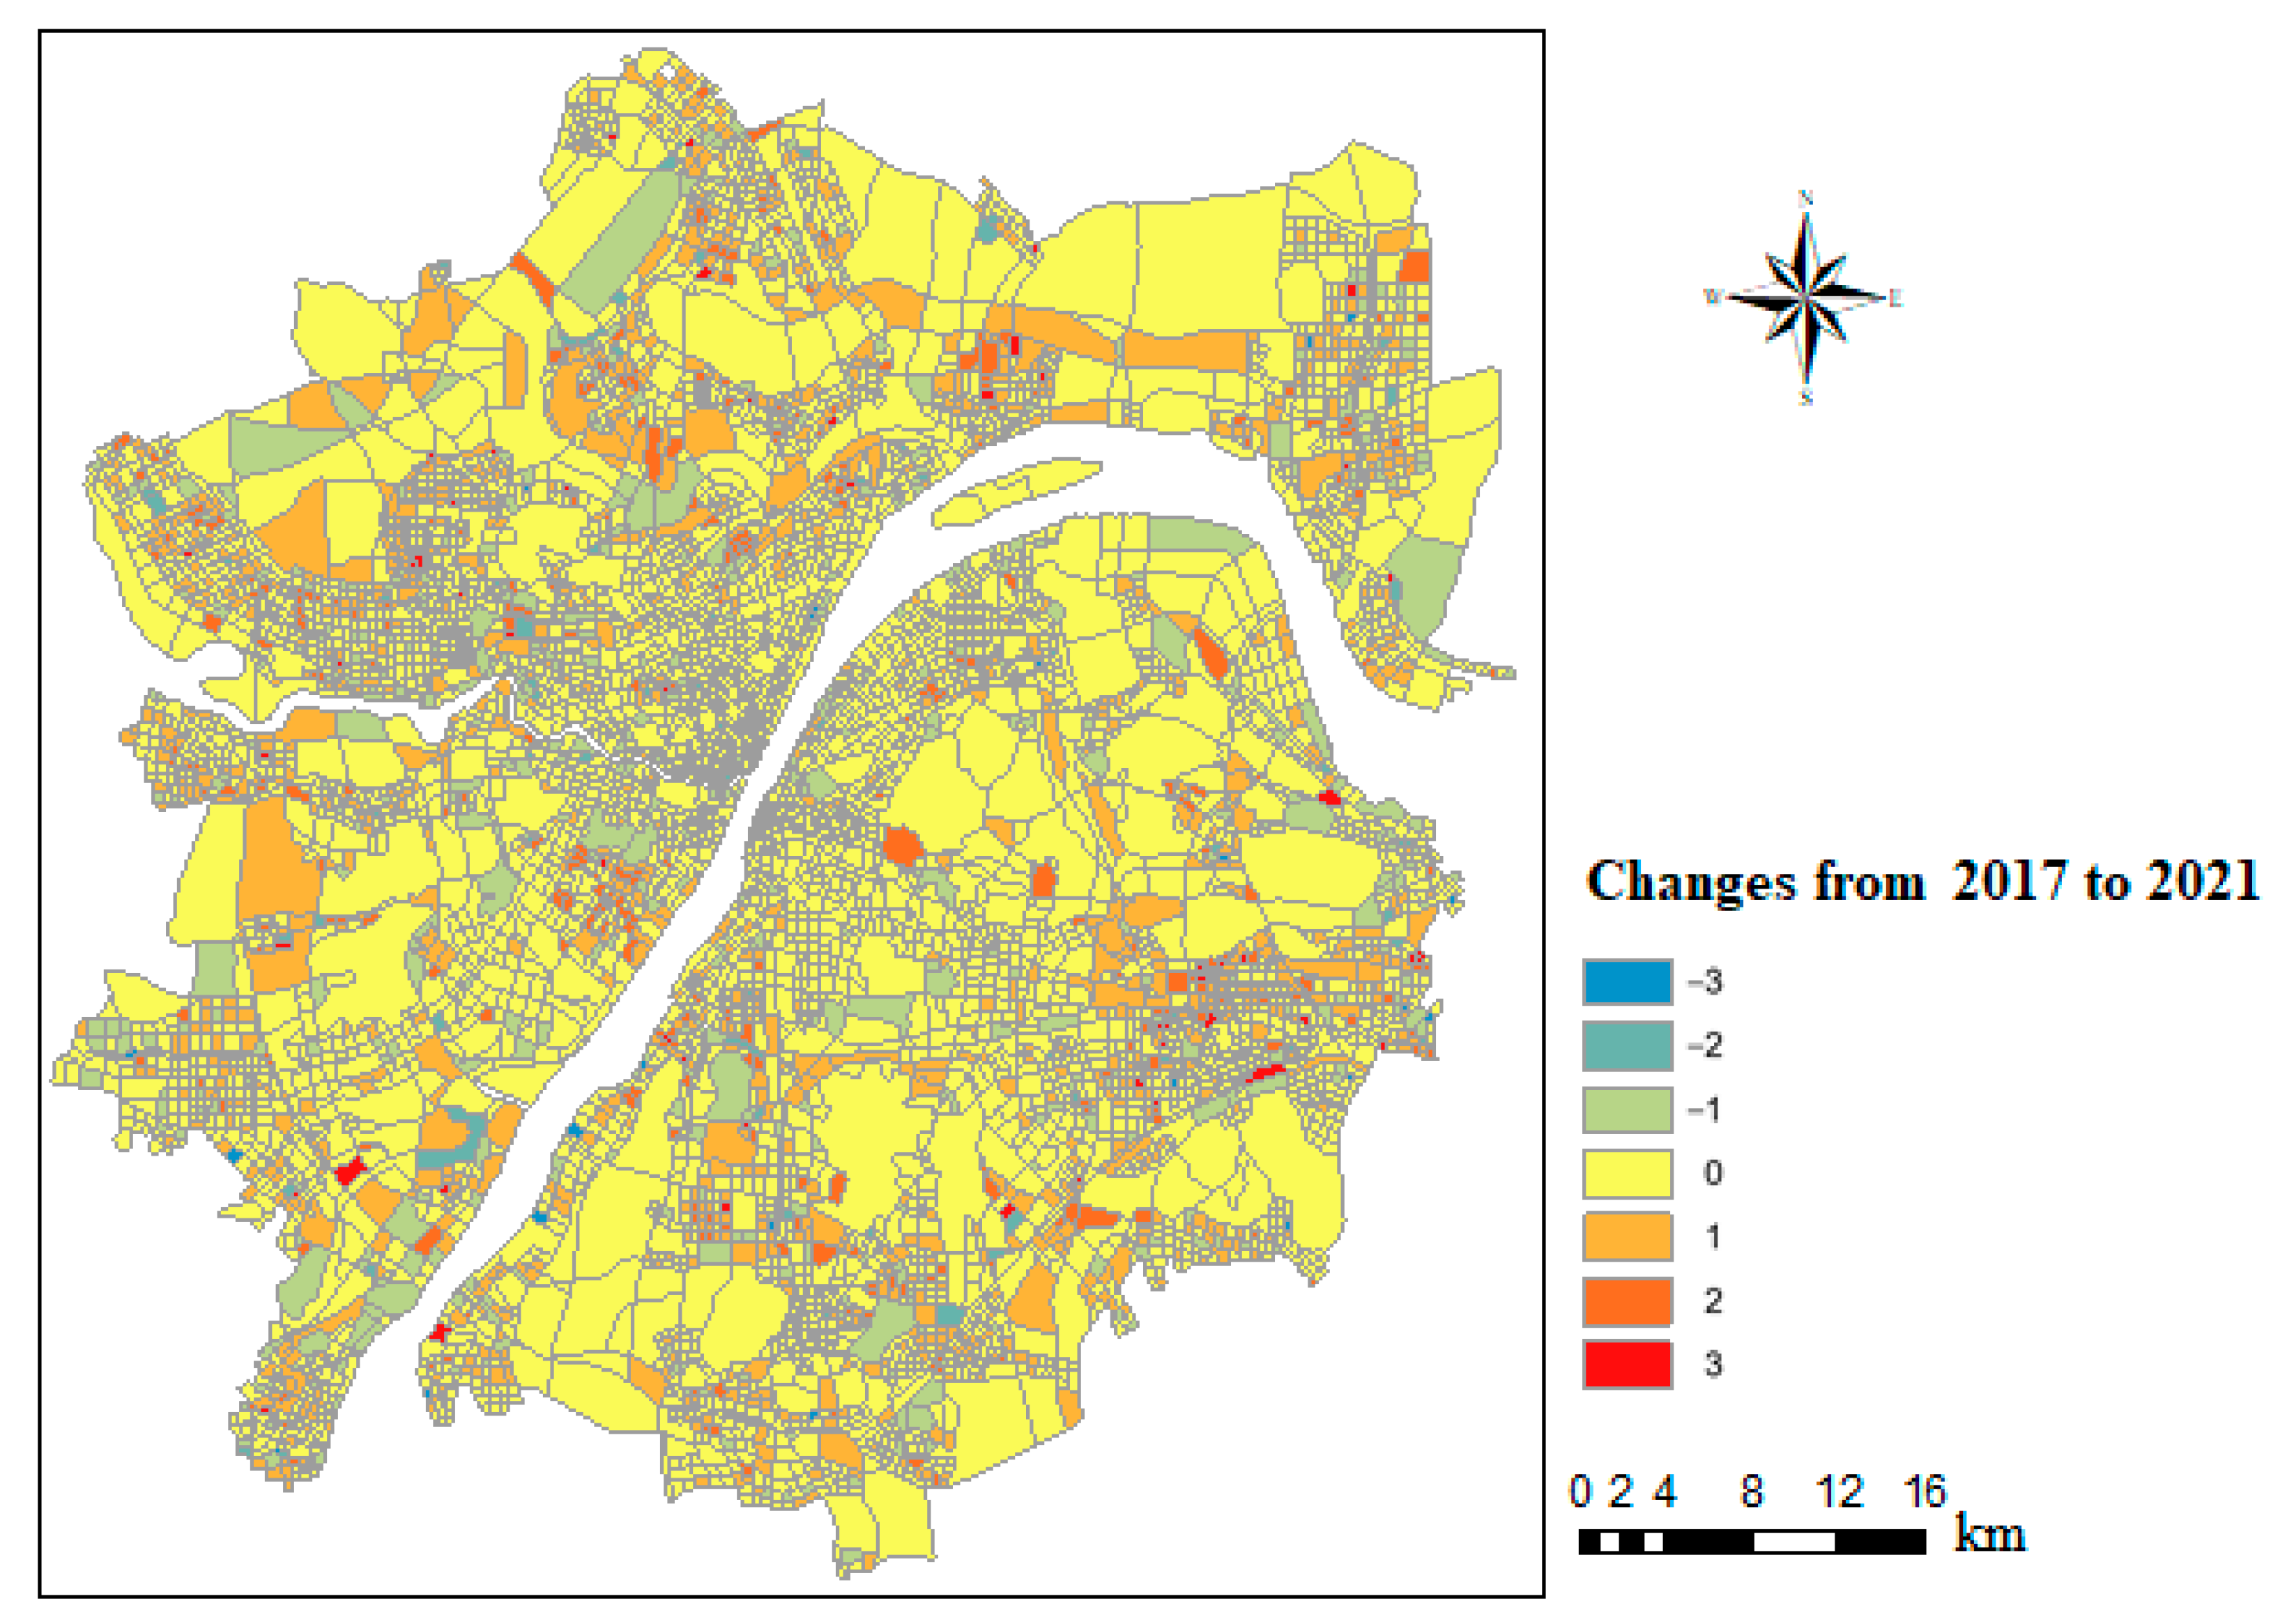
To quantify the change in urban development, values of three, two, and one were assigned to categories I, II, and III, respectively, representing the degree of urban element agglomeration in each TAZ. Furthermore, the undefined areas were assigned a value of zero. Higher values indicate a greater degree of regional development. These values were utilized to determine the change in urban element agglomeration over the five-year period by subtracting the values in 2017 from those in 2021.
Figure 8 displays the results, which reveal that areas of positive change (indicated by red to orange color) are mainly concentrated around the city. Negative change areas (indicated by blue to green color) are more widely distributed. The spatial distribution’s Global Moran’s I was 0.081, with a z-score of 45.911 and a
p-value of 0.000, indicating significant spatial autocorrelation in the change in urban element agglomeration.
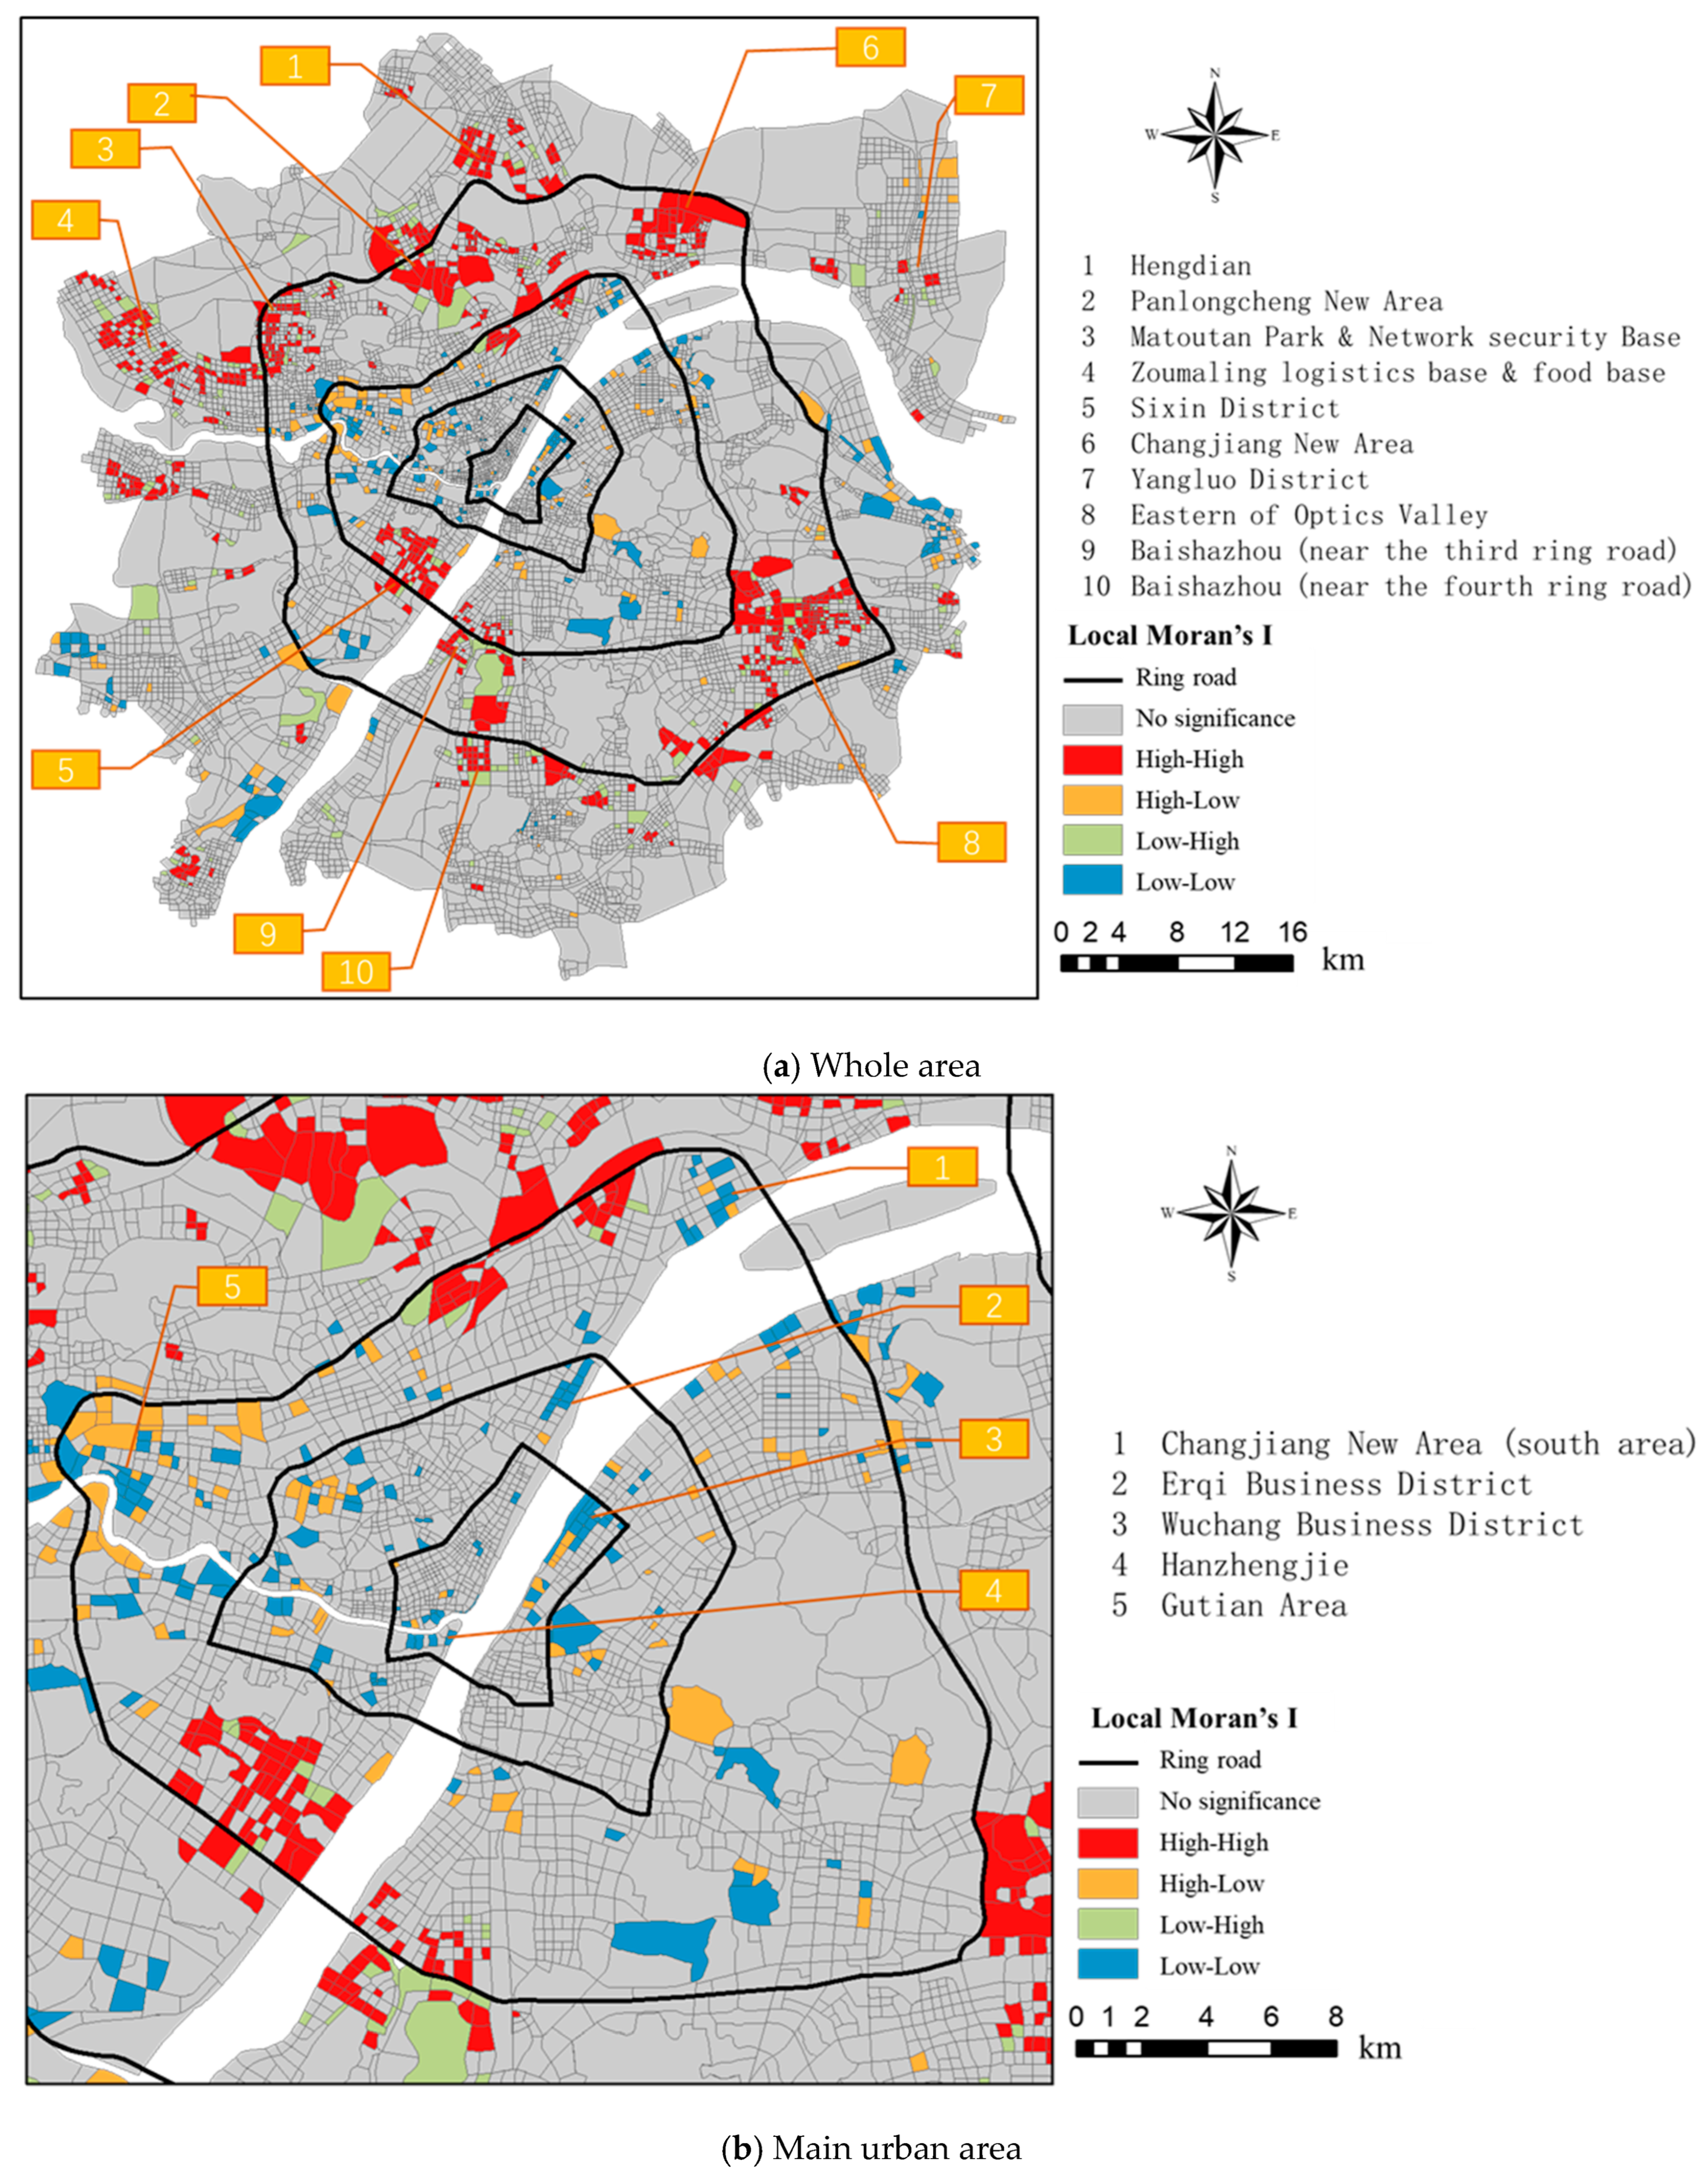
To further examine the urban development characteristics, the Local Moran’s I was calculated to evaluate changes in the degree of agglomeration. According to
Figure 9a, areas with positive values (high–high clustering) are primarily located in the peripheral regions. These areas align with, or are adjacent to, major functional groups outlined in government planning, such as Changjiang New Area (north area) and Sixin Area. This observation suggests that these regions have undergone more apparent changes in the agglomeration of urban elements due to urban planning directives. Consequently, several services and facilities in these regions have gradually improved. Conversely, negative changes have been identified in certain areas (low–low clustering) within the main urban area (
Figure 9b). These areas include Changjiang New Area (south area), Erqi Riverside District, Wuchang Riverside Business District, Hanzheng Street, and Gutian Area, among others. Most of these regions are currently undergoing urban regeneration, which includes a considerable amount of demolition and redevelopment projects. For instance, both the Erqi Riverside District and the Wuchang Riverside Business District are designated as significant planned core areas with a substantial quantity of urban renewal projects in progress. Hence, these regions show a decrease in the agglomeration of urban elements and a reduction in multiple services and facilities.
4.5. Validation of Typical Areas
To verify the validity of the previously identified degree of urban element agglomeration, an analysis of typical areas was carried out by integrating the regional remote sensing images with various types of POI ratios. Six regions, as illustrated in
Figure 9, were randomly chosen as typical samples for validation.
Table 3 displays the six selected regional samples, featuring three regions with increasing agglomeration (Changjiang New Area, Sixin District, and Guanggu East) and three with decreasing agglomeration (Erqi Riverside District, Hanzheng Street, and Gutian Area).
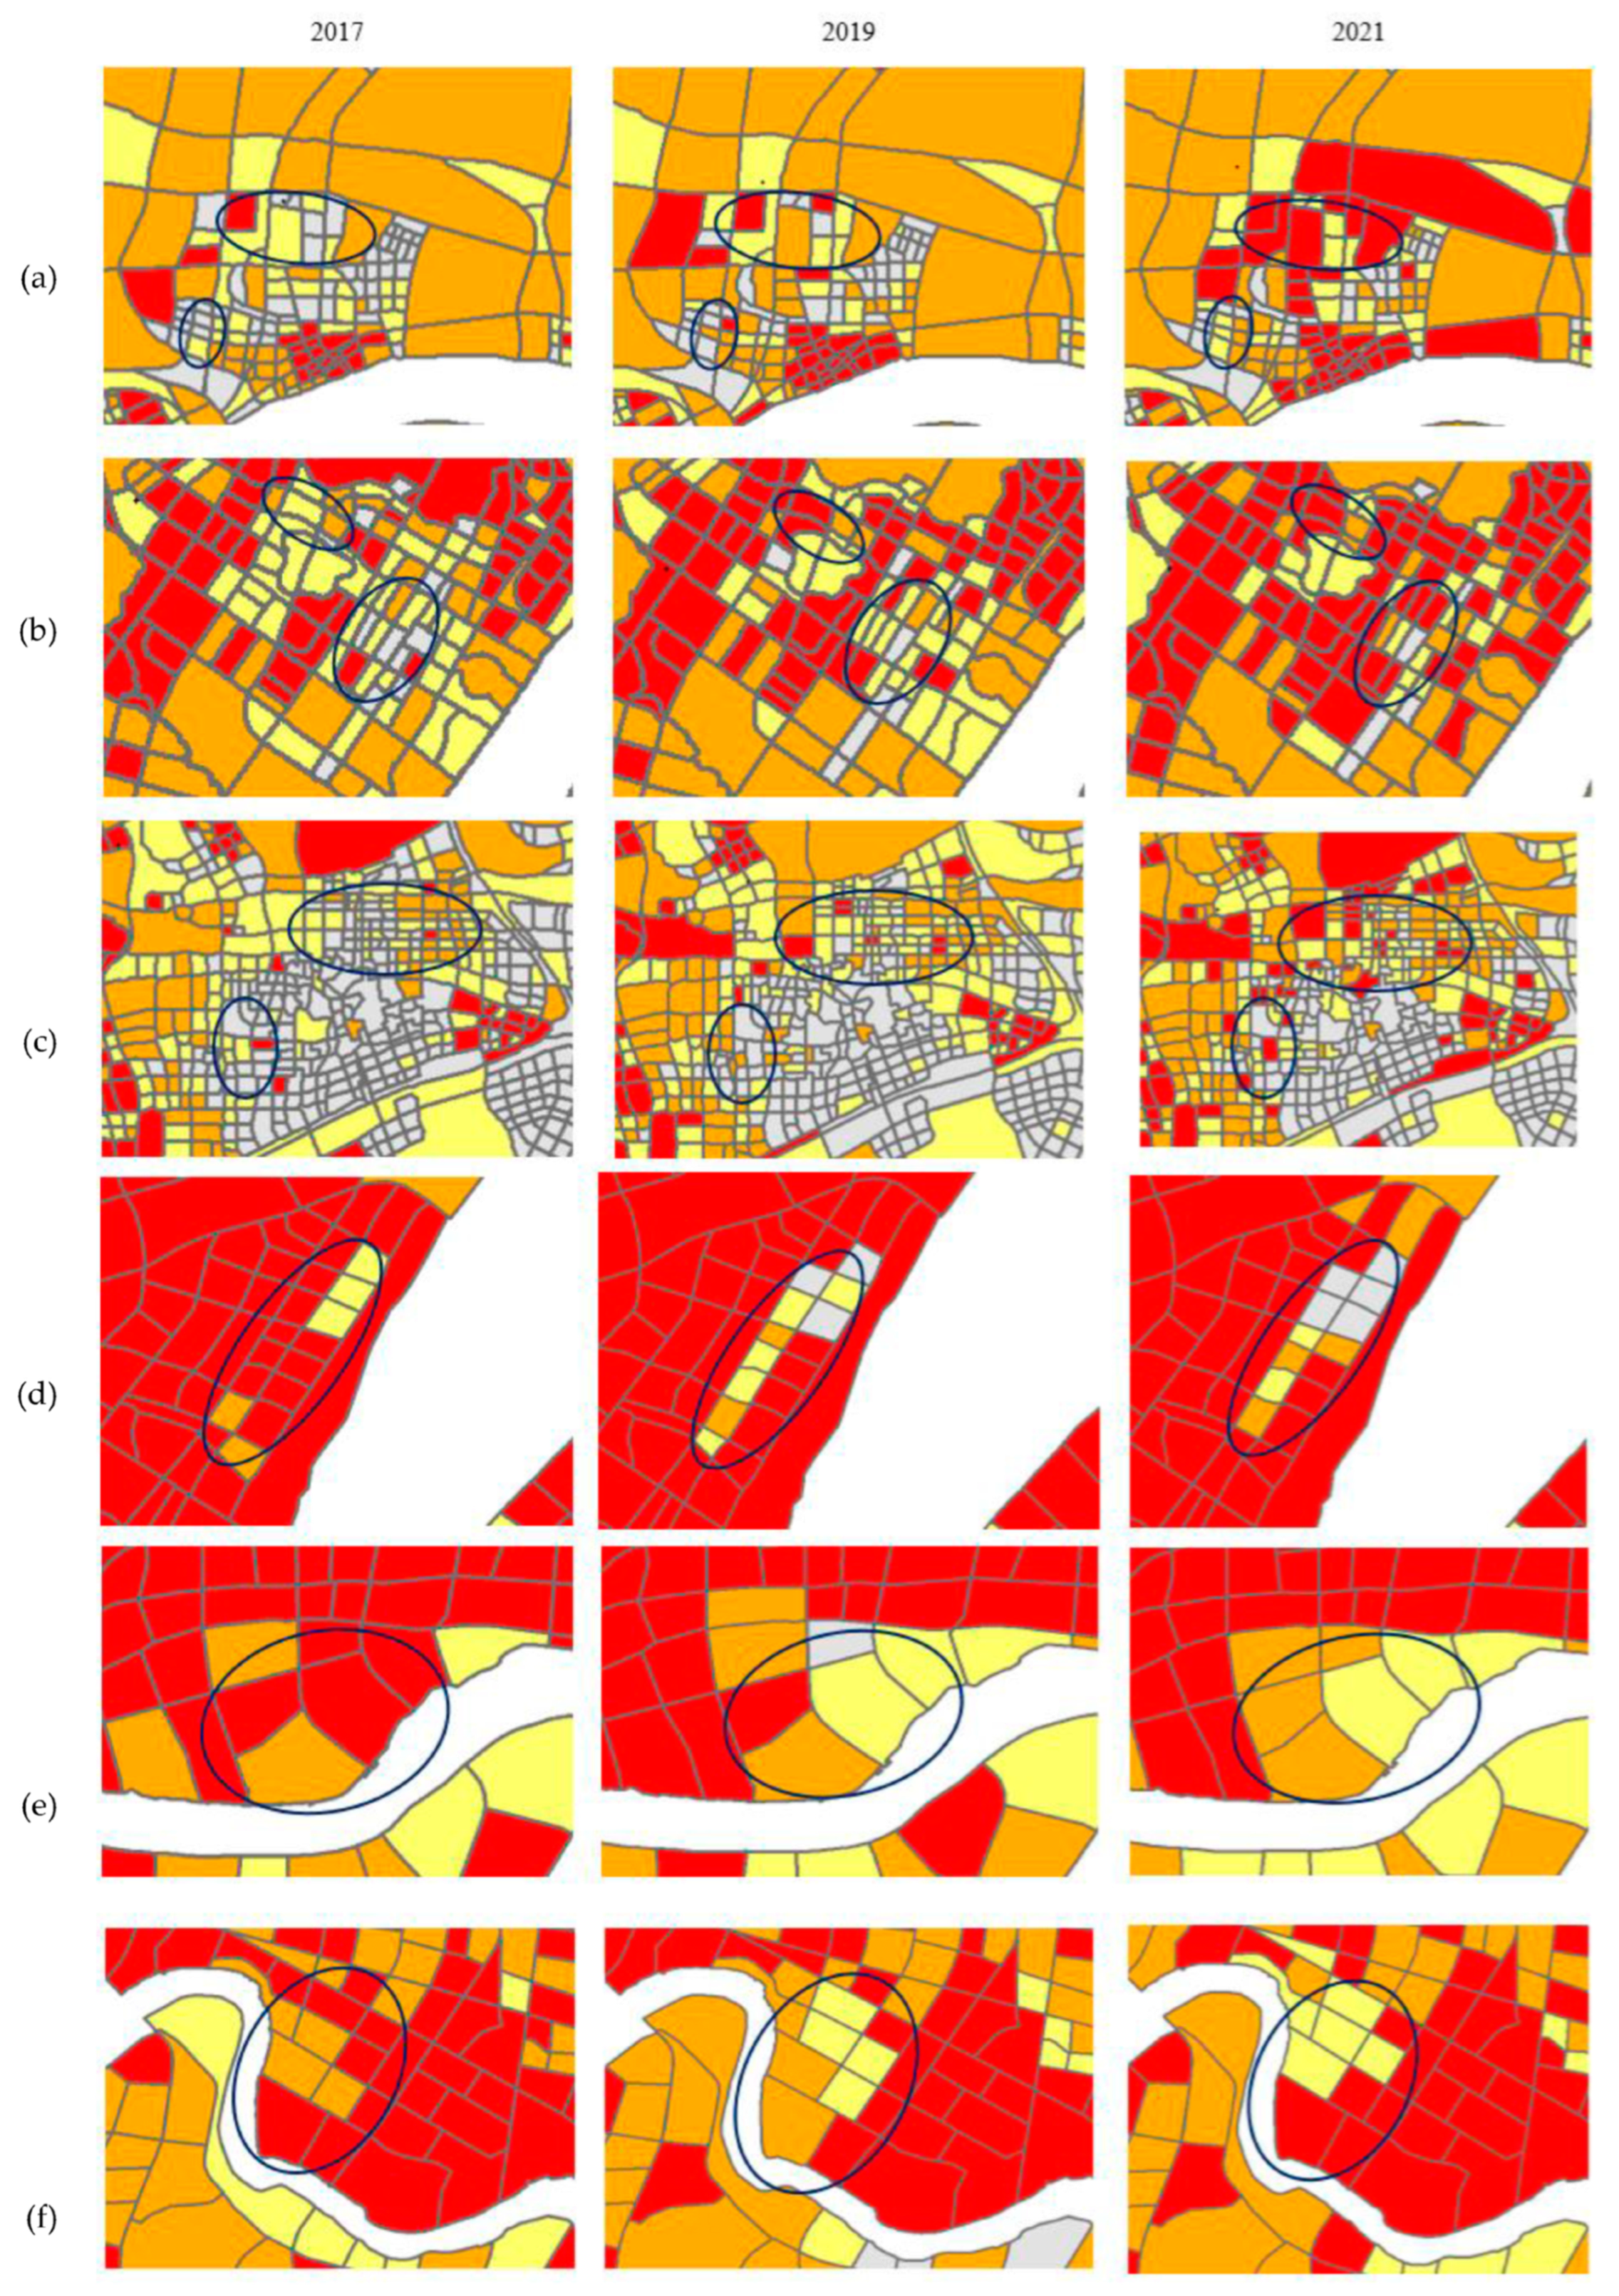
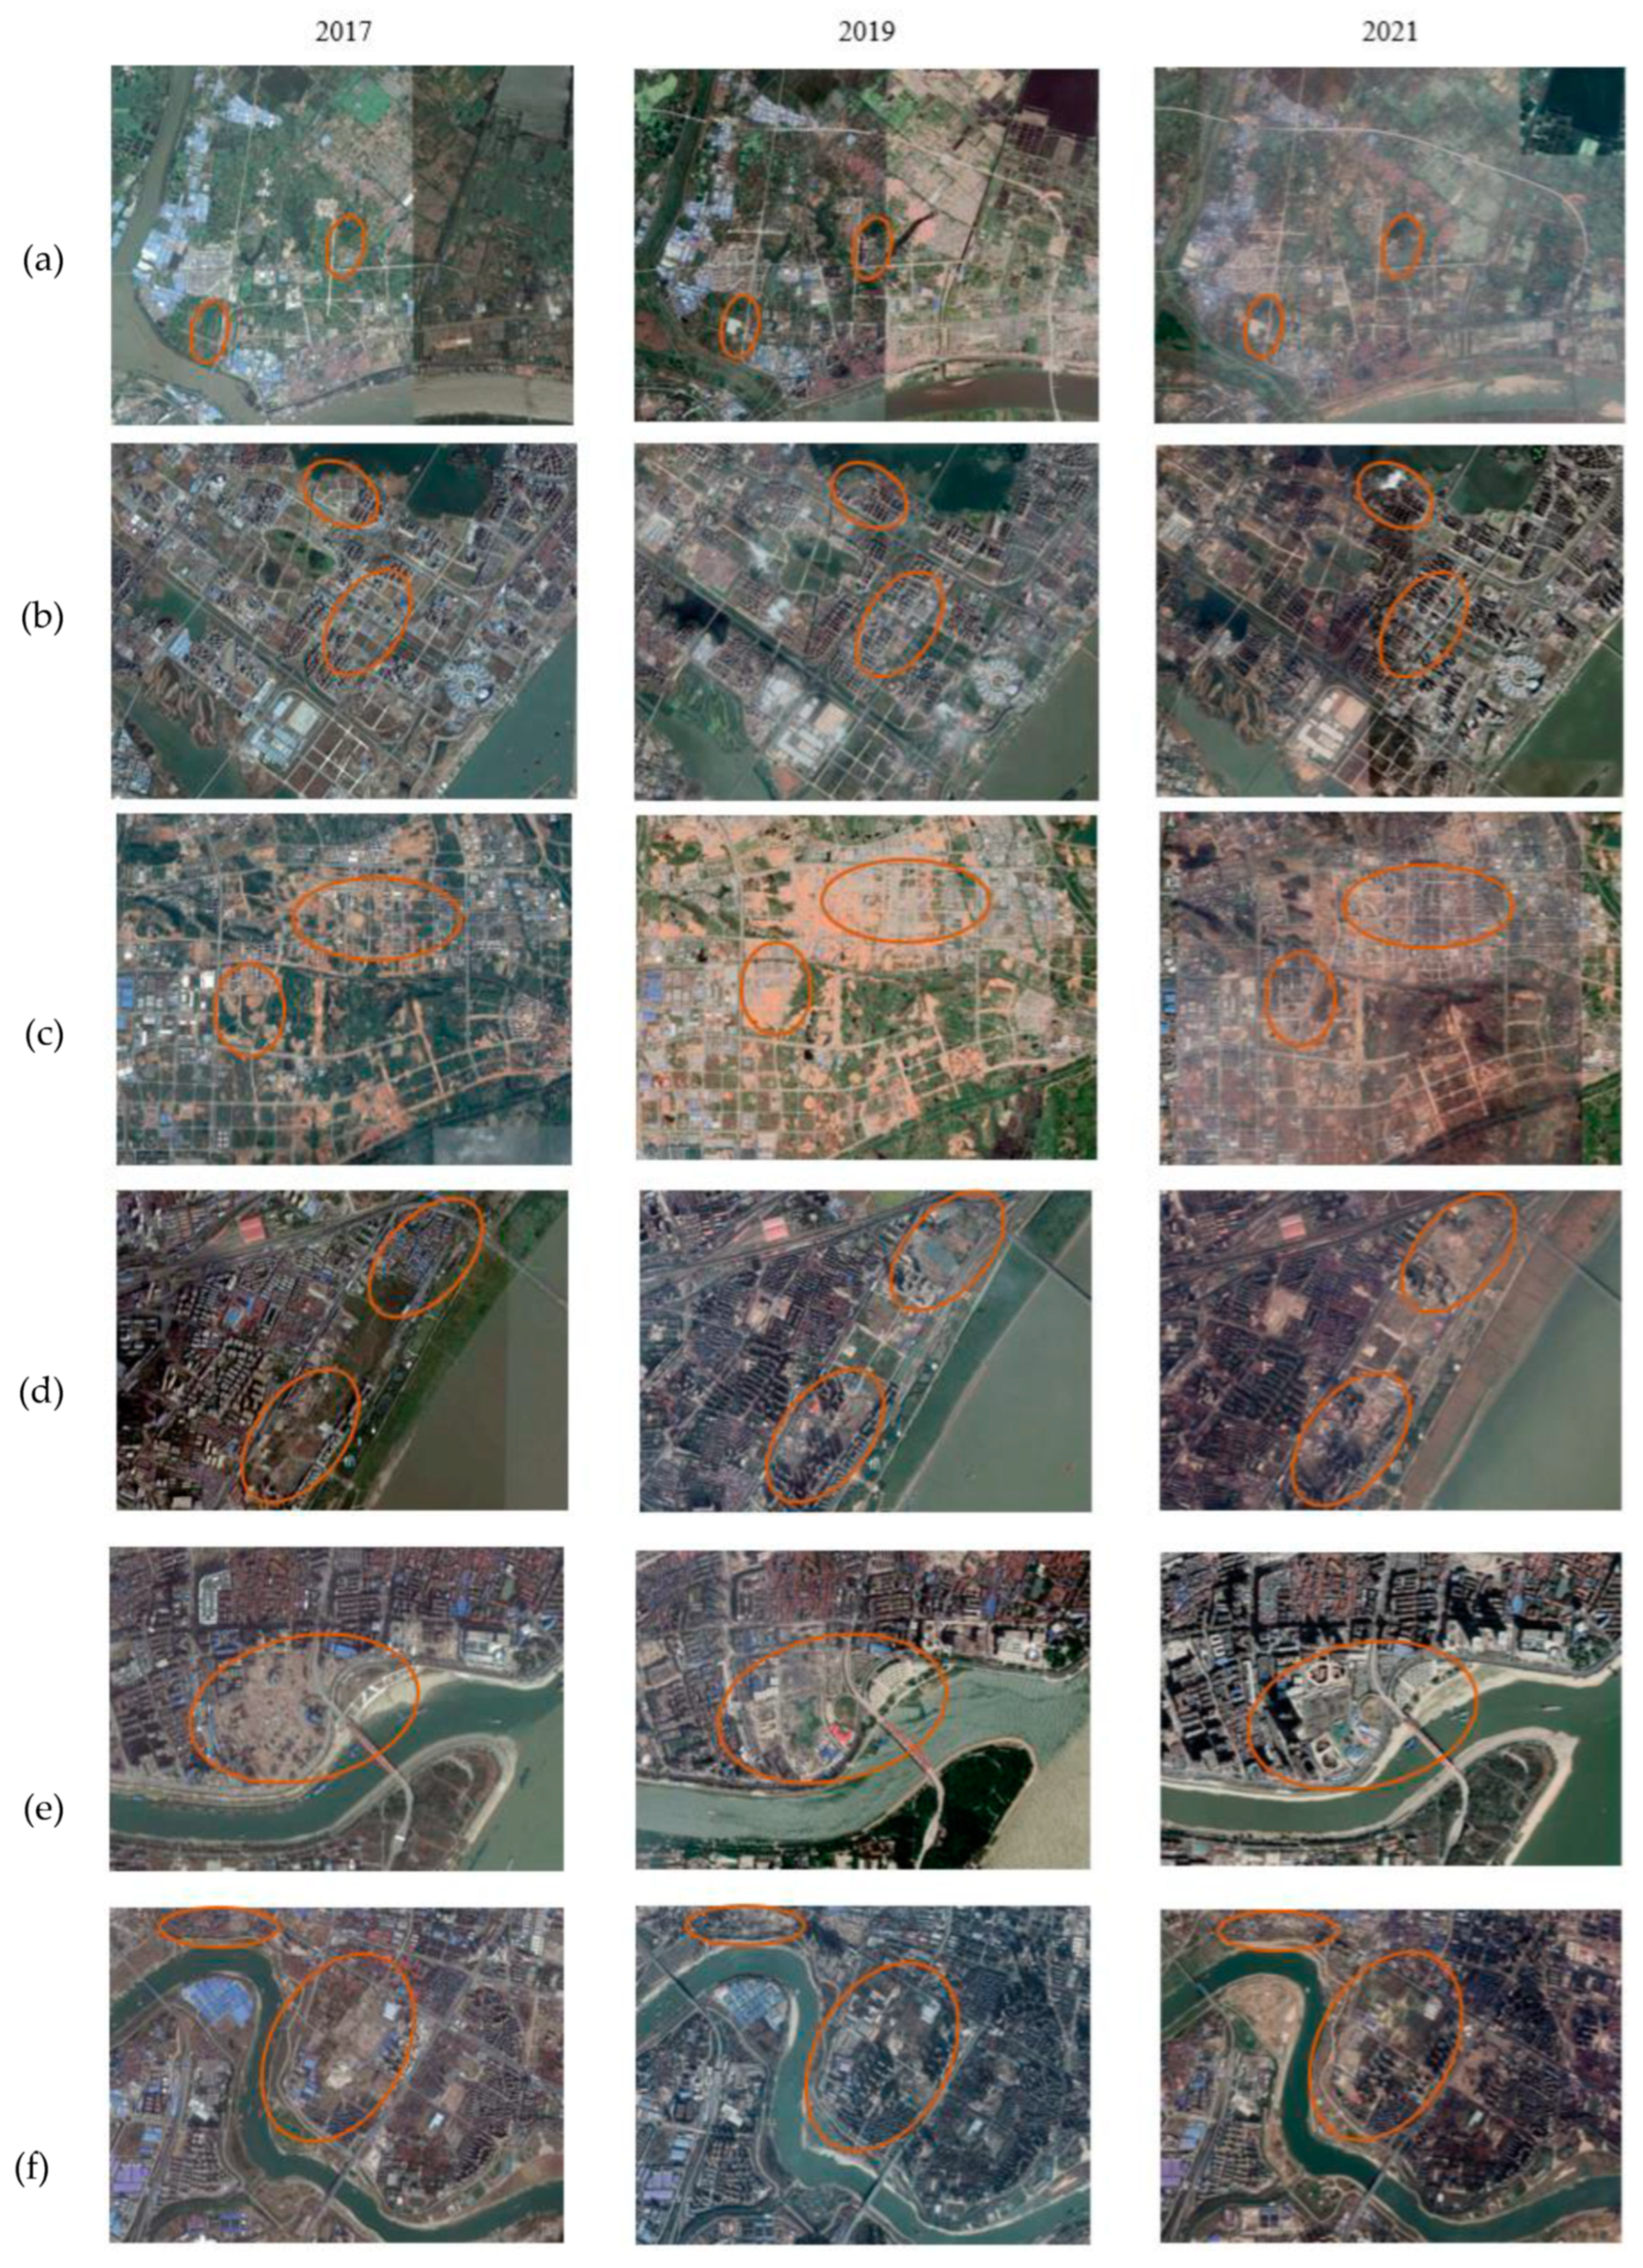
The spatial distribution of the agglomeration degree of urban elements and the remote sensing images for the six selected regions are shown in
Figure 10 and
Figure 11, respectively. Overall, the trend of the identification results is well in line with the observed changes in the built area as depicted in the remote sensing images. For example,
Figure 10c shows a significant increase in element agglomeration in Guanggu East during the study period. Newly constructed buildings, roads, etc., in the corresponding area can be observed in the remote sensing images in
Figure 11c. It is important to note, however, that while the remote sensing image can only capture the change in built land cover within a region, the identification process utilizing POI data not only makes it possible to interpret the varying degree of spatial element agglomeration, but also allows for a detailed analysis of specific changes in different types of facilities.
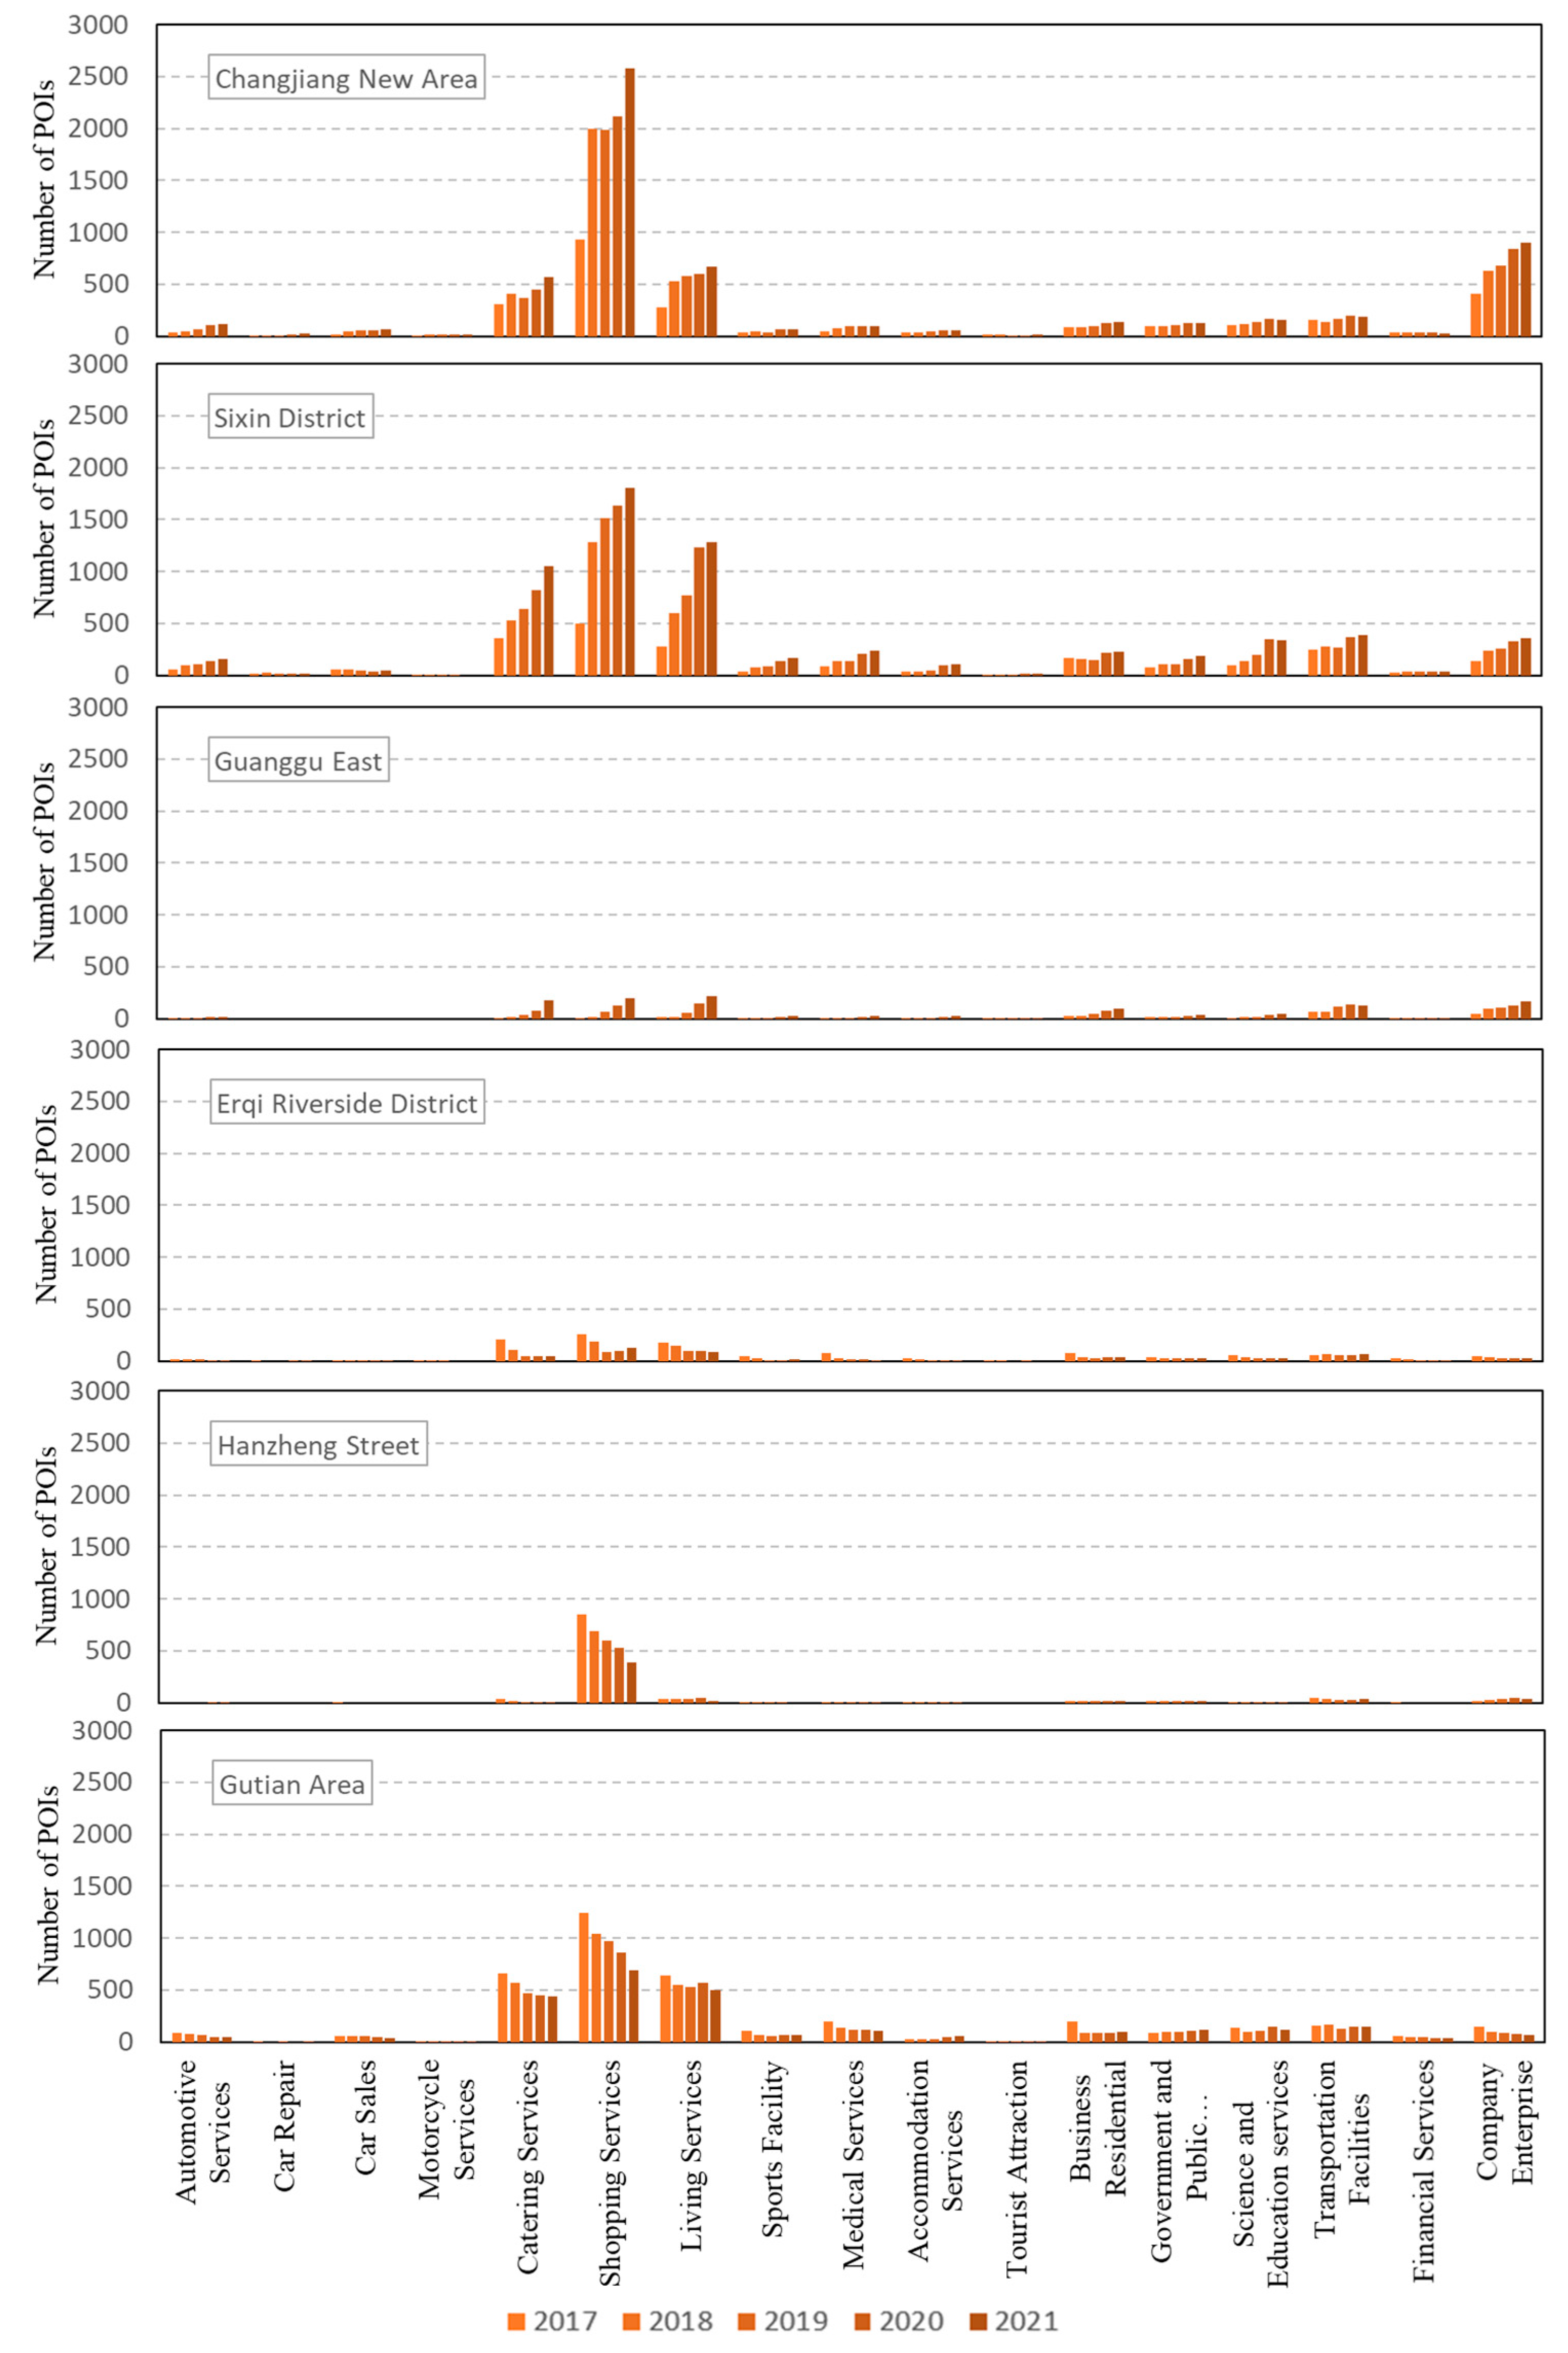
Figure 12 illustrates the alteration in the quantity of various POIs in the six selected regional samples during a span of five years. Changjiang New Area, Sixin Area, and Guanggu East, which form the primary regions of urban expansion, evince a definitive growth in the agglomeration of spatial elements. However, up until 2021, a significant number of TAZs in these three regions had no available data for POIs. Guanggu East stands out with the highest count of TAZs that lack POI data. This indicates that there is ample scope for urban element concentration increase and the expansion of construction land in the future. Changjiang New Area and Sixin District exhibit comparable trends in the proportion of various POI types. Specifically, the pace of growth was greater from 2017 to 2018, before slowing down from 2018 to 2021. Guanggu East exhibits a greater proportion of POIs in the categories of transportation facilities and company enterprise, in comparison to Changjiang New Area and Sixin Area. The growth of POIs in these categories displayed a slower rate from 2017 to 2018; however, the growth accelerated from 2018 to 2021.
In contrast, Erqi Riverside District, Hanzheng Street, and Gutian Area, located in the primary urban area, have a medium to high agglomeration of spatial elements. Moreover, these areas are presently enduring urban reconstruction on the available construction land, with a resultant drop in the agglomeration of spatial elements aspects from 2017 to 2021. During this period, catering services, shopping services, sports services, and financial services showed a decrease followed by an increase, while the number of all other categories of POIs gradually decreased in Erqi Riverside Area. In the Hanzheng Street area, shopping services, living services, and companies dominated, with shopping services displaying a gradual decrease and living services and companies exhibiting a slow increase. Conversely, the number of government agencies, scientific and educational institutions, and transportation facilities in Gutian Area remained stable, with all other types of POIs exhibiting a gradual decline.
5. Discussion
In this paper, POI data were taken as the urban elements, and the Block2vec model was employed to extract the spatial characteristics of POI data within TAZs. K-Means clustering was then applied to classify different levels of spatial agglomeration types. Finally, the temporal–spatial evolution of TAZs classified under different agglomeration types was analyzed.
5.1. Spatial Agglomeration Identification Based on the Block2vec Model
The location of urban elements is a result of bottom-up location choices and top-down city-level influences for each place [
49]. Spatial interaction between these different elements plays a crucial role in facilitating agglomeration and dispersion. Previous studies mainly used POI data and density-based methods, such as SDE, Ripley’s K, and KDE, to explore the characteristics of spatial distribution and the degree of urban element agglomeration, paying more attention to the volume of elements but neglecting their spatial interaction. In this study, an NLP-based model, called the Block2Vec model, was adopted to examine the agglomeration characteristics of urban elements. Compared to traditional density-based methods, the proposed method could capture more comprehensive geographic information as it incorporates both the density and the spatial interaction between urban elements. The research results show that the Block2Vec model could objectively and comprehensively describe the agglomeration characteristics of urban elements in Wuhan city, which allows us to understand the urban development process.
5.2. The Comparison of Element Spatial Agglomeration and Urban Planning
The spatial agglomeration of urban elements is a significant aspect of the urbanization process, and effective urban planning is essential in local urban development as a guidance tool. Identifying the spatial agglomeration of urban elements enables us to analyze the various element agglomeration situations within the urbanization process and determine whether local planning decisions have played an appropriate guiding role. This study revealed that the spatial agglomeration of urban elements in Wuhan is not a straightforward circular structure but instead tends towards a decentralized distribution pattern of spatial agglomeration, spreading out on a large scale across the city as a whole and regrouping at specific nodes. The general distribution identified aligns with the 14th Five-Year Plan, which aimed to promote Wuhan’s multi-centered, networked, and clustered development [
46]. This implies that the urban planning decisions made in Wuhan have been an important external impetus driving the urbanization process. Such external drivers have also been identified in other urban development processes [
50]. Additionally, the decentralized distribution pattern’s outcomes could assist the government in comprehending the city’s intricate spatial structure, enabling more robust decisions to be made for areas with different agglomerations of urban elements.
5.3. Policy Implications
The spatial agglomeration of urban elements in Wuhan has formed a distribution pattern of “multi-centered, networked and clustered development”. Based on the changing trends of spatial agglomeration identified in this study, it is particularly important to optimize urban development strategies to further improve the high-quality and sustainable development of cities.
(1) Following the principle of coordinated regional development, the organic integration and development of new and old urban areas should be promoted from the top level of planning. The coordination of functions between different areas at the urban scale should be fully considered, and a shift in developmental thinking should be accelerated to formulate a polycentric development strategy that is more adaptable to decentralized development, rather than simply considering peripheral areas as functional complements to the inner core areas.
(2) The appropriate strategy should be chosen to address the gaps according to the levels of development of the different expanding urban areas. For mature areas with peripheral expansion, targeted complements should be made to the elements that are more lacking in them, in order to increase the level of diversified agglomeration in peripheral areas, thus reducing the negative effects caused by the singularity of the elements’ functions.
(3) The renewal of the old urban area takes into account the distribution of facilities in the neighborhood in order to improve the functions of the old urban area. While promoting urban renewal, due consideration should be given to the impact of urban renewal projects on the agglomeration of different types of elements in the neighboring areas, so as to promote the organic renewal of old urban areas.
5.4. Limitations and Future Work
Geospatial big data offer a reliable and accessible resource for empirical research on urban element agglomeration and urban structure. This leads to the provision of more informative suggestions for urban policymaking and management through high precision and full coverage. The framework presented in this study can also be applied to other cities with different levels of development in order to examine their agglomeration of urban elements or their evolutionary characteristics. Meanwhile, some limitations should also be noted. The analysis was based on POI data from 2017 to 2021, which covers a relatively short time period, while urban expansion and renewal have undergone more significant changes over a longer time horizon. Therefore, further studies may assess the long-term and comprehensive changes in urban expansion by acquiring data over a larger span. Further information from additional data sources, including remote sensing and street view imagery, would improve our ability to achieve greater precision on this matter.
6. Conclusions
In this study, an assessment process framework of urban element agglomeration was proposed by incorporating the volume of spatial elements and their spatial interaction. Moreover, the changing trends in spatial agglomeration were explored by using a five-year period of POI data.
Overall, the amount of spatial element agglomeration showed a clear upward trend between 2017 and 2021, with a significant increase in the number of high agglomerations and a slight increase in the number of medium and low agglomerations. Among them, the areas where element agglomeration increased significantly are mainly located in the periphery of the city, and there was a phenomenon of decreasing element agglomeration in some areas within the city. In the future, different strategies should be considered for regions with diverse levels of urban element agglomeration to improve urban development sustainability.


 ,
, 


