1. Introduction
The human settlement environment is a space that is closely related to human production and life, and it is also a surface space that is inseparable from human activities [
1]. It represents the cornerstone of urban sustainable development and profoundly manifests a city’s overall competitive prowess. This environment is not only intrinsically linked to the sustainability of residential conditions and ecology but also serves as a crucial barometer for the sustainable development of urban economics and social fabric [
2]. In this context, many social conflicts emerging within cities often originate from the differences in how various social groups understand and evaluate their quality of life and environmental conditions. The root of these conflicts lies in the inequity of social resource distribution and unequal living conditions. The interaction between these two aspects exacerbates the severity of social contradictions and conflicts.
The subject of human settlements was first established in 1975 by the “Man and the Biosphere Program” sponsored by the United Nations [
3]. Over time, the indicators for the evaluation of human settlements have been constantly updated and improved, but until now there has been no completely objective and clear system for the evaluation of human settlements [
4]. Zhu et al., in their study of the living environment of Fuzhou city, constructed an evaluation system consisting of four primary indicators: environmental comfort, transportation convenience, urban security, and residential convenience [
5]. Based on this, combining local people’s experience and objective data, this study further proposed a human settlement environment evaluation system composed of five primary indicators, including living environment, residential environment, entertainment places, transportation convenience, and safety. This indicator system can gather a large amount of data in practical operations, meaning a new city living environment evaluation system has been formed. In the current prevalence and development of big data, this study uses this tool for the evaluation and analysis of urban development and its sustainable development approach [
6]. The power of big data enables an objective depiction and comparison of the development trends and future potential of different cities. However, as big data matures [
7], the traditional statistical data and questionnaire surveys are inadequate in providing a comprehensive and accurate data analysis [
8].
Although the results and calculations of big data analysis seem more scientific, an overreliance on objective data processing and computation may not accurately reflect the living environment, as these methods may be influenced by the inherent limitations of the dataset itself. Taking the current human settlement environment analysis as an example, many analyses tend to be either overly qualitative or overly quantitative. In a comprehensive study conducted by Wang et al. focusing on residential environment satisfaction in the rural areas of northwestern China, an intricate methodology was implemented to gauge individuals’ contentment with their living conditions. By leveraging preliminary research data, an evaluative framework encompassing both tangible and intangible environmental facets was constructed.
The Analytic Hierarchy Process (AHP) was judiciously employed to delineate the criteria and associated weightings. Specifically examining Yanchi County in Ningxia, which has witnessed a significant transition from impoverishment to marked developmental strides, the study incorporated an exhaustive field investigation. This analysis encapsulated an array of villages, inclusive of those that have undergone residential environmental reformation and those devoid of such interventions. Subsequently, the satisfaction levels of the agrarian populace were meticulously quantified using a five-tiered Likert scale [
9]. Xie et al. adopted an utterly objective approach to explore the residential environment of Beijing. The study systematically embraced three core techniques to comprehensively evaluate the residential environmental quality in Beijing.
Firstly, the entropy method introduced a mechanism to enhance objectivity and reduce both subjective biases and randomness, specifically for allocating weights to various evaluation indicators. Using this method, the data were meticulously standardized, and corresponding entropy values were computed, subsequently determining weights for the overall environmental quality assessment indicators. Secondly, spatial correlation analysis refined the exploration of the spatial distribution patterns of environmental quality. Within this, global spatial auto-correlation specifically assessed the general spatial distribution characteristics, while local spatial auto-correlation provided an in-depth interpretation of regional spatial patterns. Lastly, the panel data model offered a precise quantitative analysis of environmental determinants, meticulously categorizing the impact levels of various factors within Beijing’s residential environment [
10]. Both extremes, in certain aspects, can overlook the reliability of data and the actual feelings and needs of residents, leading to a one-sided interpretation of the living environment.
To accurately depict and compare different living environments, this study collected a large amount of data and compared and analyzed China’s traditional first-tier cities and new first-tier cities. The study particularly focuses on the impact of geographical location on urban development and living environments, as well as the development potential of each city. The choice of Beijing and Xi’an as representative subjects in this study originates from their symbolic status as first-tier cities in northern and central China, respectively, both deeply marked by rich historical traces. Beijing, as China’s capital and a traditional first-tier city, possesses abundant developmental resources and advantages. Its unique position as an international metropolis with an enduring historical background and broad cultural influence allow it to serve an extremely crucial role in the study of the development trends of China’s first-tier cities. On the other hand, Xi’an is a rising first-tier city in China, representing a new peak in China’s inland economic development and rapid societal transformations. Studying these two cities enables us to better explore and understand the differences between China’s traditional first-tier cities and emerging first-tier cities.
After an analysis of a large amount of data, this study, based on previous researches [
11], constructed a new indicator system for human settlement environments, comparing the differences between traditional first-tier cities and new first-tier cities with similar cultural backgrounds. The study also conducted a hotspot analysis, investigating the problems of low-quality aggregation areas and the reasons for their formation. Based on these analyses, this research proposes a series of recommendations related to TOD on how to improve future living environments and promote sustainable development [
12].
The research aims to understand the differences in living environments by comparing and analyzing first-tier cities and new first-tier cities, and provide insights for urban planning, social policy-making, and resource distribution. In the future, the research also hopes to further explore how to enhance the sustainability of cities by improving living environments, thereby promoting comprehensive social and economic development.
The contributions of this study include:
- (1)
In the current landscape of habitat environment assessments, there is an evident dearth of research based on the comparative study of residential environments between two cities. Most existing studies primarily focus on in-depth analyses of a single city and the formulation of strategies for its future sustainable development.
- (2)
In current evaluations of living environments, studies based on both subjective and objective analyses are relatively scarce. Most research relies solely on data for entirely objective categorization. This study incorporates the subjective perspectives of long-term residents in both cities.
- (3)
This study proposes a development plan for low-quality residential environment clusters based on the transit-oriented development (TOD) strategy. In the current field of living environment evaluation, development proposals based on the TOD strategy are notably lacking.
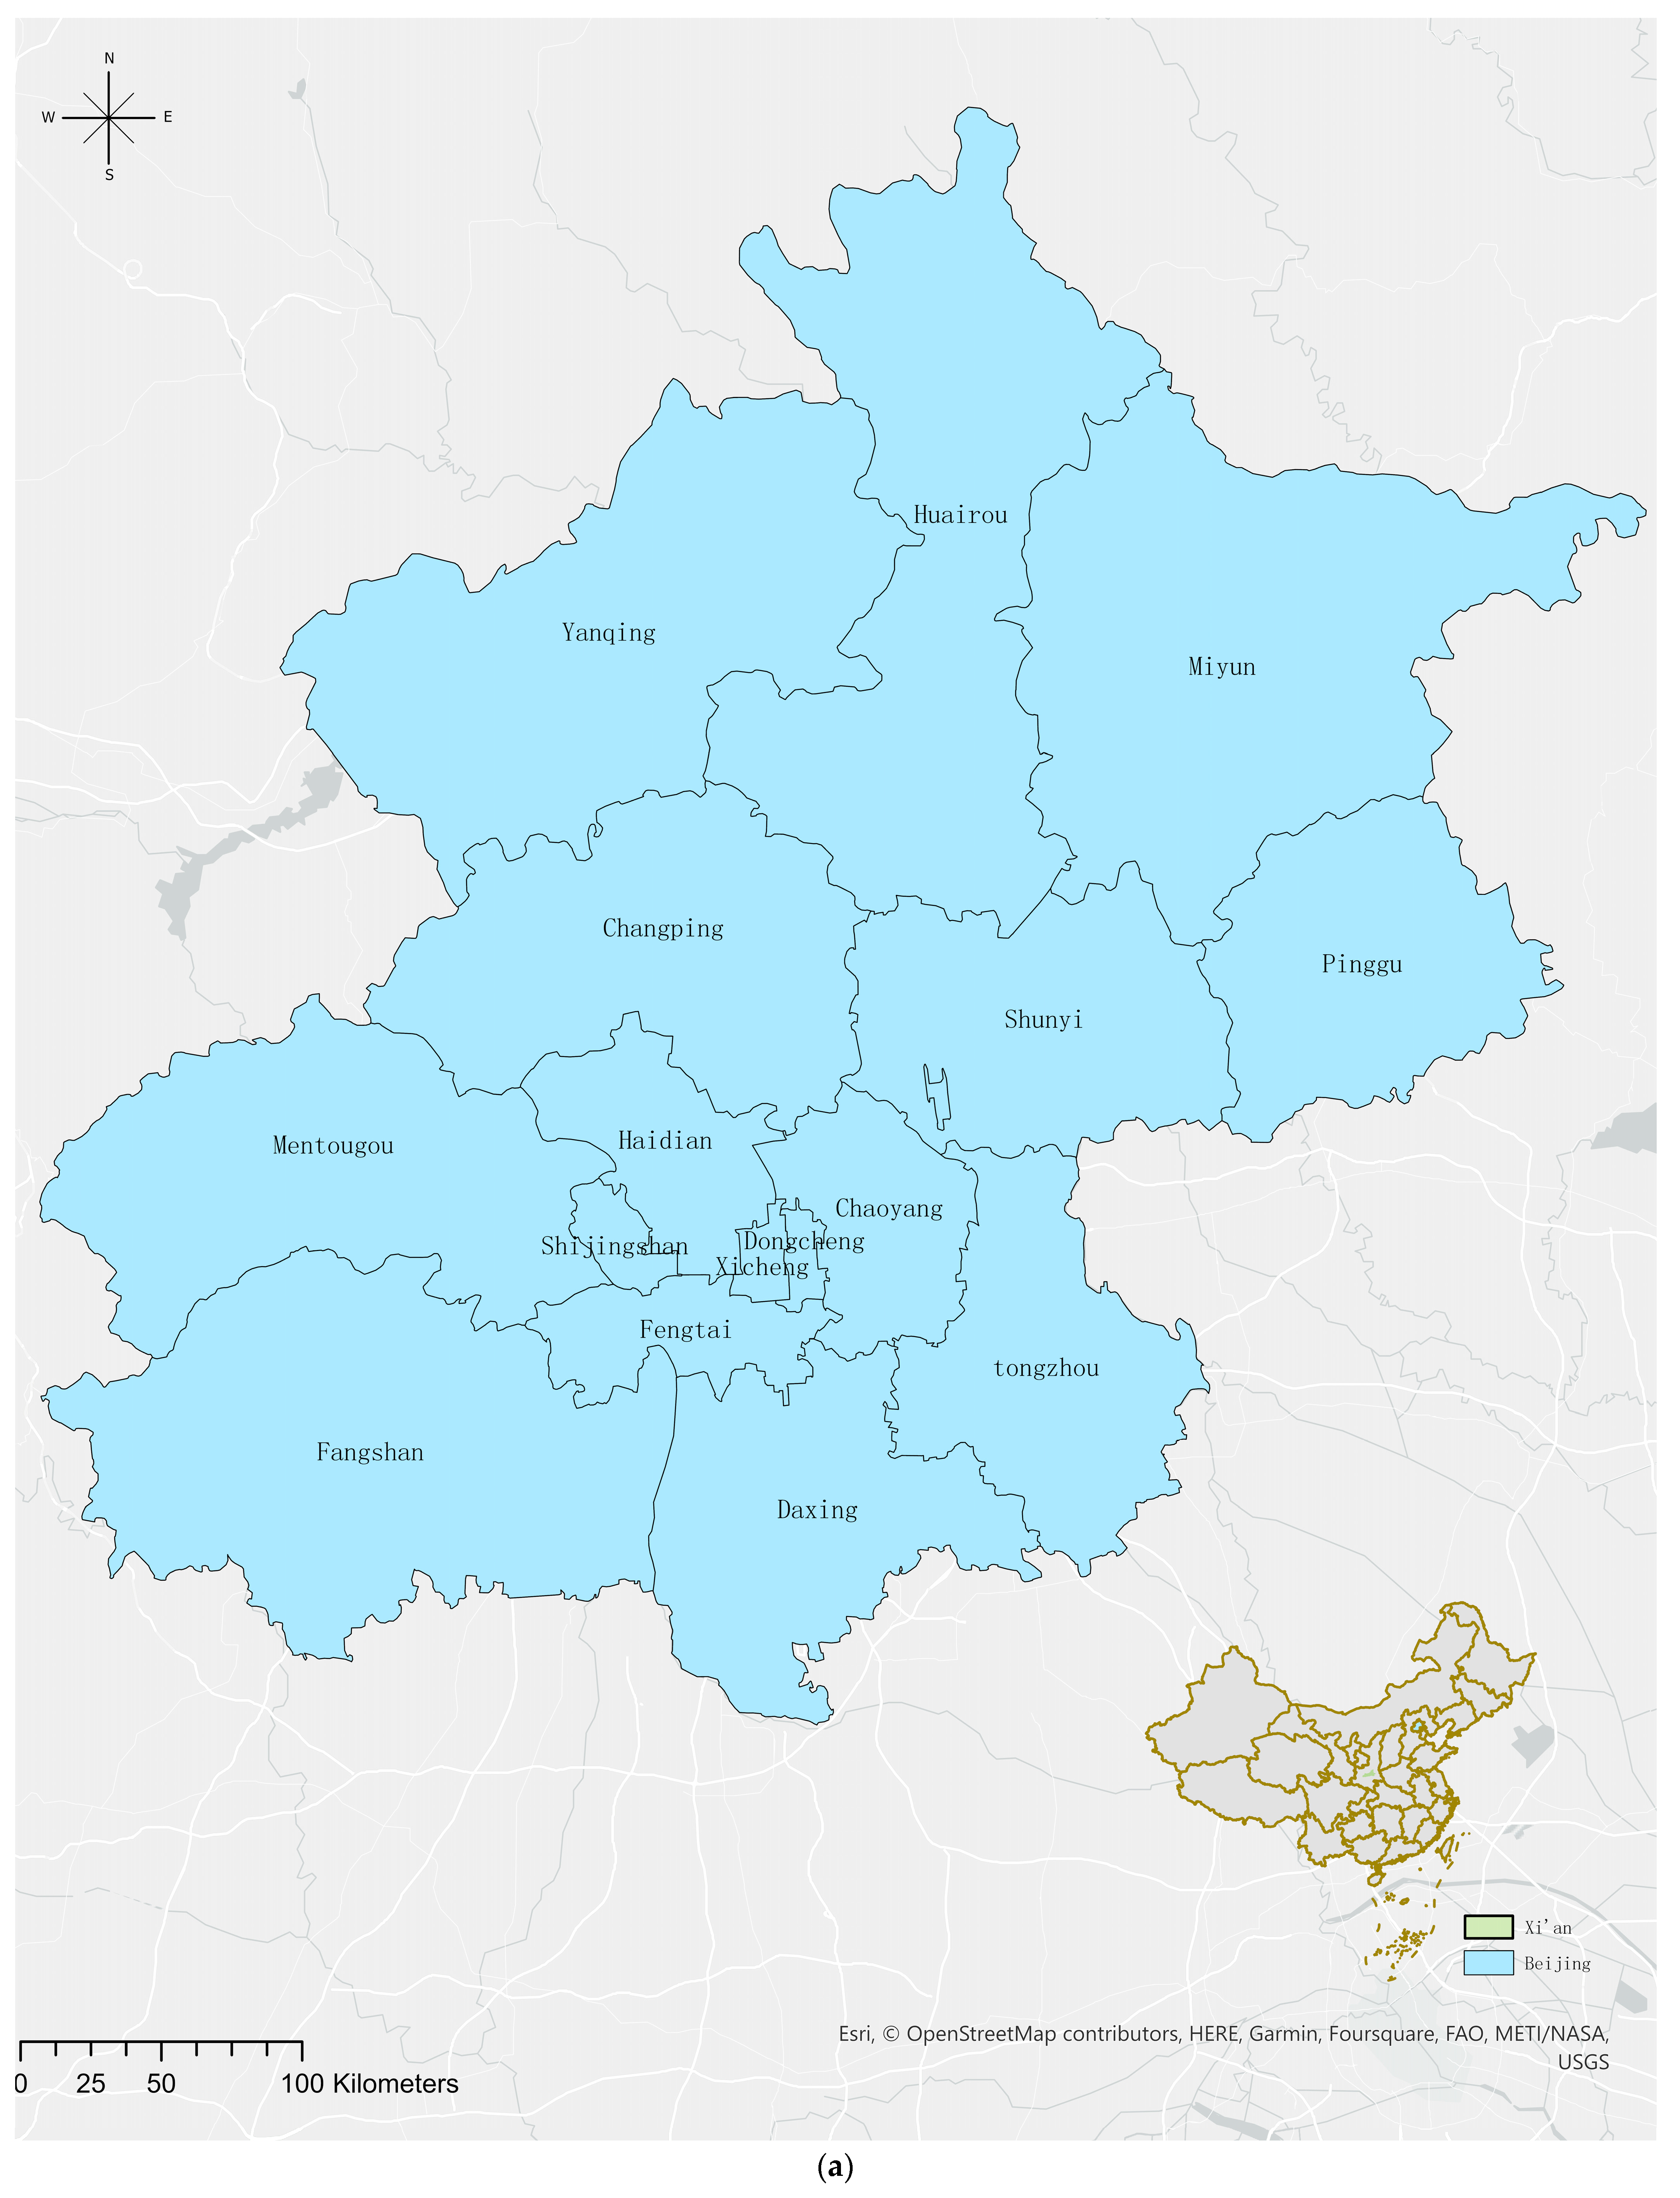
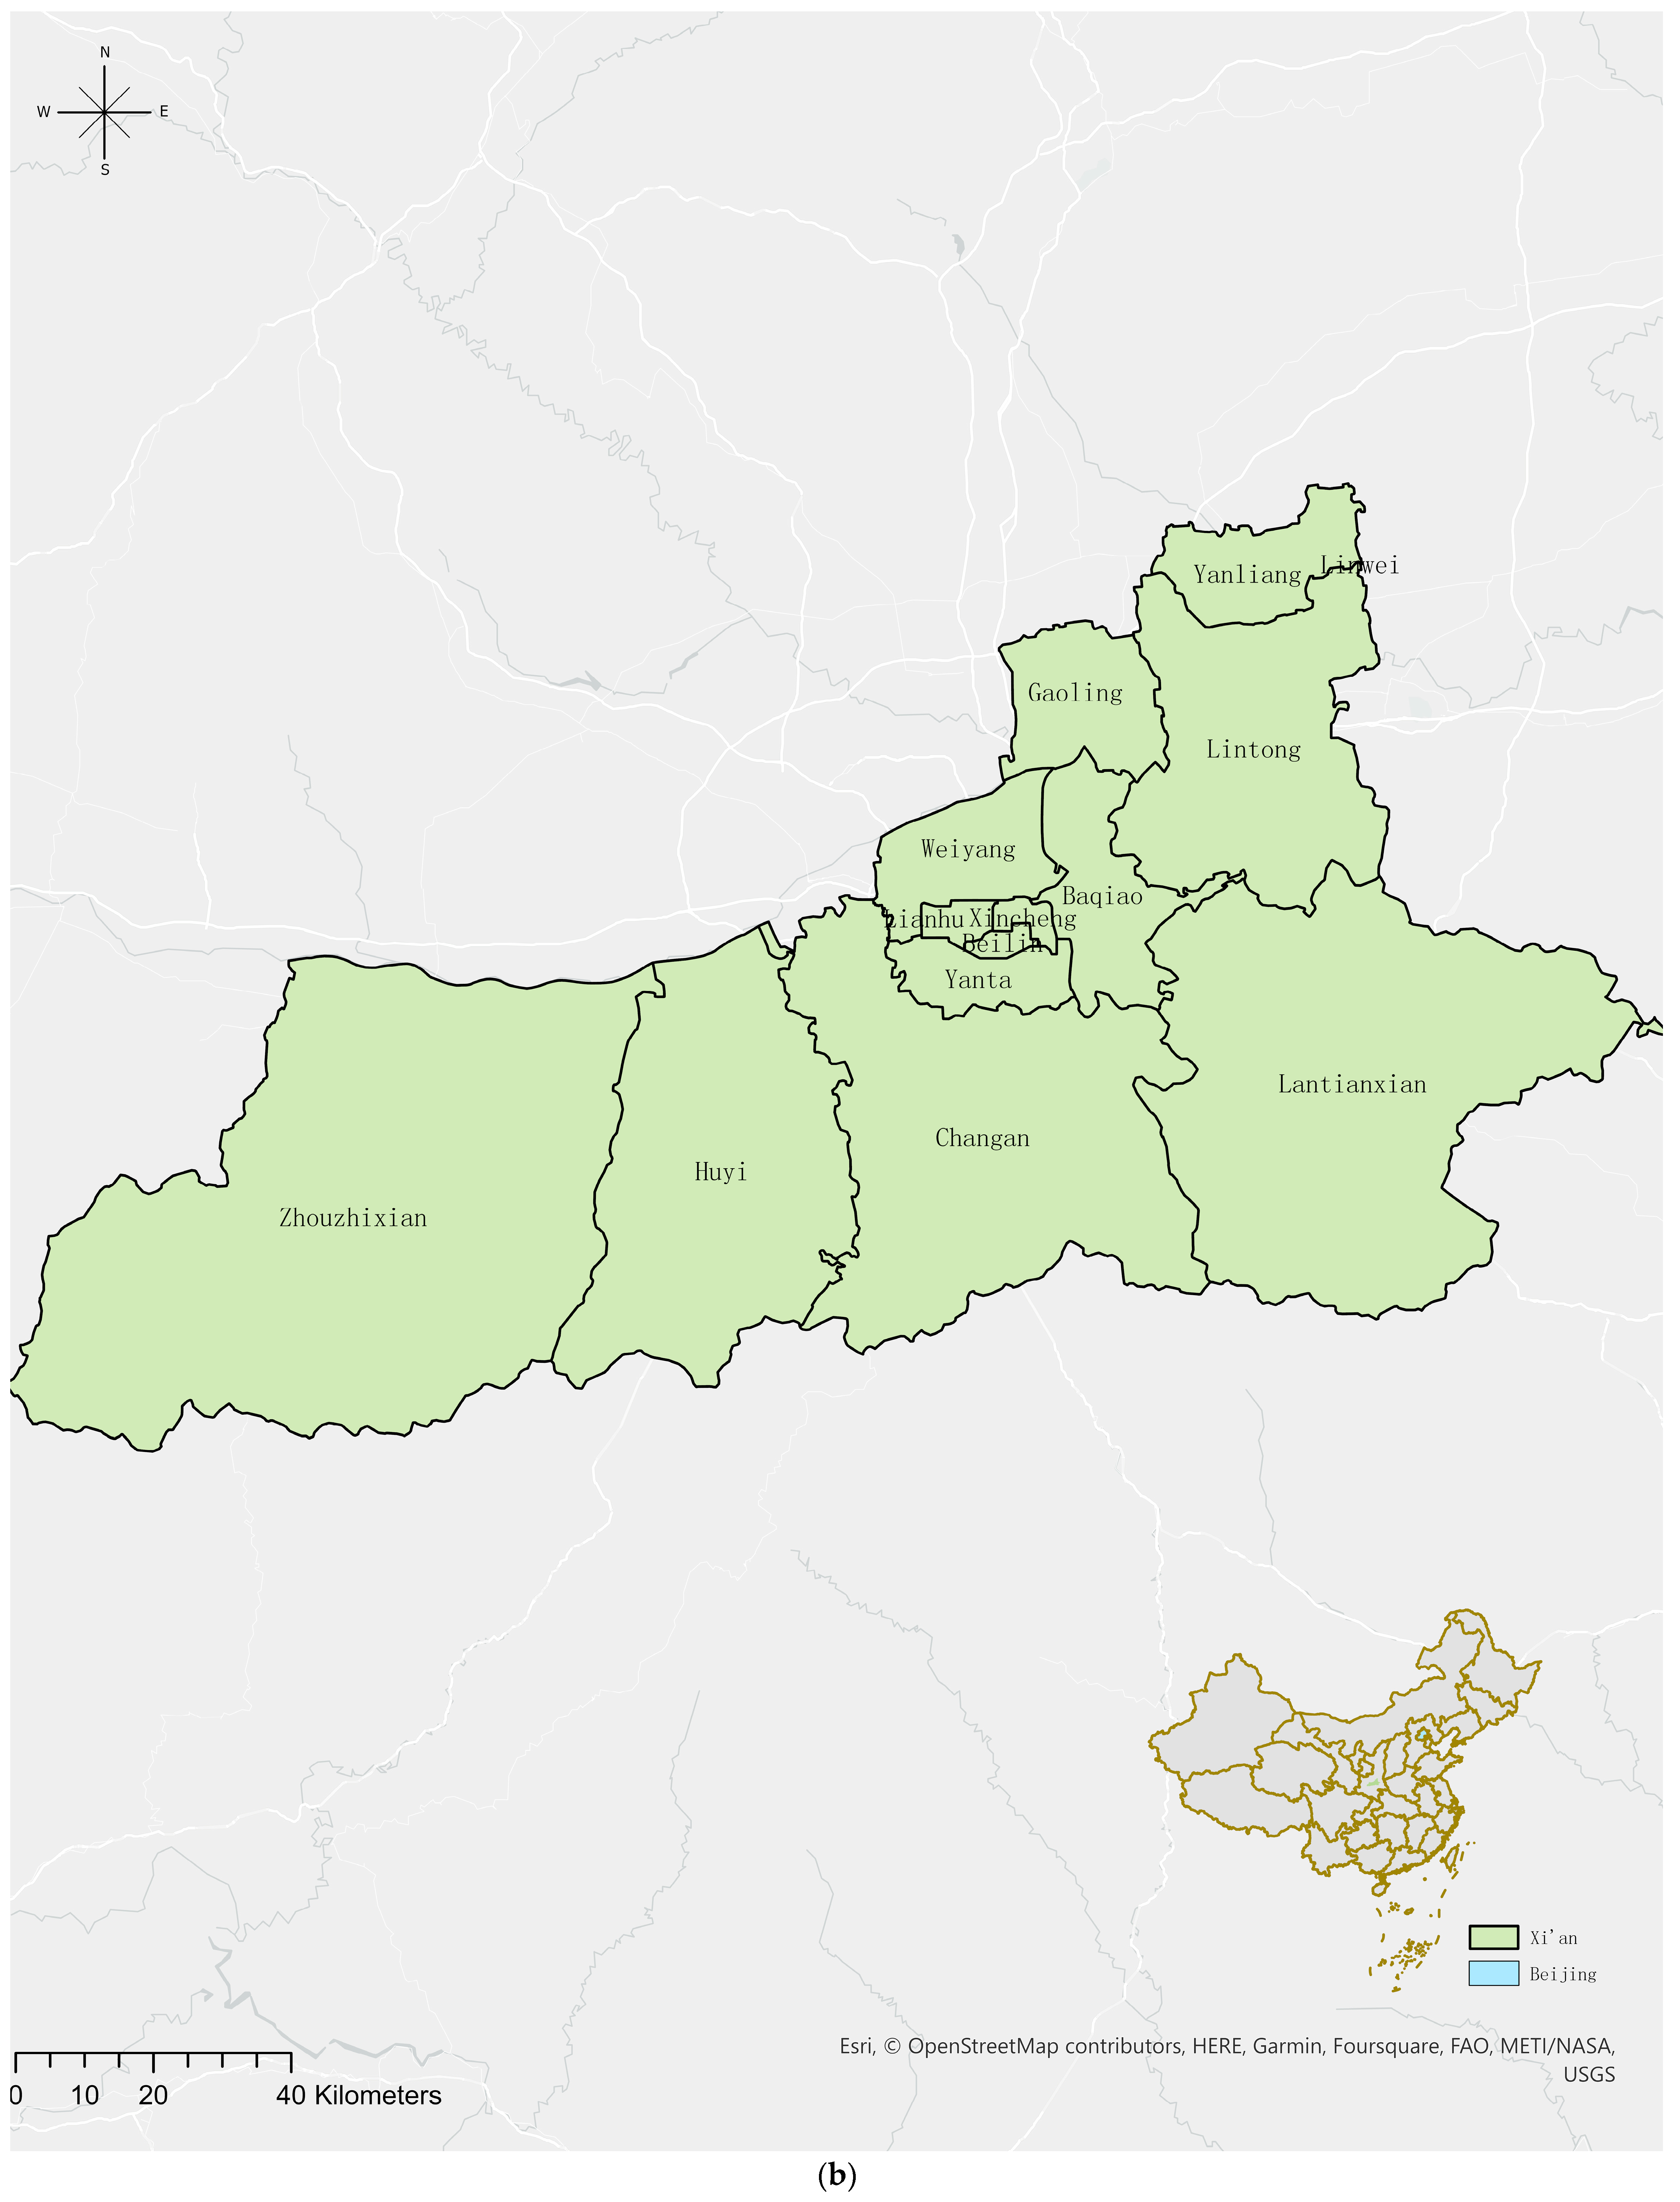
2. Study Area
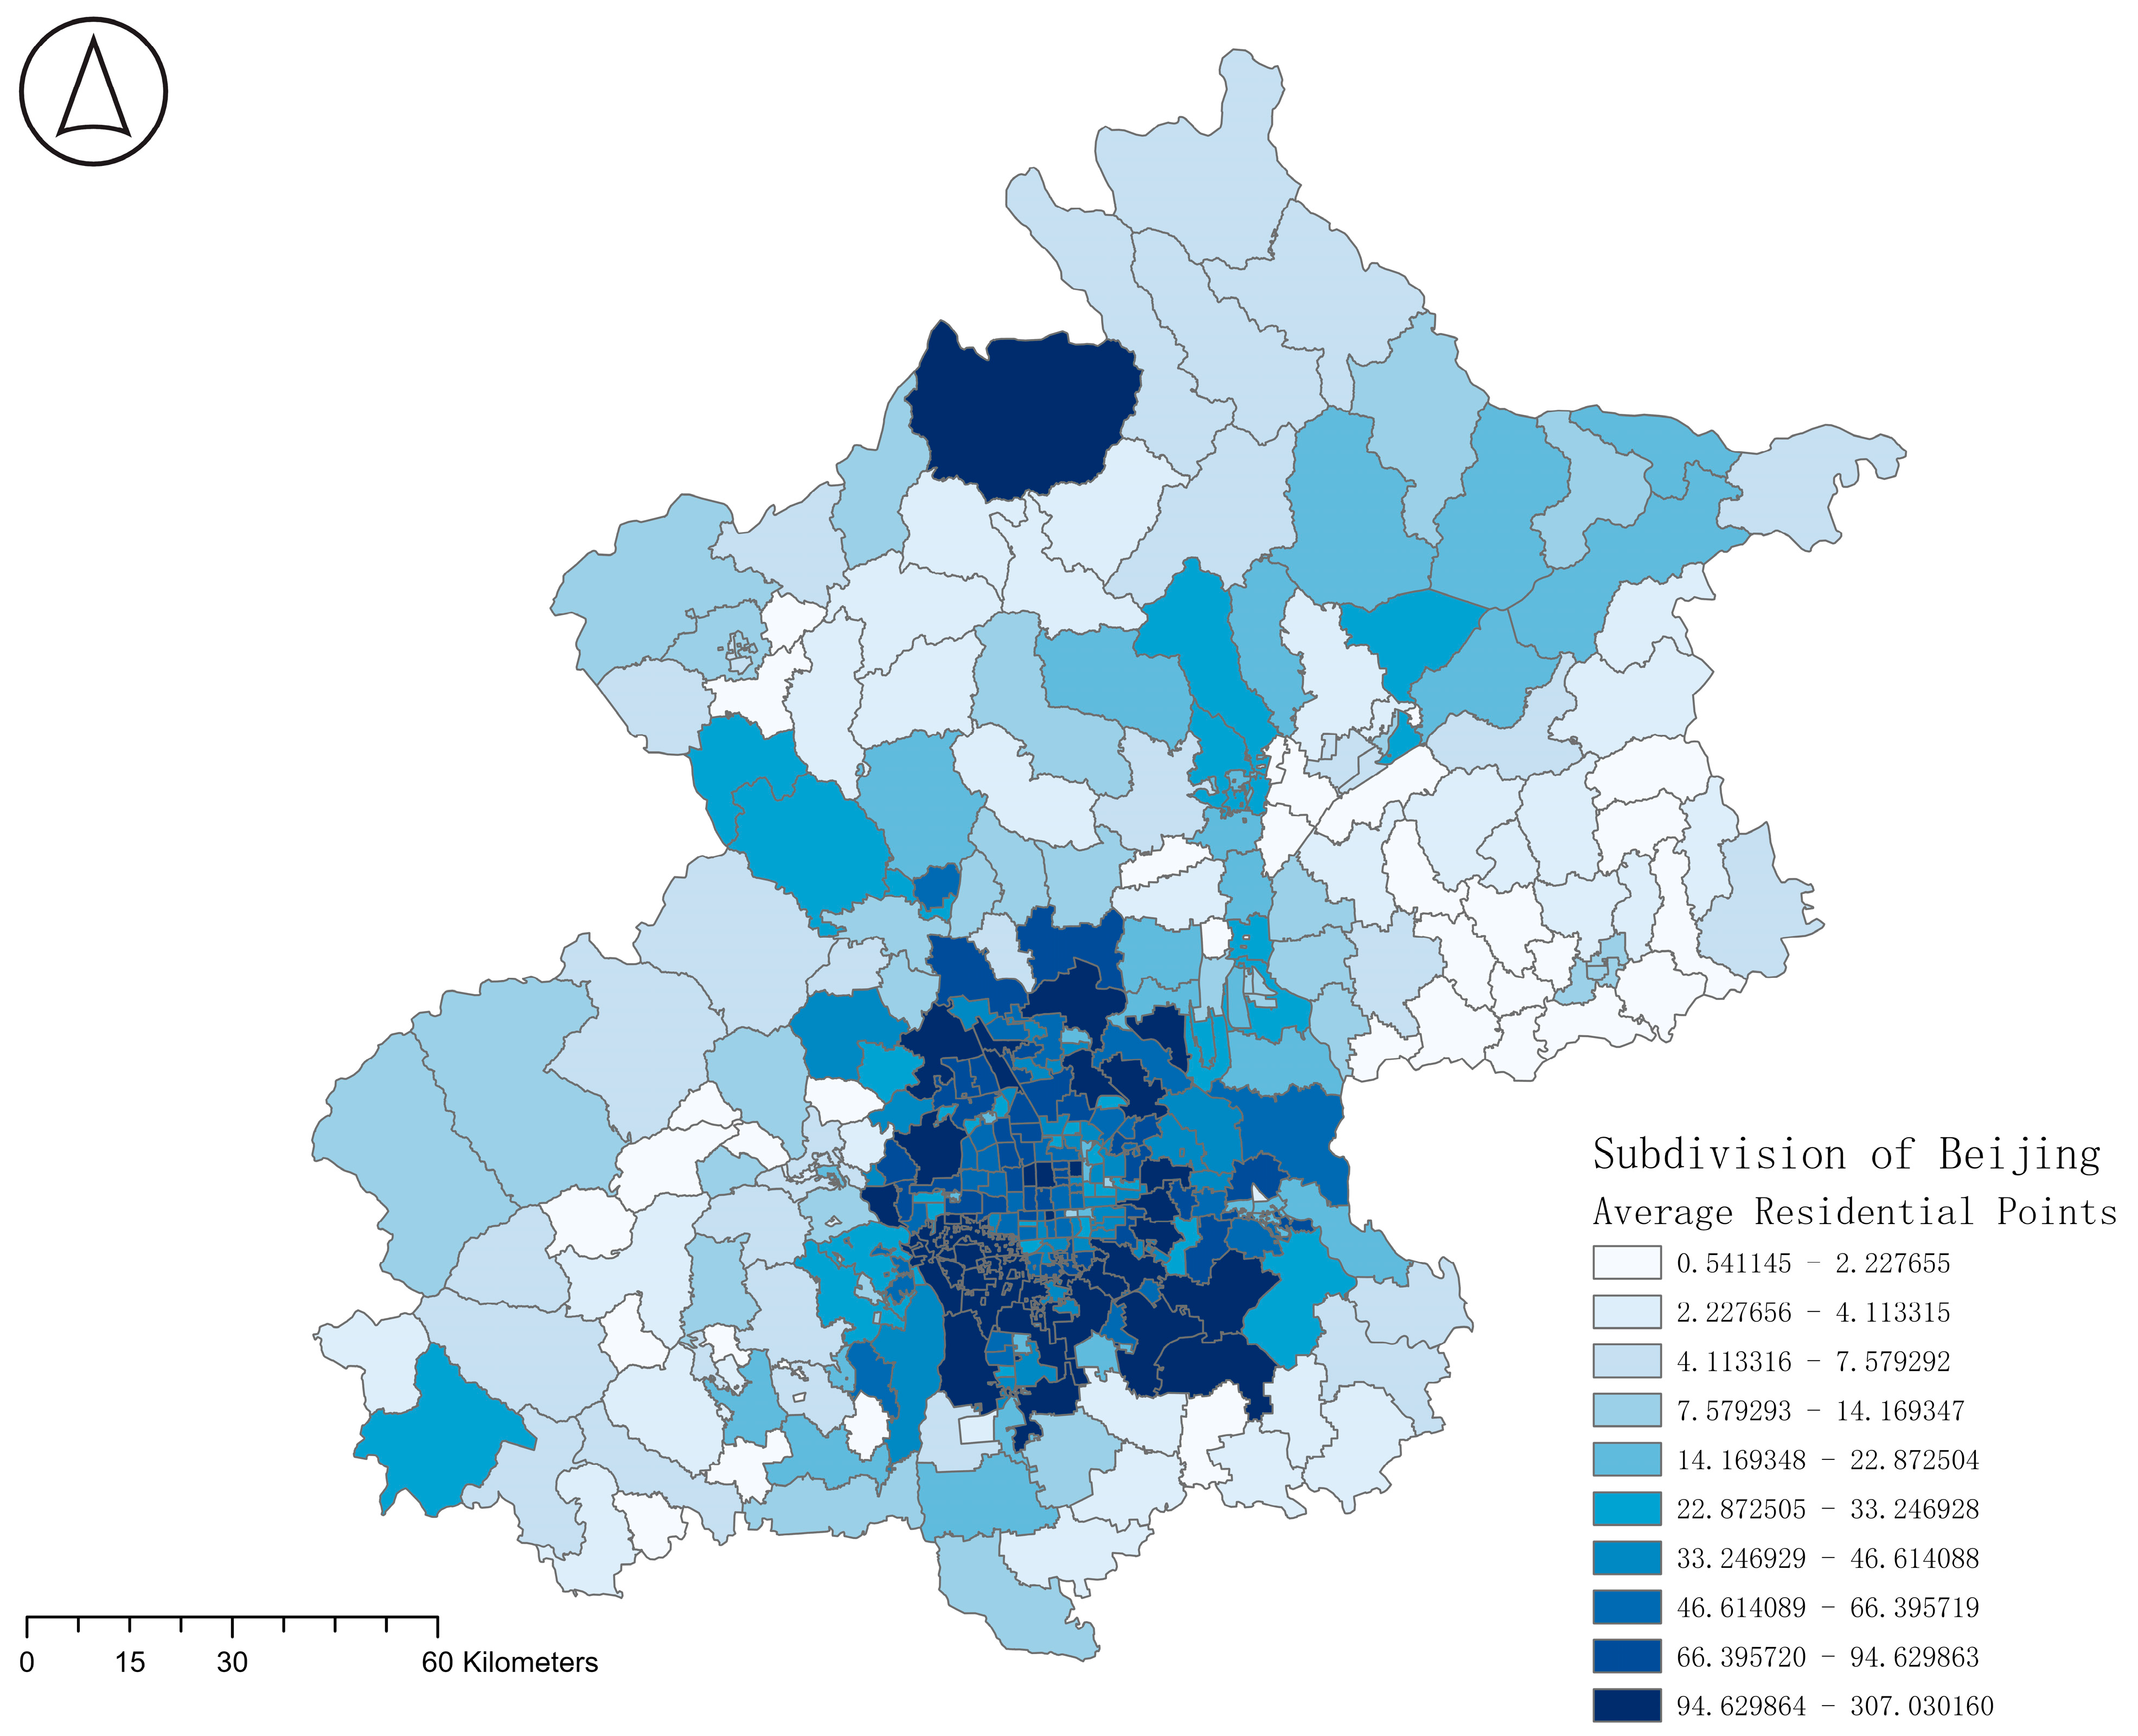
This study takes the street as the unit and analyzes the local human settlement environment with Beijing and Xi’an (
Figure 1a,b) as the research scope.
Accompanying the rapid development of society and technology, today’s cyberspace has accumulated a massive amount of information resources. Social networking platforms, tourism service websites, rental transaction websites, and geographic information websites have accumulated user information and provide open data resources that are important sources of information for this study. It is noteworthy that all data used in this paper come from passive VGI. The potential advantage of passive VGI is its capability to collect data on a large scale. However, a drawback is that passive VGI data may contain errors, and individuals might be unaware that their data are being gathered. In contrast, active VGI, due to the vast participation of citizens, data diversity, and local knowledge, can convey more valuable and accurate information. Yet, in the area investigated in this article, no opportunities were found for local residents to participate. In future research, active VGI will be the primary source of data collection, Regrettably, active VGI is primarily conveyed by the general public, suggesting that it may possess inherent biases that might require correction [
13,
14]. All data sources are shown in
Table 1 below.
This study used web scraping tools for a deep data crawl of Beijing and Xi’an, covering dimensions such as greenery rate, plot ratio, building height, number of shopping malls, number of police stations, entertainment facilities, gas stations, and distribution of electric vehicle charging stations. In addition, from other data resources, the study obtained key land use information such as that on medical land, commercial land, and educational land. All of the above data underwent vectorization processing and were then cleaned.
During the data cleaning process, this study strictly enforced screening criteria and performed detailed verification and review of all data. This included unidentifiable street information, missing police station or fire station coordinate data, and duplicate data records, all of which were thoroughly cleaned. However, it is noteworthy that this study did not employ the least squares method to filter out outliers, as this approach bears inherent biases that might result in the exclusion of objectively present but seemingly anomalous data. Thus, after removing unusable data, all objectively existing and intact data were incorporated into the analysis. Based on this, all vector data were re-integrated according to the test results of data quality and completeness to form a new, screened, and corrected set of data. However, the least squares method contributes to enhancing data quality, correcting measurement errors, and revealing spatial patterns, providing a reliable data analysis tool for urban planning, social science research, and policy decision-making in the field of human–environment interactions. Therefore, the application of this method not only increases data credibility but also offers substantial support for urban improvements and community development. This approach aids researchers not only in elucidating trends and patterns in human-environment data through data fitting and regression analysis but also in mitigating geographic measurement errors. The least squares method can be employed to optimize and rectify measurements affected by errors, thereby enhancing the accuracy of geographic data. Additionally, researchers can utilize this method to model spatial trends in geographic data, thereby unveiling latent patterns within urban or community contexts [
15]. Finally, this screened and cleaned data were re-imported into ArcGIS Pro software for deep analysis. Based on this, the study also used Excel and other data processing tools to weight the data, calculating the scores and total scores for each primary indicator. This step ensured the quality and accuracy of the data and provided a solid and reliable data basis for the subsequent research analysis.
3. Method
At the current stage, various systems of human settlement environment evaluation indicators have emerged. However, an objective and accurate evaluation system still needs to be perfected. Drawing from existing research on Zhejiang and Shanghai, Wang et al.’s assessment of the human settlement environment in Zhejiang overlooked indicators related to the number of accessible facilities for local residents, such as the count of elderly care homes and schools [
16]. Similarly, Luo et al.’s evaluation of Shanghai’s human settlement environment did not incorporate metrics reflecting the living conditions of its inhabitants. While numerous potential indicators exist for evaluation, a clear and objective assessment framework has yet to be established in the literature [
17].
As shown in
Table 2, the residential environment primary indicator provides the basic life needs of local residents, covering key aspects such as air quality, water area, greenery level, building conditions, and use of open space. Among them, the quality of air directly affects the quality of the residents’ living environment; water areas and greenery, including the number of parks and water body area, constitute an important part of the residents’ surrounding environment; building conditions, such as the plot ratio of the community, the number of buildings, and the height of buildings, can affect residents’ quality of life; open areas meet residents’ social needs and outdoor activity space requirements.
The residential environment indicator also covers important areas such as medical, education, consumption, and work. The medical aspect includes the number of medical lands and sanatoriums, which have a significant impact on residents’ quality of life; education includes schools at all levels and cultural education facilities at different stages, meeting the educational needs of residents of different ages; consumption includes commercial retail areas, which can meet residents’ needs for buying goods and improve quality of life; work-related indicators, such as the number of companies and office locations, have a significant impact on residents’ work commute needs.
The entertainment place primary indicator includes activity places and shopping entertainment places. Activity places such as senior activity centers, outdoor fitness places, etc., meet residents’ social and sport needs; shopping entertainment places include leisure and entertainment facilities, cinemas, etc., to meet citizens’ entertainment consumption needs.
The traffic convenience indicator covers the road network, car services, and public transportation. The completeness of the road network, such as roads, sidewalks, bicycle lanes, traffic congestion, etc., reflects the convenience of residents’ travel; car services reflect to a certain extent the frequency and convenience of residents’ use of cars; public transportation, such as the coverage of subways and buses, determines residents’ commuting choices and convenience.
The safety primary indicator includes the number of emergency shelters, fire stations, and police stations. The number of fire stations and police stations reflects the community’s ability to protect residents; the number and layout of emergency shelters represent the ability to deal with emergencies.
In the analysis method of this study, subjective and objective weighting methods are combined to weigh different indicators. Since the entropy method is overly objective, it may cause the results to depend too much on the data; while the Analytic Hierarchy Process (AHP) is too subjective [
18], it may introduce evaluation errors. Therefore, this study adopted the combined average of the two methods to obtain a comprehensive weighting result.
In this study, data from both Beijing and Xi’an were subjected to entropy weight calculation to determine the weights of each tertiary indicator for both cities. Subsequently, residents who had been living in Beijing and Xi’an for over twenty years were interviewed. AHP was then employed to derive the subjective weights for each tertiary indicator. By evaluating the tertiary indicators, the value for each primary indicator was calculated. By averaging these values and integrating the objective method (entropy method) and the subjective method (AHP), the weights for each primary indicator in both Beijing and Xi’an were deduced. The final scores for each street were determined based on the weights of the primary indicators. These scores allowed for the application of hotspot analysis to identify areas with high-quality and low-quality living environments in both cities.
- (a)
Analytic Hierarchy Process
Firstly, we used the Analytic Hierarchy Process to determine subjective weights. This method was proposed by Thomas Saaty from the University of Pittsburgh in the early 1970s [
19]. The Analytic Hierarchy Process is a structured technique for dealing with complex decision-making problems. Through this method, we constructed a system composed of three levels, where the standard level represents various dimensions, and the indicator level contains our indicators. After the indicator system is established, all the primary and tertiary indicators in the system will be compared in pairs, given different levels of importance, finally obtaining a comprehensive weight distribution through calculation. As shown in
Table 3, using the AHP, residents who had lived in the area for a long time assigned subjective weights to each primary indicator. In the assessment of residential environments, the Analytic Hierarchy Process (AHP) can be employed to determine the weightings of various factors to facilitate comprehensive decision-making. For instance, when choosing a new residential area, considerations may include factors such as safety, quality of schools, transportation convenience, and shopping facilities. By utilizing the Analytic Hierarchy Process, weights can be allocated to each factor, and then the performance of potential residential areas can be evaluated based on these factors to assist in making the optimal selection. Yalpir utilized the AHP method to assess local real estate values based on property conditions in the area as well as the surrounding facilities and environment [
20].
The entropy method is a mathematical instrument designed to measure and evaluate system complexity. When assessing residential environments, the entropy method can be utilized to quantify the degree of correlation between various factors, thereby discerning the environment’s diversity and equilibrium. For instance, in evaluating an urban living environment, one can employ the entropy method to analyze the relationships among factors such as population density, green space coverage, and traffic volume in different regions. By computing the informational entropy between these elements, one can identify which areas offer a more balanced living environment and which might confront issues of imbalance or excessive congestion.
The research conducted objective weighting for the data through the entropy method. The entropy method weights decision-making through dispersion: the greater the degree of dispersion, the greater the degree of differentiation [
21]. The calculation method is as follows:
First, standardize the original data; the formula is as follows:
Calculate the entropy value; the formula is as follows:
Calculate the weight vector; the formula is as follows:
The score for each street is equal to the weight multiplied by the original data.
Spatial correlation analysis is a tool to examine the distribution and association of data within geographical space. In the context of residential environment assessments, this method can be employed to analyze the spatial relationships between features in distinct regions. For instance, when evaluating the relationship between crime rates and police distribution in an urban setting, spatial correlation analysis can be utilized to determine if there exists a spatial association between high-crime areas and police patrol zones. This can assist government and law enforcement agencies in more effectively allocating resources to enhance the living environment.
This study used the Getis-Ord Gi* hotspot analysis tool to conduct an in-depth analysis of the heterogeneity of the local human settlements [
22]. This method can measure the high and low values of the quality of human settlements in Beijing and Xi’an within a certain spatial range, as well as the situation and location of internal clusters. The Getis-Ord local statistical formula can be expressed as follows:
where
is the attribute value of feature j,
is the spatial weight between features i and j, n is the feature summary, and:
Results are presented as z-scores. Higher z-scores represent denser clusters known as hot spots, while lower z-scores represent cold spots. In this study, confidence levels of 90%, 95%, and 99% were selected when points with z-values close to 0 indicated that spatial clustering was not significant.
In the field of urban planning, the transit-oriented development (TOD) strategy is widely recognized as an effective approach aimed at enhancing the efficiency and sustainability of urban spaces. This study endeavors to delve into how this strategy can be applied to clusters of low-quality human settlements. Specifically, we focus on one or several areas that are relatively representative within these environments, analyzing in detail the potential developments and impacts they might realize upon adopting a TOD-based urban planning strategy.
4. Results
Based on the habitat environment evaluation index system in
Table 2, the article uses the entropy method and the Analytic Hierarchy Process (AHP) to calculate the weights, thereby obtaining the habitat environment scores for Beijing and Xi’an (see
Figure 2). In the assessment of the habitat environment, the higher the score, the better the quality of the habitat environment in the corresponding area. This research divided the habitat environments of Beijing and Xi’an into 10 different levels to clearly depict the differences in the quality of the habitat environment in each neighborhood.
The study found that the distribution of the quality of the habitat environment in the city has obvious hierarchical characteristics. High-quality habitat environments are concentrated around the city center, and the habitat environment quality of the city center is second to its surrounding neighborhoods. The quality of the habitat environment in the main urban area is significantly better than in the peripheral areas, which can be attributed to the numerous shopping centers, office locations, and convenient transportation and life service facilities in the main urban area. However, the high density and height of the buildings in the city center have somewhat weakened the quality of the habitat environment in the city center.
In the areas with a lower-quality habitat environment, the neighborhoods are mainly distributed on the outskirts of the city and places far from the main urban area. In these areas, besides the plots that are being developed, a large number of areas are not yet developed, leading to local resource scarcity, insufficient basic service facilities, and undeveloped transportation. However, the distribution of areas with medium habitat environment quality does not have a clear pattern and covers a wide range. Most neighborhoods with medium-quality habitat environments are connected to neighborhoods with high-quality habitat environments, forming a kind of transition area.
The main difference between Beijing and Xi’an is that Beijing’s living environment tends to be more irregular, while Xi’an’s living environment has a clear pattern, gradually decreasing from the main urban area to the surrounding areas and then rising slightly. This is because the distribution of urban resources in Beijing is relatively even, and each township and street have certain resources, while the urban resources in Xi’an are mainly concentrated in the main urban area, and the resources in the surrounding areas are very scarce or even non-existent.
4.1. Criteria Layer Analysis
In this section, through five primary core indicators, namely residential environment, living conditions, entertainment scores, transportation accessibility, and safety, a comprehensive exploration and evaluation of the disparities between Beijing and Xi’an have been conducted. This article provides an in-depth analysis and comparison of the two cities with respect to these five indicators, shedding light on their specific differences in the context of human habitation environments.
4.1.1. Residential Environment Analysis
In the assessment of the residential environment, as shown in
Figure 3, Beijing presents a unique distribution state. The quality of the living environment in the central city area is generally at a medium-to-high level, and the living environment at the boundary between the main city and the suburbs performs excellently. However, in the suburbs around the main city, the quality of the living environment is relatively low-end. Within Beijing, areas such as Tongzhou District, Haidian District, Fengtai District, and certain areas in Dongcheng District, Daxing District, and Chaoyang District have extremely high-quality living environments. These areas have a large number of areas under development and are characterized by high greening rates and high vegetation coverage rates, which leads to their living environment quality possibly surpassing the city center. The living environment scores of the surrounding areas outside the main city are low, mainly because these areas have a large amount of undeveloped land and limited open space, and most areas are covered by crops. The living environment score of the area at the boundary between Huairou District and Miyun District in Beijing is at a medium level, while the living environment scores in the east and southwest of Beijing are lower. In addition, in areas with lower scores, there are a large number of self-built houses, which leads to almost no greening. Vacant lands are more common in the streets and towns in the south of Beijing.
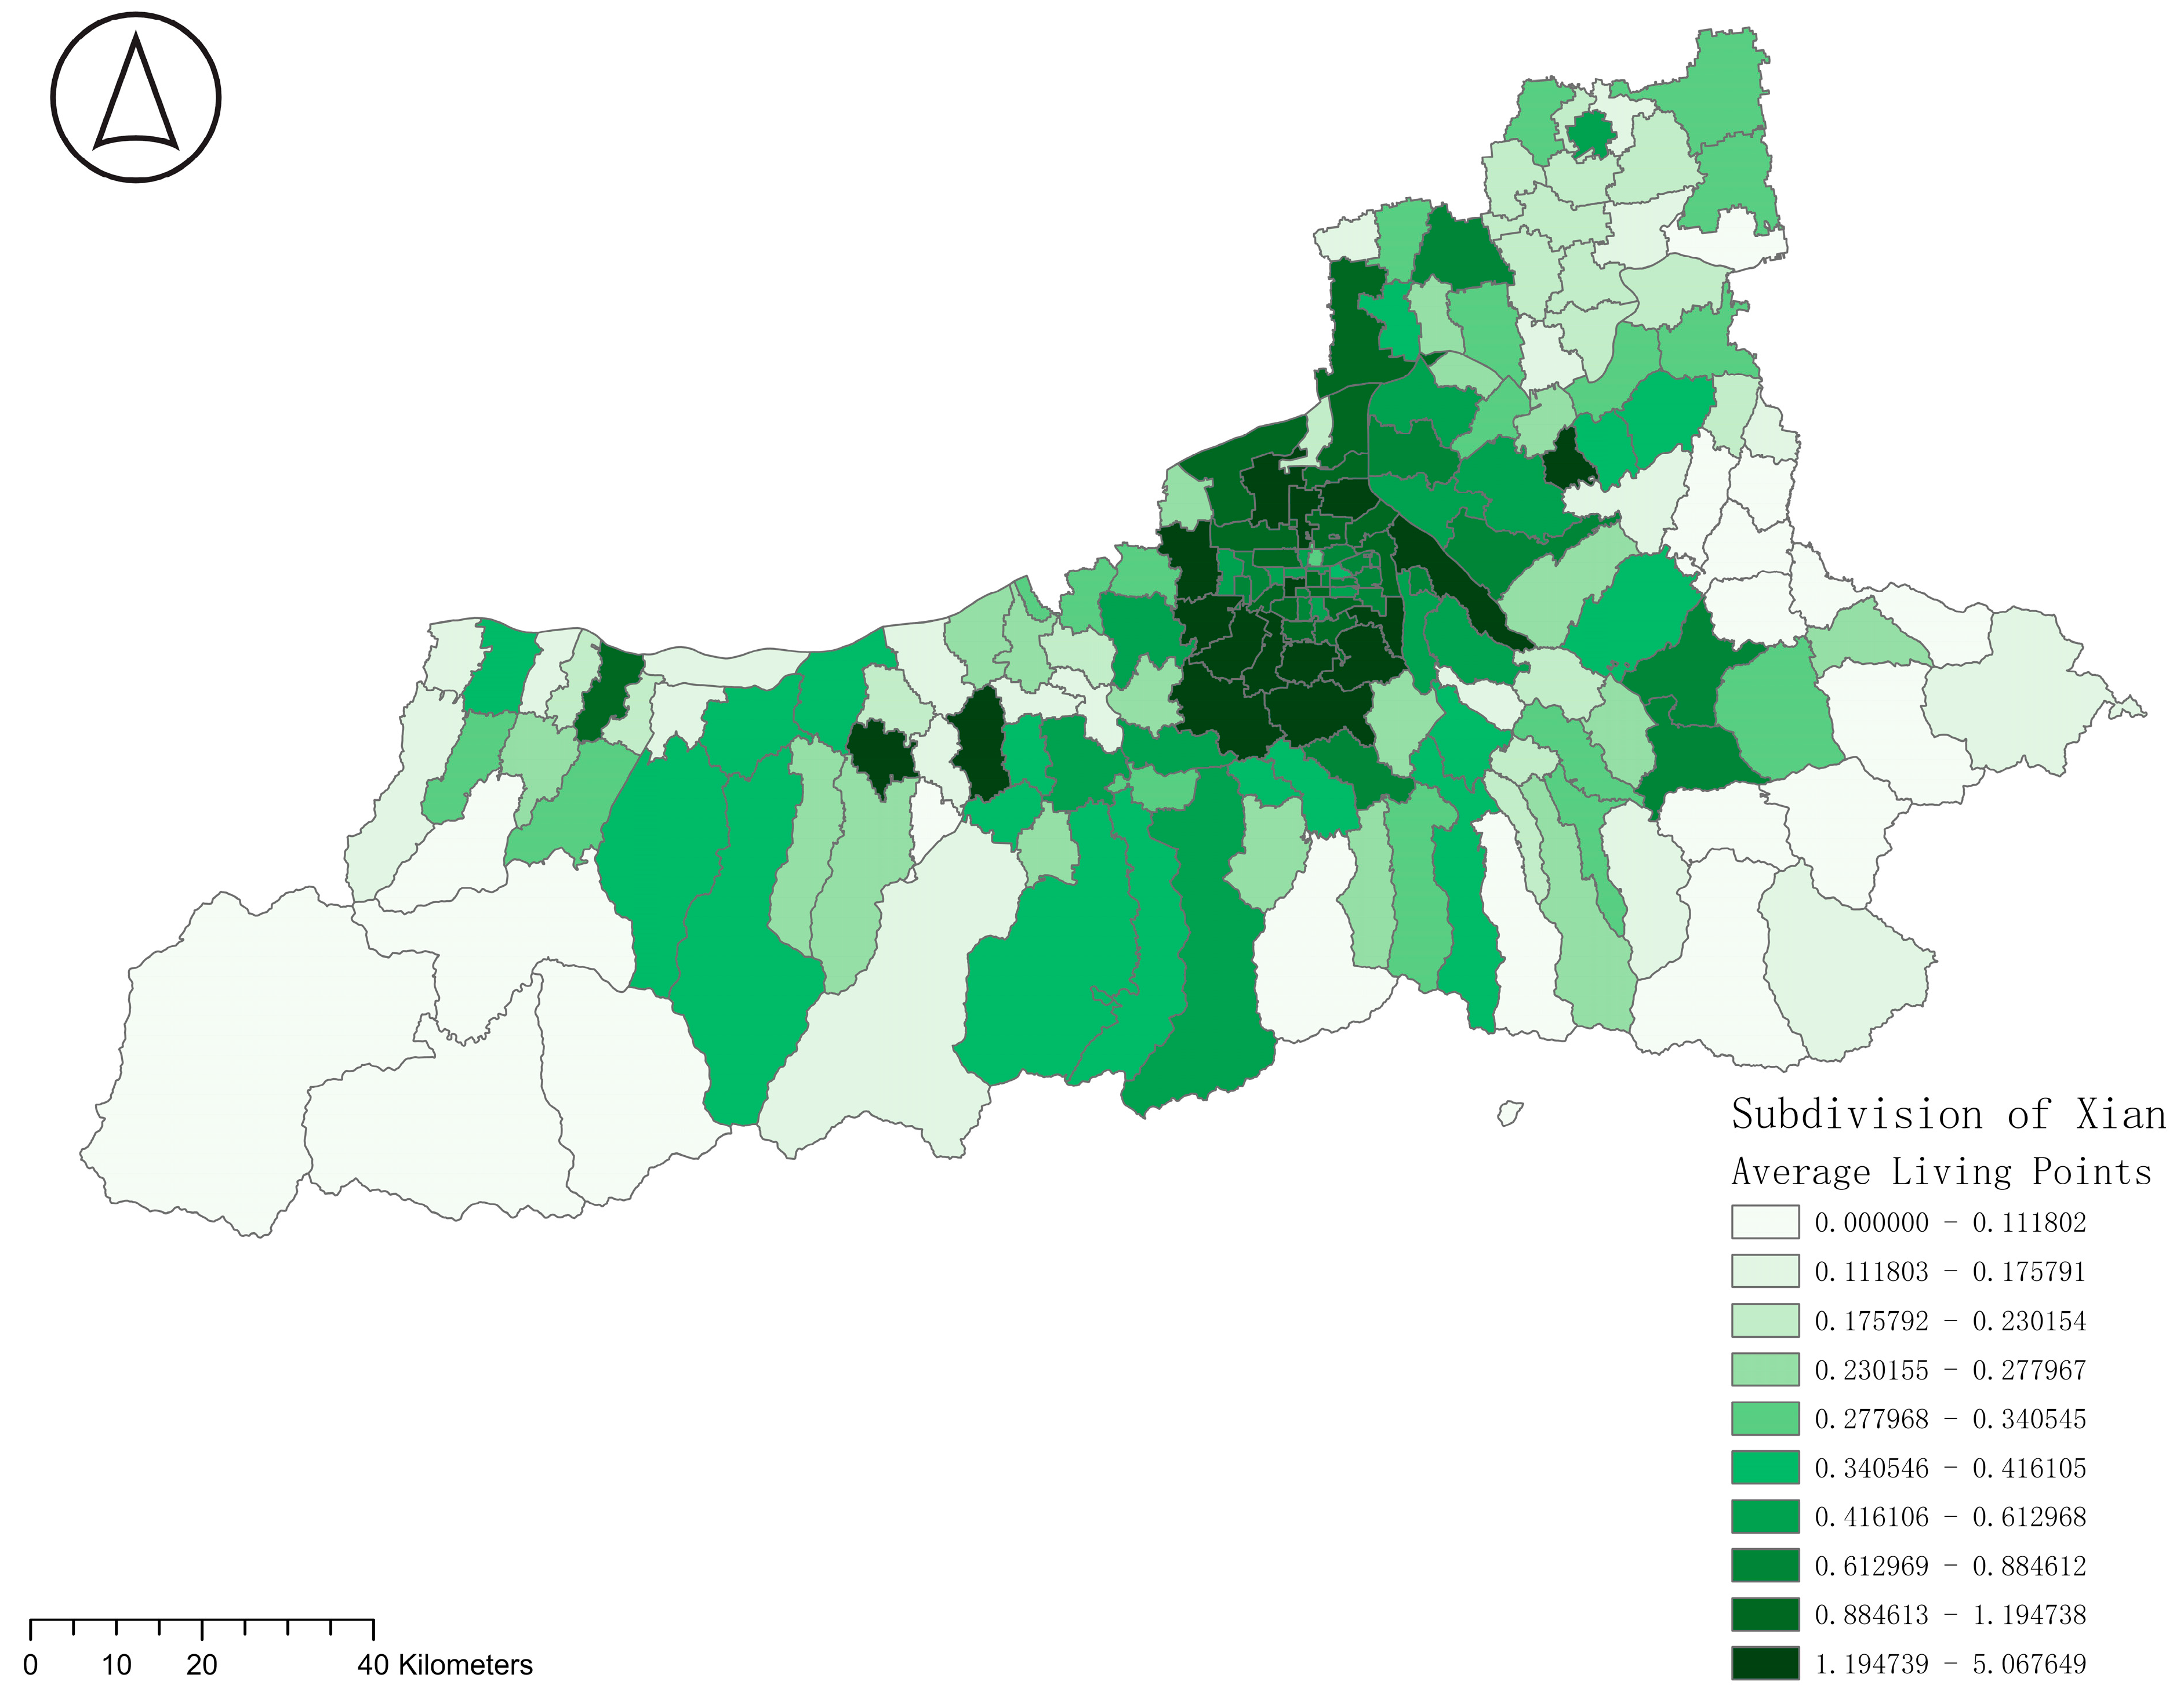
On the other hand, as shown in
Figure 3, the distribution pattern of living environment scores in Xi’an is not exactly the same as that in Beijing. Although the distribution pattern of areas with the highest living environment scores in Xi’an is similar to that in Beijing, mainly concentrated in Baqiao District, Lantian County, Lintong District, Weiyang District, Chang’an District, and Zhouzhi County, the reasons for the highest scores in these streets are similar to those in Beijing. However, the city center of Xi’an scores at a medium level. Moreover, most of the areas with the lowest living environment scores in Xi’an are concentrated in the eastern part of Xi’an. The eastern part of Xi’an has formed a transition zone from high to low from the outer area of the main city. The scores of the areas in other directions in Xi’an do not have a clear pattern, but apart from the east of Xi’an, most of the other areas are medium-score areas. This phenomenon is due to the large amount of farmland in the eastern region of Xi’an, resulting in a relatively small area of houses and open areas, plus the overall green area of Xi’an is relatively low, and parks and green areas are mainly distributed in the outer area of the main city. The living environment in the southern part of Xi’an is at a medium level because these areas do not have as much farmland as the east, and the houses are relatively scattered. In contrast, the houses in the east are concentrated, which leads to a living environment score for eastern Xi’an that is not high.
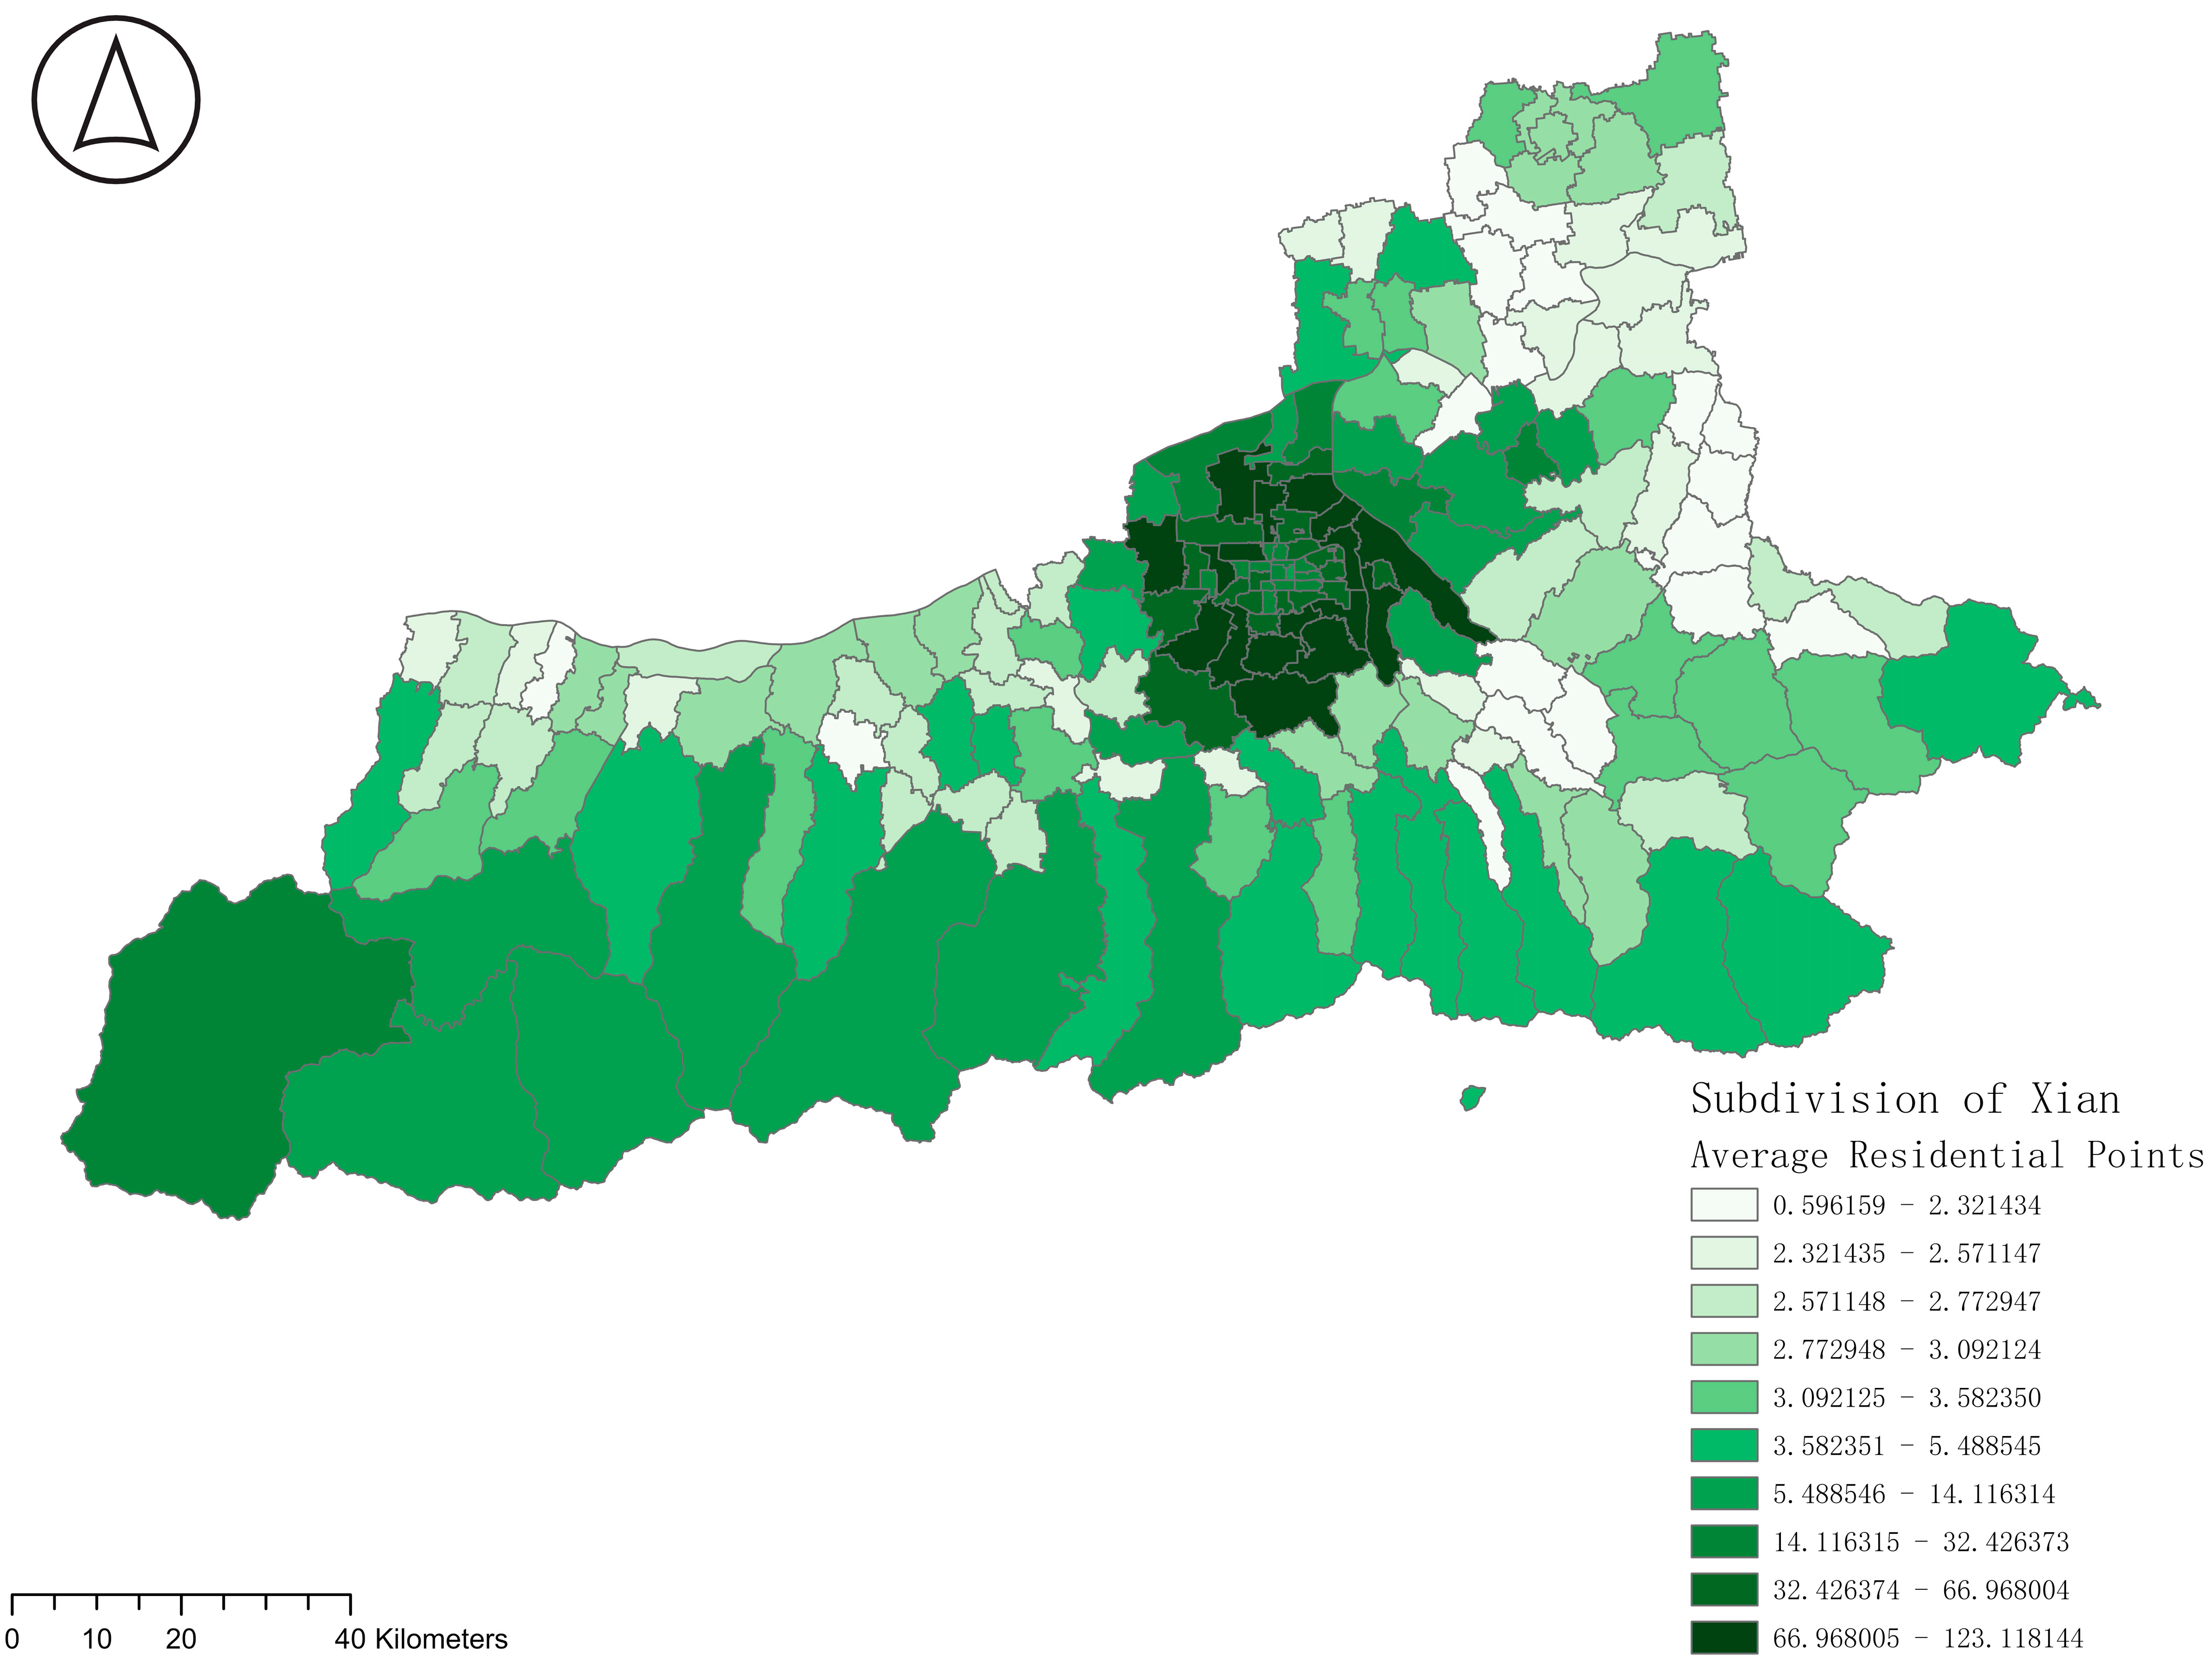
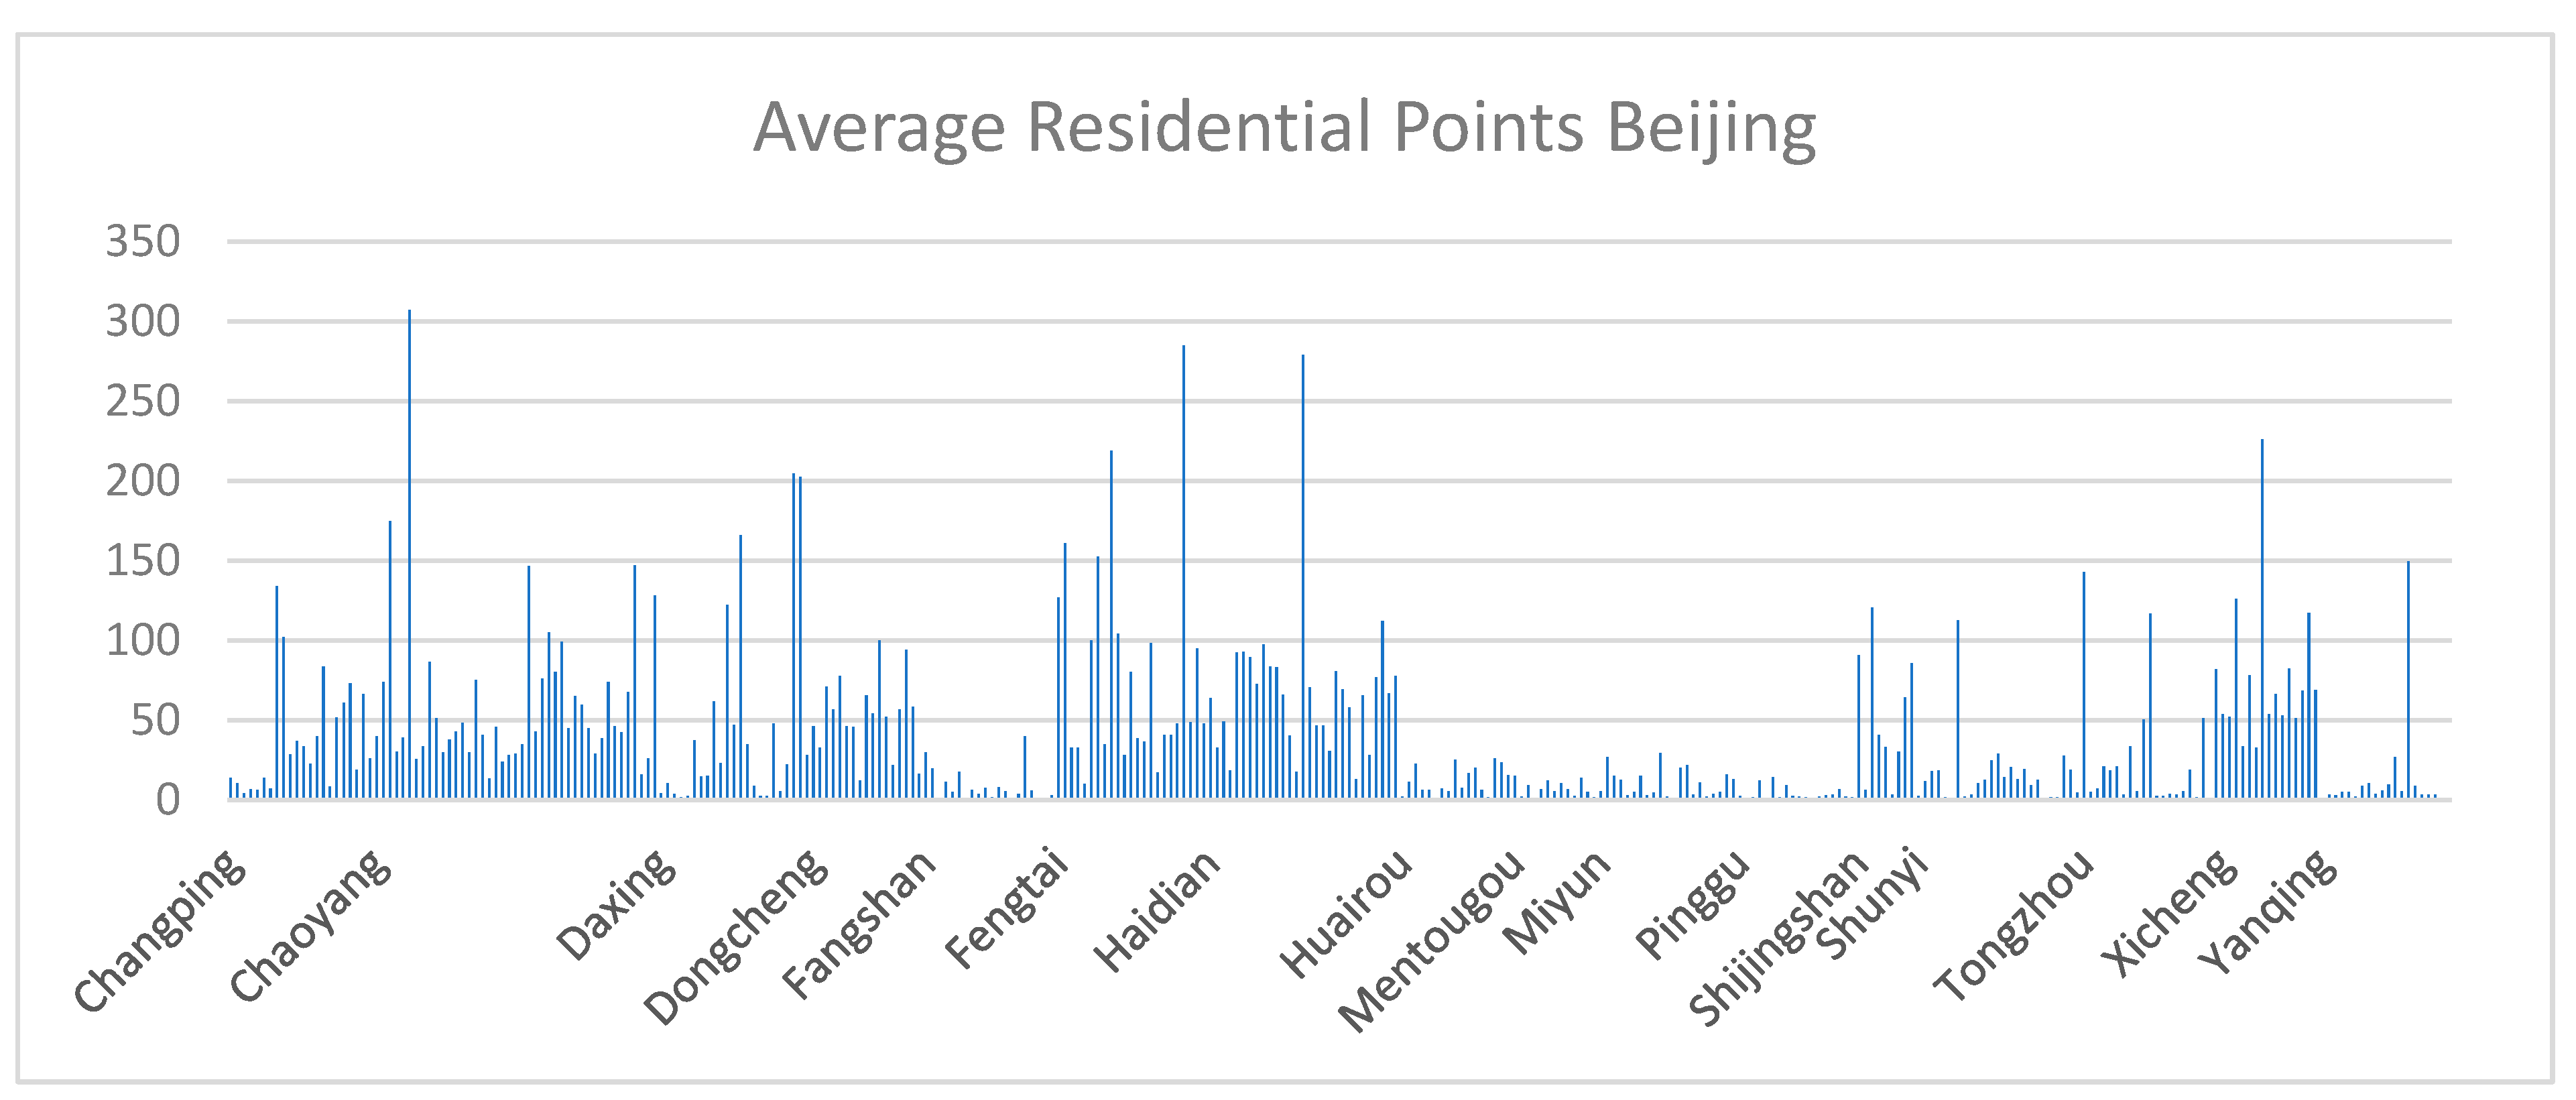
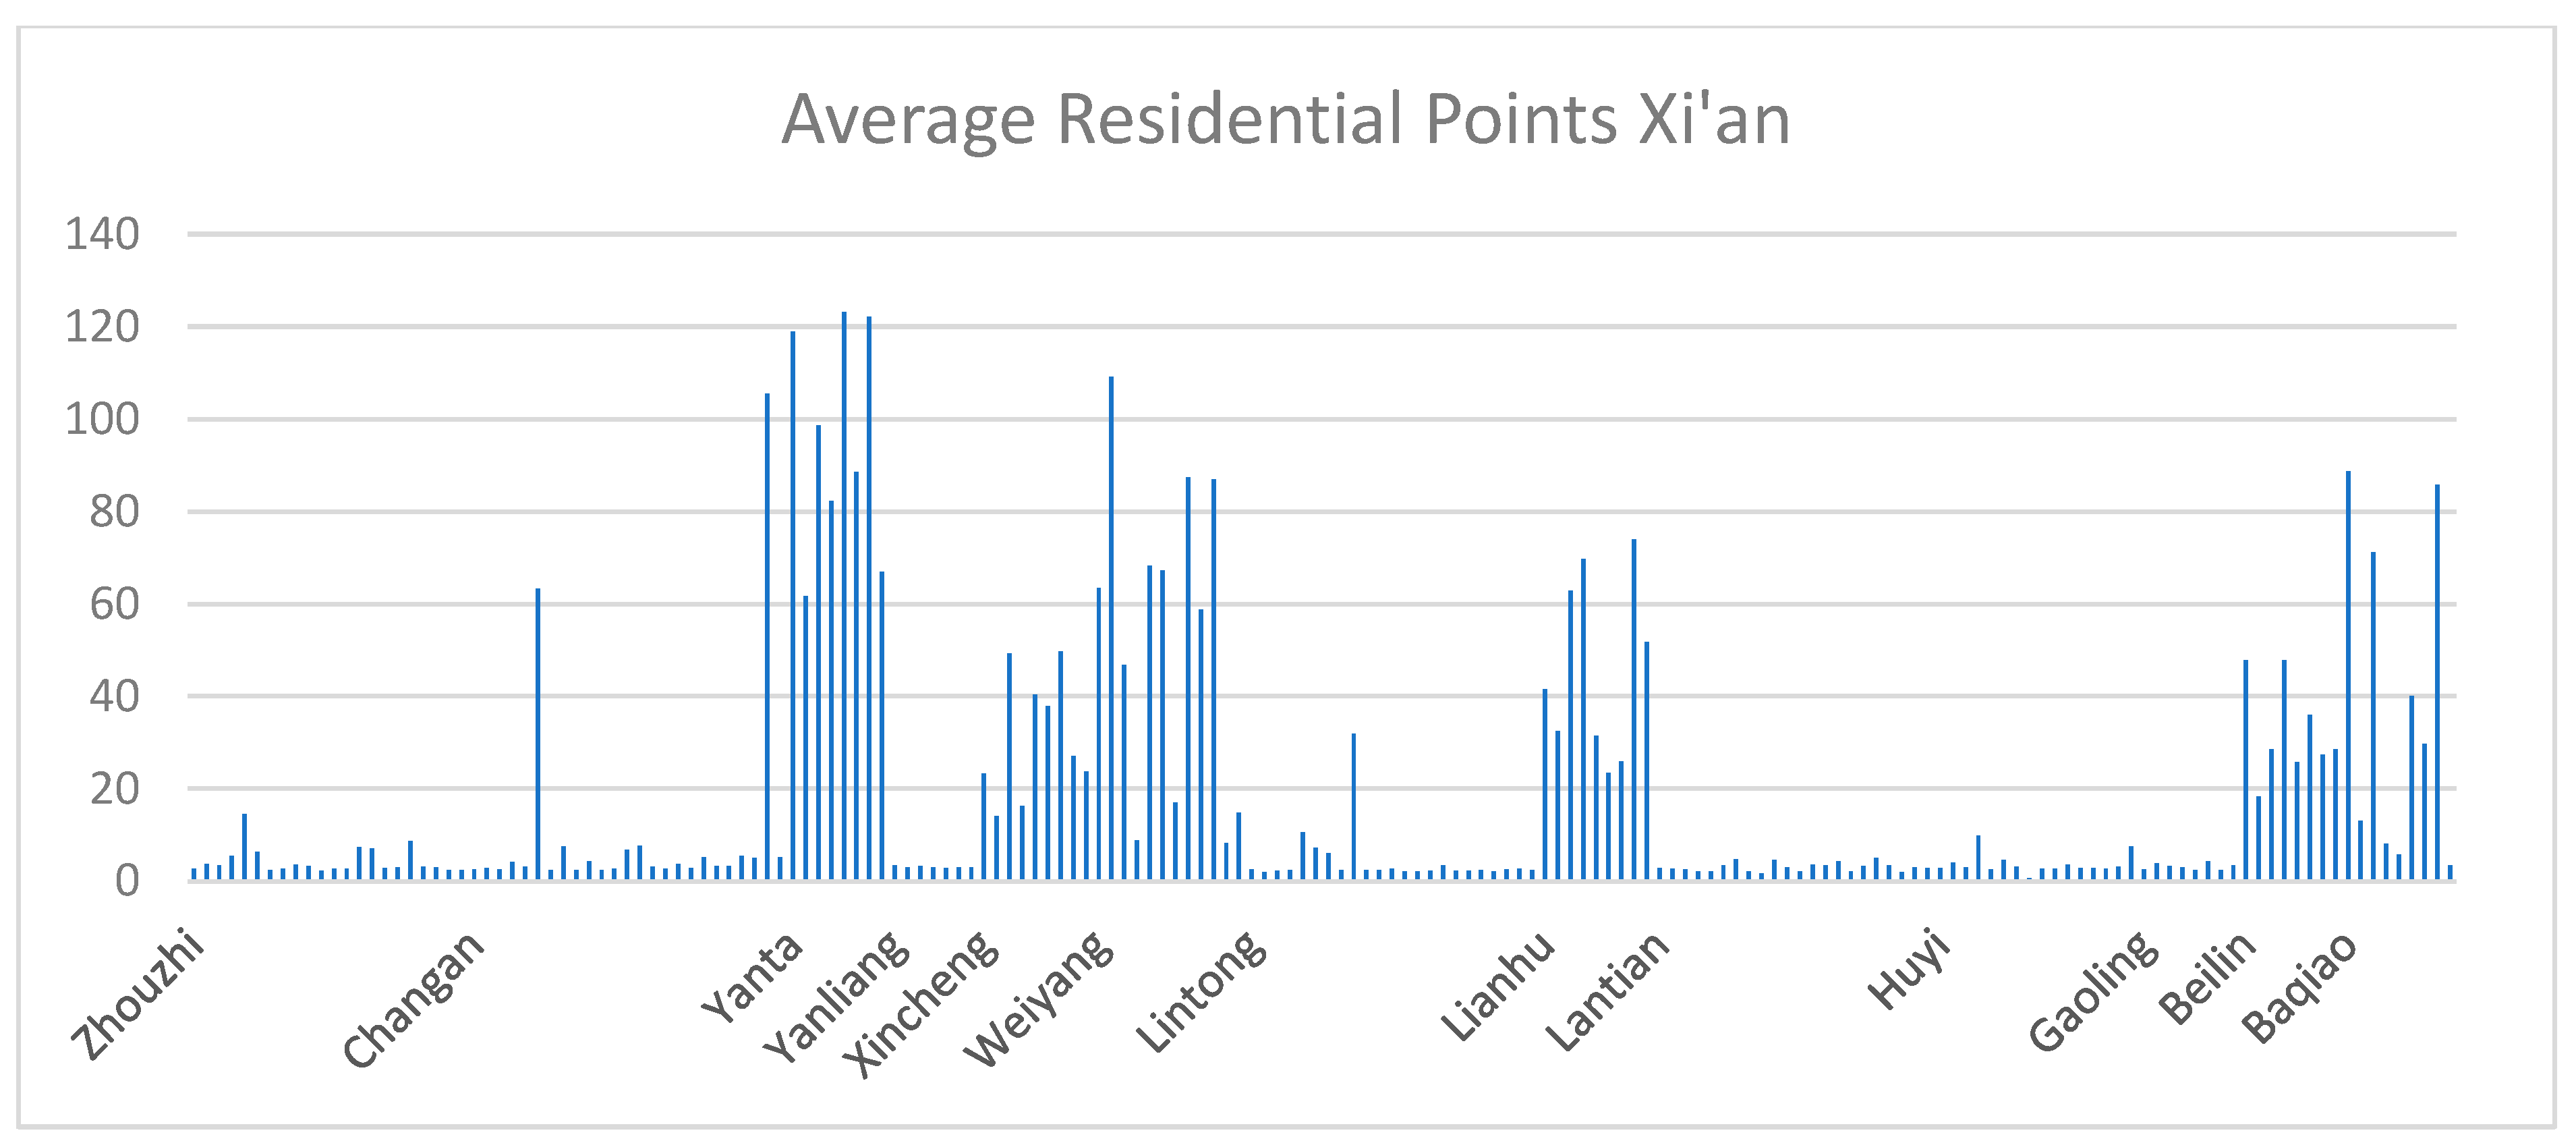
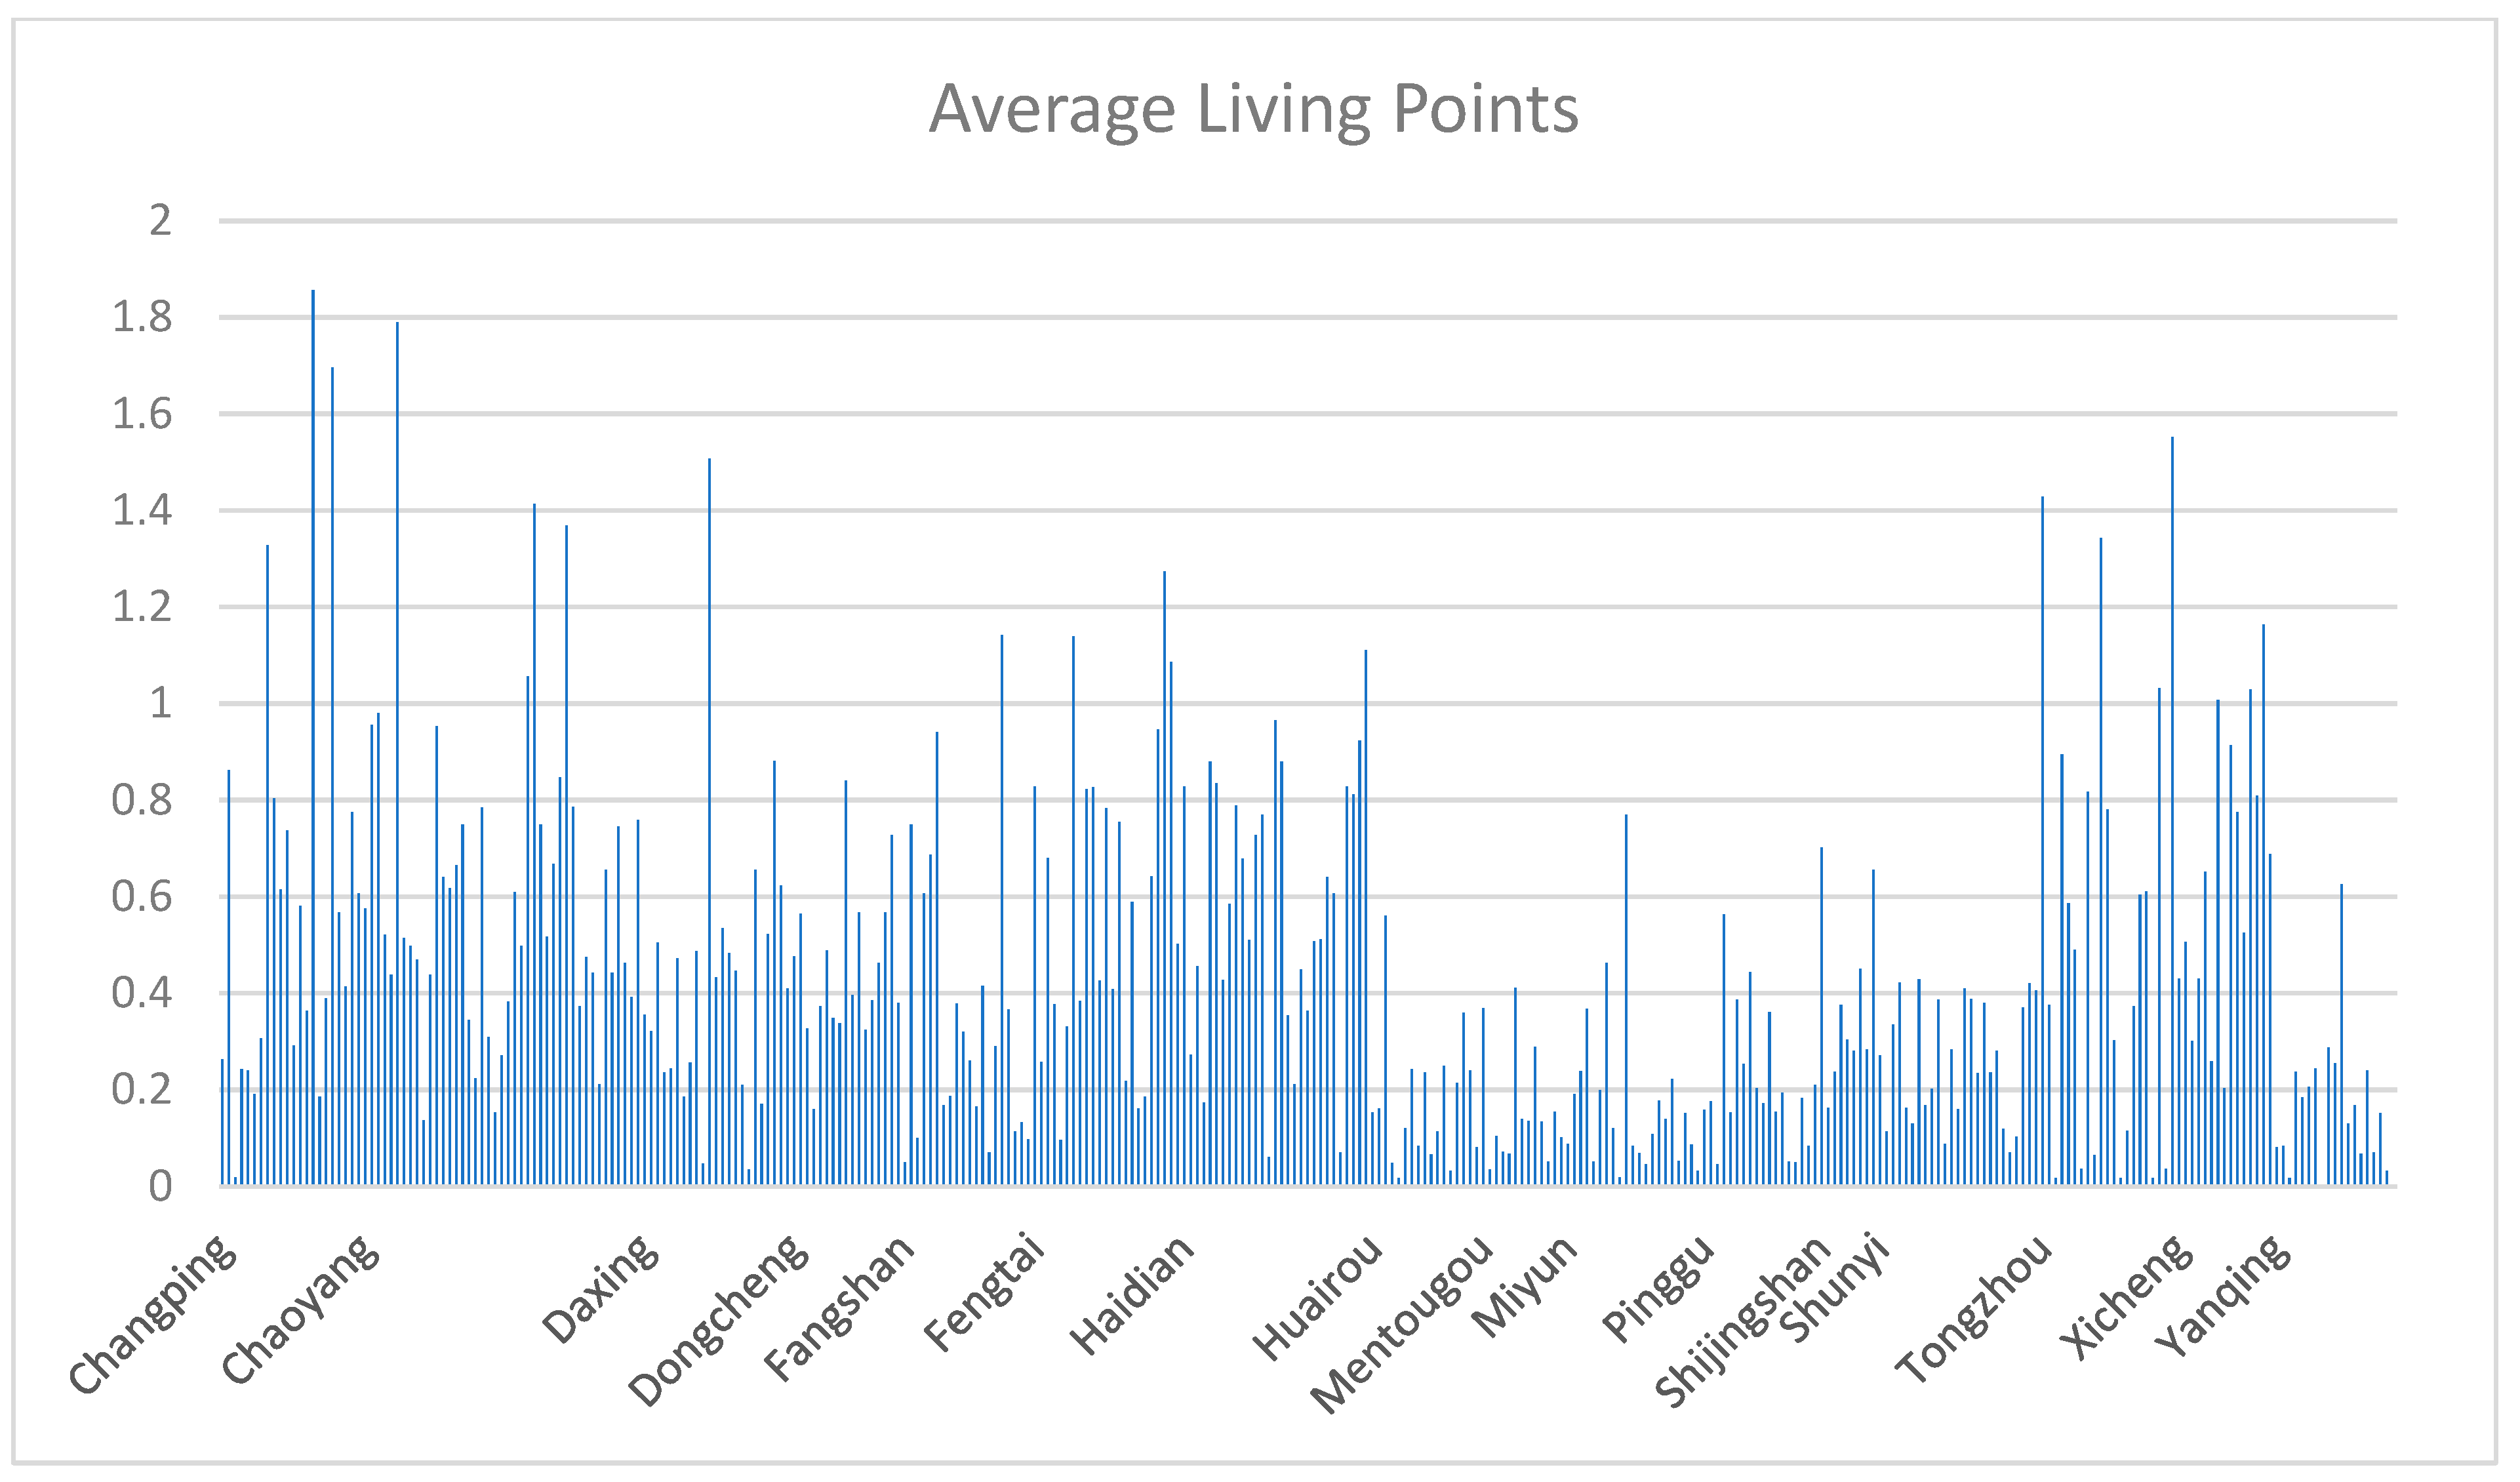
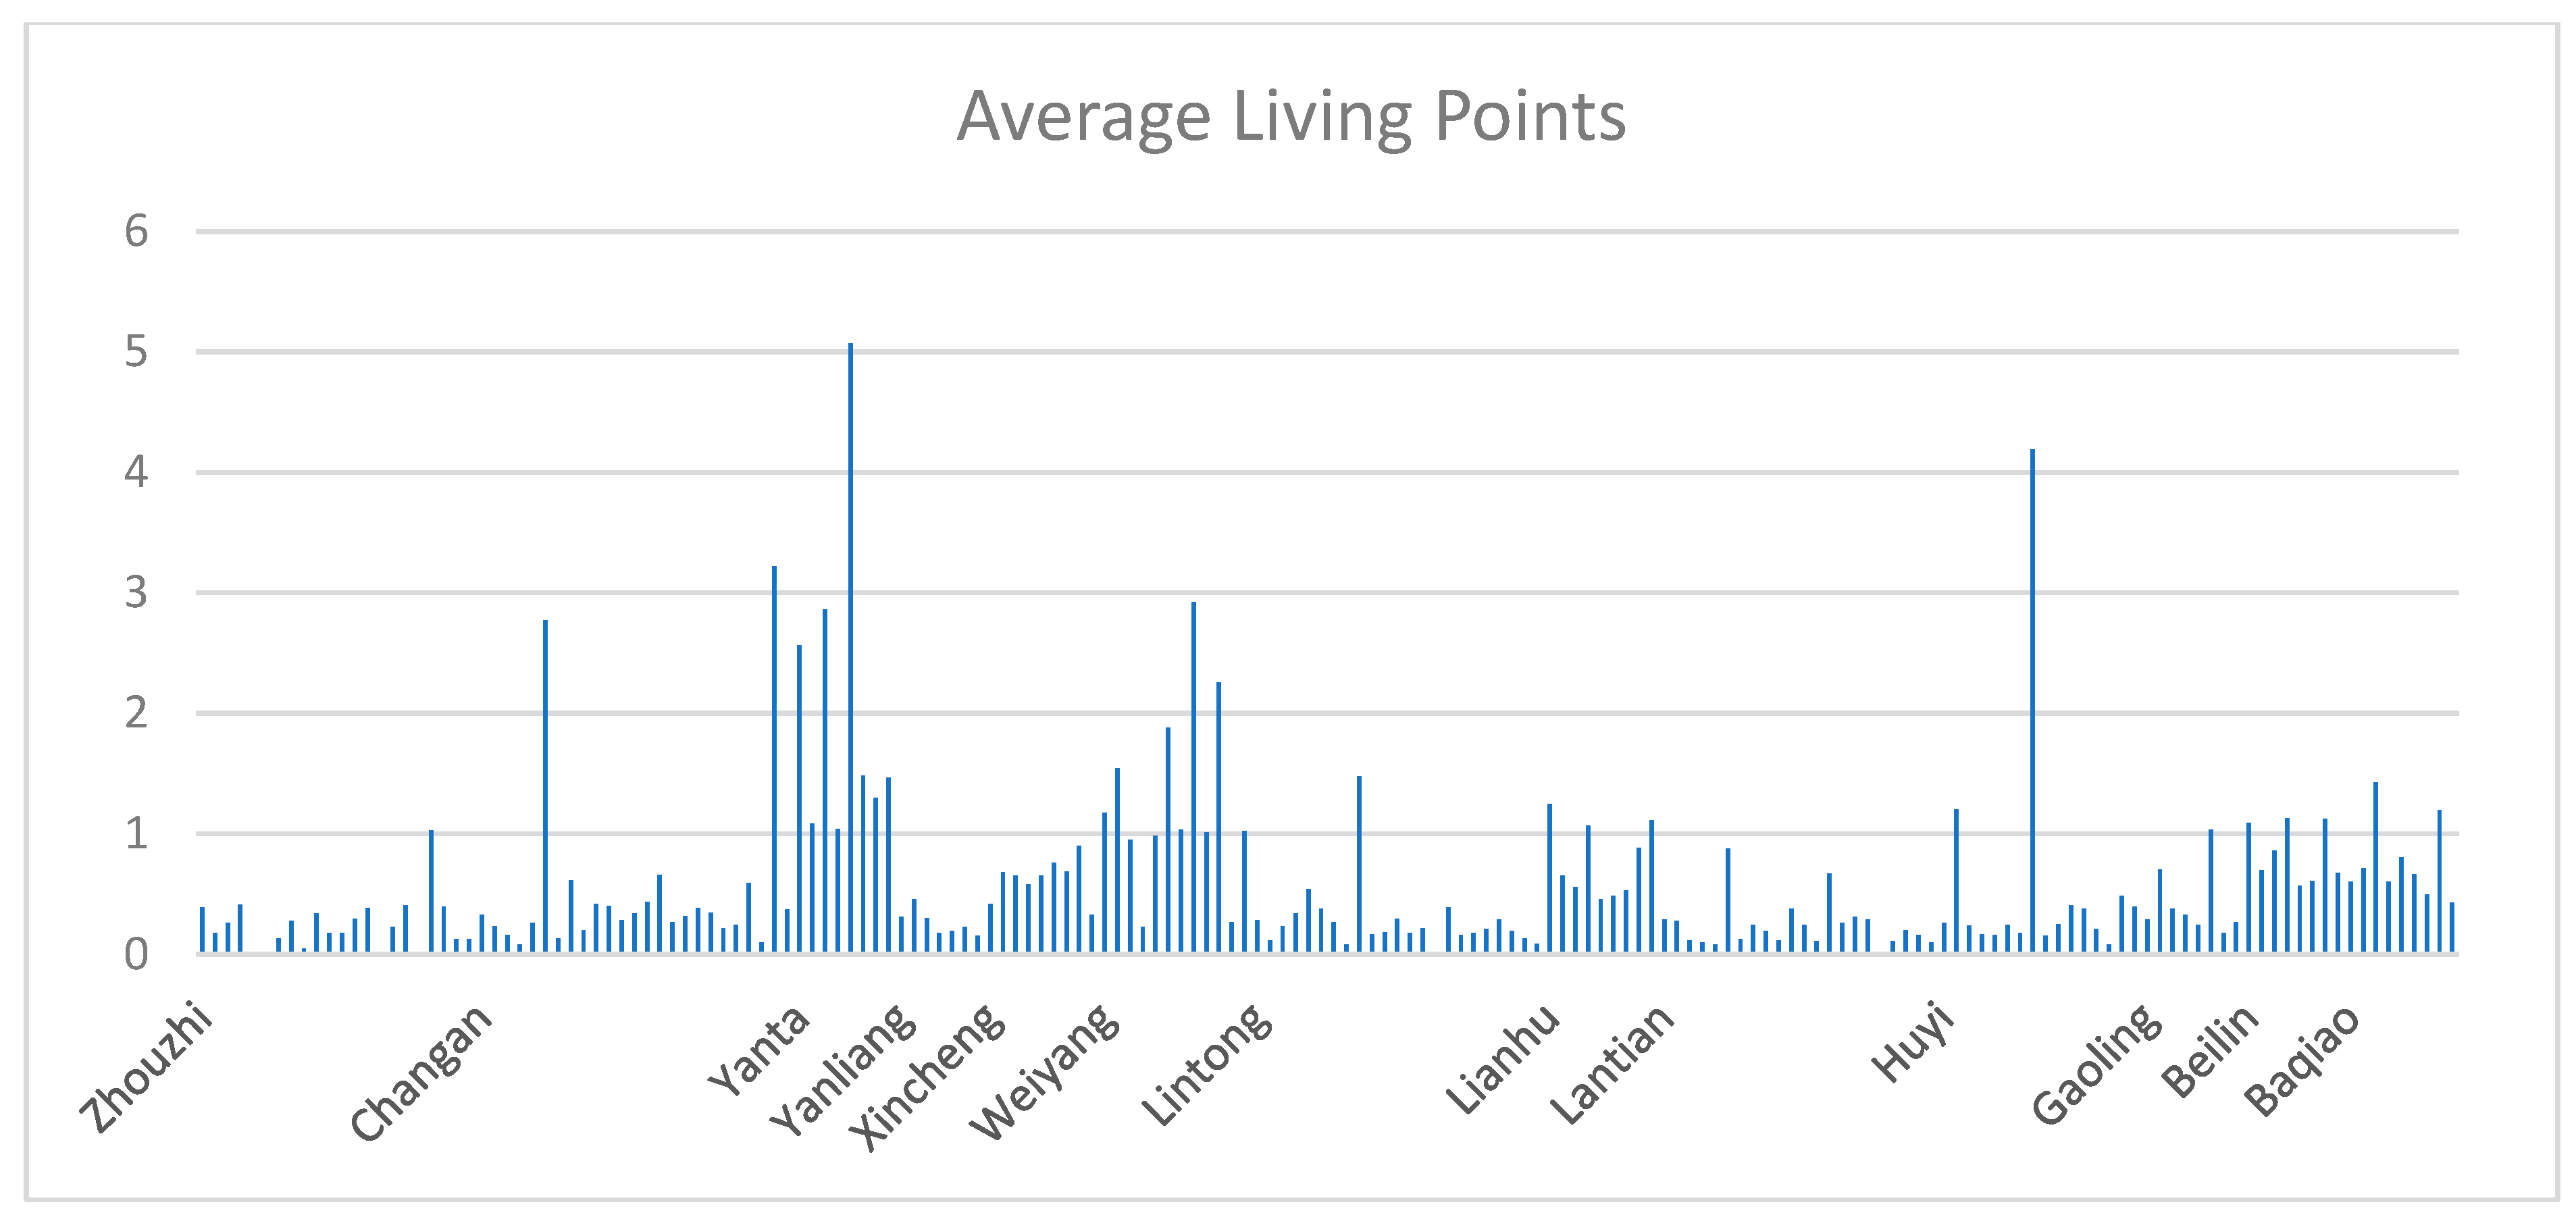
The quality of the human settlement environment in the central city of Beijing is medium to high, and the quality at the junction of the main city and suburbs is excellent. On the contrary, the quality of the suburbs around the main city is relatively low-end. As illustrated in
Figure 4 and
Figure 5, there is a noticeable difference in the overall residential environment points between Beijing and Xi’an. Specifically, the residential environment scores across different administrative districts in Beijing show a relatively even distribution, implying a balanced scenario. In contrast, the scores in Xi’an’s districts manifest a significant disparity, indicating an uneven distribution of local resources in the city. For Beijing, the residential environment in Tongzhou District, Haidian District, Fengtai District, Dongcheng District, and other places is excellent; its high quality may be due to the high greening rate and high vegetation coverage rate. However, the living environment of the surrounding areas outside the main city is poor, mostly because they are not yet developed, and the greening coverage rate is low. Compared to Beijing, the distribution of the human settlement environment in Xi’an shows a different pattern. Although its high-scoring areas, such as Baqiao District, Lantian County, and Lintong District, are similar to those in Beijing, the environmental quality of the city center is only medium, and the areas with the lowest scores are mainly located in the eastern part of the city. This situation may be due to the presence of a large amount of farmland in this area, resulting in a smaller area of open space, and the green area is relatively low.
4.1.2. Living Environment Analysis
In observing the distribution of environmental quality scores in Beijing, no clear pattern was found. However, areas with medium to high scores tend to be concentrated in the southeastern part of Beijing, while scores in the western and northern areas are relatively lower. This distribution is closely related to the distribution of local education, healthcare, food retail, and workplaces. In terms of educational resources, although Beijing has many primary schools, their distribution has a clear centrality, concentrated in the city center and gradually decreasing outward. The distribution of middle schools and universities is even more concentrated, especially higher education resources, which are mainly located in Haidian and Changping districts. In addition, commercial office locations are mainly concentrated in the main city and its surroundings, resulting in long commuting times in surrounding areas, thus affecting the environmental quality scores. The distribution of food retail areas also affects the living environment points and is primarily concentrated from the southwest to southeast of the main city. The distribution of medical facilities and nursing homes also exhibits a pattern, with medical facilities concentrated near the city center and nursing homes mainly located in the city center, decreasing gradually with distance. As shown in
Figure 6, the quality score of the living environment in Beijing is closely related to the distribution of educational, medical, and commercial resources within the city, with these resources predominantly concentrated in the city center. Although areas outside the city center have relatively fewer living resources, the differences in scores between administrative districts are not particularly significant on the whole, indicating that there is not an extreme imbalance in resource distribution.
In contrast to Beijing, Xi’an’s environmental quality scores present a clear pattern, with the highest scores in the areas surrounding the main city, lower in the city center, and gradually decreasing outward. As depicted in
Figure 7 and
Figure 8, there is a notable imbalance in the distribution of living resources in Xi’an city. Aside from a few individual administrative districts and streets that score exceptionally high in terms of living environment, many peripheral areas exhibit significantly lower scores. These data underscore the issue of excessive resource concentration within Xi’an, suggesting potential areas for optimization in urban planning and resource management. In terms of education, primary and middle schools in Xi’an are mainly concentrated in the main city, with educational resources gradually decreasing with distance. Higher education resources are primarily concentrated in the southern part of the main city. Office locations are mainly concentrated in the southwest of the main city, with no office locations outside the main city. Unlike Beijing, the distribution of nursing homes and medical facilities in Xi’an shows a pattern of higher concentration in the center, decreasing gradually outward. The agglomeration of educational and medical resources is overly conspicuous, with resources being extremely unevenly distributed. Food retail areas in Xi’an are also concentrated in the main city and its surroundings, further enhancing the quality of life for residents in the main city and lowering the environmental quality scores of the surrounding areas.
In summary, there are significant differences in the environmental quality score distribution characteristics of Beijing and Xi’an, mainly due to differences in the distribution of resources such as education, healthcare, food retail, and office locations. The distribution of resources in Beijing is more dispersed, showing a trend of gradually decreasing from the city center; in contrast, the resource distribution in Xi’an is more concentrated, with the richness of resources in the main city far exceeding that of the surrounding areas. This difference in resource distribution directly affects the environmental quality scores of residents in the two cities.
4.1.3. Entertainment Analysis
In the distribution of entertainment facilities in Beijing, no clear uniform pattern was observed. However, it is evident that Miyun District, the eastern part of Tongzhou District, and Chaoyang District have richer entertainment facilities. The entertainment facilities scores in the center of Beijing and streets and townships near the suburbs are relatively low, while those in the outermost townships are generally at a medium to slightly below medium level. Miyun District and Tongzhou District, as developing regions, are filled with numerous shopping malls and cinemas and other entertainment facilities. In these districts’ undeveloped areas, local residents also offer leisure and entertainment venues such as agritourism. Chaoyang District has many historical commercial districts, and these commercial districts have gathered a large number of shopping malls and cinemas. Additionally, senior activity centers and outdoor fitness venues are more distributed in the main city, gradually decreasing toward the periphery. Special entertainment facilities, such as go-kart tracks, picking gardens, and party venues, are mainly concentrated in the main city and its surrounding areas, as well as in the outermost streets and townships of Beijing. However, in the western part of Tongzhou District and the inner areas of the outermost townships, such entertainment facilities are relatively few. Although the distribution of entertainment facilities in Beijing does not follow a clear pattern, most areas with low scores are adjacent to areas with high scores, and overall the distribution of entertainment resources is relatively equal.
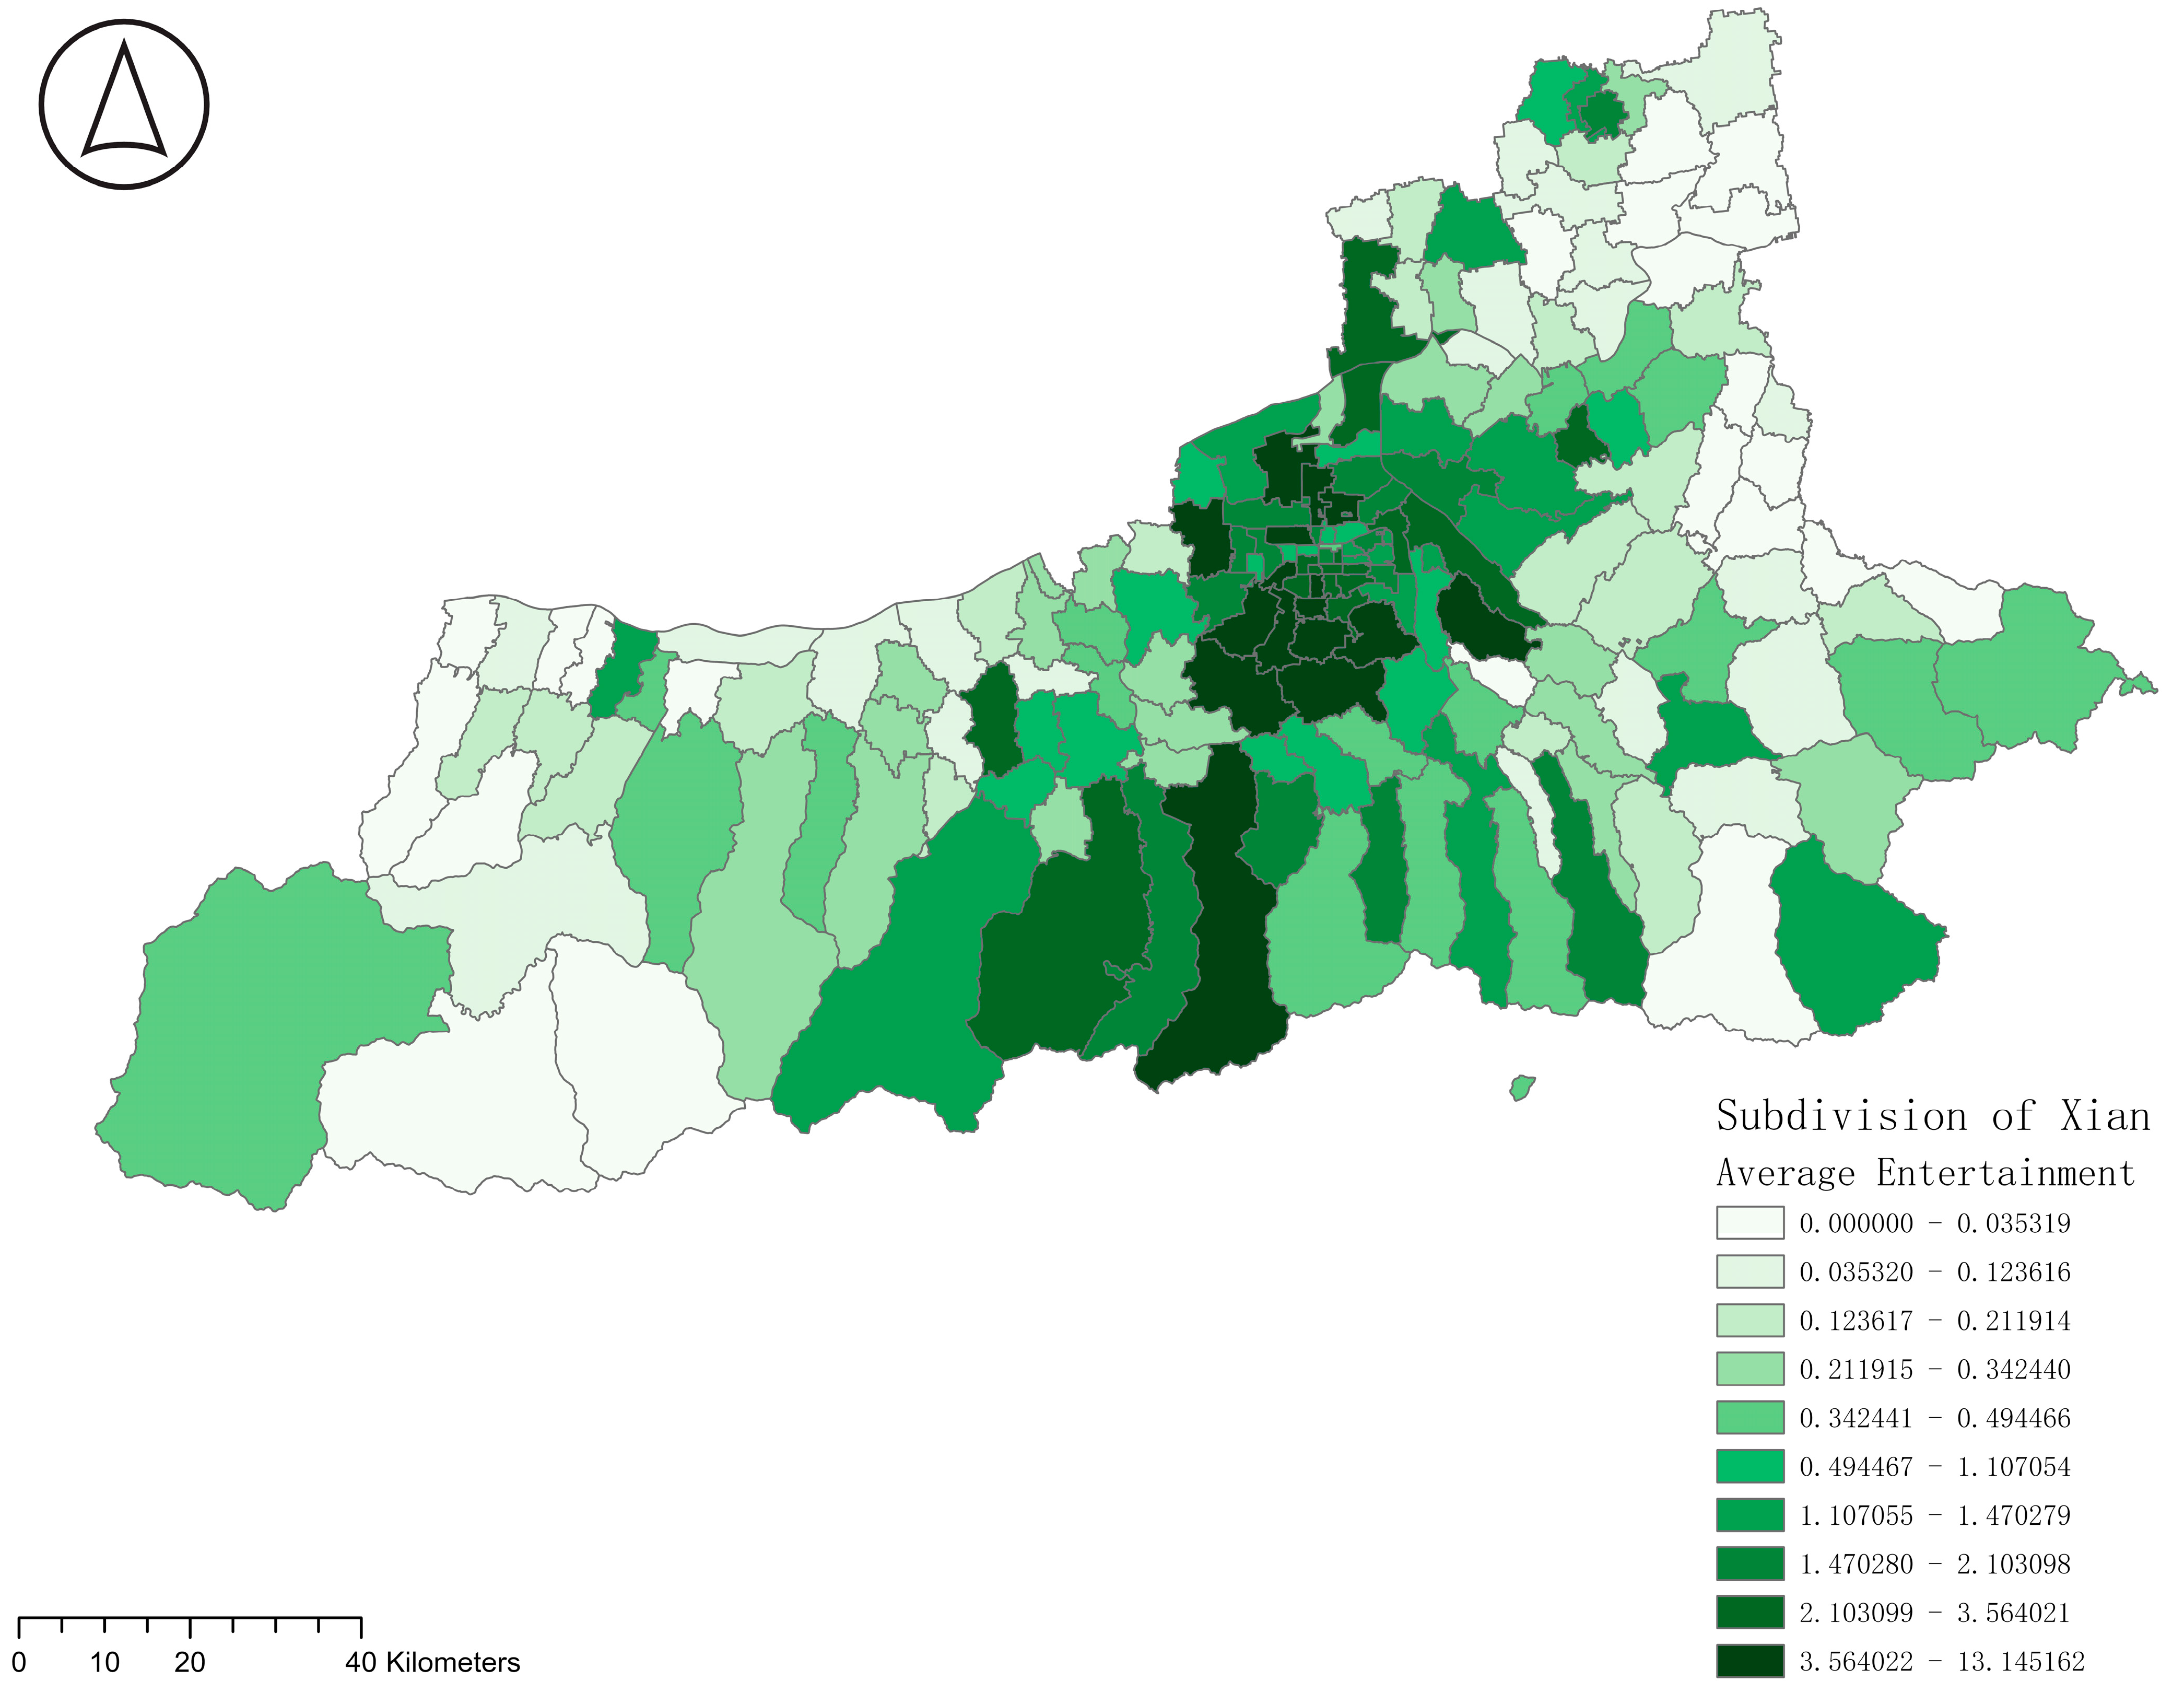
In contrast, the distribution of entertainment facilities in Xi’an shows a more noticeable pattern. The streets and townships south of the main city and the streets in the northwest, especially in Weiyang District, Baqiao District, and Chang’an District, have the highest entertainment facilities scores, which gradually decrease toward the east and west. Nearly all shopping centers and cinemas are concentrated in the main city. Although Huyi District and Lintong District also have shopping centers and cinemas, the number is relatively small, and the distribution is concentrated. In addition, senior activity centers and outdoor fitness venues are also concentrated in the main city, and there are very few such facilities outside the main city. While Xi’an has a multitude of leisure and entertainment facilities, including agritourism venues distributed throughout the city, the distribution outside the main city is relatively even, but the number of leisure and entertainment venues in the main city far exceeds that in the surrounding areas.
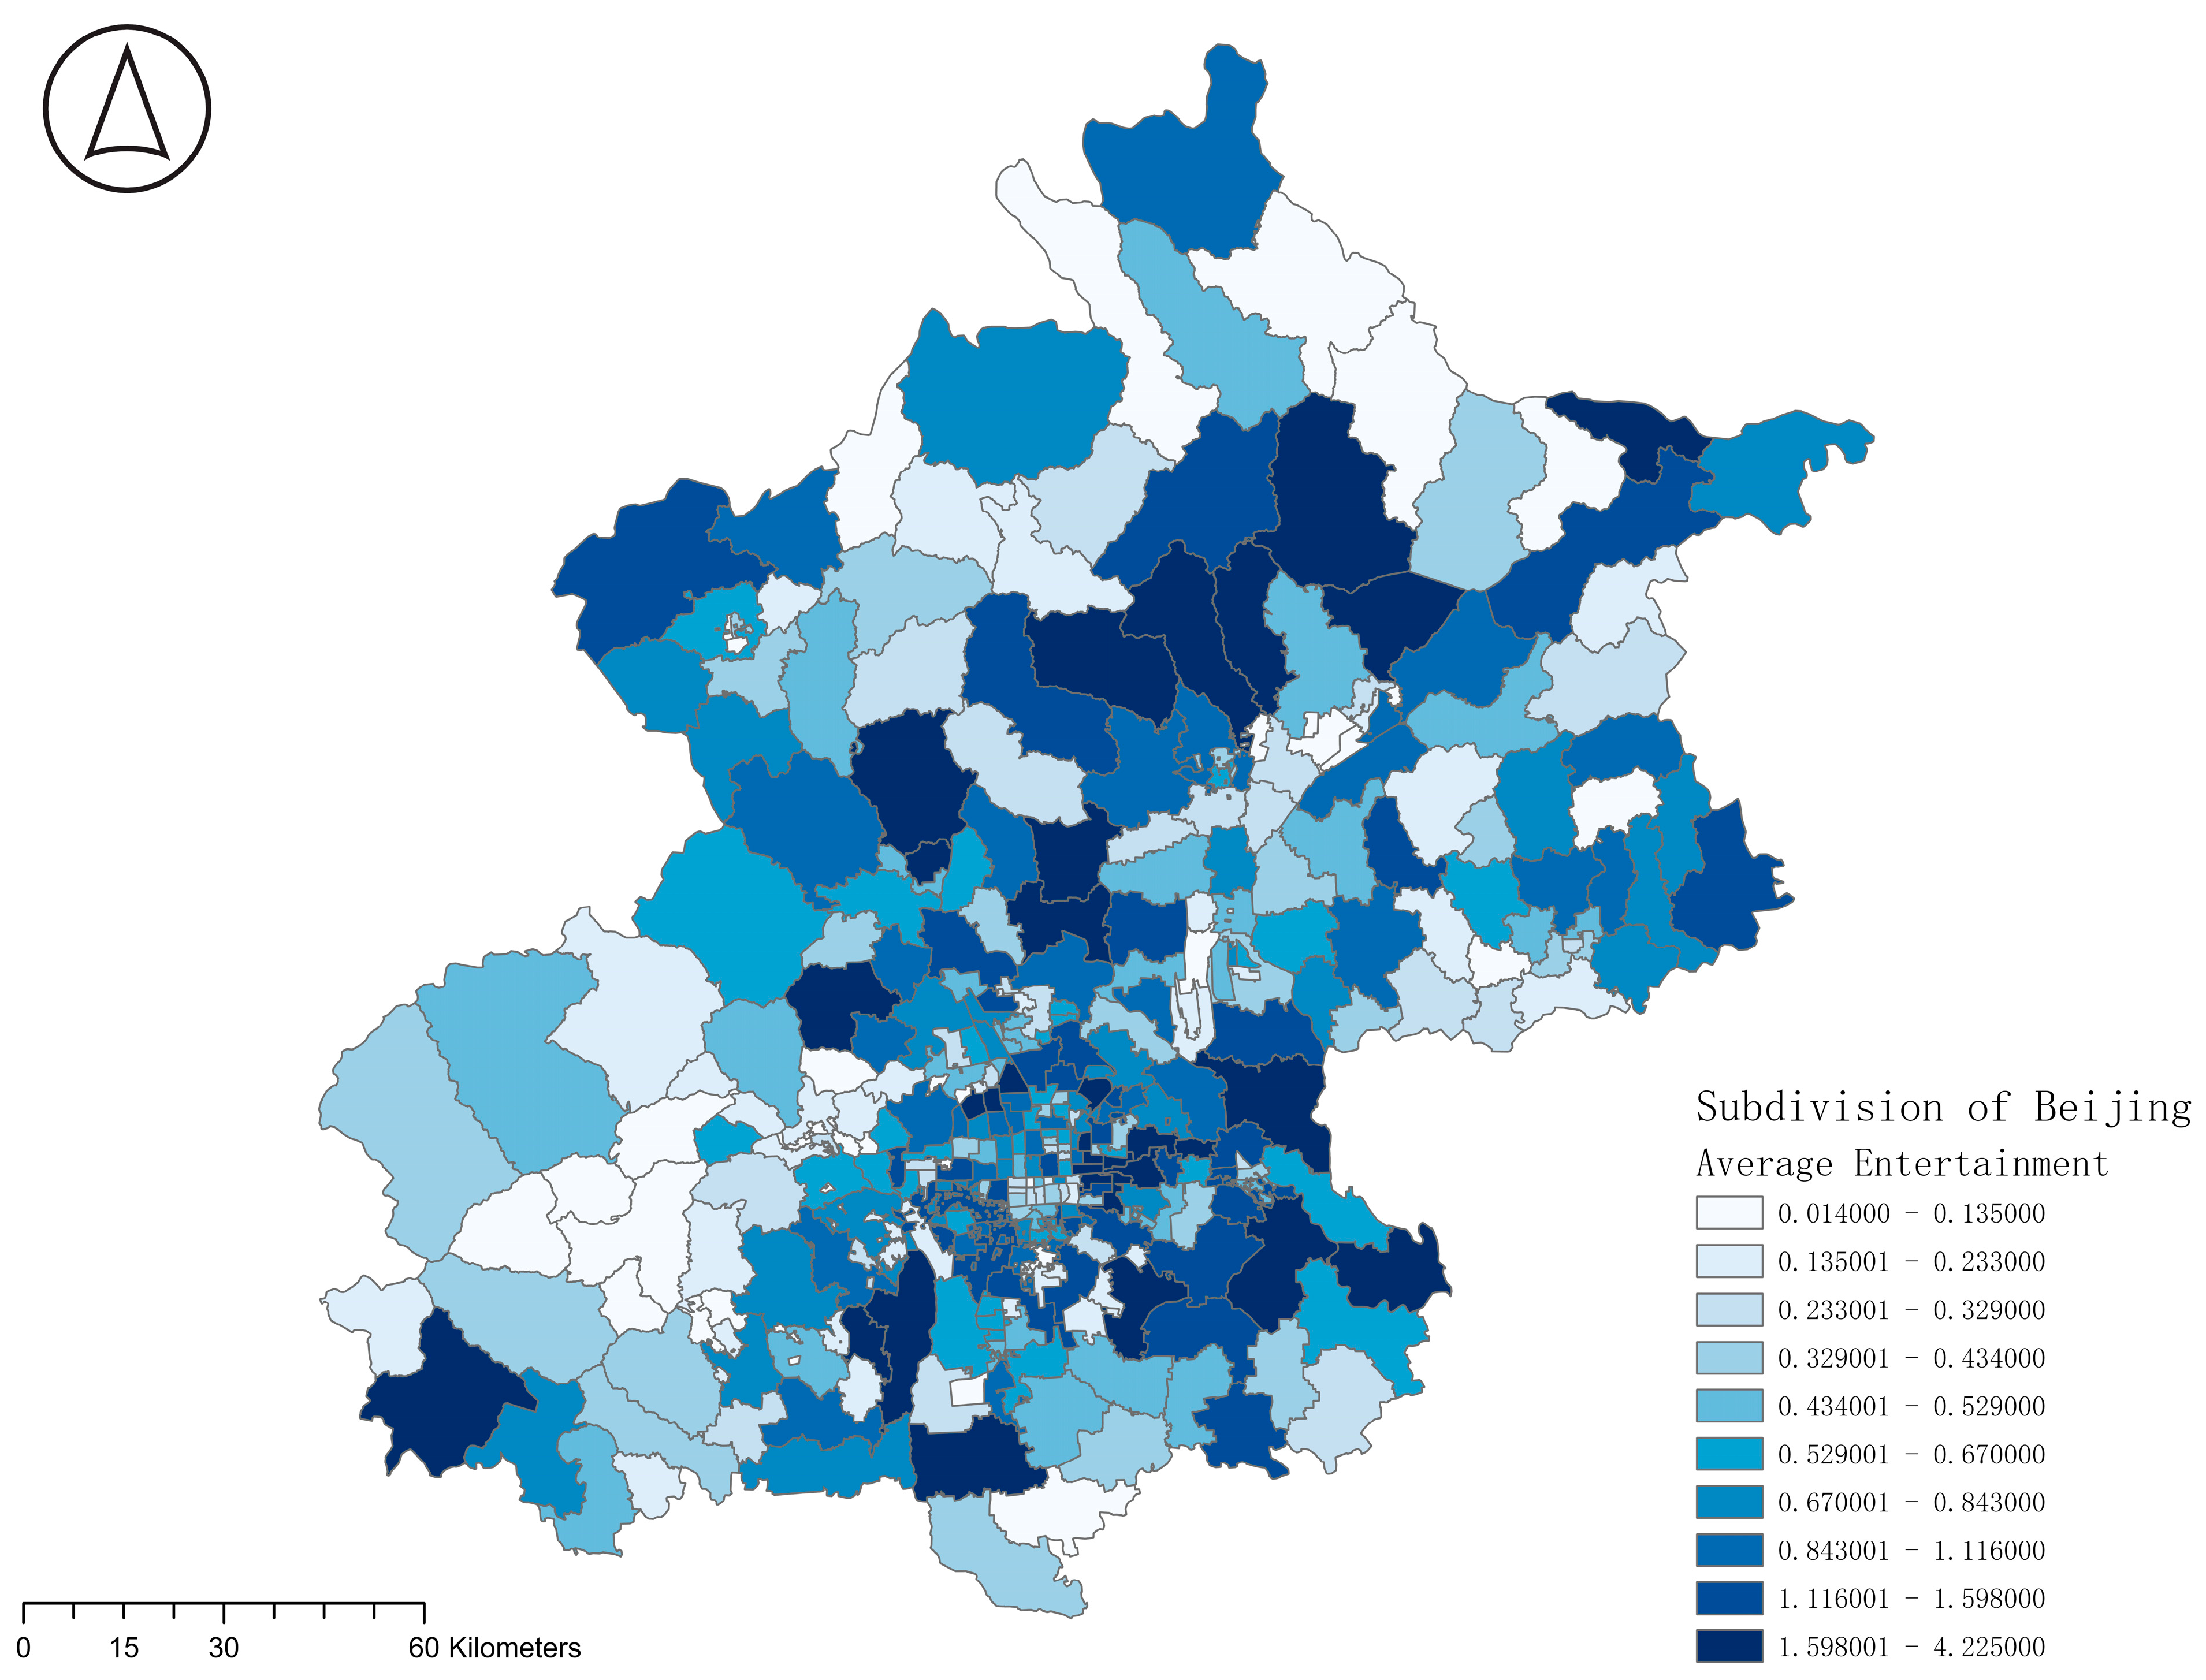
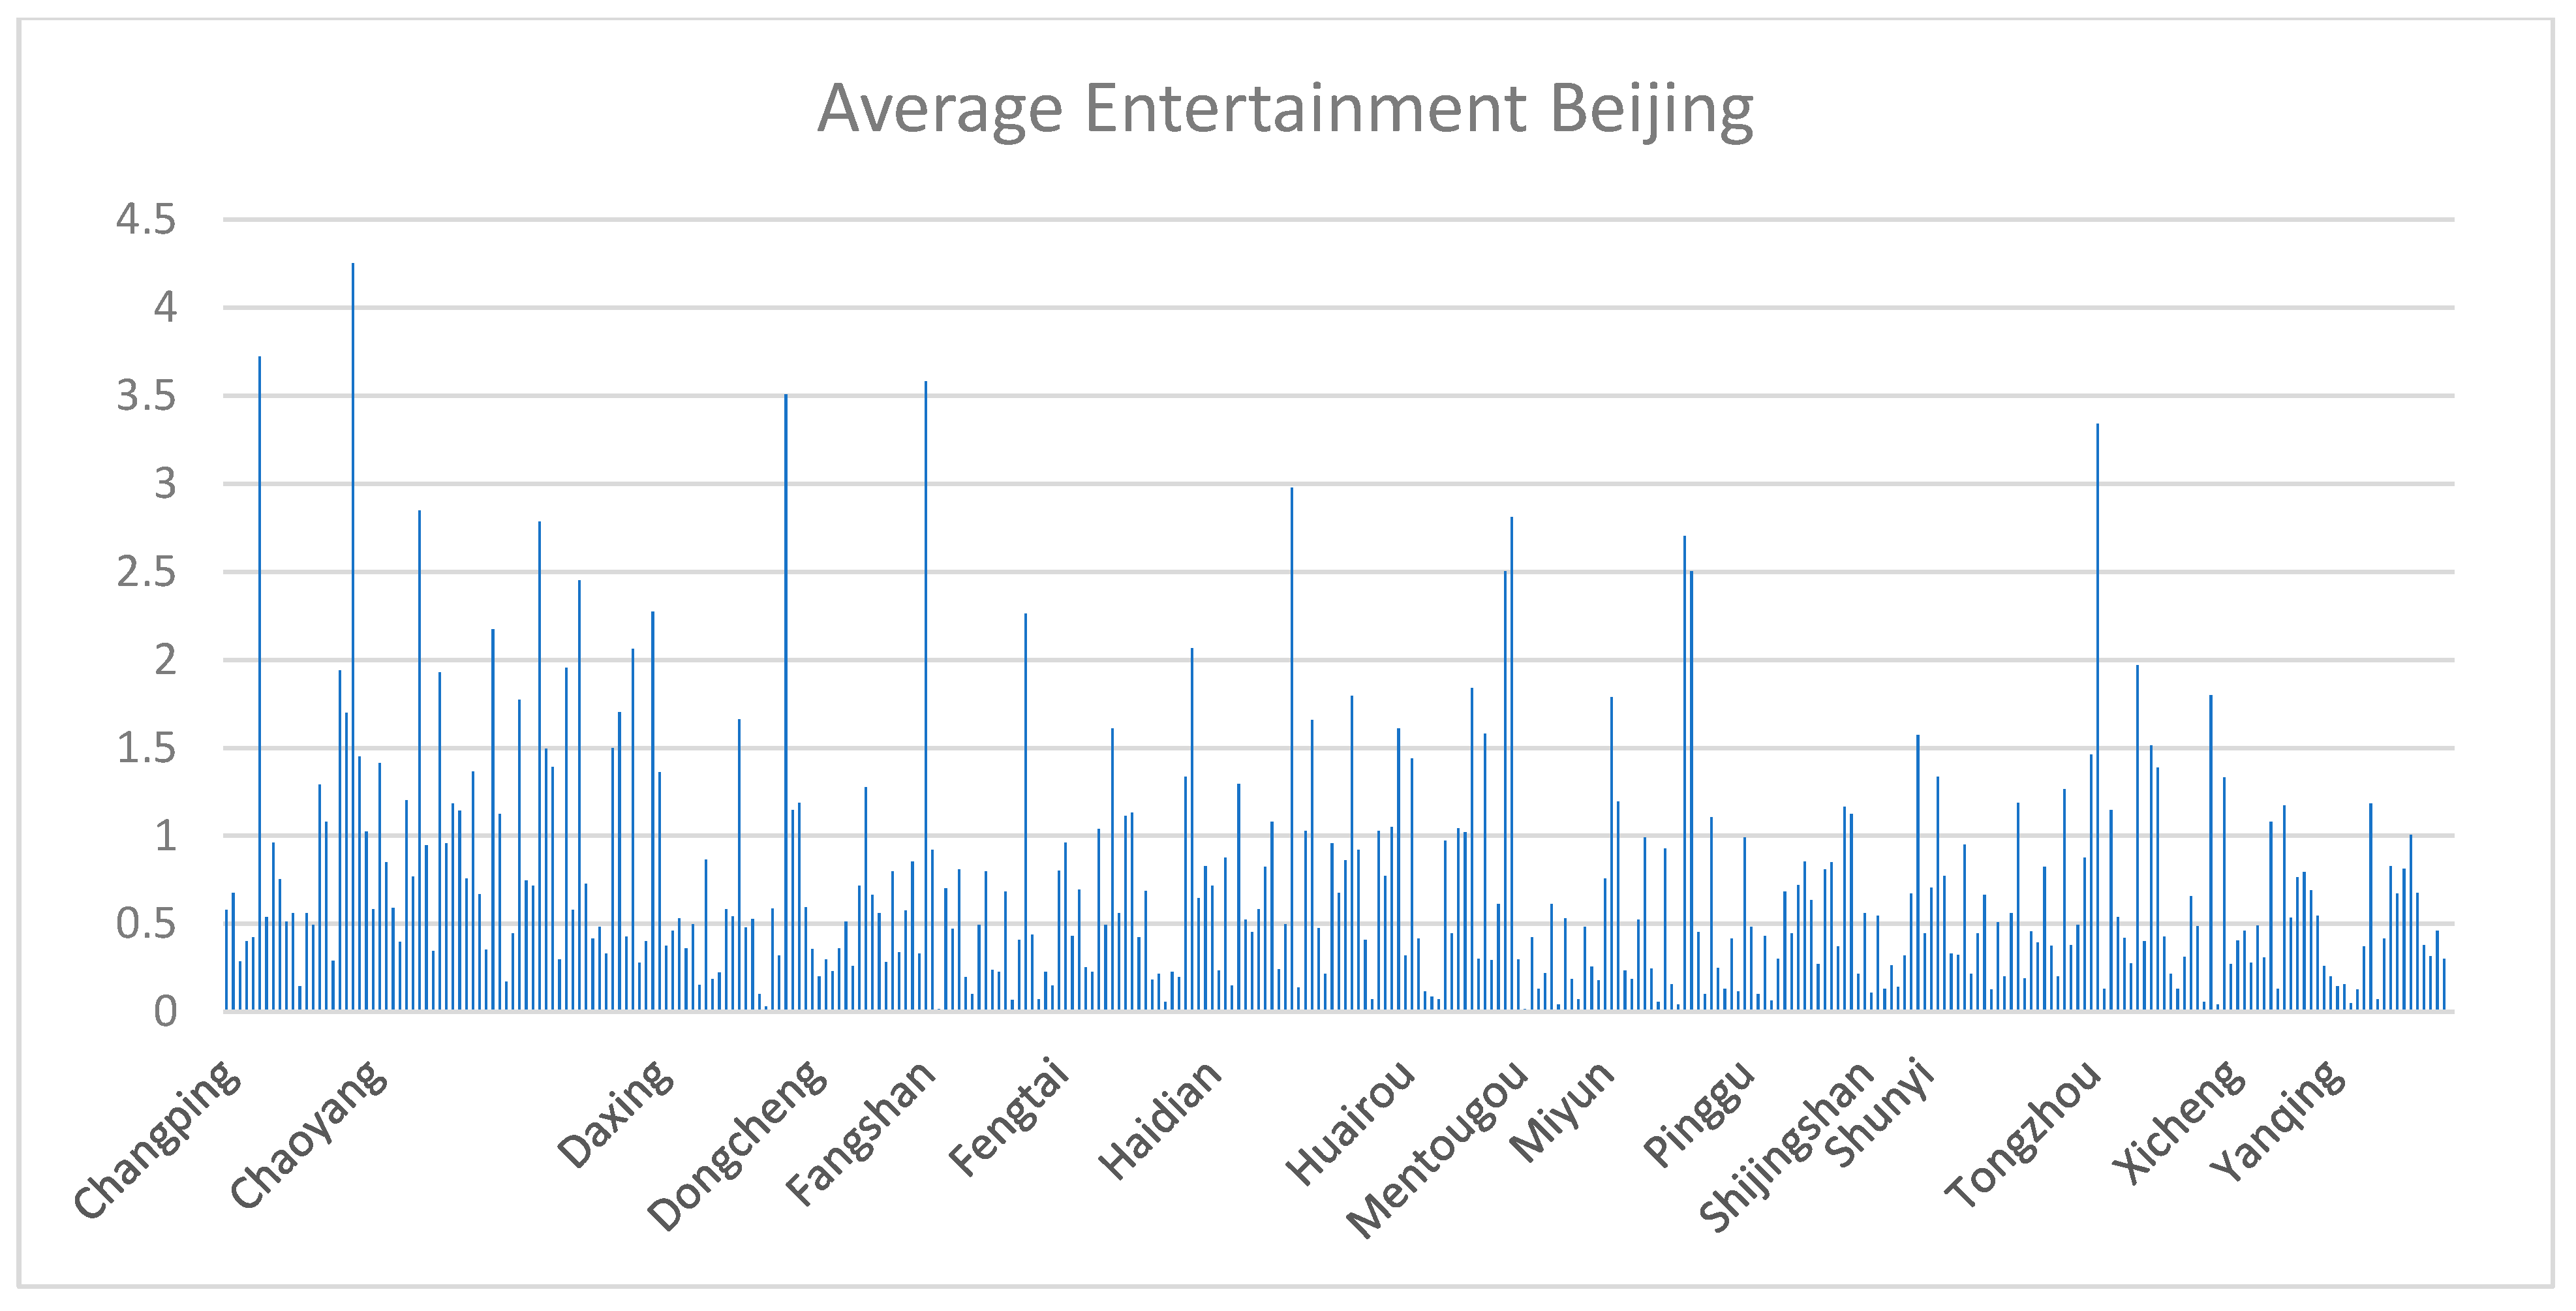
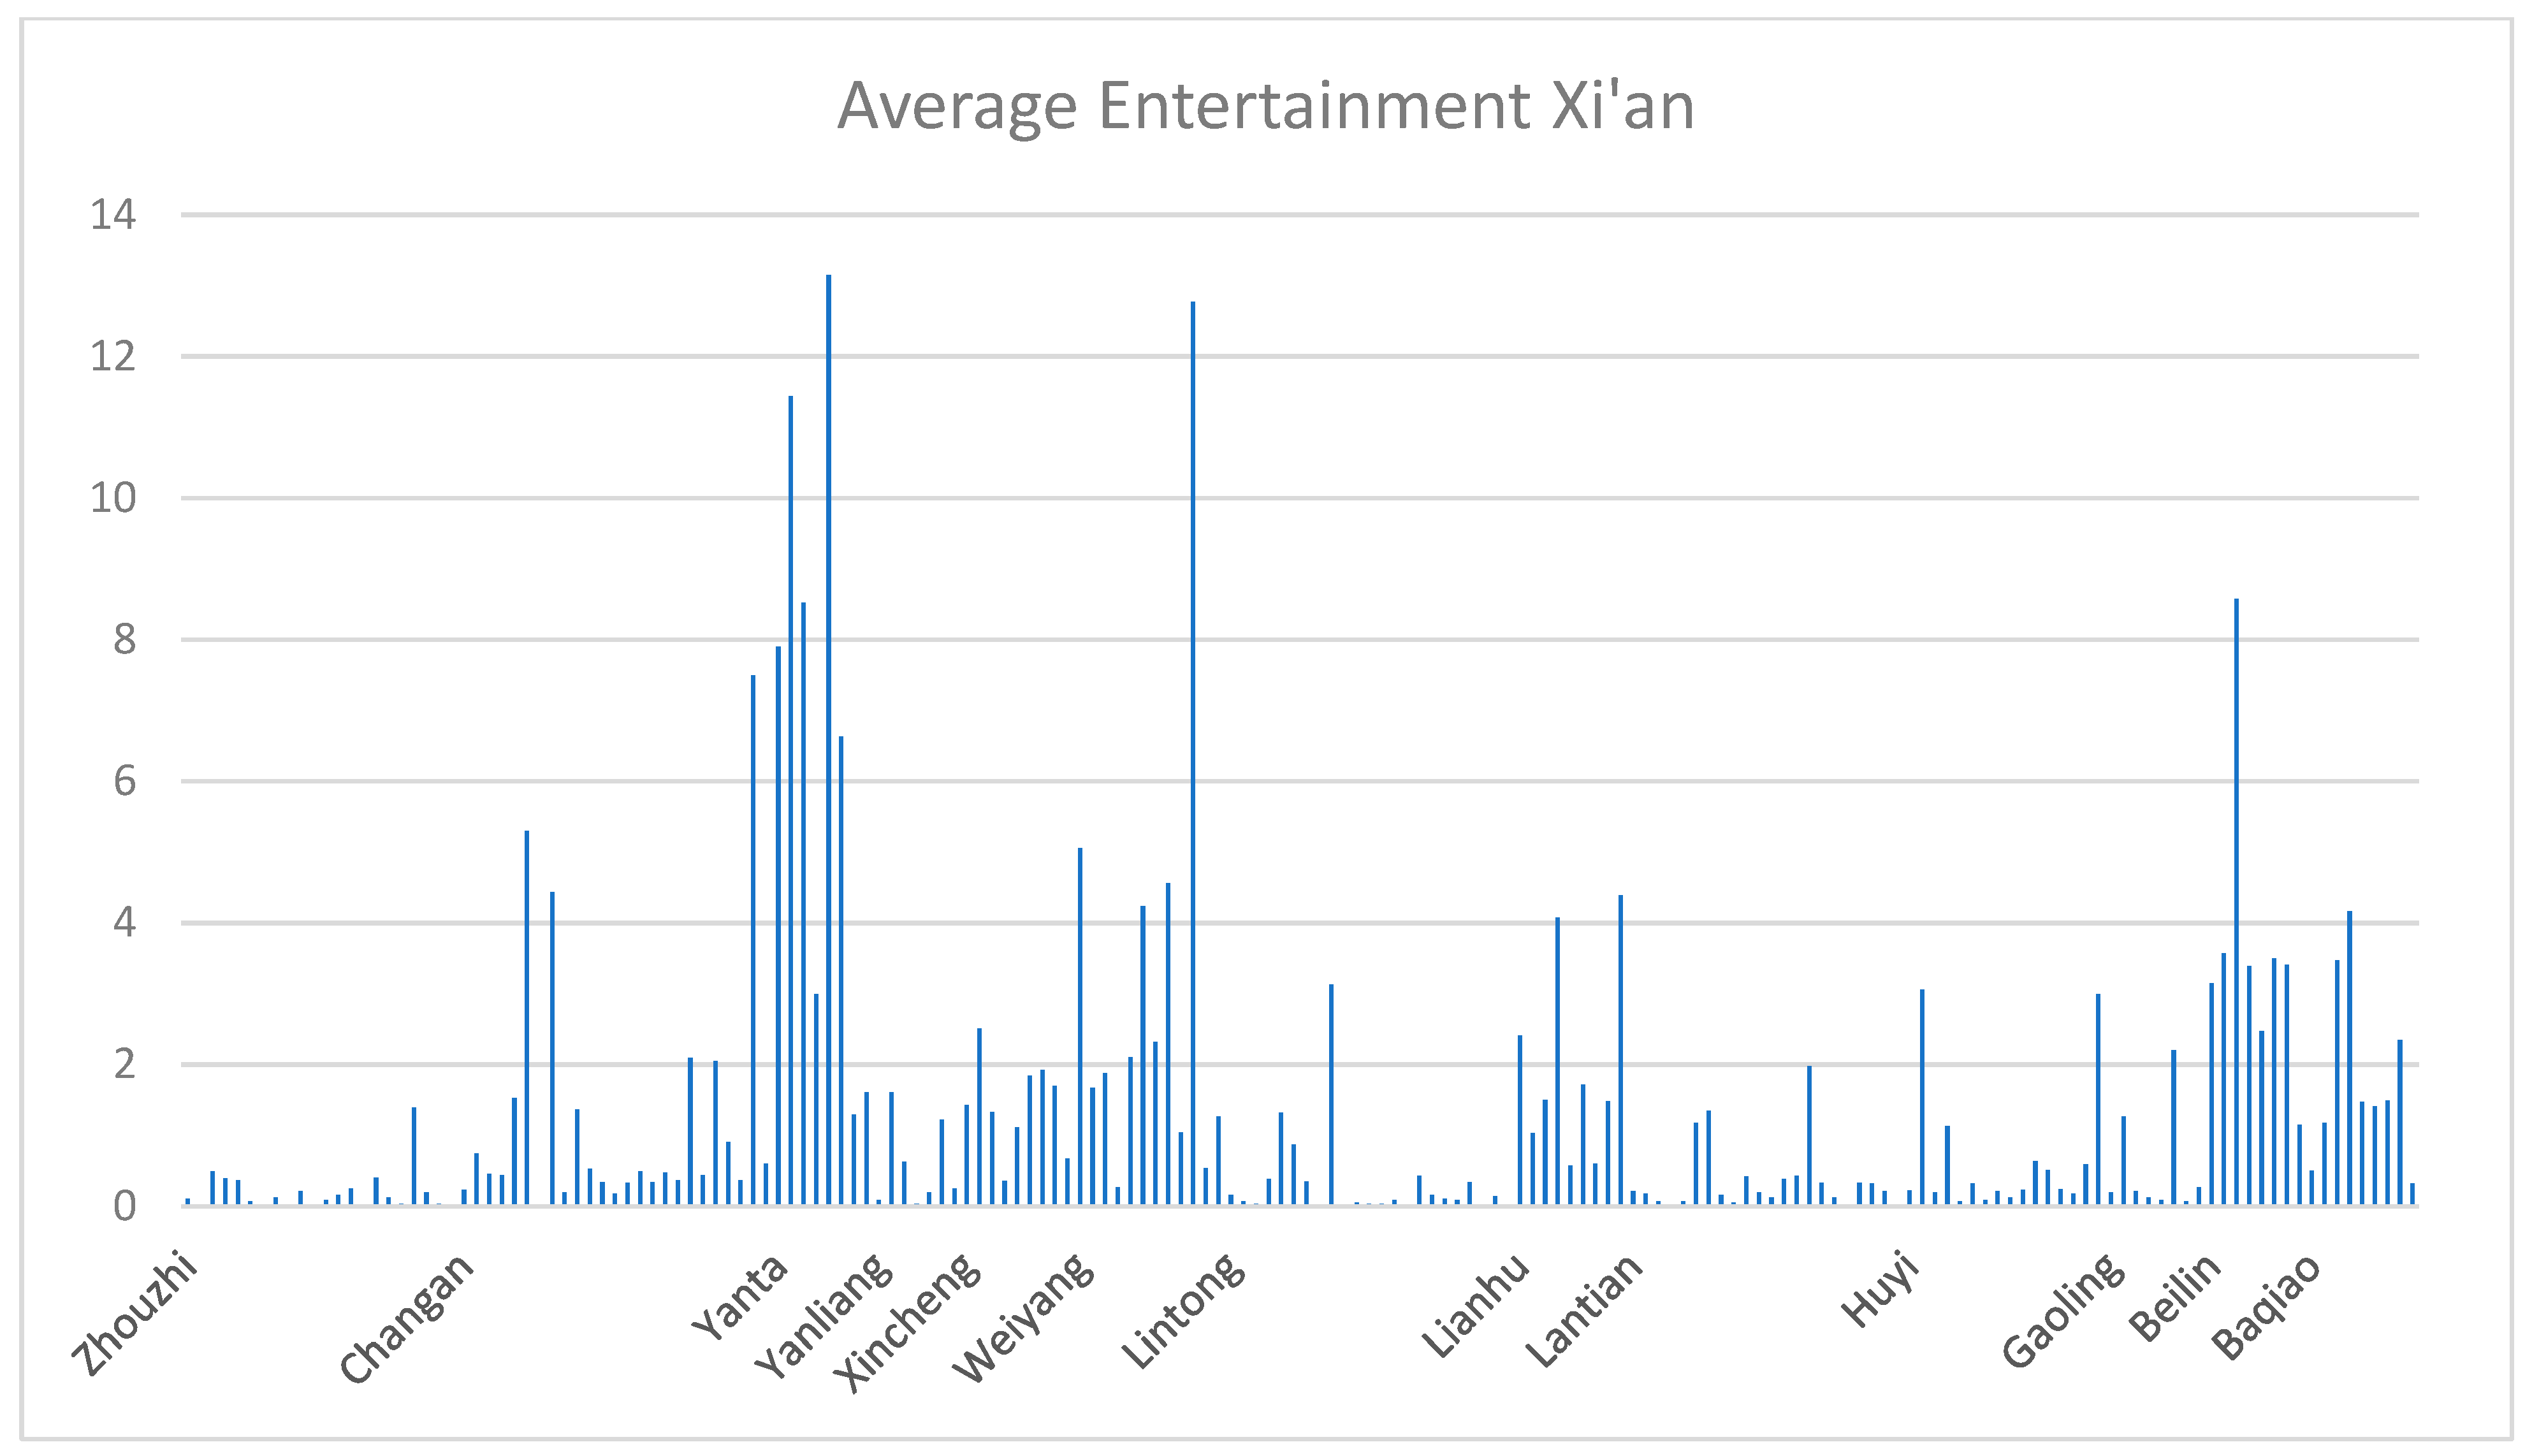
Although the distribution of entertainment facilities in Beijing does not show a clear pattern, its overall distribution is relatively equal. On the other hand, the entertainment facilities in Xi’an are mainly concentrated in the main city, gradually decreasing toward the outer regions, showing a distinct inequality. In addition,
Figure 9 below clearly show that each administrative district in Beijing has a certain number of entertainment facilities, including some built by local residents in the surrounding areas. However, as depicted in
Figure 10 and
Figure 11, Xi’an has significantly fewer entertainment venues in comparison, and most entertainment venues are only available in specific administrative districts, with many districts having very few venues. This might not only be related to resource inequality but might also have a connection to the local terrain, as some administrative districts in Xi’an have nearly half of their area located on slopes and other terrains.
4.1.4. Traffic Convenience Analysis
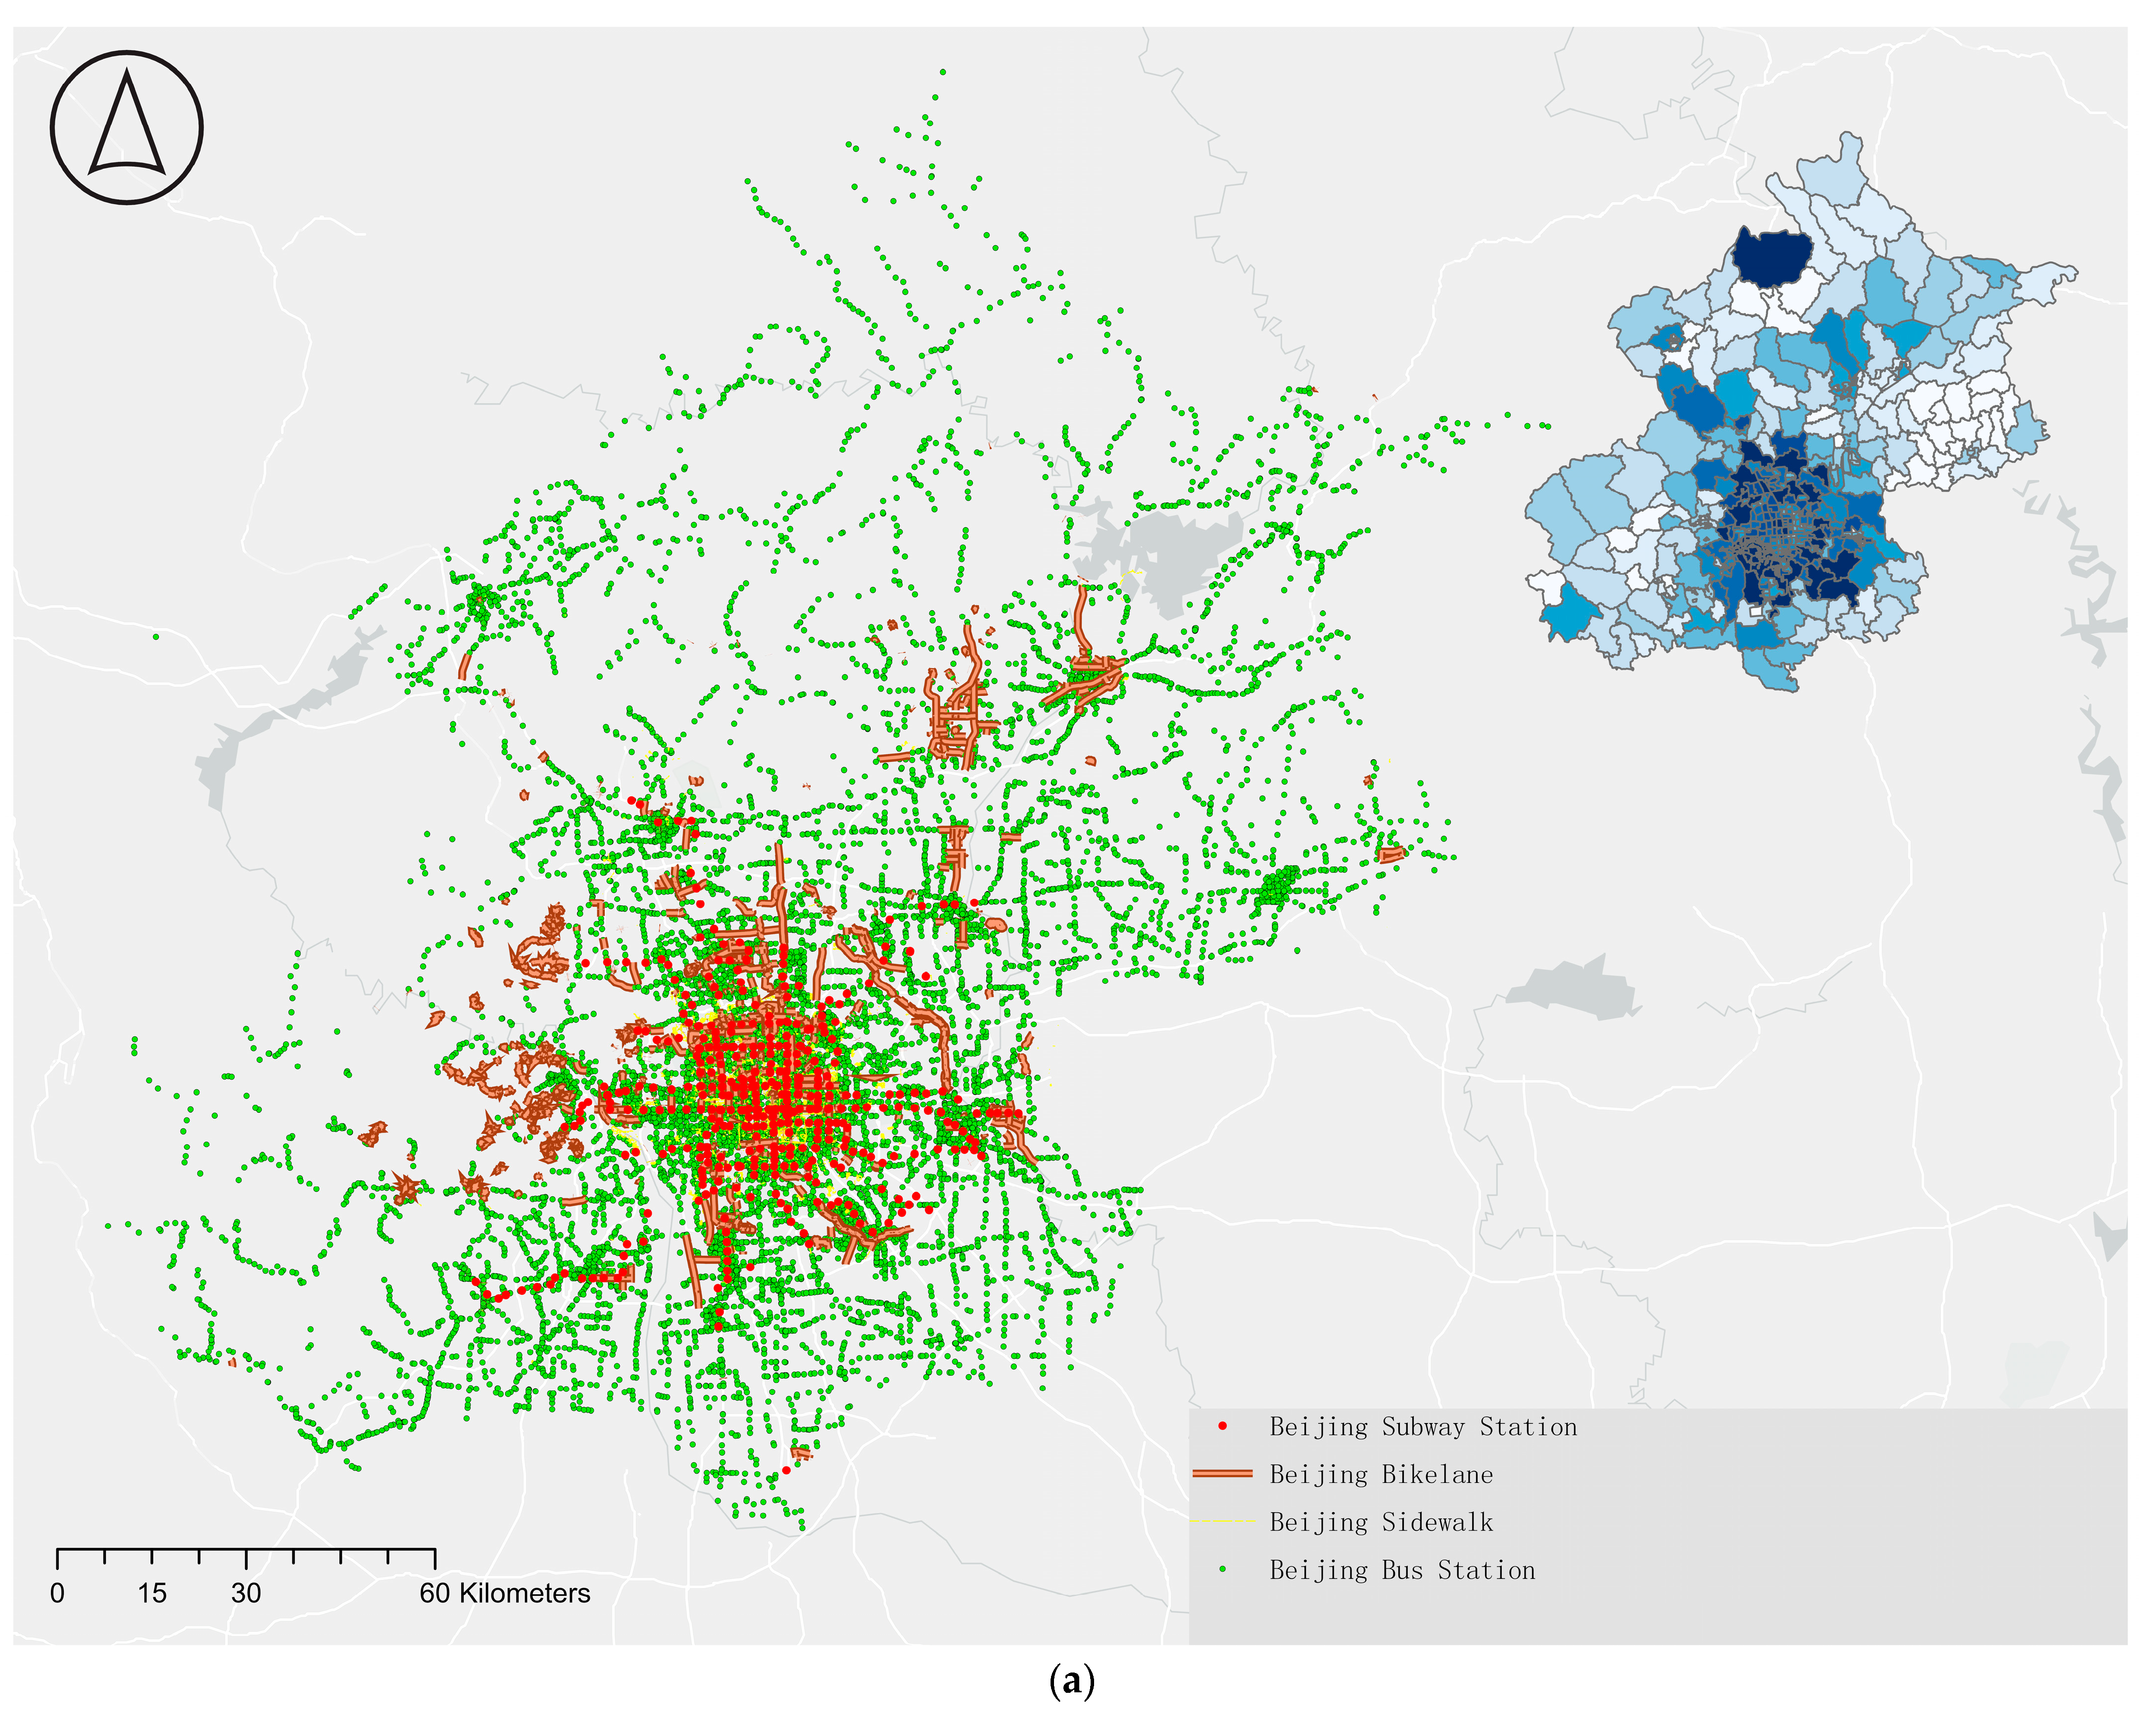
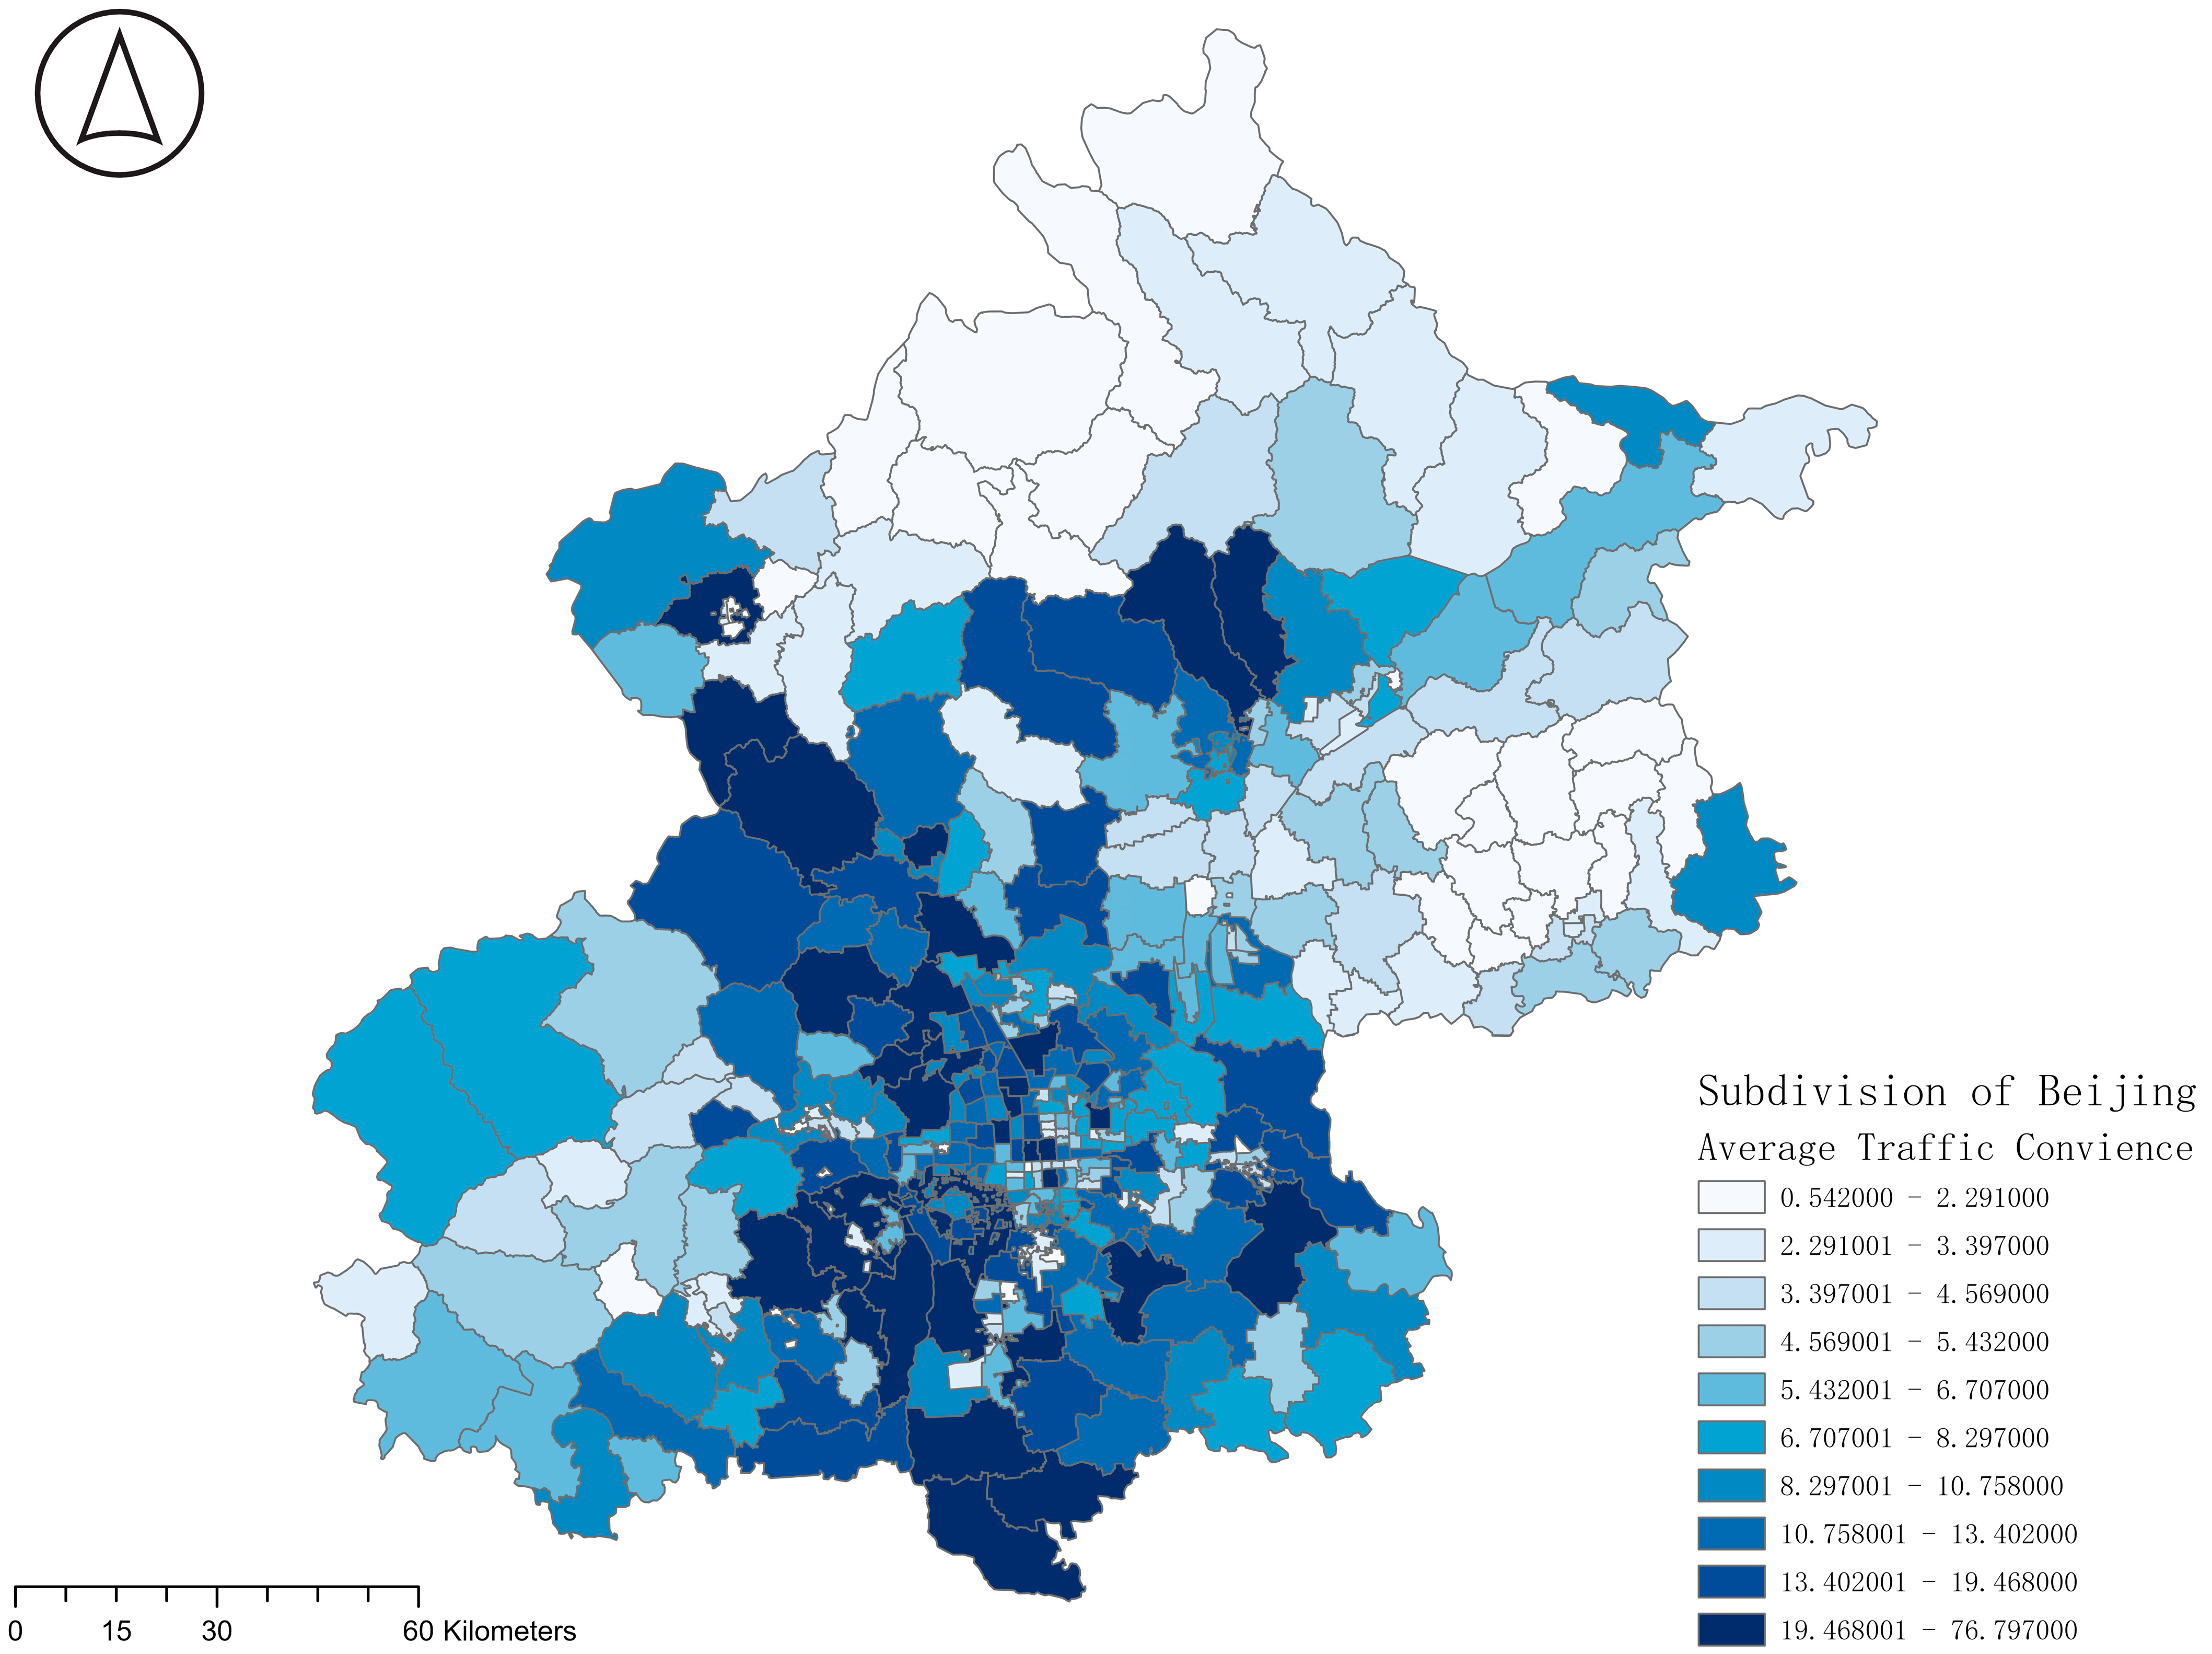
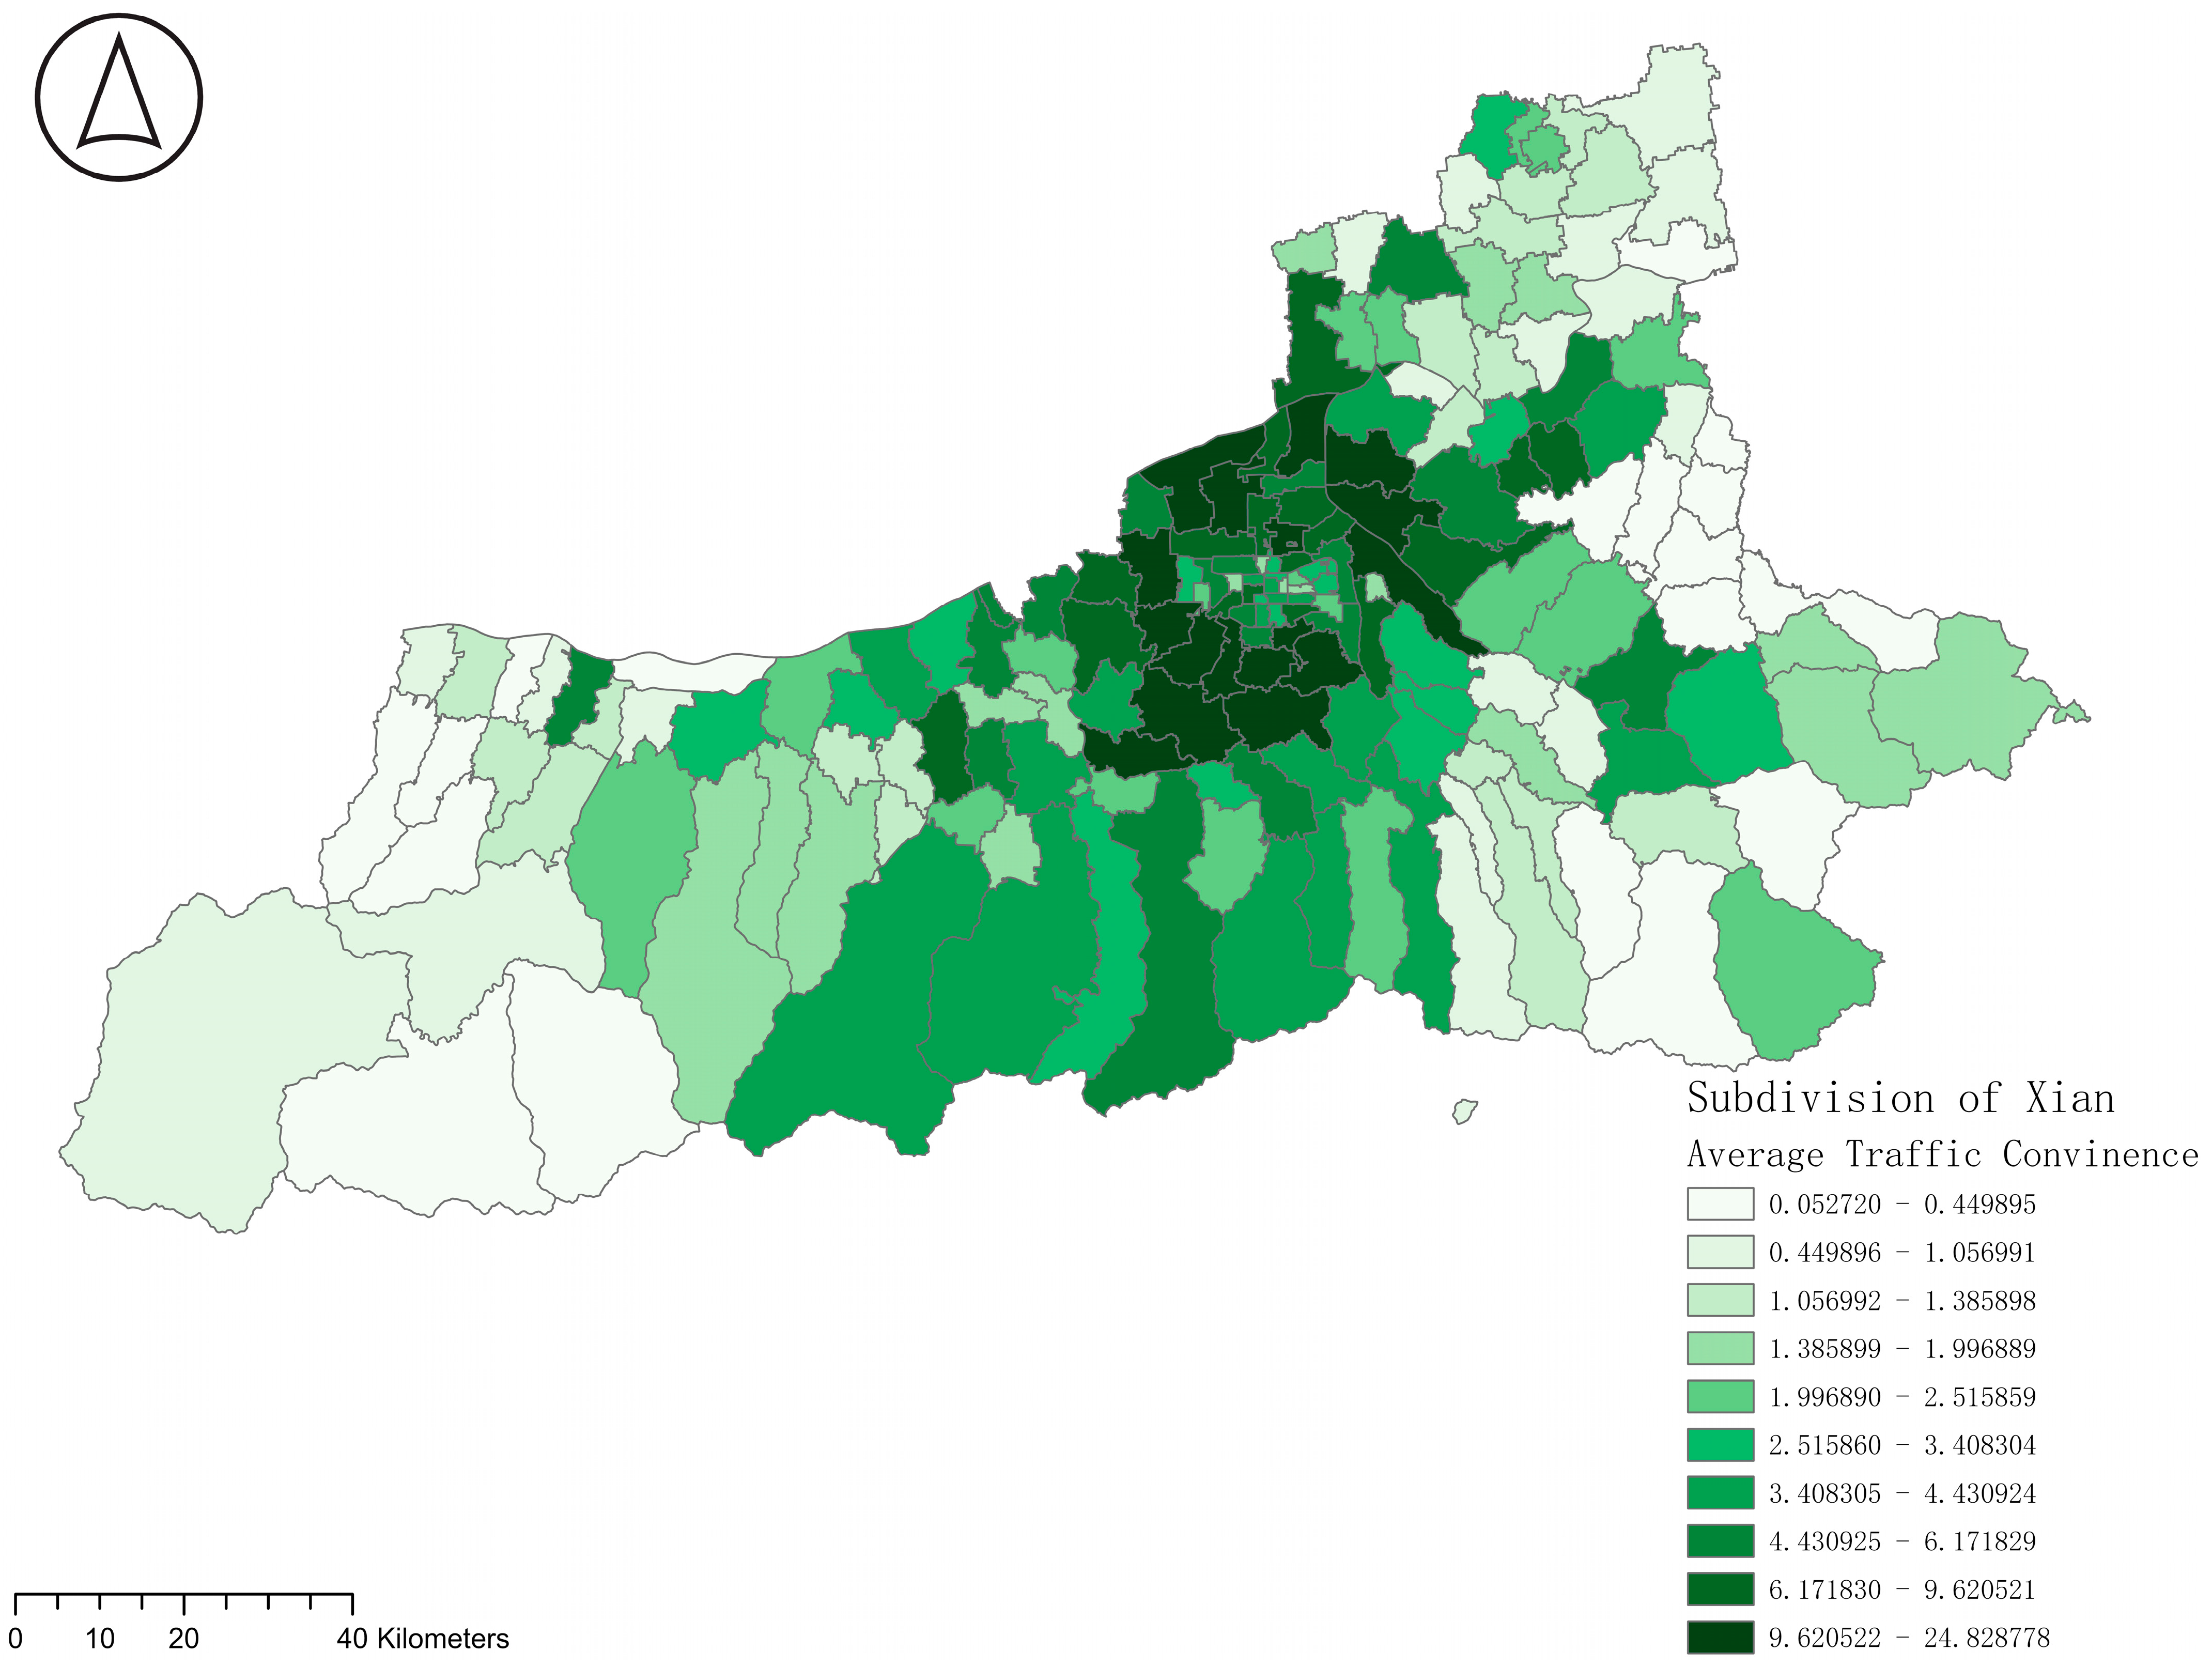
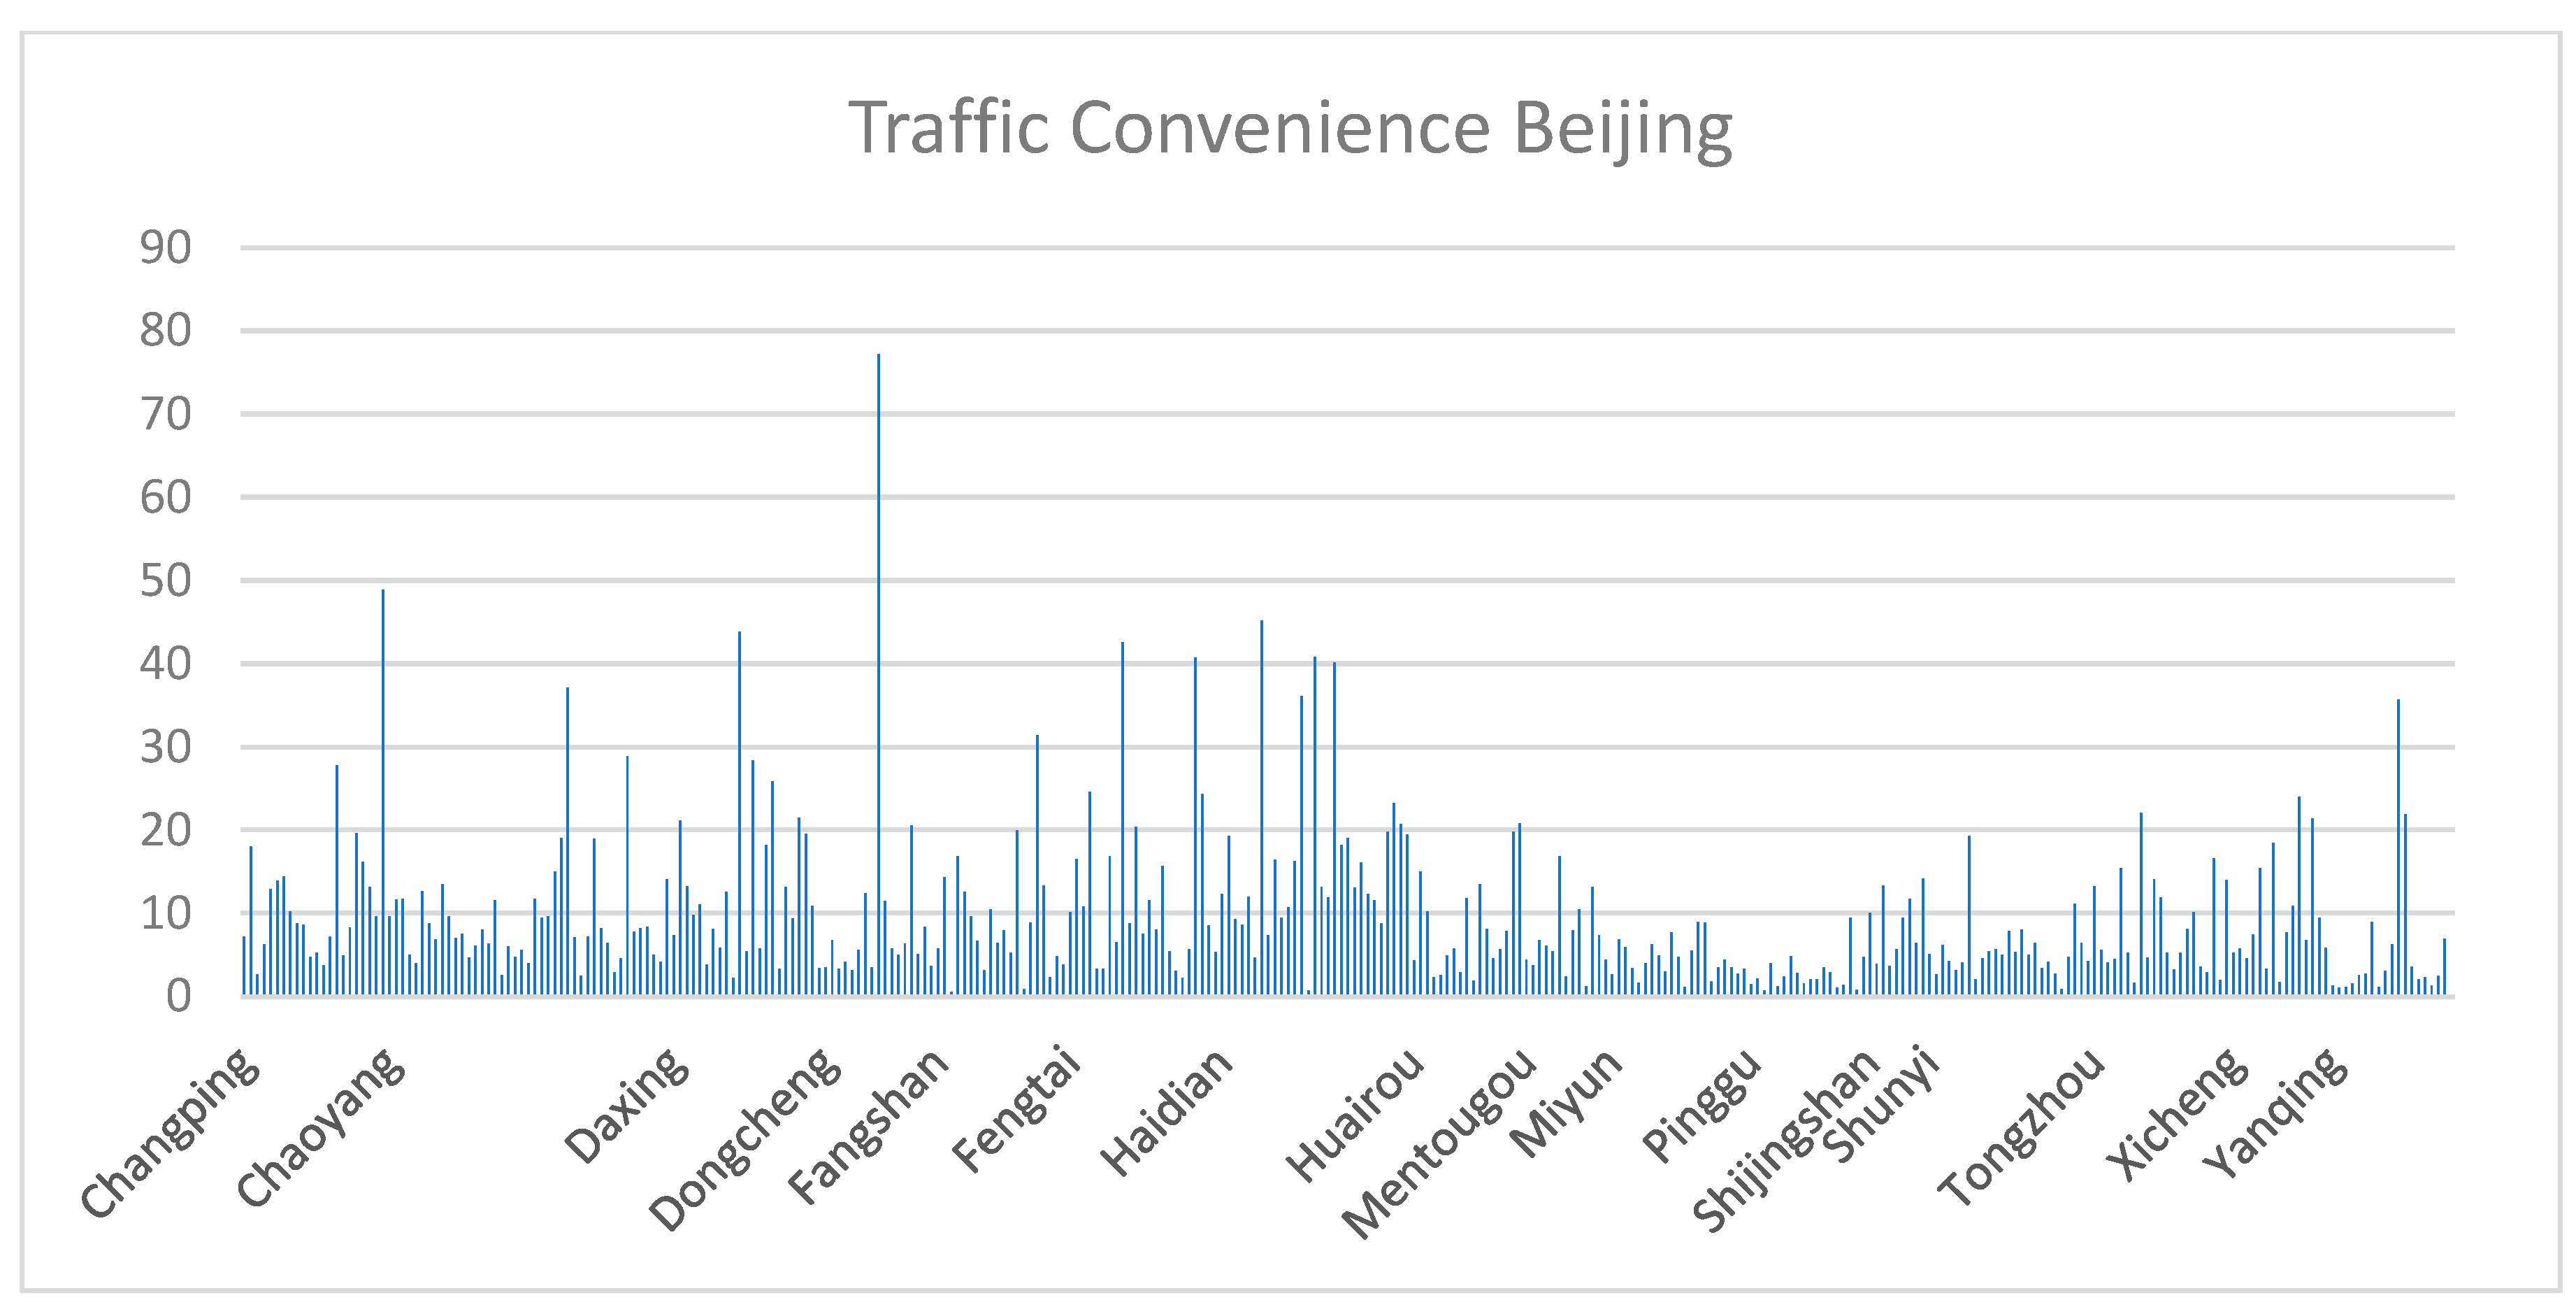
As shown in
Figure 12, the evaluation of transportation convenience largely depends on the number of roads, bicycle and pedestrian routes and the availability of public transportation facilities in a specific area. In China’s capital, Beijing, the most convenient transportation network is mainly embodied in Haidian District and Fengtai District as well as some adjacent streets and townships. However, the convenience of transportation scores significantly decrease in the northern and northeastern parts of Beijing, especially in Pinggu District and Yanqing District. Subway stations in Beijing are mainly concentrated in the main city area, while areas outside the main city are noticeably lacking in subway services. Despite this, bus stops are widely distributed in various streets and townships but gradually decreases in number from southeast to northwest, with the southeast having the most bus stops. Almost all roads are concentrated in the Nankou area and Liqiao Town and the areas south of them, while the number of roads in the northern areas is noticeably reduced, which also affects the distribution of bike lanes and pedestrian roads. Although Beijing’s bike lanes and pedestrian roads are mainly concentrated in the main city area, their numbers are still relatively scarce.
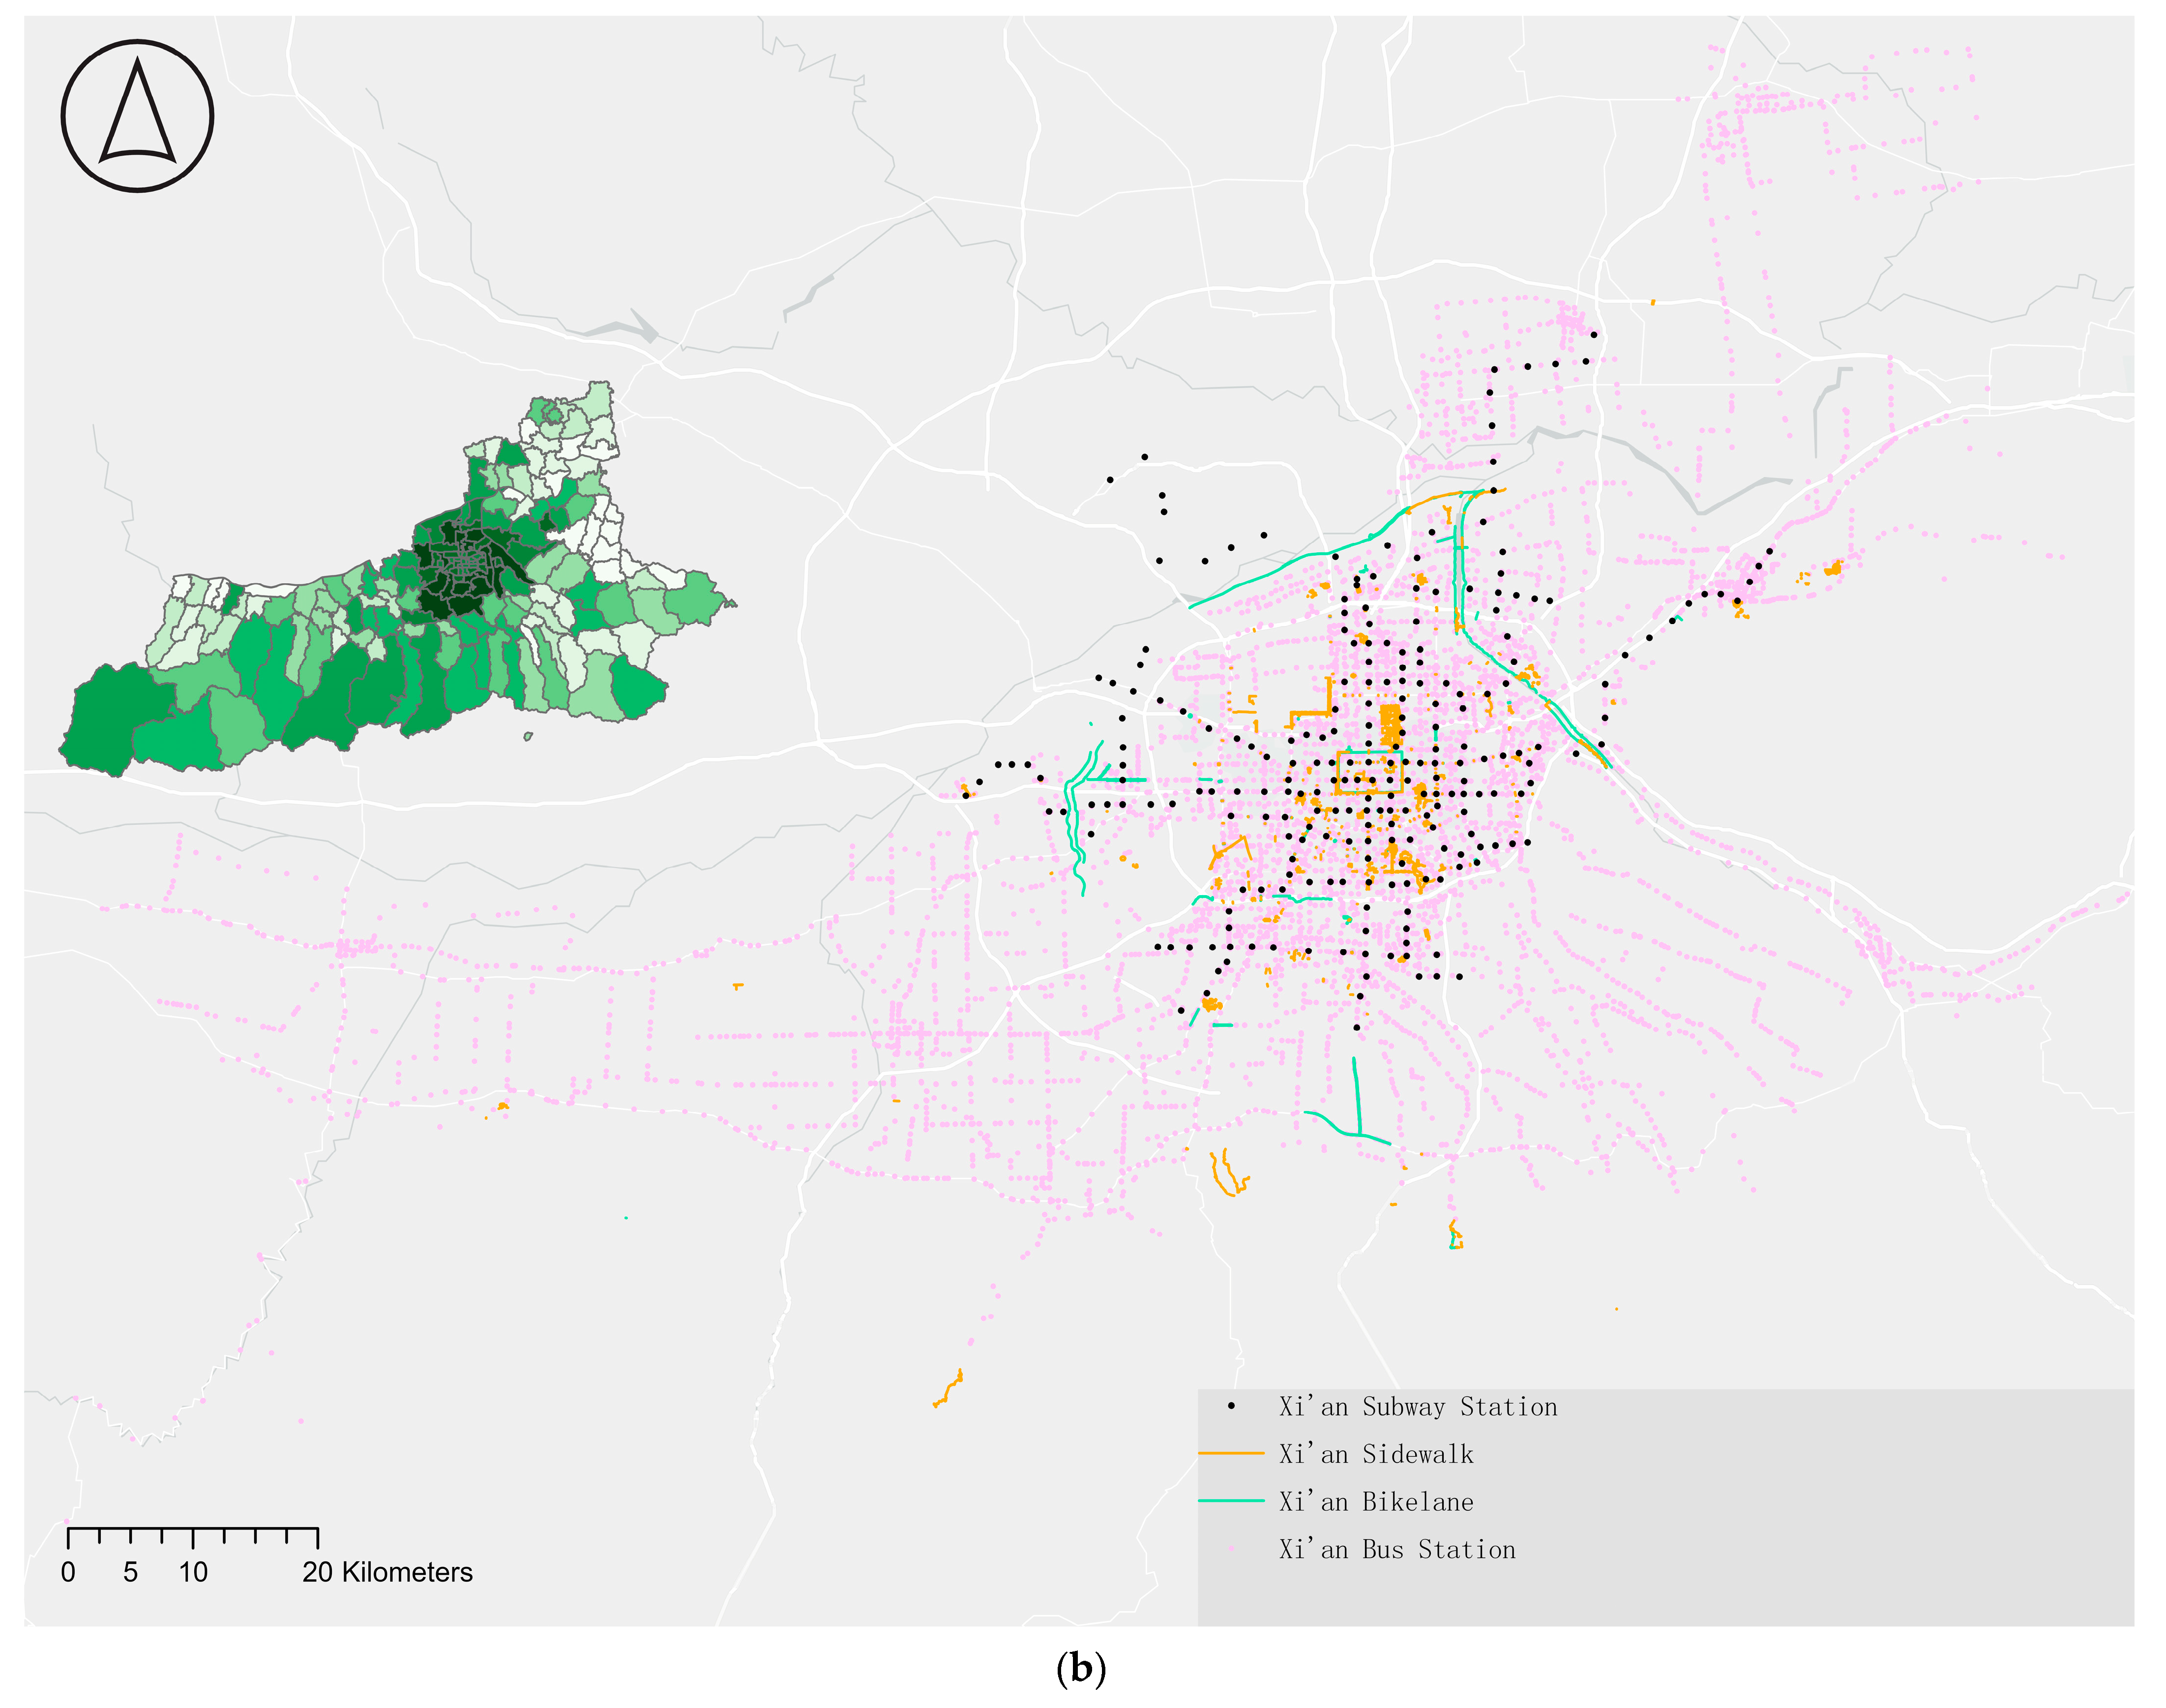
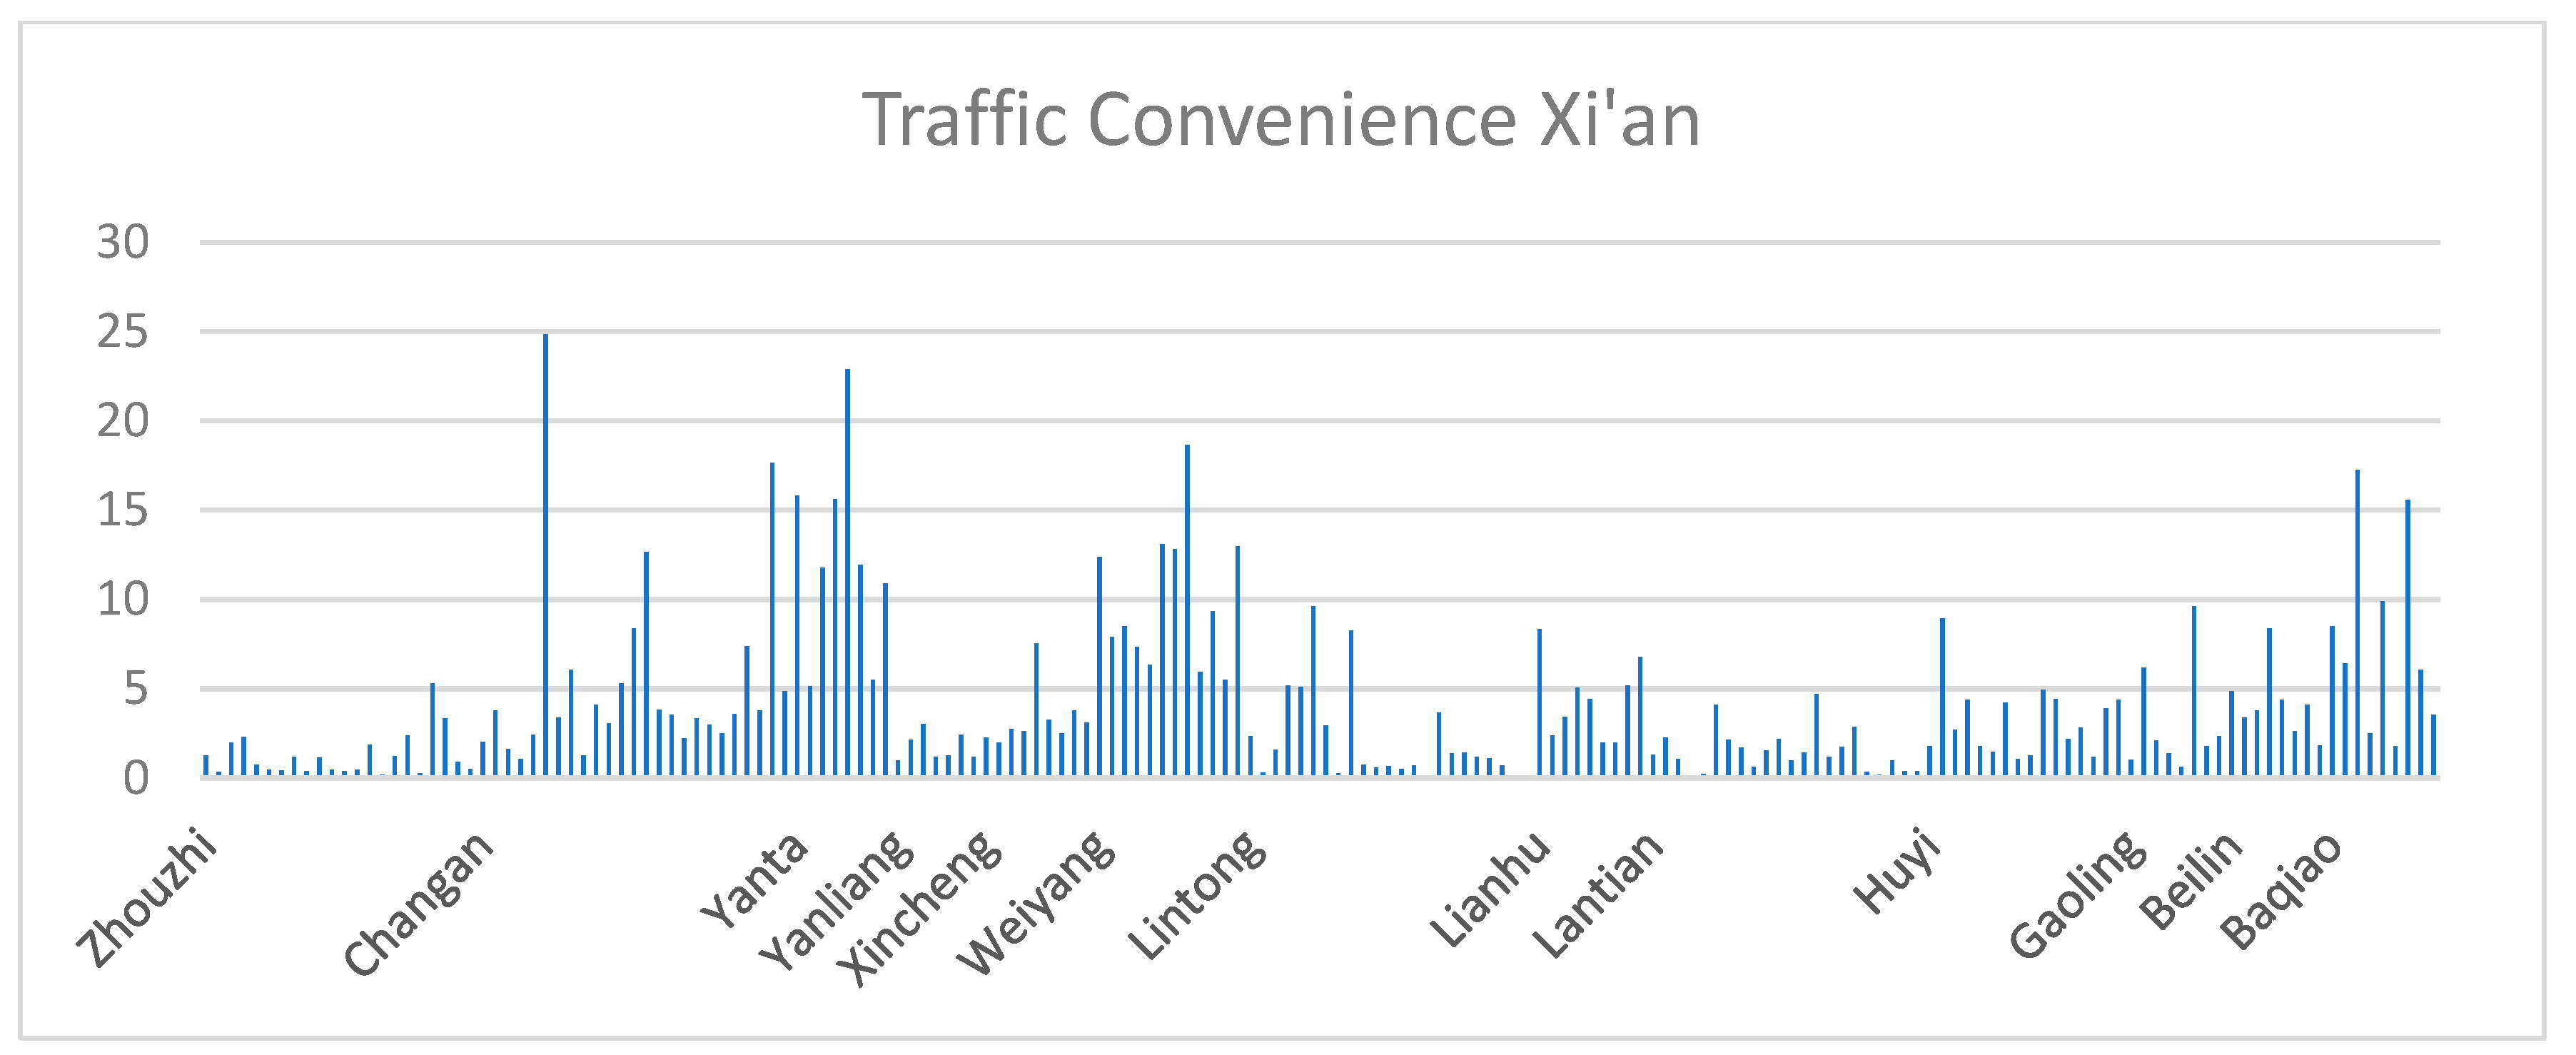
As shown in
Figure 13 and
Figure 14, for Xi’an, the transportation convenience scores show a clear trend, gradually decreasing from the outskirts of the main city to the edge of the city, and also gradually decreasing inward, forming a situation where the scores are high around the main city, but lower inside and outside. Both subway stations and bus stops in Xi’an exhibit a feature where there are more stations in the central area and fewer in the surrounding areas, forming a stark contrast with the distribution pattern of bus stops in Beijing. There are many stations in the main city area of Xi’an, but many streets and townships in the surrounding areas have neither bus stops nor subway stations, resulting in significant transportation inconvenience. Although Xi’an has relatively fewer bicycle lanes, mainly running through Baqiao District, Weiyang District, and Chang’an District, pedestrian paths are almost entirely concentrated in the city center, with Daminggong Street accounting for most of the pedestrian paths.
Based on the above analysis, whether in Beijing or Xi’an, the spatial distribution of transportation convenience shows a certain regularity, but there are also significant regional differences. These differences are mainly reflected between the main city and surrounding areas of the city, as well as between different directions of the city. In addition, the distribution of public transportation facilities, such as subway stations and bus stops, as well as bike lanes and pedestrian paths, is an important factor affecting the transportation convenience of these cities.
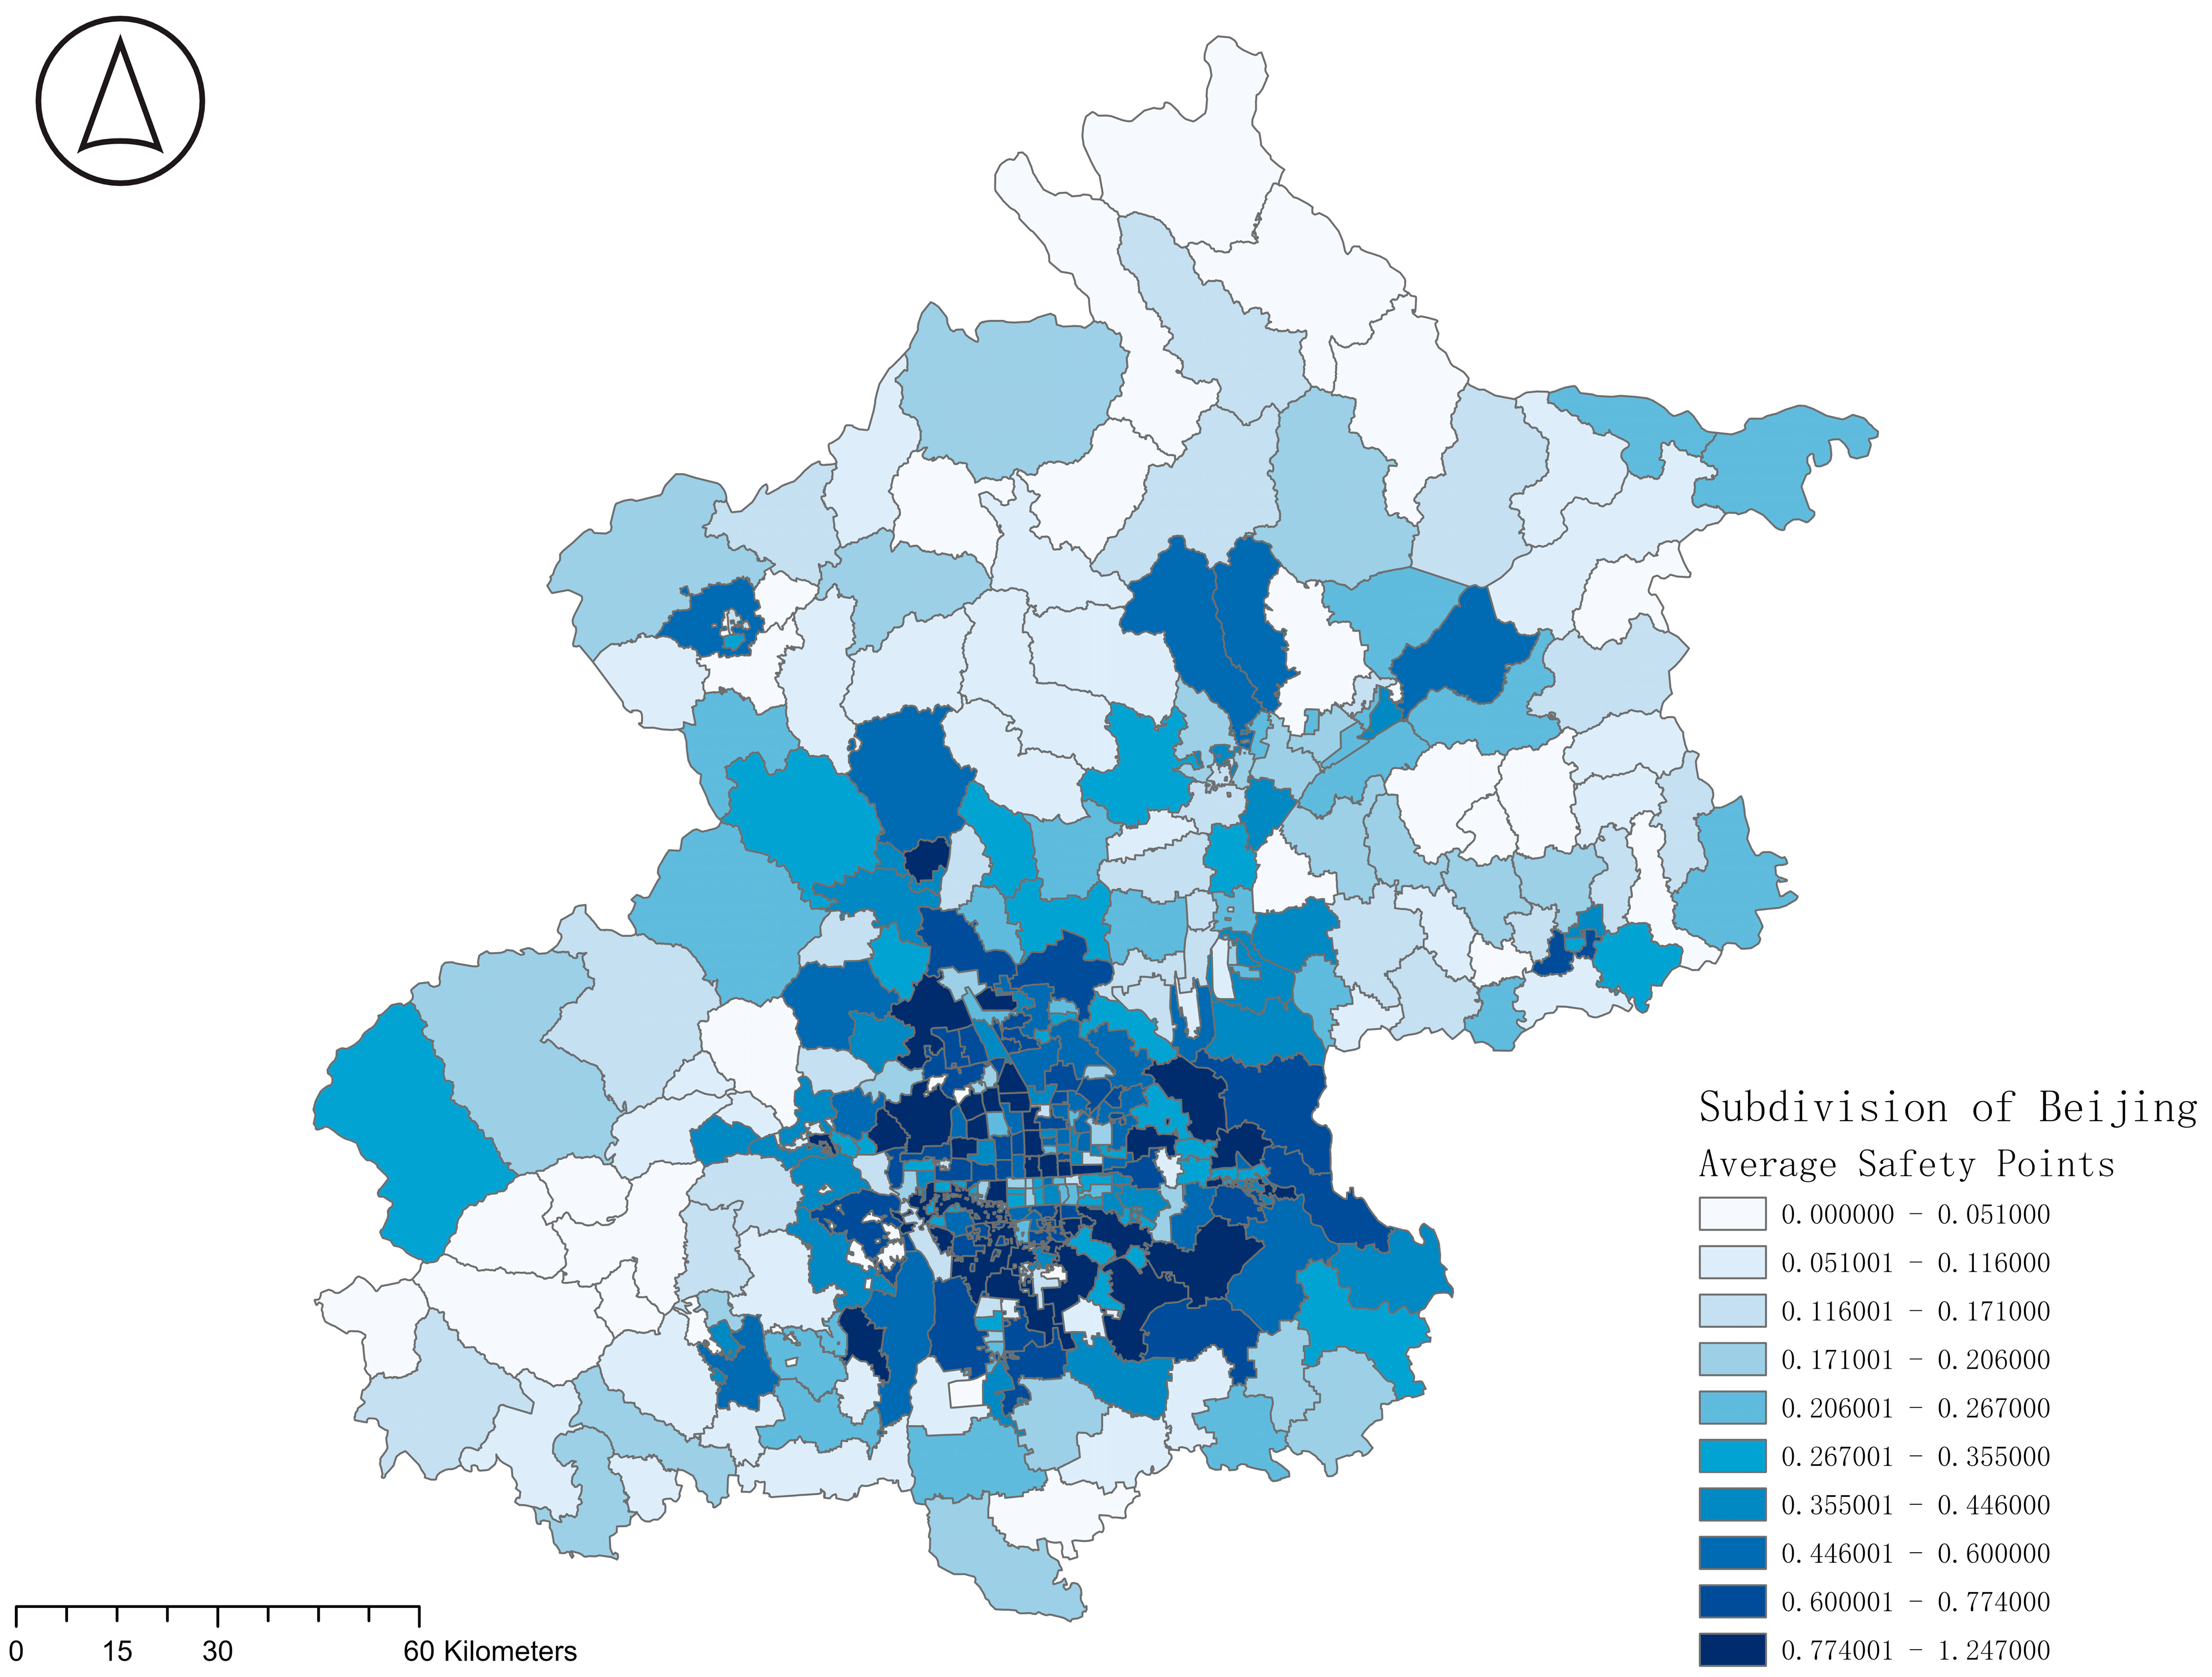
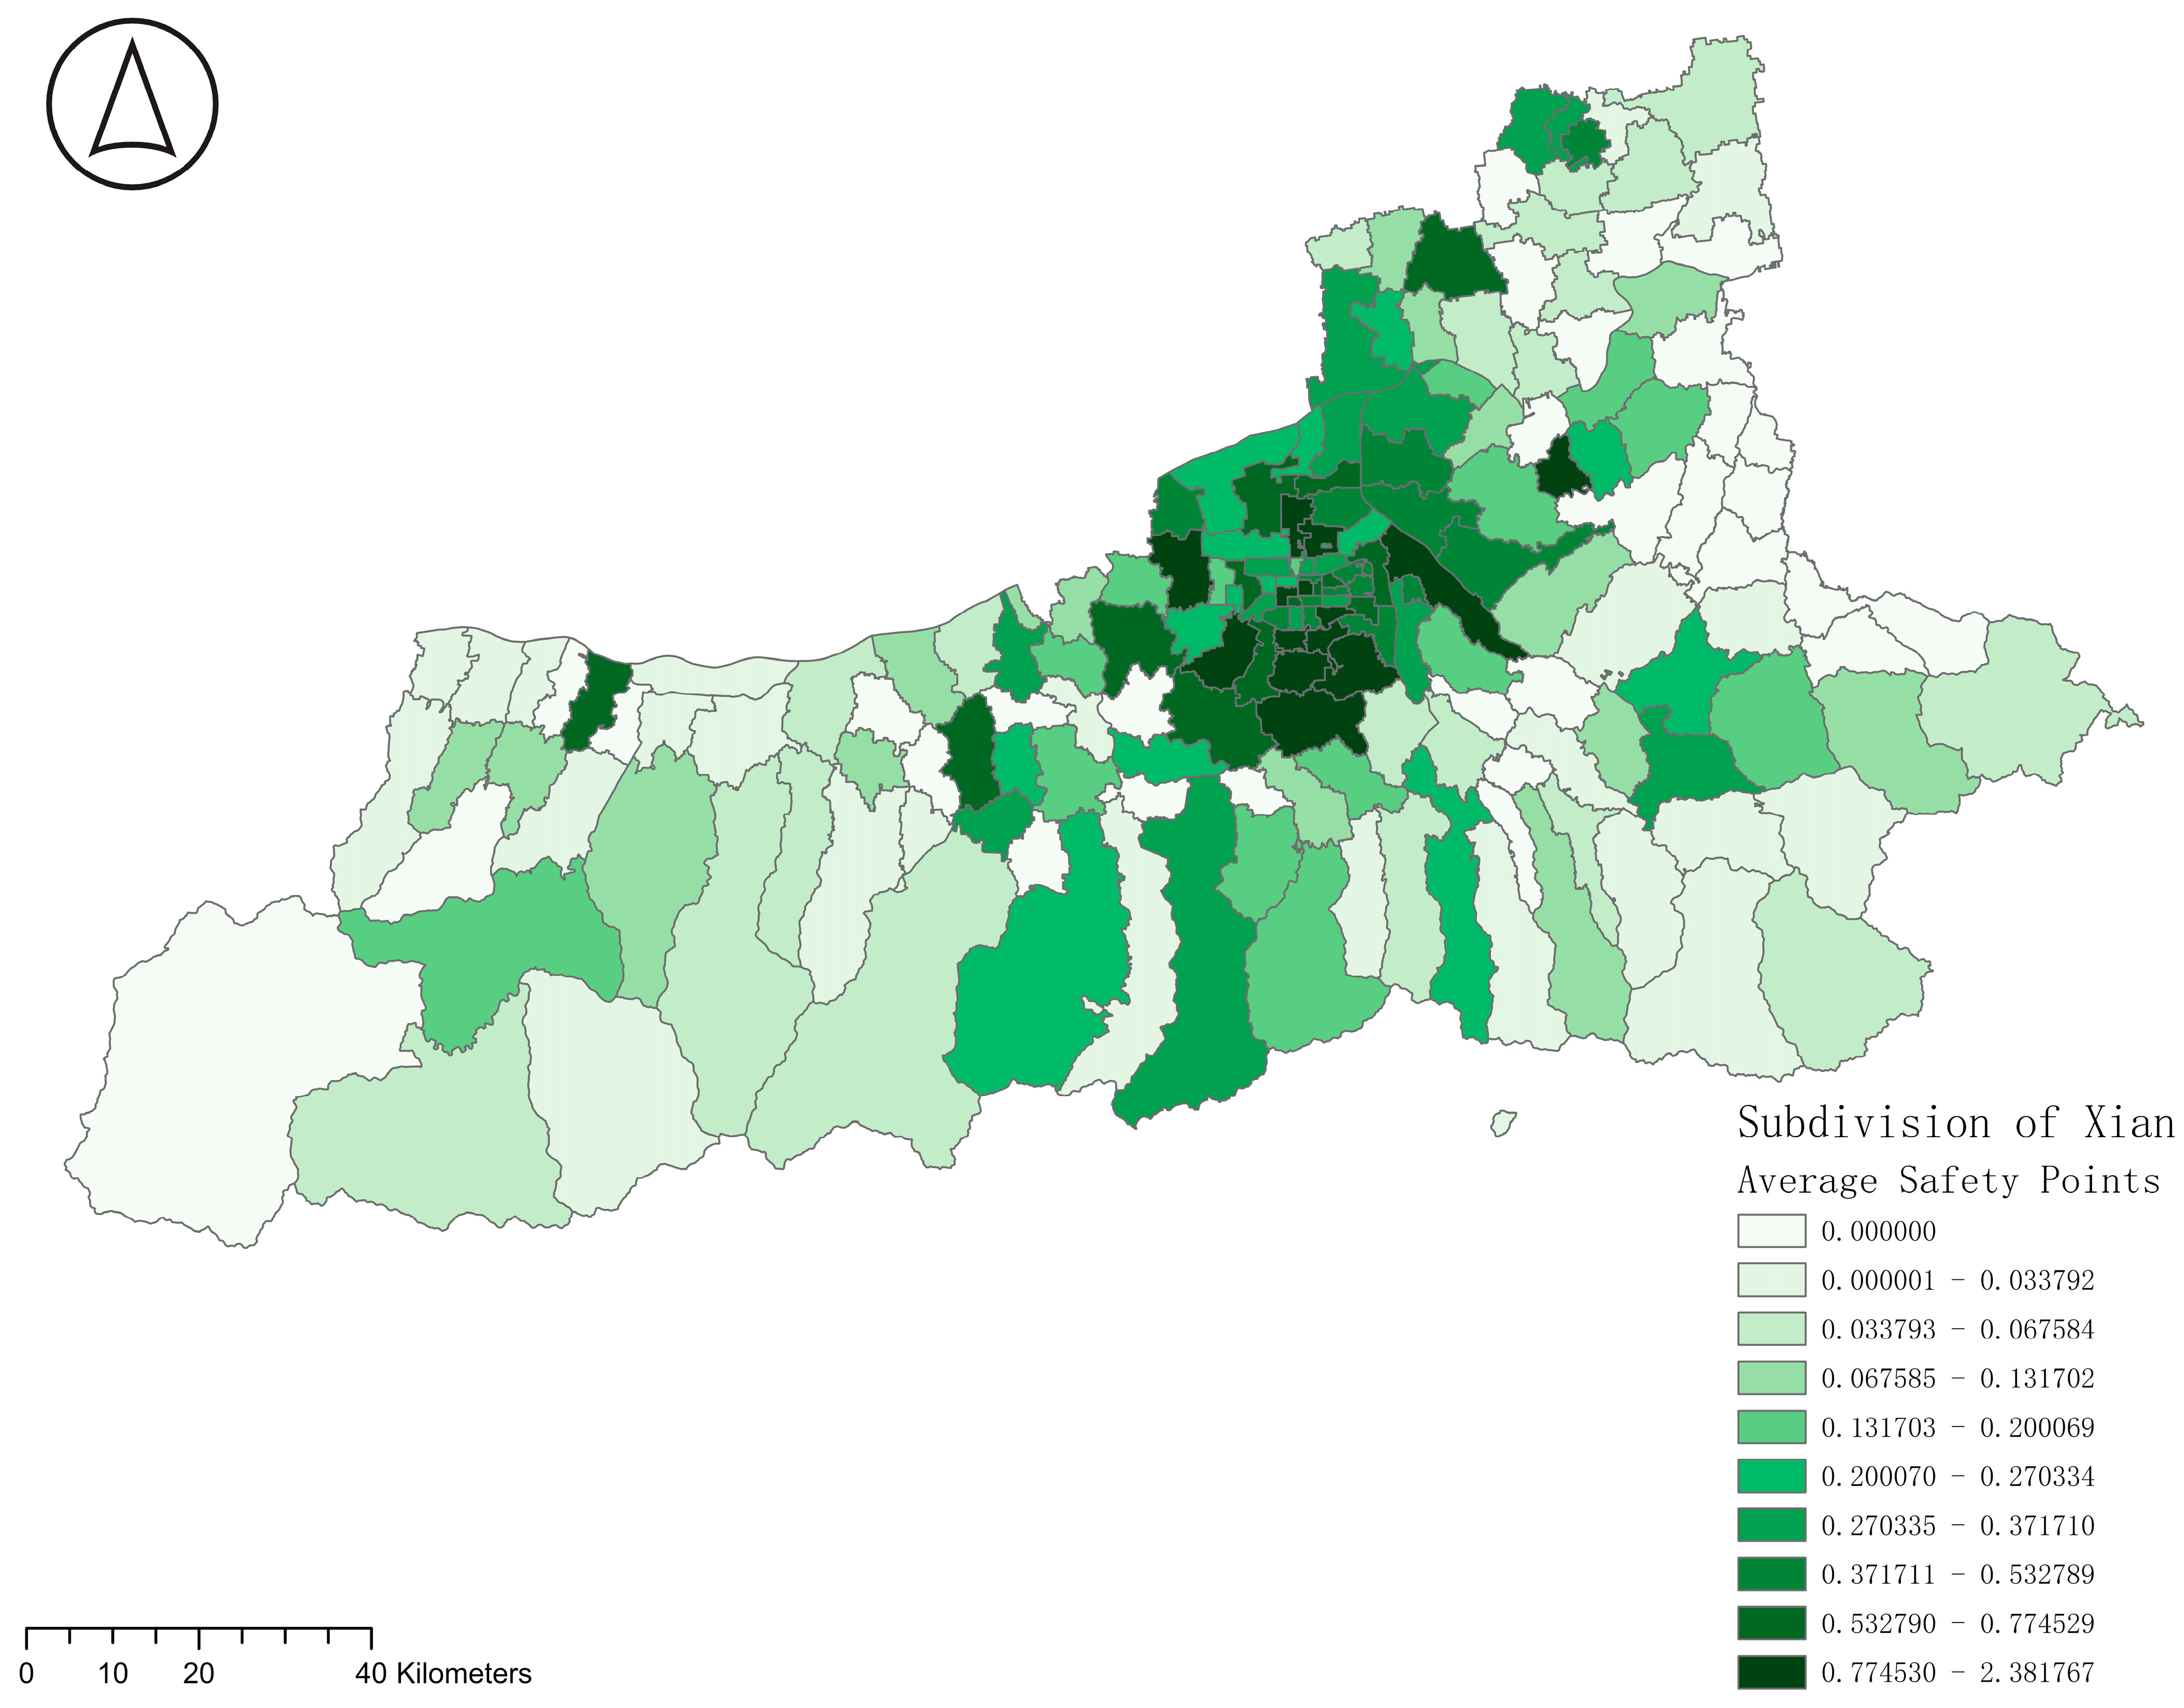
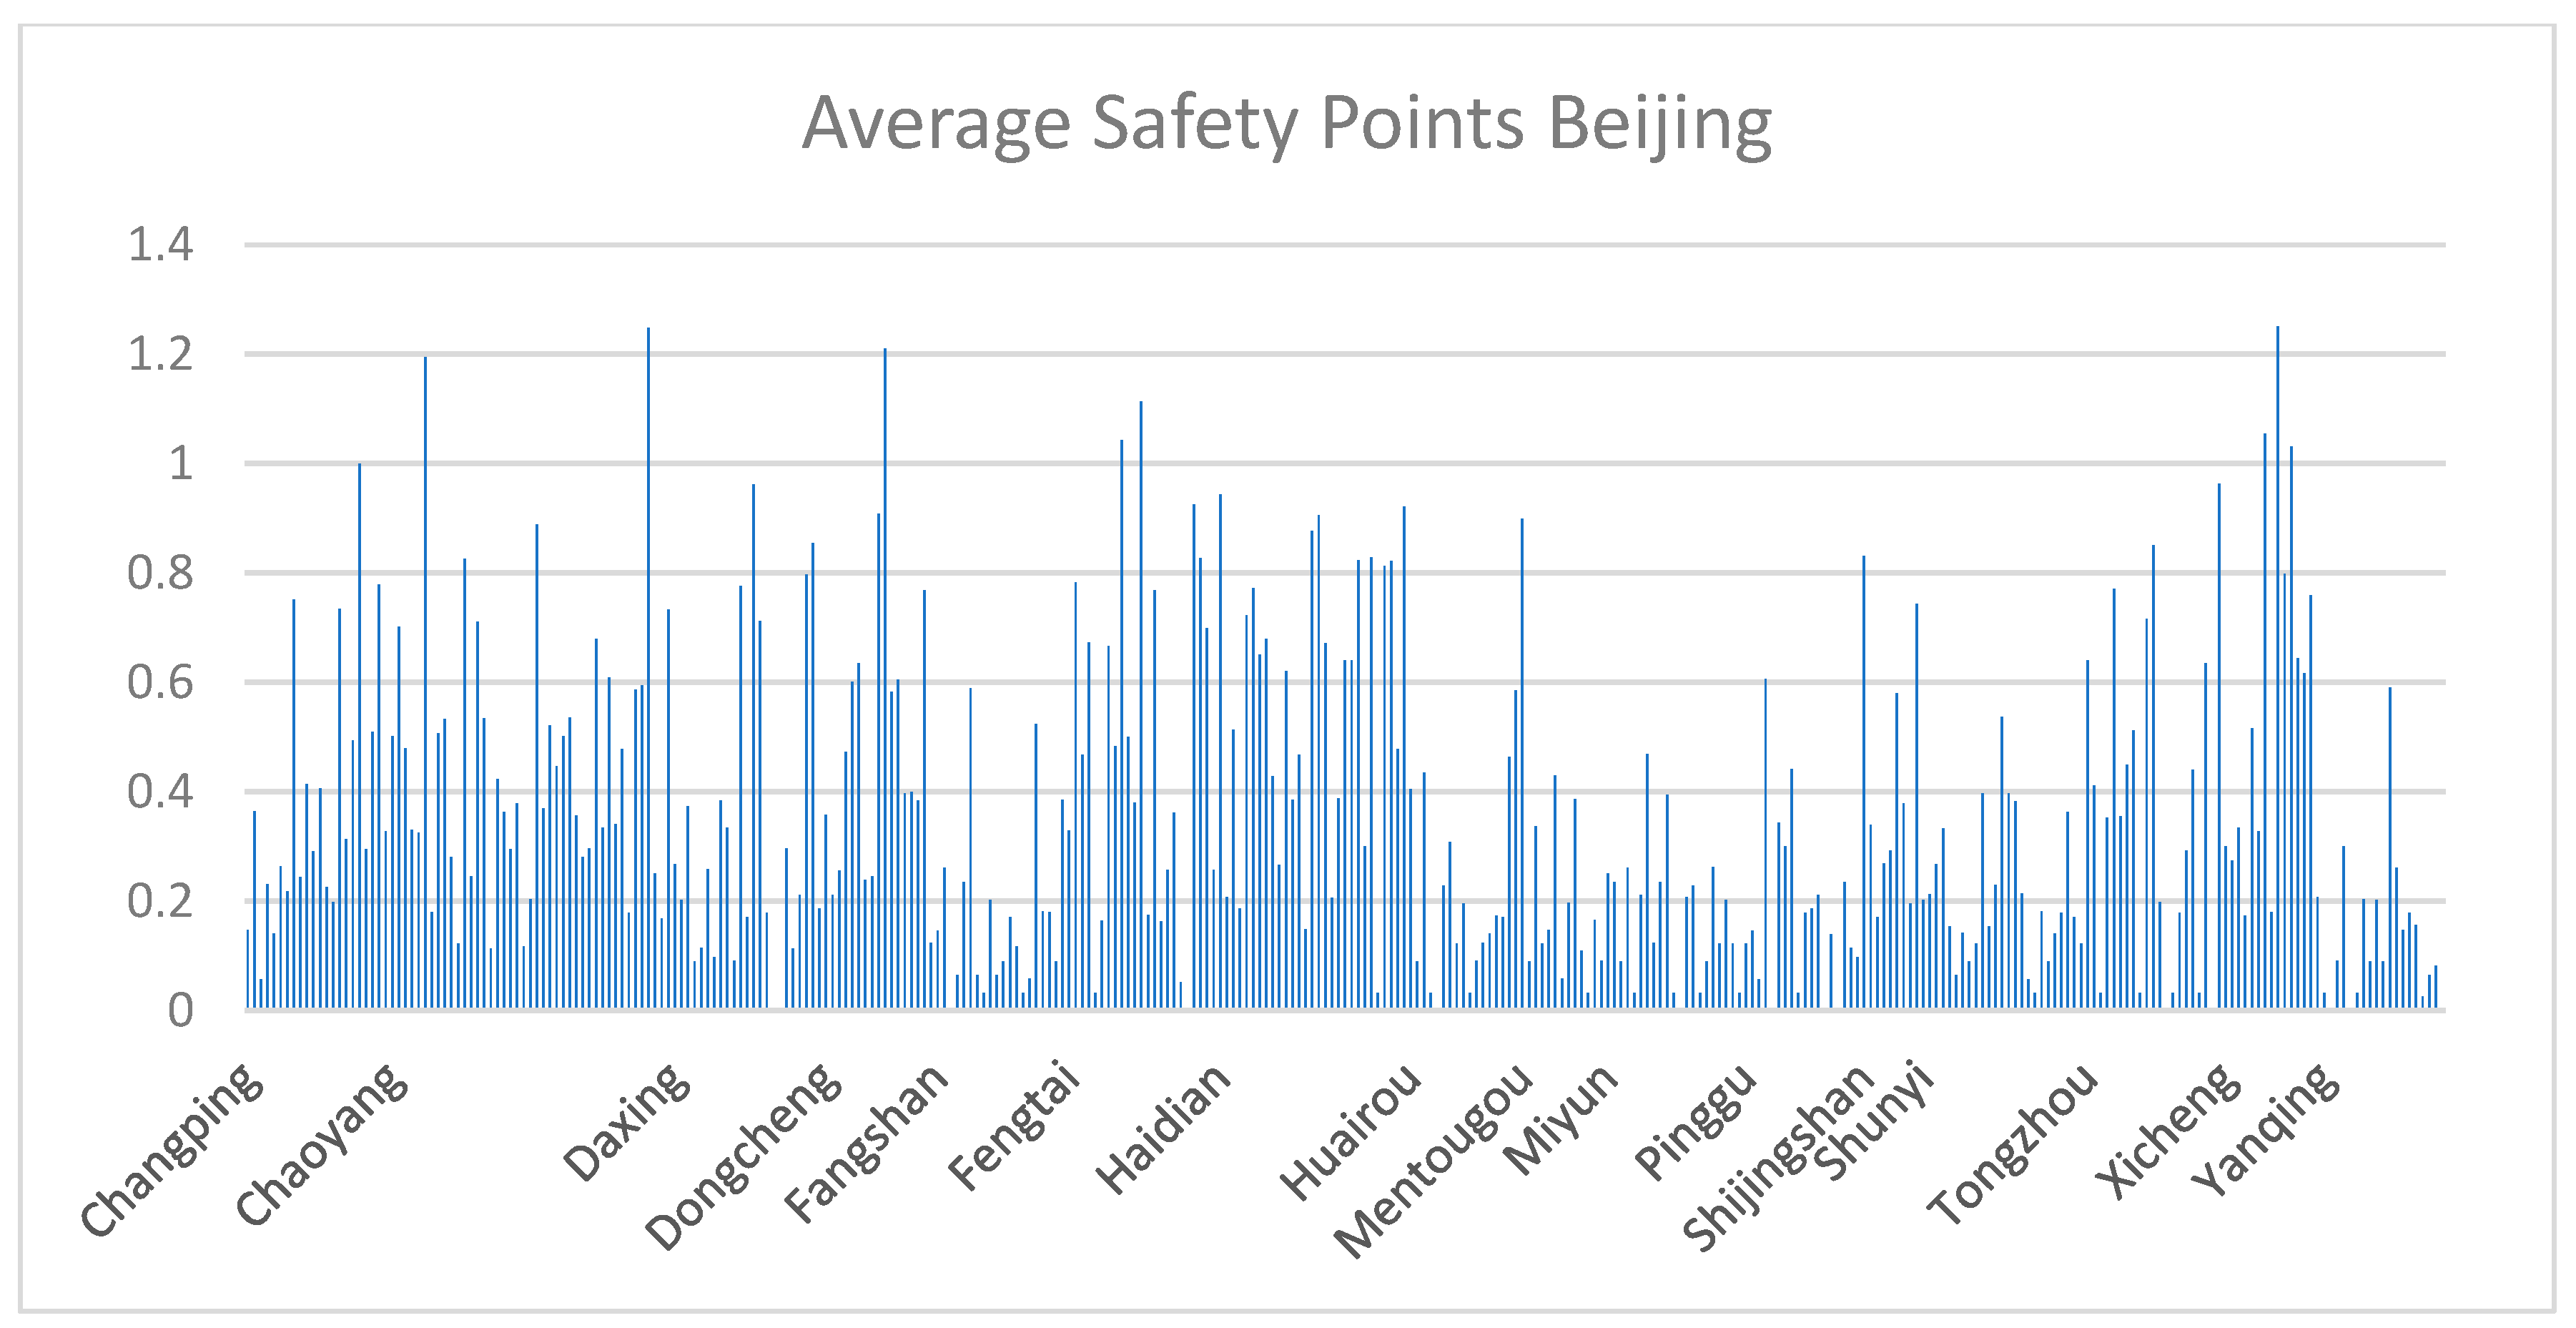
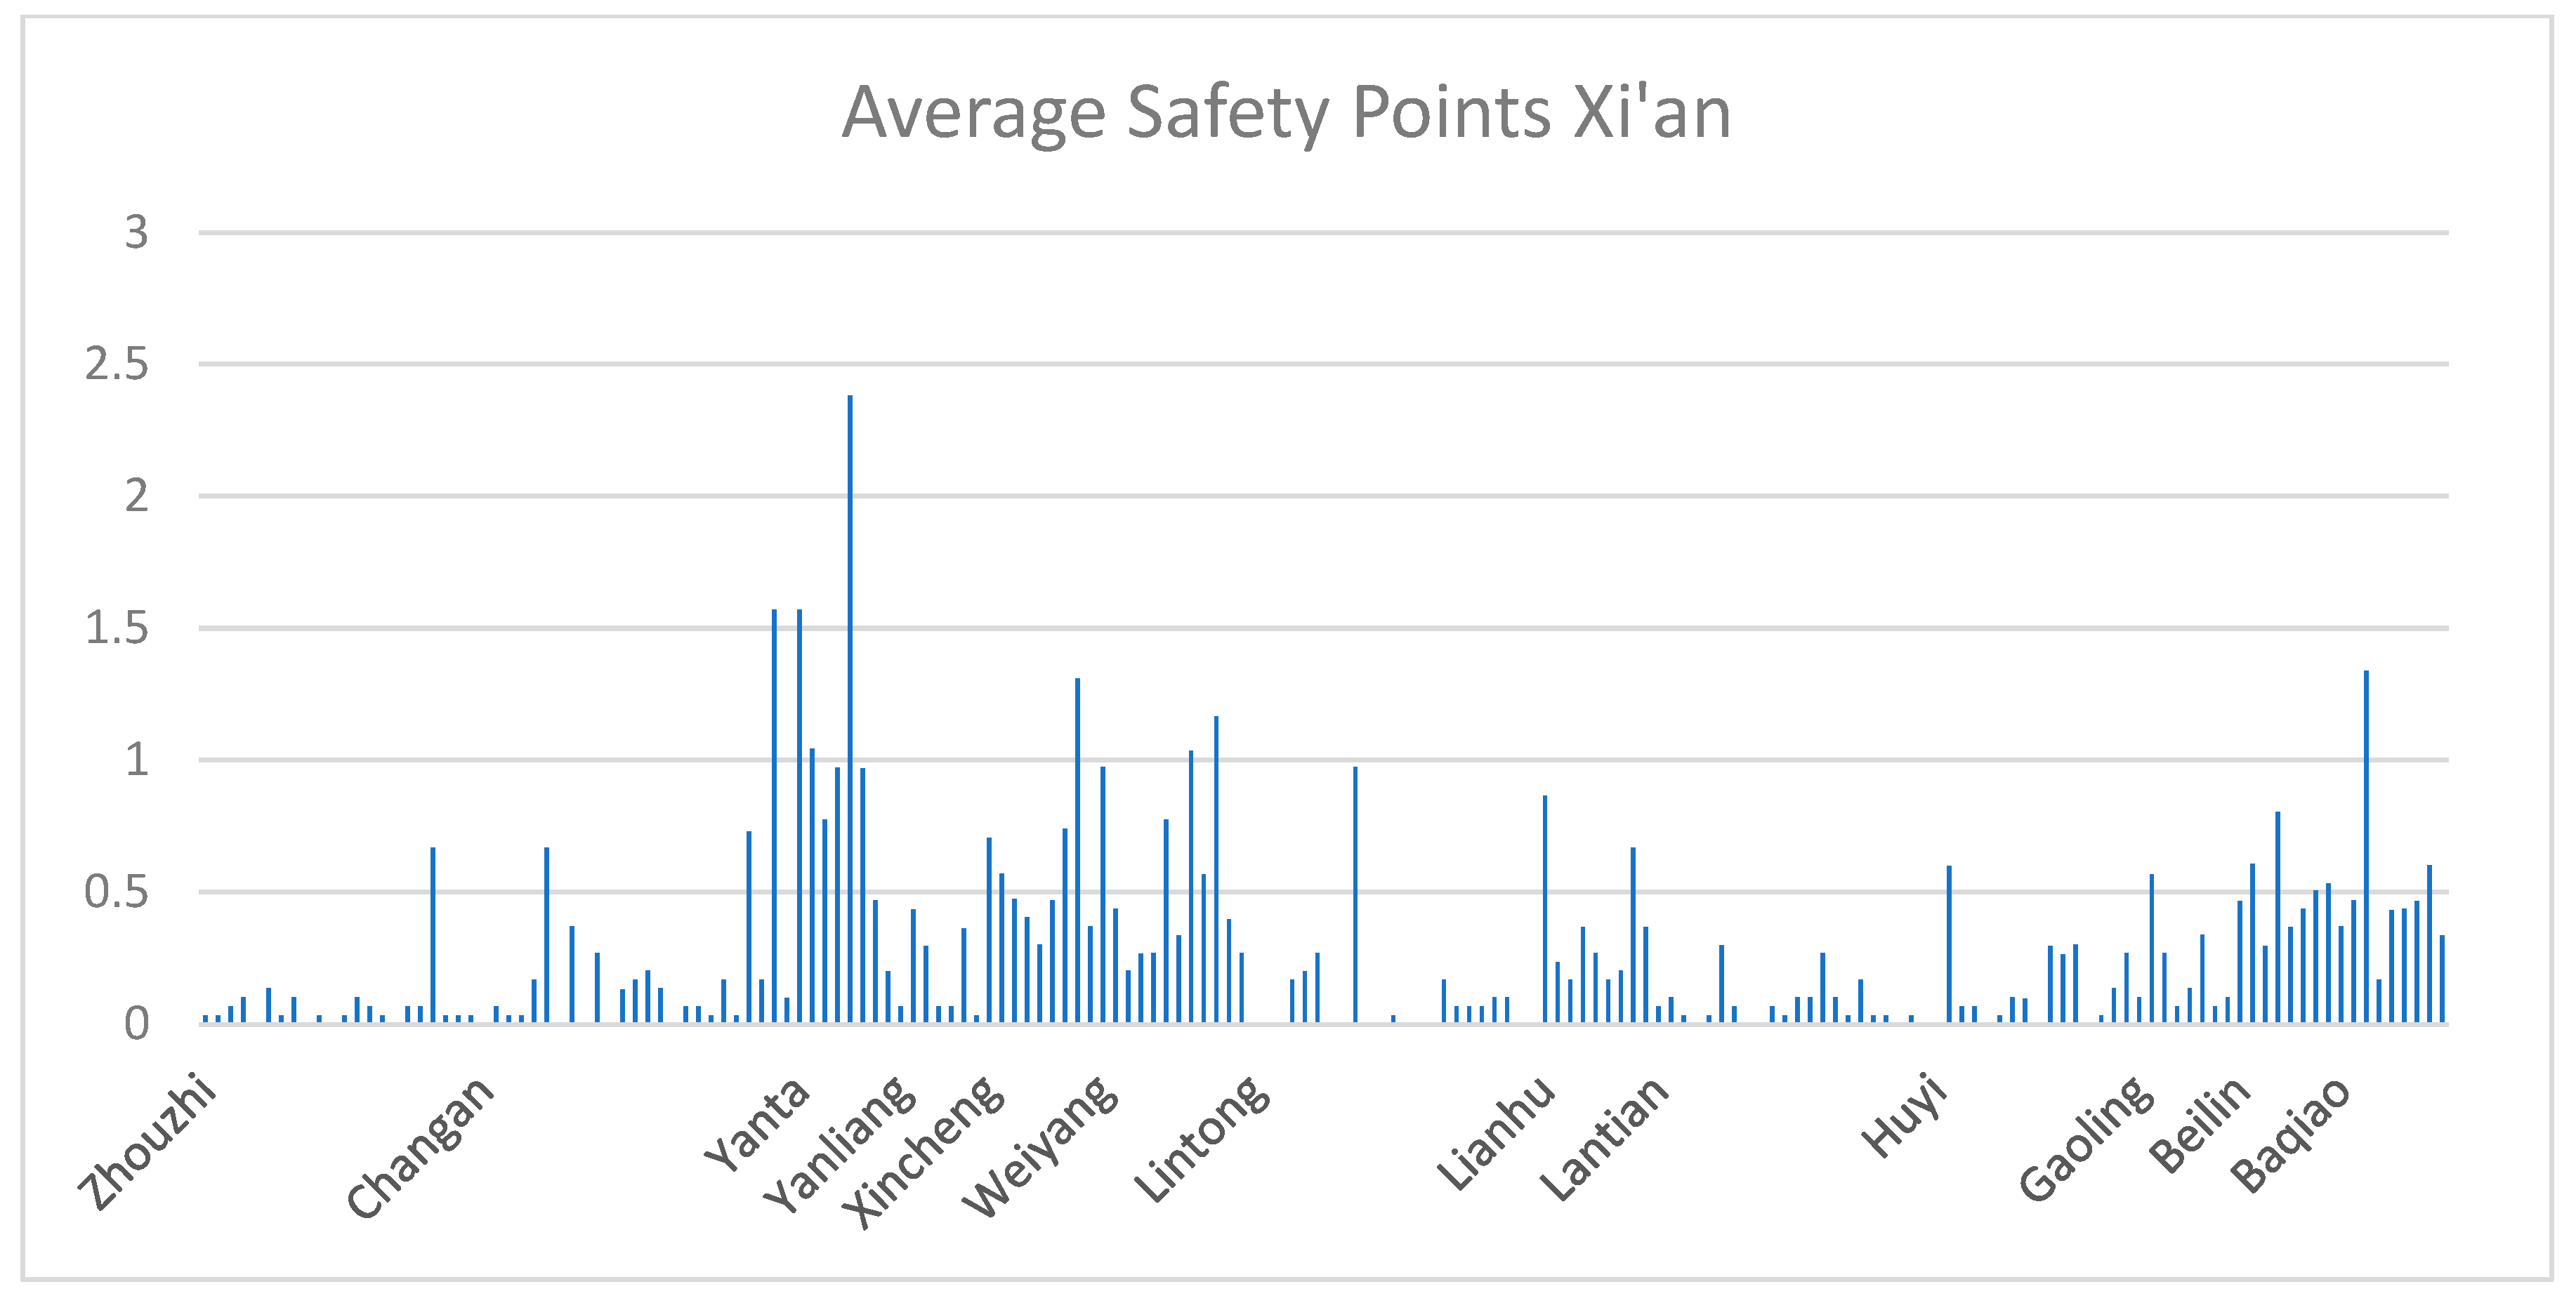
Safety Analysis. As shown in
Figure 15, when examining the distribution of safety scores in Beijing and Xi’an, we observed a strikingly congruent spatial pattern across both cities. In both urban contexts, safety scores exhibit a consistent trend, characterized by higher scores in the central urban areas that then taper off as one progresses towards the periphery. Proximate regions to the primary urban centers generally showcase elevated safety scores. This spatial distribution can potentially be ascribed to certain urban planning paradigms and resource allocation strategies inherent to these cities. Nonetheless, in Beijing, a conspicuous ubiquity of safety amenities is apparent across all administrative districts and streets, signaling a relatively equitable distribution. In stark contrast, as evidenced by
Figure 16 and
Figure 17, certain streets and townships in Xi’an are devoid of these pivotal safety installations. Such an absence implies that, in case of unforeseen contingencies, aid might have to be summoned from neighboring districts, potentially engendering inefficiencies in response time.
The present study primarily gauges regional safety based on the density of emergency shelters, fire stations, and police precincts. To elaborate, the number of emergency shelters stands as a paramount metric in assessing a region’s resilience to and preparedness for sudden adversities, encompassing but not confined to natural calamities, conflagrations, and sociopolitical upheavals. A higher density of such emergency provisions typically indicates enhanced protective measures in the face of unforeseen adversarial contingencies.
4.2. Getis-Ord Gi* Hotspot Analysis
In the context of accelerated urbanization and the quest for enhanced quality of life, understanding the spatial dynamics of urban living environments is pivotal for urban research and planning. This research employs hotspot analysis to discern spatial patterns of living environment quality in Beijing and Xi’an, revealing pronounced clustering tendencies of varying quality areas. Beyond descriptive analysis, this study delves into the statistical foundations underlying these clusters. The utilization of hotspot analysis not only identifies spatial patterns but also elucidates nuanced spatial correlations often missed in traditional methods. This holistic perspective empowers urban planners with robust insights, fostering well-informed urban management decisions.
More specifically, by explicitly pinpointing the cold spots, or areas with lower-quality living environments, policymakers can not only focus more deliberately on these regions but can also devise targeted strategies and resource allocation schemes. This implies that for these identified sensitive or high-risk zones, more specific investments, improvements, and interventions can be implemented, ensuring a sustained enhancement of living environment quality and thereby safeguarding residents’ well-being and life quality to the utmost extent.
4.2.1. Coldspot Analysis
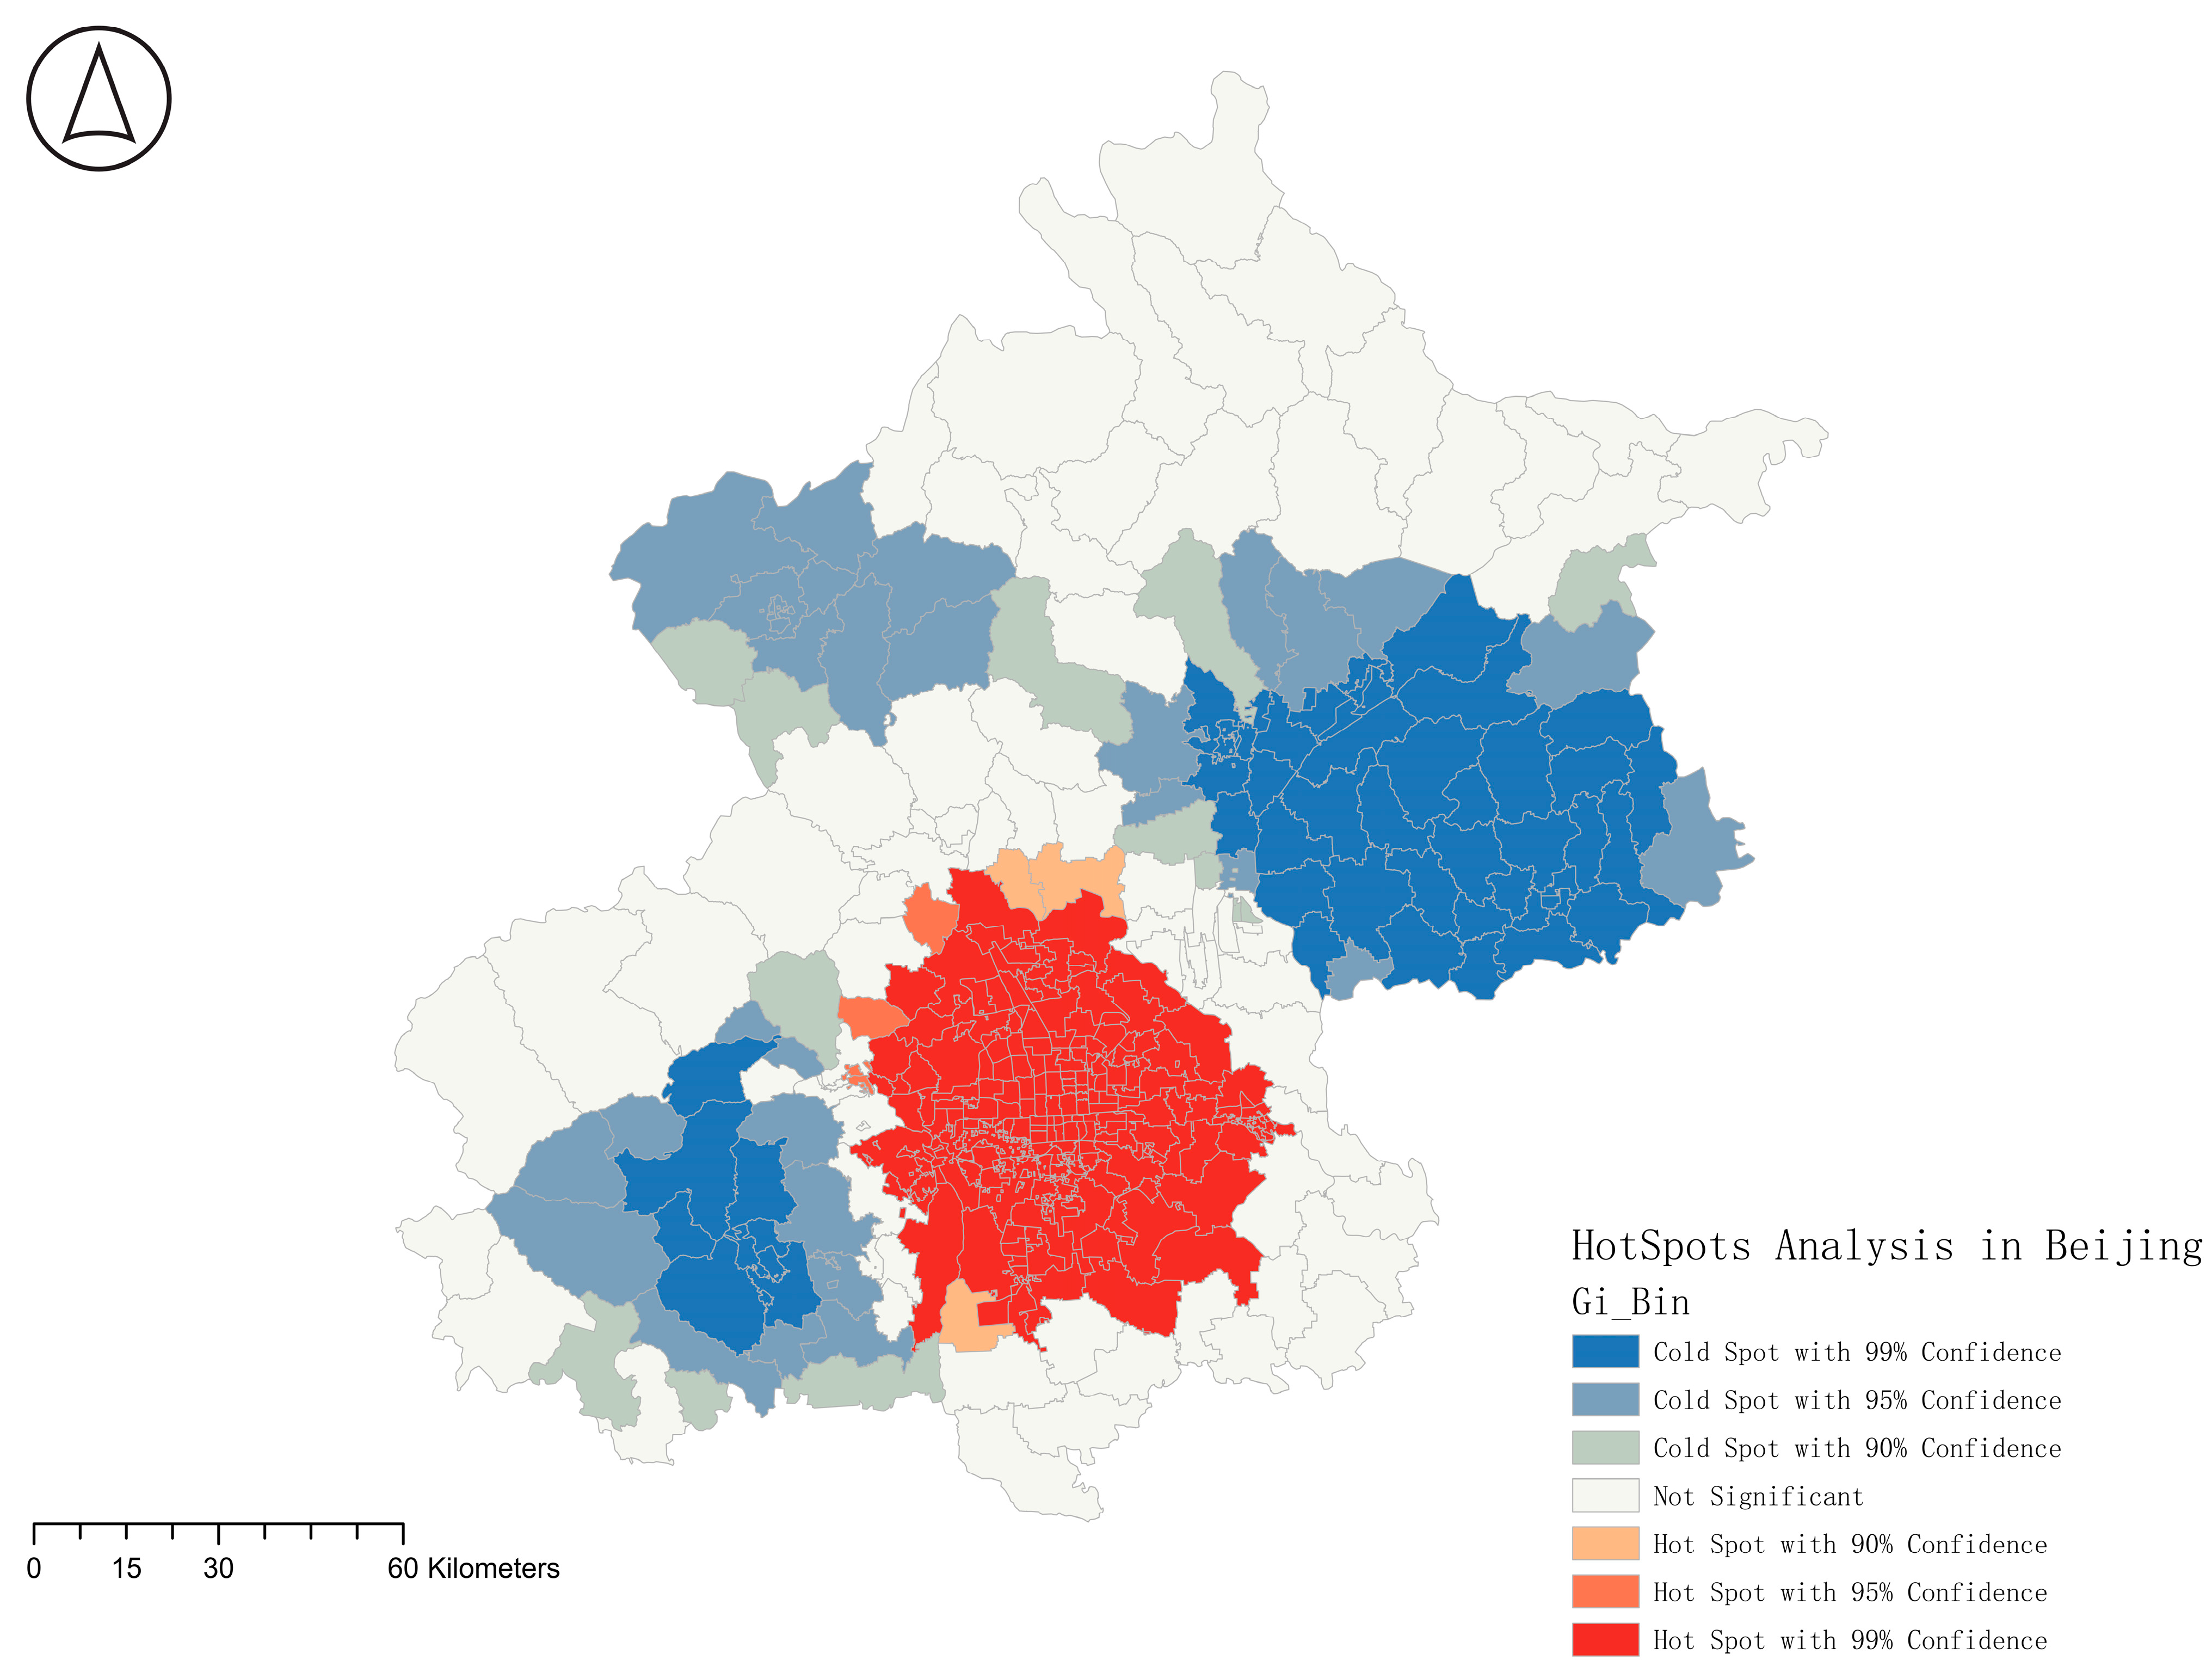
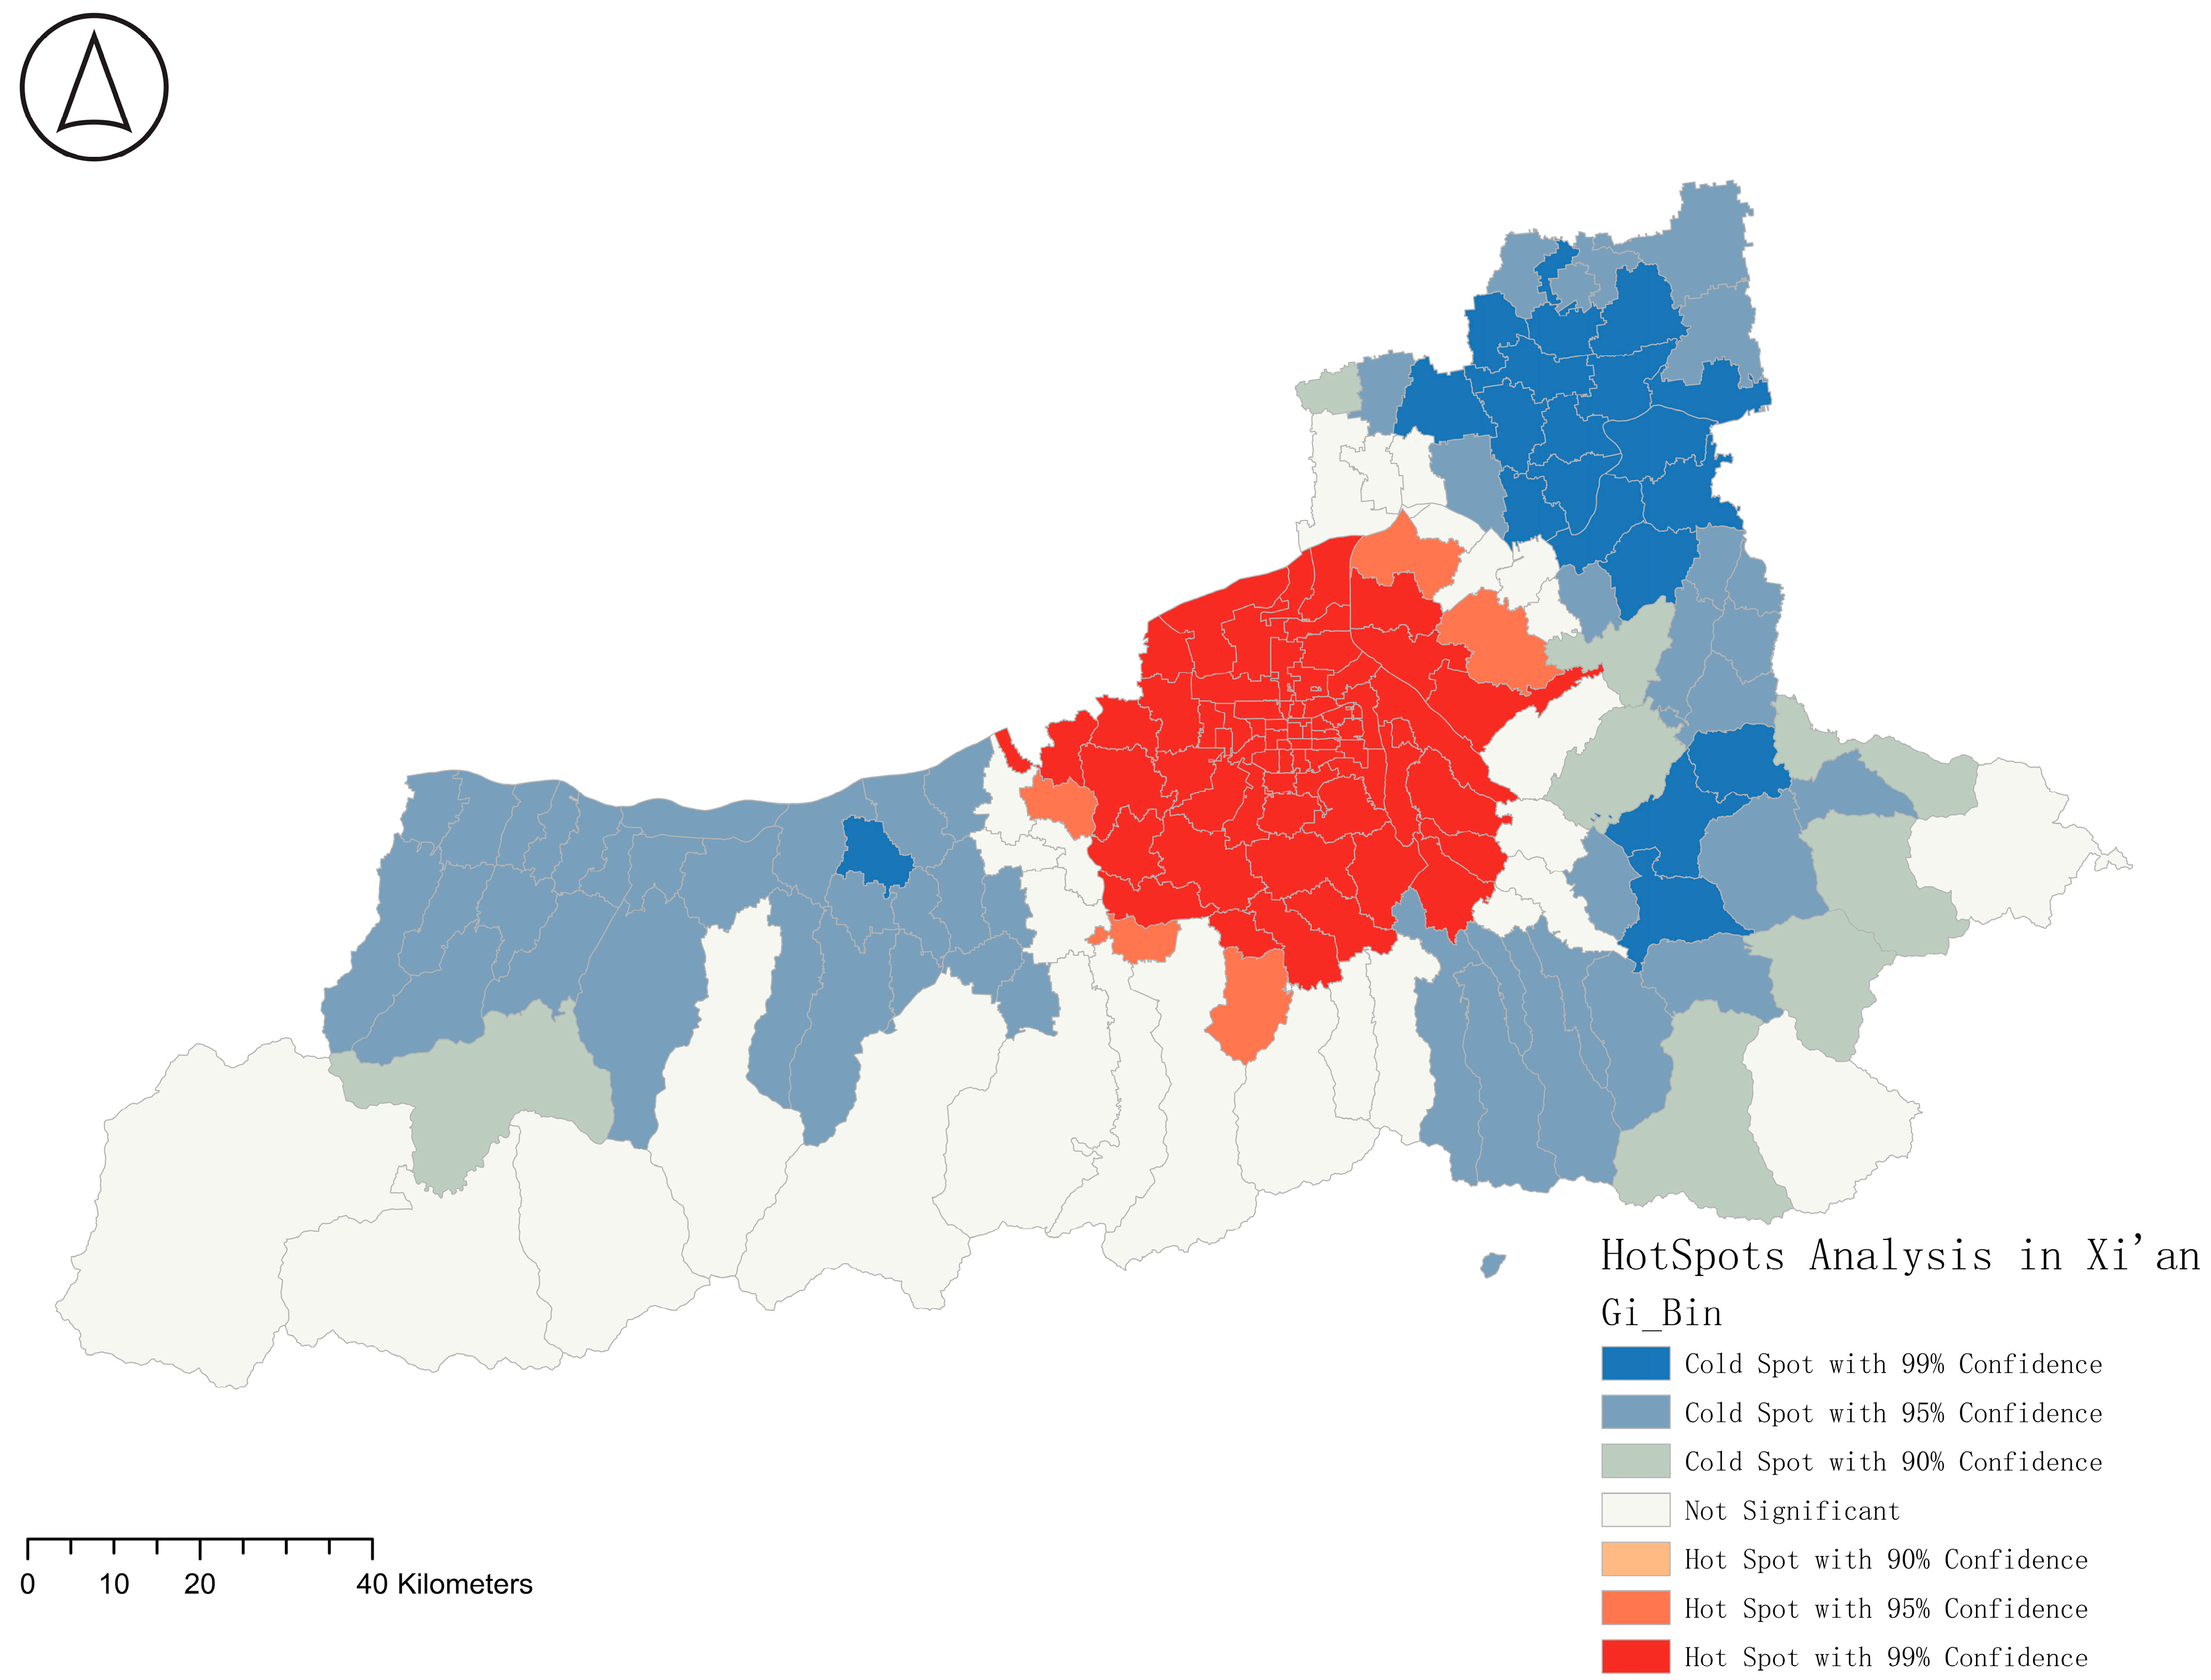
In terms of spatial distribution characteristics, both Beijing and Xi’an exhibit significant spatial agglomeration patterns, and there are significant differences between the two cities. Specifically, the main urban areas of both Beijing and Xi’an have formed a broad agglomeration space of high-quality living environments. As shown in
Figure 18, for Beijing, high-quality living environments are mainly concentrated in Haidian District, Chaoyang District, Xicheng District, Dongcheng District, Fengtai District, Daxing District, Tongzhou District, and Changping District, coverin.g most of the main urban areas. In contrast, the spatial distribution of low-quality living environments is relatively dispersed, with significant differences in agglomeration scale, and it is mainly located on the outskirts of the city.
For Xi’an, its aggregation area of high-quality living environments exhibits a pattern similar to that of Beijing, mainly concentrated in the main urban area. However, the spatial distribution of low-quality living environments in Xi’an shows a significant agglomeration, mainly divided into two areas, the west side and the east side, with a significant scale of agglomeration.
4.2.2. Spatial Distribution Characteristics of Human Settlement Environment
In Beijing, the high-quality living environments are primarily concentrated in the central city area, stretching from Changxindian in the west to Yongshun in the east, and from Xiaotangshan in the north to Xihongmen in the south. This region showcases significant features of a high-quality living environment, especially in the outskirts like Xiaotangshan, Baishan Town, Beizang Village Town, Junzhuang Town, and Shangzhuang area, though the quality in these places is relatively lower. On the other hand, the low-quality living environments in Beijing are scattered, mainly in three clusters in the northeast, north, and southwest. The northeastern cluster is the most notable. The phenomenon of low-quality living is especially evident in Miyun District, Pinggu District, Yanqing District, and Fangshan District. In these areas, the majority of residents have lower incomes and face various inconveniences [
23]. Far from the city center, these areas lack development, green spaces, public transport, and safe infrastructure like bike lanes and sidewalks. This poses traffic risks. Safety facilities are scant, even missing in some parts, compromising area safety. Educational resources are also limited. While most residents are farmers with cultivated land, their proximity to the city does not equate to ideal living conditions.
Xi’an’s high-quality living zones cover the main city from Gaoqiao Street west to Hongqing Street east, and from Liucunbao Street north to Ziwu Street south. However, poor living areas are found in Lintong District, Lantian County, Huyi District, and Zhouzhi County. Resources are centralized in Xi’an’s core, leaving outer areas lacking in transport and education. Unlike Beijing’s sparse but present bus stops, a third of Xi’an’s outskirts have no public transport. Fire safety outside the central area is a concern due to few fire stations, posing risks. Education in Xi’an is also centralized, challenging peripheral residents. Despite the vast cultivated lands in these low-quality zones, denoting many residents, their quality of life is compromised by Xi’an’s resource centralization.
Both Beijing and Xi’an’s high-quality living areas are central. However, remote regions face significant issues from resource scarcity and poor infrastructure. Xi’an’s outskirts have more severe challenges than Beijing’s, particularly in transportation and education, lowering residents’ quality of life.
5. Development Proposal Based on the Analysis Results—Transit-Oriented Development Strategy
Transit-oriented development (TOD) is an urban planning principle that centralizes population, employment, and recreation around public transit hubs, promoting a compact, diverse, and walkable urban layout. By placing public transportation, housing, work, and leisure within proximity, TOD seeks to lessen car reliance, enhance public transit usage, and steer urban development sustainably. Implementing TOD offers multifaceted advantages: environmentally, it curtails carbon emissions, combating climate change; socially, its high-density, mixed-use blueprint fosters community bonds and vibrancy; and economically, it bolsters land values, transit revenues, and urban economic vigor. Recognizing its potential for sustainable growth, this study offers TOD-based recommendations for Xi’an and Beijing’s underdeveloped living zones, targeting enhanced local development and life quality.
5.1. TOD Strategy Implementation
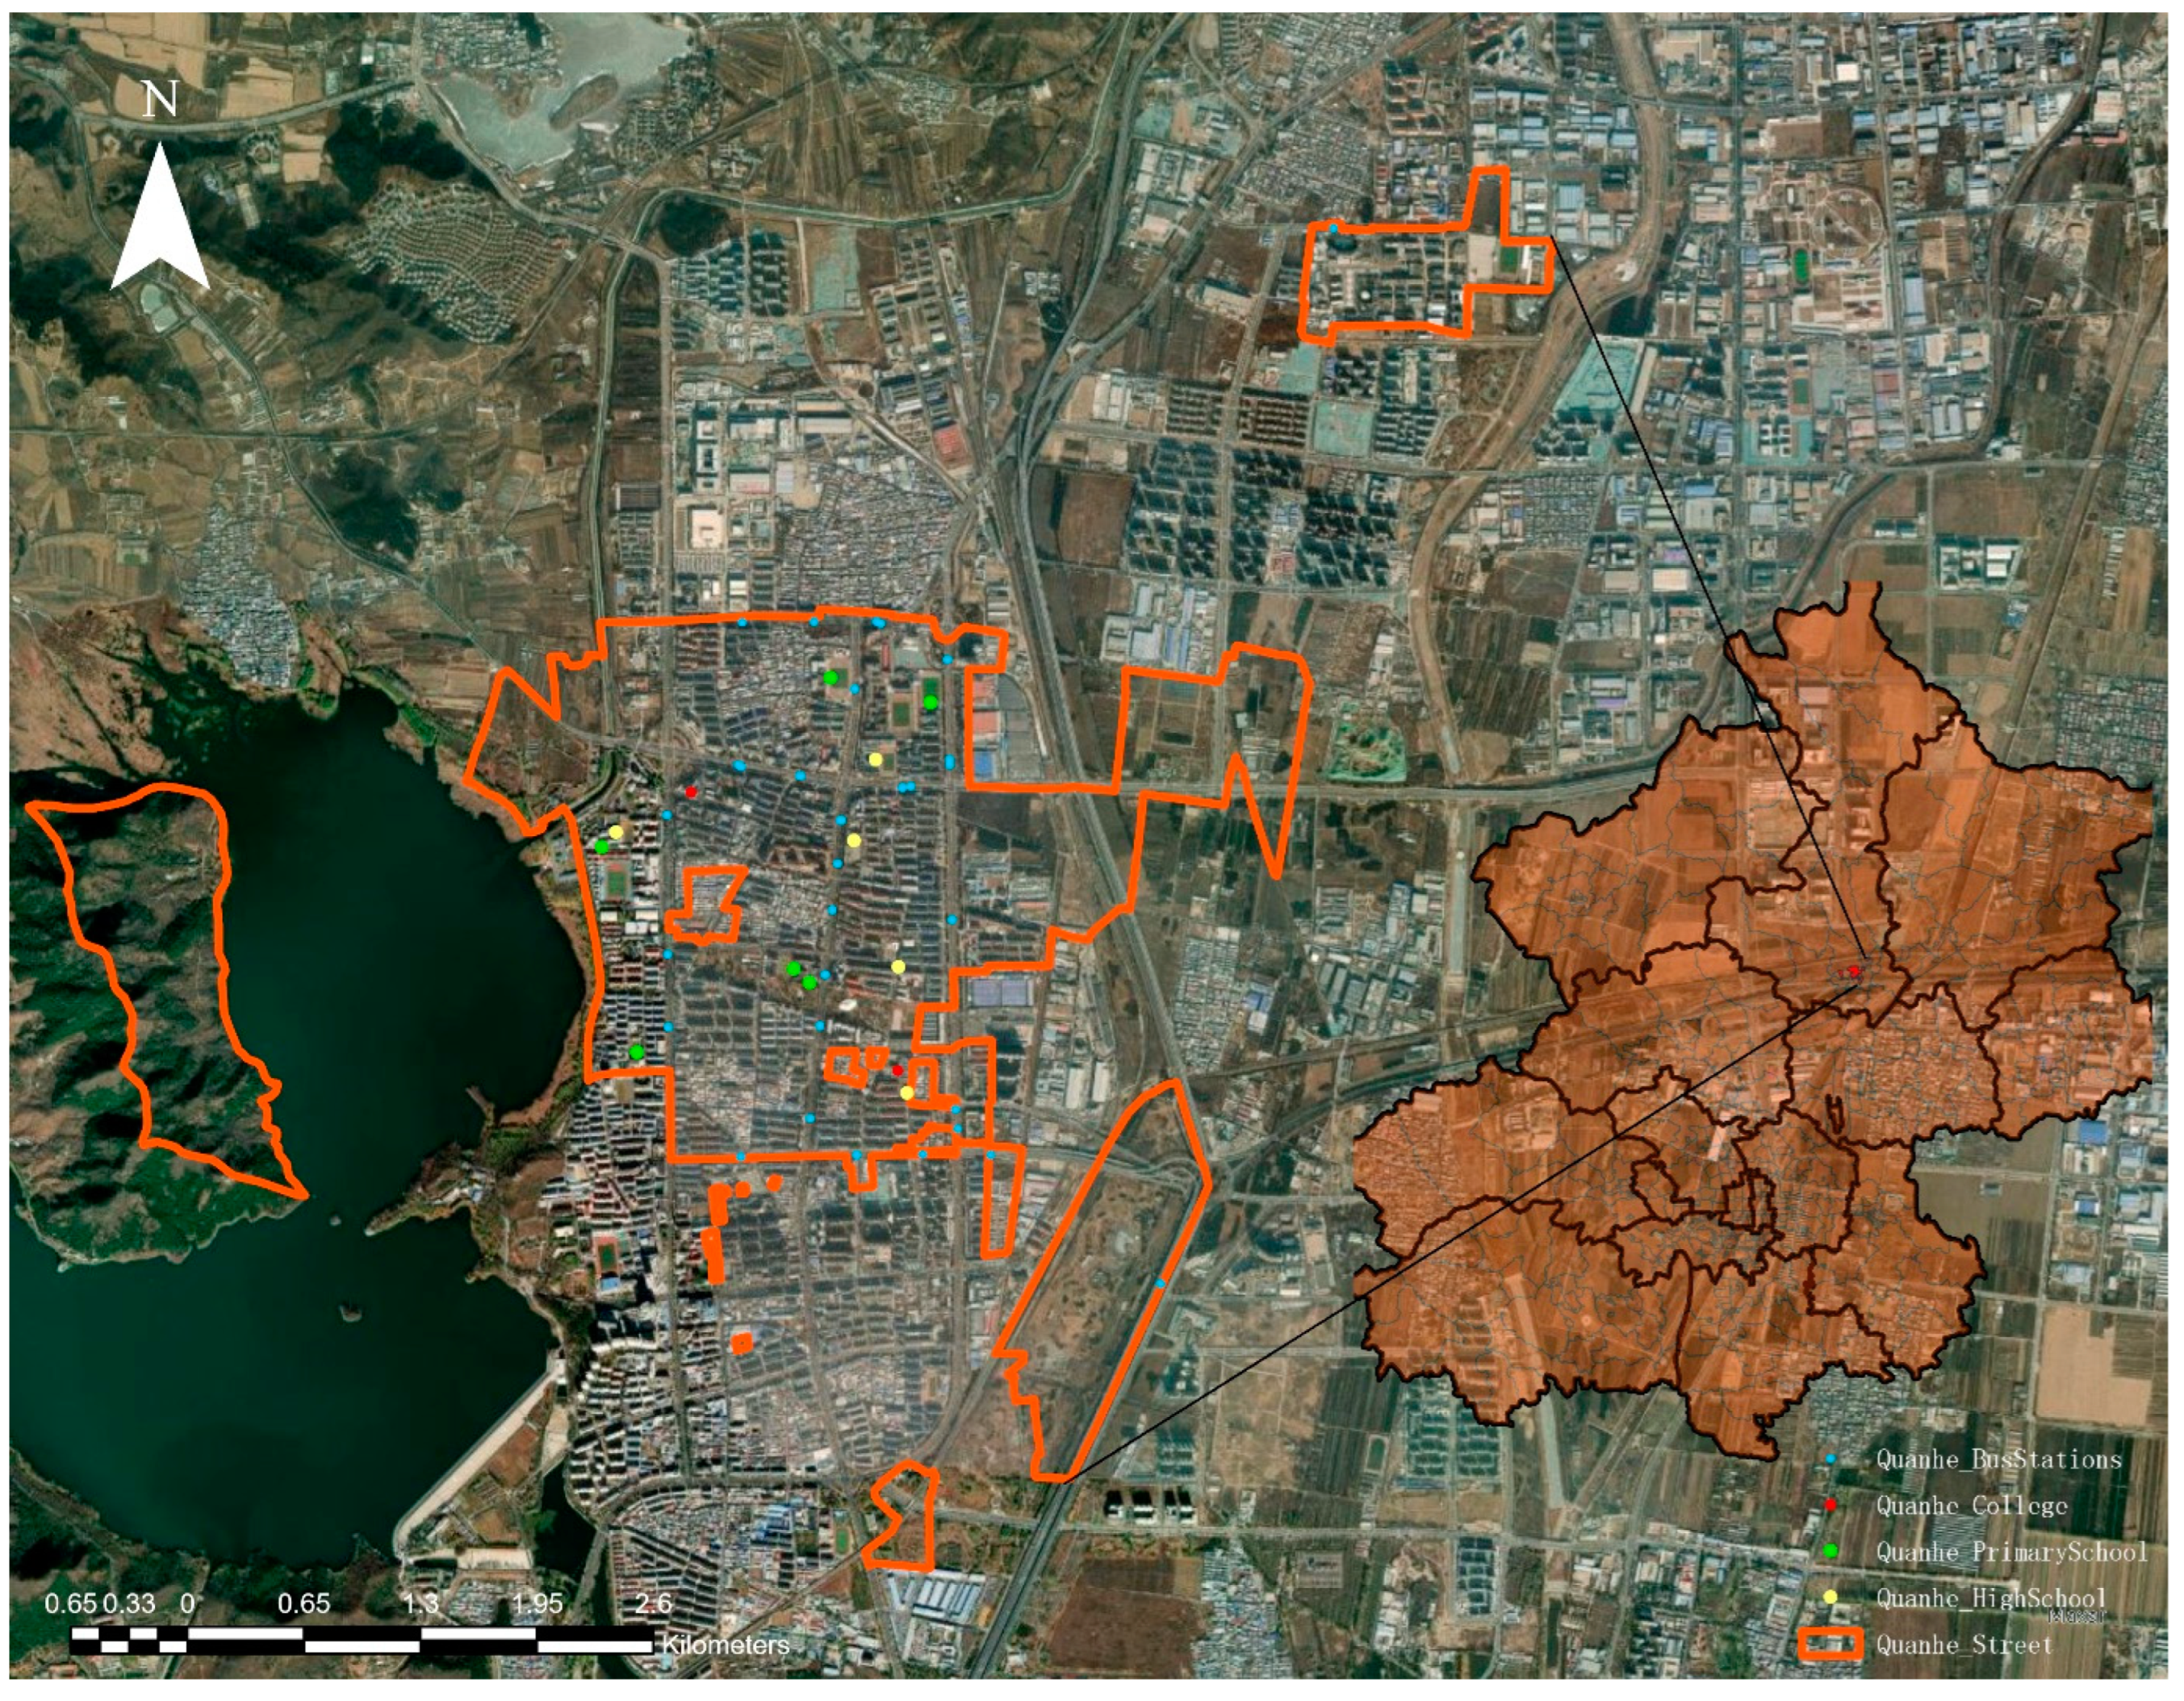
The low-quality human living environment in Beijing mainly focuses on three specific regions, namely, the northeastern, northern, and southwestern parts of the main urban area. Although subway stations are mainly located in the main urban area of Beijing, it is worth noting that some subway stations also exist in Yan Village Town, Xingcheng Street, and Chengguan Street, which are low-quality human living environment aggregation areas in the southwest of Beijing, all of which belong to Fangshan District. Unfortunately, other low-quality human living environment areas are not covered by subway facilities. However, it cannot be ignored that the bus system in Beijing is quite developed. A certain number of bus stations can be found in every independent township or street, especially in Drum Tower Street, Binhe Street, Quanhe Street, Victory Street, Perfume Garden Street, and Chengguan Street. In low-quality human living environment areas, residents’ travel mainly involves private cars and buses, mainly because there are almost no bicycle lanes and sidewalks that connect these areas to the main urban area. However, within low-quality human living environment areas, some parts still have internal bicycle lanes, among which Quanhe Street is most representative. Therefore, this article takes this as an example to propose specific improvement plans for the low-quality human living environment aggregation areas in Beijing.
Quanhe Street, shown in
Figure 19, like other areas where the low-quality human living environment is concentrated in Beijing, has a large number of undeveloped areas. Despite the presence of marked bike lanes on some of the roads in this area, it lacks sidewalks and subway stations completely. In face of the TOD development strategy for this area, the development and optimization of the public transportation network should be strengthened to a certain extent. It is worth noting that the eastern and southeastern parts of the area are completely uncovered by bus stations. Although some of these areas are undeveloped, there are still residents living there. There are a large number of schools in Quanhe Street, with primary and secondary schools almost all located near the two main roads on the left. However, there are only three bus stops on the far-left main road, which has obstructed the convenient connection between residents and schools. Moreover, the complete absence of sidewalks in this area also brings inconvenience to travel. In addition, the area should be encouraged to adopt a mixed-use development model. There are many undeveloped areas around bus stops distributed in the center of the street and surrounding areas. These areas can be prioritized for diversified commercial, cultural, or entertainment facilities. Under the promotion of the TOD model, community environment construction should also be strengthened, as communities largely constitute people’s daily life. For example, providing parks, plazas, and other public spaces can not only enhance community vitality but also further improve the quality of life for community residents.
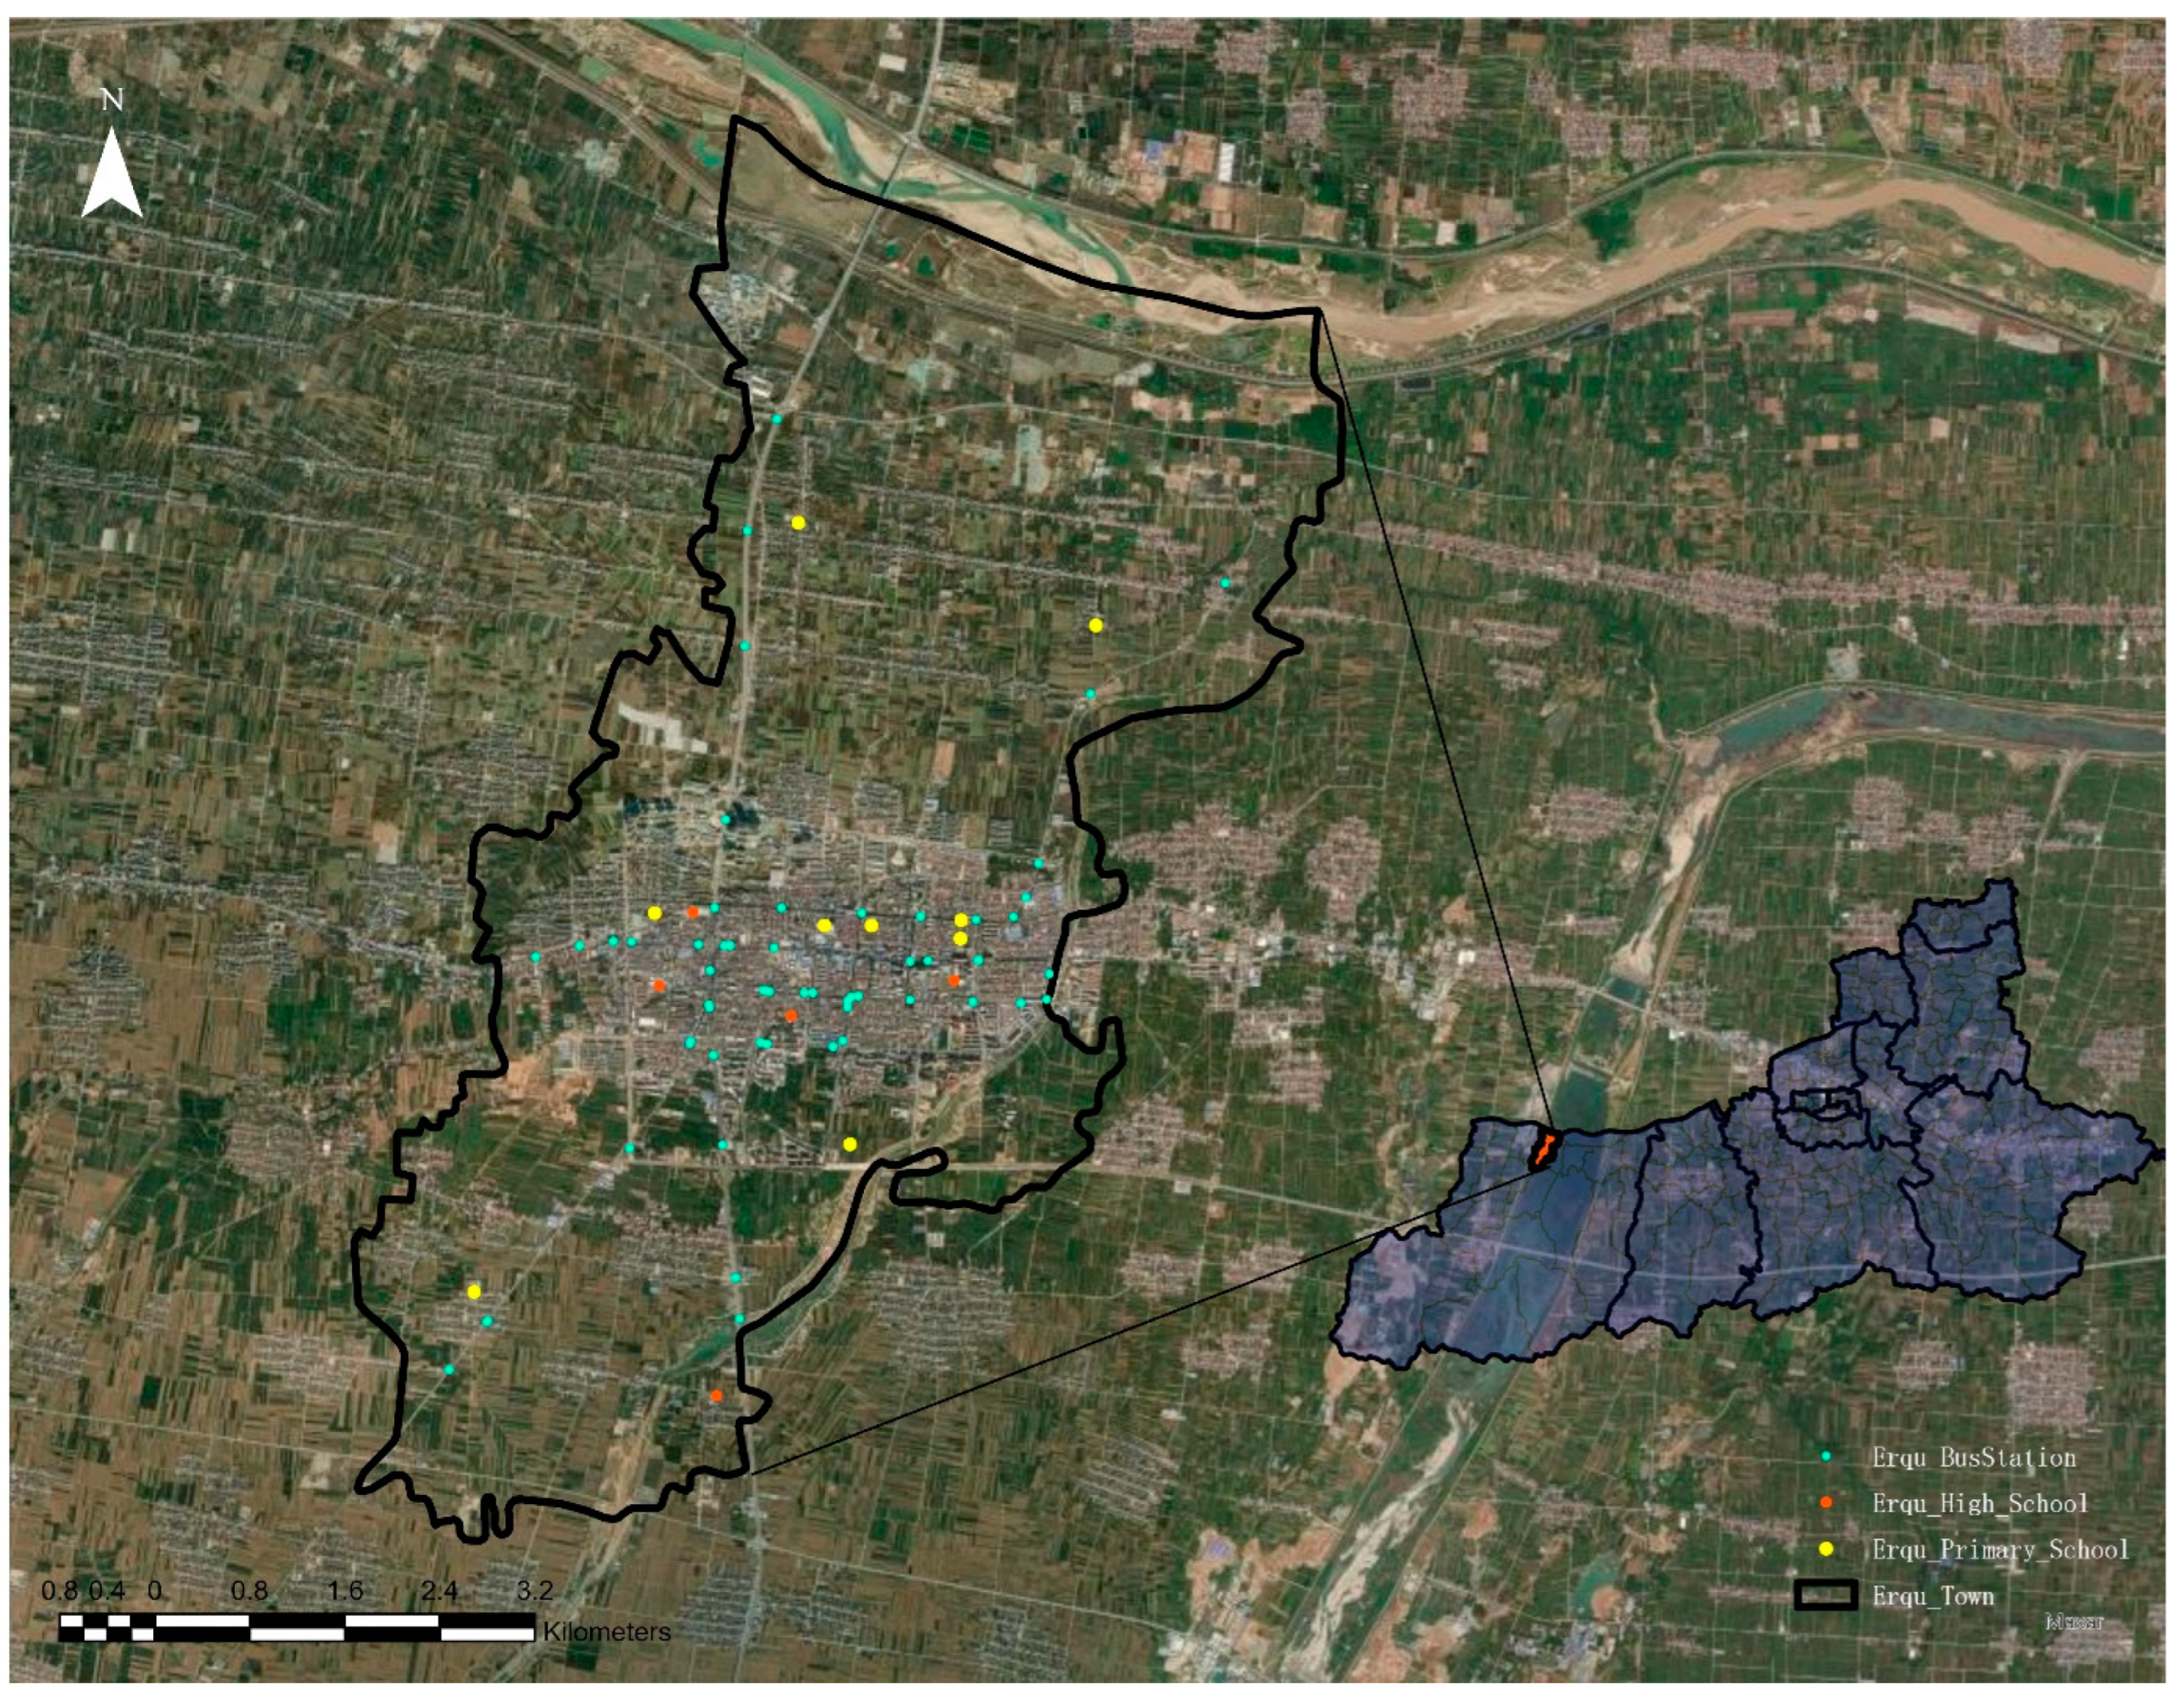
In the ancient city of Xi’an in northwest China, the quality of the human living environment in some areas is significantly problematic, especially in terms of transportation facilities, which show a large service gap compared to the national capital Beijing. In the villages and blocks of Xi’an, although the geographic area is relatively large, public transportation facilities such as bus stops are relatively scarce. Even more serious is that apart from the main urban area, other areas of Xi’an are basically without subway services. In some villages and streets, it is even hard to find bus stops, not to mention the setting of bicycle lanes and sidewalks. In order to conduct in-depth research and propose effective solutions, this study chose Erqu Town, shown in
Figure 20, which has a human living environment of relatively low quality, as the empirical object. This area is far from the main urban area. Although there are relatively more bus stops than in the surrounding areas, their number is still insufficient. Through specific regional case analysis, we aimed to propose specific and implementable suggestions to improve the problem of low-quality human living environments in Xi’an. In addition, compared to Beijing, this area also faces unique challenges in the protection of historical and cultural heritage.
First of all, for any area, implementing an efficient TOD strategy for a robust and effective public transportation system constitutes a crucial foundation. In Erqu Town, the bus stops are mainly concentrated in the city center area. However, there are only two bus stops on the main road in the northeast direction, and there is a primary school nearby. This distribution of bus services, to a certain extent, makes it difficult for town residents to travel. Therefore, increasing the number of bus stops, especially in areas where residents are concentrated, is of great significance to improving the travel conditions of local residents. In addition, the area lacks bicycle lane facilities completely, preventing residents from choosing bicycles as tools for daily travel. Families with relatively limited economic conditions or those living far from bus stops often have to choose to ride on motorized roads, which not only brings significant traffic safety risks but also reduces the vitality and quality of the human environment of the city to a certain extent.
Secondly, Erqu Town still has a large number of undeveloped areas, which indicates its potential to develop more commercial and work areas. This can not only provide more job opportunities and life services for residents but also possibly create a pedestrian-oriented human living environment through the addition of more sidewalks, green parks, and other facilities. In such urban space construction, historical and cultural heritage has the opportunity to be closely integrated with modern city life, achieving a harmonious coexistence of history and modernity, which is of great significance for a historical and cultural city like Xi’an.
However, a comprehensive assessment of TOD necessitates the consideration of a myriad of factors. As proposed by Jain Singh et al., there are eight influential local TOD determinants, namely urban density, land-use diversity, pedestrian and cycling-friendly spaces, economic development, passenger flow, user-friendly transportation systems, enhanced accessibility nodes, and parking supply. Additionally, Jain Singh et al. introduced a method for calculating the TOD index by employing multi-criteria analysis (MCA), a technique adept at interactively assessing multiple criteria or indicators with varying measurement units. When addressing spatial indicators, GIS-based MCA is used to evaluate several spatial metrics. Jain Singh and colleagues amalgamated spatial indicators related to density, land-use, and walkability, along with non-spatial indicators connected to transportation system frequency or passenger flow. To ensure comparability among indicators, they adopted the “maximum normalization method” for standardization. Moreover, while certain indicators are directly proportional to the TOD index, others exert a negative influence on the index upon reaching a specific threshold. To represent the relative importance of each indicator, weights are applied before calculating the TOD index through MCA. In practical cases, stakeholders like city council members participate in determining these weights and subsequently rank them using the Borda count method, ensuring a more rational and precise computation of the TOD index [
24].
5.2. Urban Planning Implications of TOD
City planning has a significant impact on the effectiveness and success of transit-oriented development (TOD) strategies. With the primary goal of TOD being to enhance urban living by centralizing essential functions around transit hubs, city planning can ensure that these hubs are strategically positioned to serve the majority of the population. In Beijing, for instance, the presence of a developed public transportation system suggests a higher likelihood of successful TOD implementation [
25]. On the other hand, Xi’an, which lags in public transportation infrastructure, might face challenges in utilizing TOD to its maximum potential. Proper city planning can also aid in seamlessly integrating historical and cultural preservation into modern urban development, especially vital in cities like Xi’an with rich historical significance.
5.3. Limitations and Prospects of TOD in Urban Planning
Implementing TOD in cities with established infrastructures and land-use patterns presents intrinsic challenges. Redesigning or retrofitting these urban spaces might be time-consuming, costly, and might face resistance from existing stakeholders. Moreover, the geographical scale utilized in this study is relatively expansive, which could potentially lead to overlooking certain micro-details. In future studies, we intend to opt for smaller, more specific research areas to delve deeper into local characteristics and demands. A continuous commitment to maintaining public transportation services is required for TOD, which might strain cities already operating on tight budgets. However, the prospects of TOD are promising. With the ongoing surge in urban populations, there is rising demand for sustainable and efficient urban living solutions. Effectively implemented TOD can reduce traffic congestion [
26], improve air quality, and promote healthier lifestyles through walkability and community engagement [
27]. For cities like Beijing and Xi’an, embracing TOD could pave the way for sustainable urban growth, harmonizing modernity with tradition, and fostering vibrant communities that prioritize environmental conservation.
6. Discussion
Beijing and Xi’an exhibit notable differences across key indicators like living environments, facilities, transportation, and safety. Beijing has a diverse residential environment with evenly distributed resources and facilities. Xi’an, conversely, has resources and facilities centralized in urban areas, with the eastern region rated lower, primarily due to substantial arable land limiting green spaces. Both cities reveal clusters of high-quality living environments within their urban cores. Still, Beijing’s lower-quality areas are scattered toward the outskirts, while Xi’an’s are concentrated in its western and eastern sections. Factors like income, resource distribution, and transportation convenience play significant roles in these patterns. Beijing’s advanced public transport system provides a robust foundation for implementing transit-oriented development (TOD). In contrast, Xi’an’s approach should focus on balancing urban expansion with historical preservation and investing in transportation infrastructure. Local historical, cultural, and economic contexts further contribute to the distinct challenges and opportunities faced by each city in their urban planning endeavors.
Beijing and Xi’an, despite both being significant Chinese cities, have distinctive historical, geographical, and socio-economic contexts that contribute to their differences. Beijing, as the capital city, has experienced consistent governmental investment over the decades, aiding its infrastructural, economic, and urban development. Its status as an international hub for politics, culture, and business further attracts a diverse population and multinational corporations [
28]. In contrast, Xi’an, while historically significant as the starting point of the Silk Road and the ancient capital of several Chinese dynasties [
29], has been more regionally focused in its development. It is renowned for its rich cultural heritage, with attractions like the Terracotta Warriors. Geographically, the natural landscapes and available resources also differ, influencing urban planning and development priorities. Economic disparities, driven by varying industrial focuses and investment levels, further result in distinct urban infrastructures, resource allocations, and public services.
As cities continue to expand and change, grasping their spatial dynamics becomes ever more important. Turning to LISA for spatial insight seems to be a promising approach for upcoming urban studies. This technique can help identify distinct spatial clusters in a city, paving the way for nuanced examinations, such as pinpointing key areas or anomalies. Given the innate propensity of city data for spatial autocorrelation, the significance of LISA can not be overstated [
30]. Additionally, its practical application and ability to visualize data means urban planners and decision-makers can more readily understand the city’s spatial narrative. With the influence of both local and global spatial relationships in mind, our future analyses with LISA will be supplemented with other statistical methods to guarantee accuracy. At its core, by utilizing LISA, our research aims to delve deeper into the spatial tales cities tell, laying down a solid base for their sustainable evolution. Furthermore, the kernel density estimation (KDE) method represents a promising approach for analyzing the human living environment. Shahzad et al., in their study on traffic accidents using hotspot analysis, confirmed KDE as a potent spatial statistical tool capable of identifying hotspots and density distributions of critical factors such as population, social service facilities, and crime incidents. This method employs kernel functions to smoothen data, thereby generating continuous probability density surfaces, which aids in gaining a deeper understanding of the geographical distribution patterns within the human living environment. KDE not only facilitates highly visual representations of data distribution but also offers quantitative support for urban planning and resource allocation. This approach equips urban planners with robust tools to better identify and address urban challenges, optimize resource allocation, and enhance community accessibility, ultimately advancing sustainable urban development. Consequently, the KDE method holds vast potential for applications in the field of human living environment analysis [
31]. Furthermore, Anderson provides two detailed examples analyzing different types of accident hotspots. The first example involves the “Illicit Late-Night Zone 1 Pedestrians” hotspot, characterized by a cluster of accidents occurring between midnight and 3 a.m. and early on Sunday mornings. These accidents primarily take place at or near pedestrian crossings and bus stops, resulting in severe injuries. The KDE method reveals the temporal and spatial characteristics of this hotspot. The second example is the “Cyclists in Westminster” hotspot, covering a large geographical area and exhibiting a high number of accidents, particularly involving cyclists. KDE technology aids in identifying the impacts and features of different types of accidents. These two examples highlight the significance of KDE technology in identifying and comprehending road accident hotspots. The article underscores the advantages of KDE technology, which can assist researchers in gaining a more comprehensive understanding of the characteristics of various accident hotspots [
32].
While this study offers suggestions for improving the living environment and advancing sustainable development, there are certain limitations that warrant further emphasis and exploration. Firstly, the study did not delve deeply and comprehensively into the sustainability aspects of the cities under investigation. Sustainable development encompasses a range of complex issues, spanning environmental, social, and economic dimensions. To address this shortcoming, future research can conduct a more in-depth analysis of sustainable development practices, including energy conservation, environmental protection, urban planning, and community engagement. Another limitation is that the number of residents interviewed in this study was relatively small. Although subjective judgment data were obtained, interviewing a small group might introduce certain biases. Therefore, future research will consider conducting broader surveys and dialectical analyses to gain a more detailed understanding of the urban living environment. Moreover, future studies will also expand to encompass cities and regions in, but not limited to, China and other countries. Even though the current research was based on Beijing and Xi’an, there are significant differences between cities. Expanding the scope of the study can facilitate further exploration of the living environments across various cities.
Moreover, there are certain challenges associated with the data acquired and their collection process, including issues like latency and incompleteness. Ogryzek et al., in their study on Poland’s 3D land and property registration, highlighted that there is an increasing need in Poland for a system capable of capturing multi-layered spatial information. The 3D cadastral system can document not only surface structures but also underground facilities, such as subterranean parking lots and tunnels. Furthermore, the land registration system utilized in Poland preserves historical data related to local land and properties. This historical information, along with multi-dimensional spatial data, plays a significant role in influencing the living environment. However, for cities like Beijing and Xi’an, it appears that such data may either not have been collected or are not publicly disclosed [
33]. While the greening rate within residential areas has been considered, the vegetation condition along the streets lacks a standardized and objective measurement criterion. Nevertheless, Santoro et al. introduced an algorithm designed to accurately identify and enumerate fruit tree plantations. This methodology offers significant insights for urban and rural areas in their green space planning, ecological corridor design, and vegetation cover enhancement. Furthermore, by mitigating errors resulting from misidentifications, such as mistaking roads or buildings for trees, this algorithm ensures a high degree of accuracy and reliability, thus providing more precise data support for the well-being, comfort, and sustainability of the human living environment [
34]. This method not only offers an approach for a more comprehensive assessment of the human living environment but also provides a feasible algorithm. In future research, this algorithm will be taken into consideration.
7. Conclusions
This study conducted a comparison and analysis of the living environment in Beijing and Xi’an by examining key indicators such as residential environment, life environment, entertainment facilities, transportation convenience, and safety. The research revealed significant differences in the spatial distribution of these life elements in the two cities. Beijing presents a diversified residential environment, balanced resource distribution, and extensive public facilities, while Xi’an shows a concentrated distribution of resources and facilities, with particularly low living environment ratings in the eastern part of the city. Regarding public transportation and the implementation of transit-oriented development (TOD) strategies, Beijing, with its advanced transportation system, shows greater potential for implementing TOD. However, for Xi’an to implement TOD strategies effectively, it must invest more resources in building and improving its public transportation facilities. This comparative analysis provides an understanding of the quality of life in the two cities for urban planning.


