

Observed Equity and Driving Factors of Automated External Defibrillators: A Case Study Using WeChat Applet Data
 ,
,
Abstract
:1. Introduction
2. Data and Methods
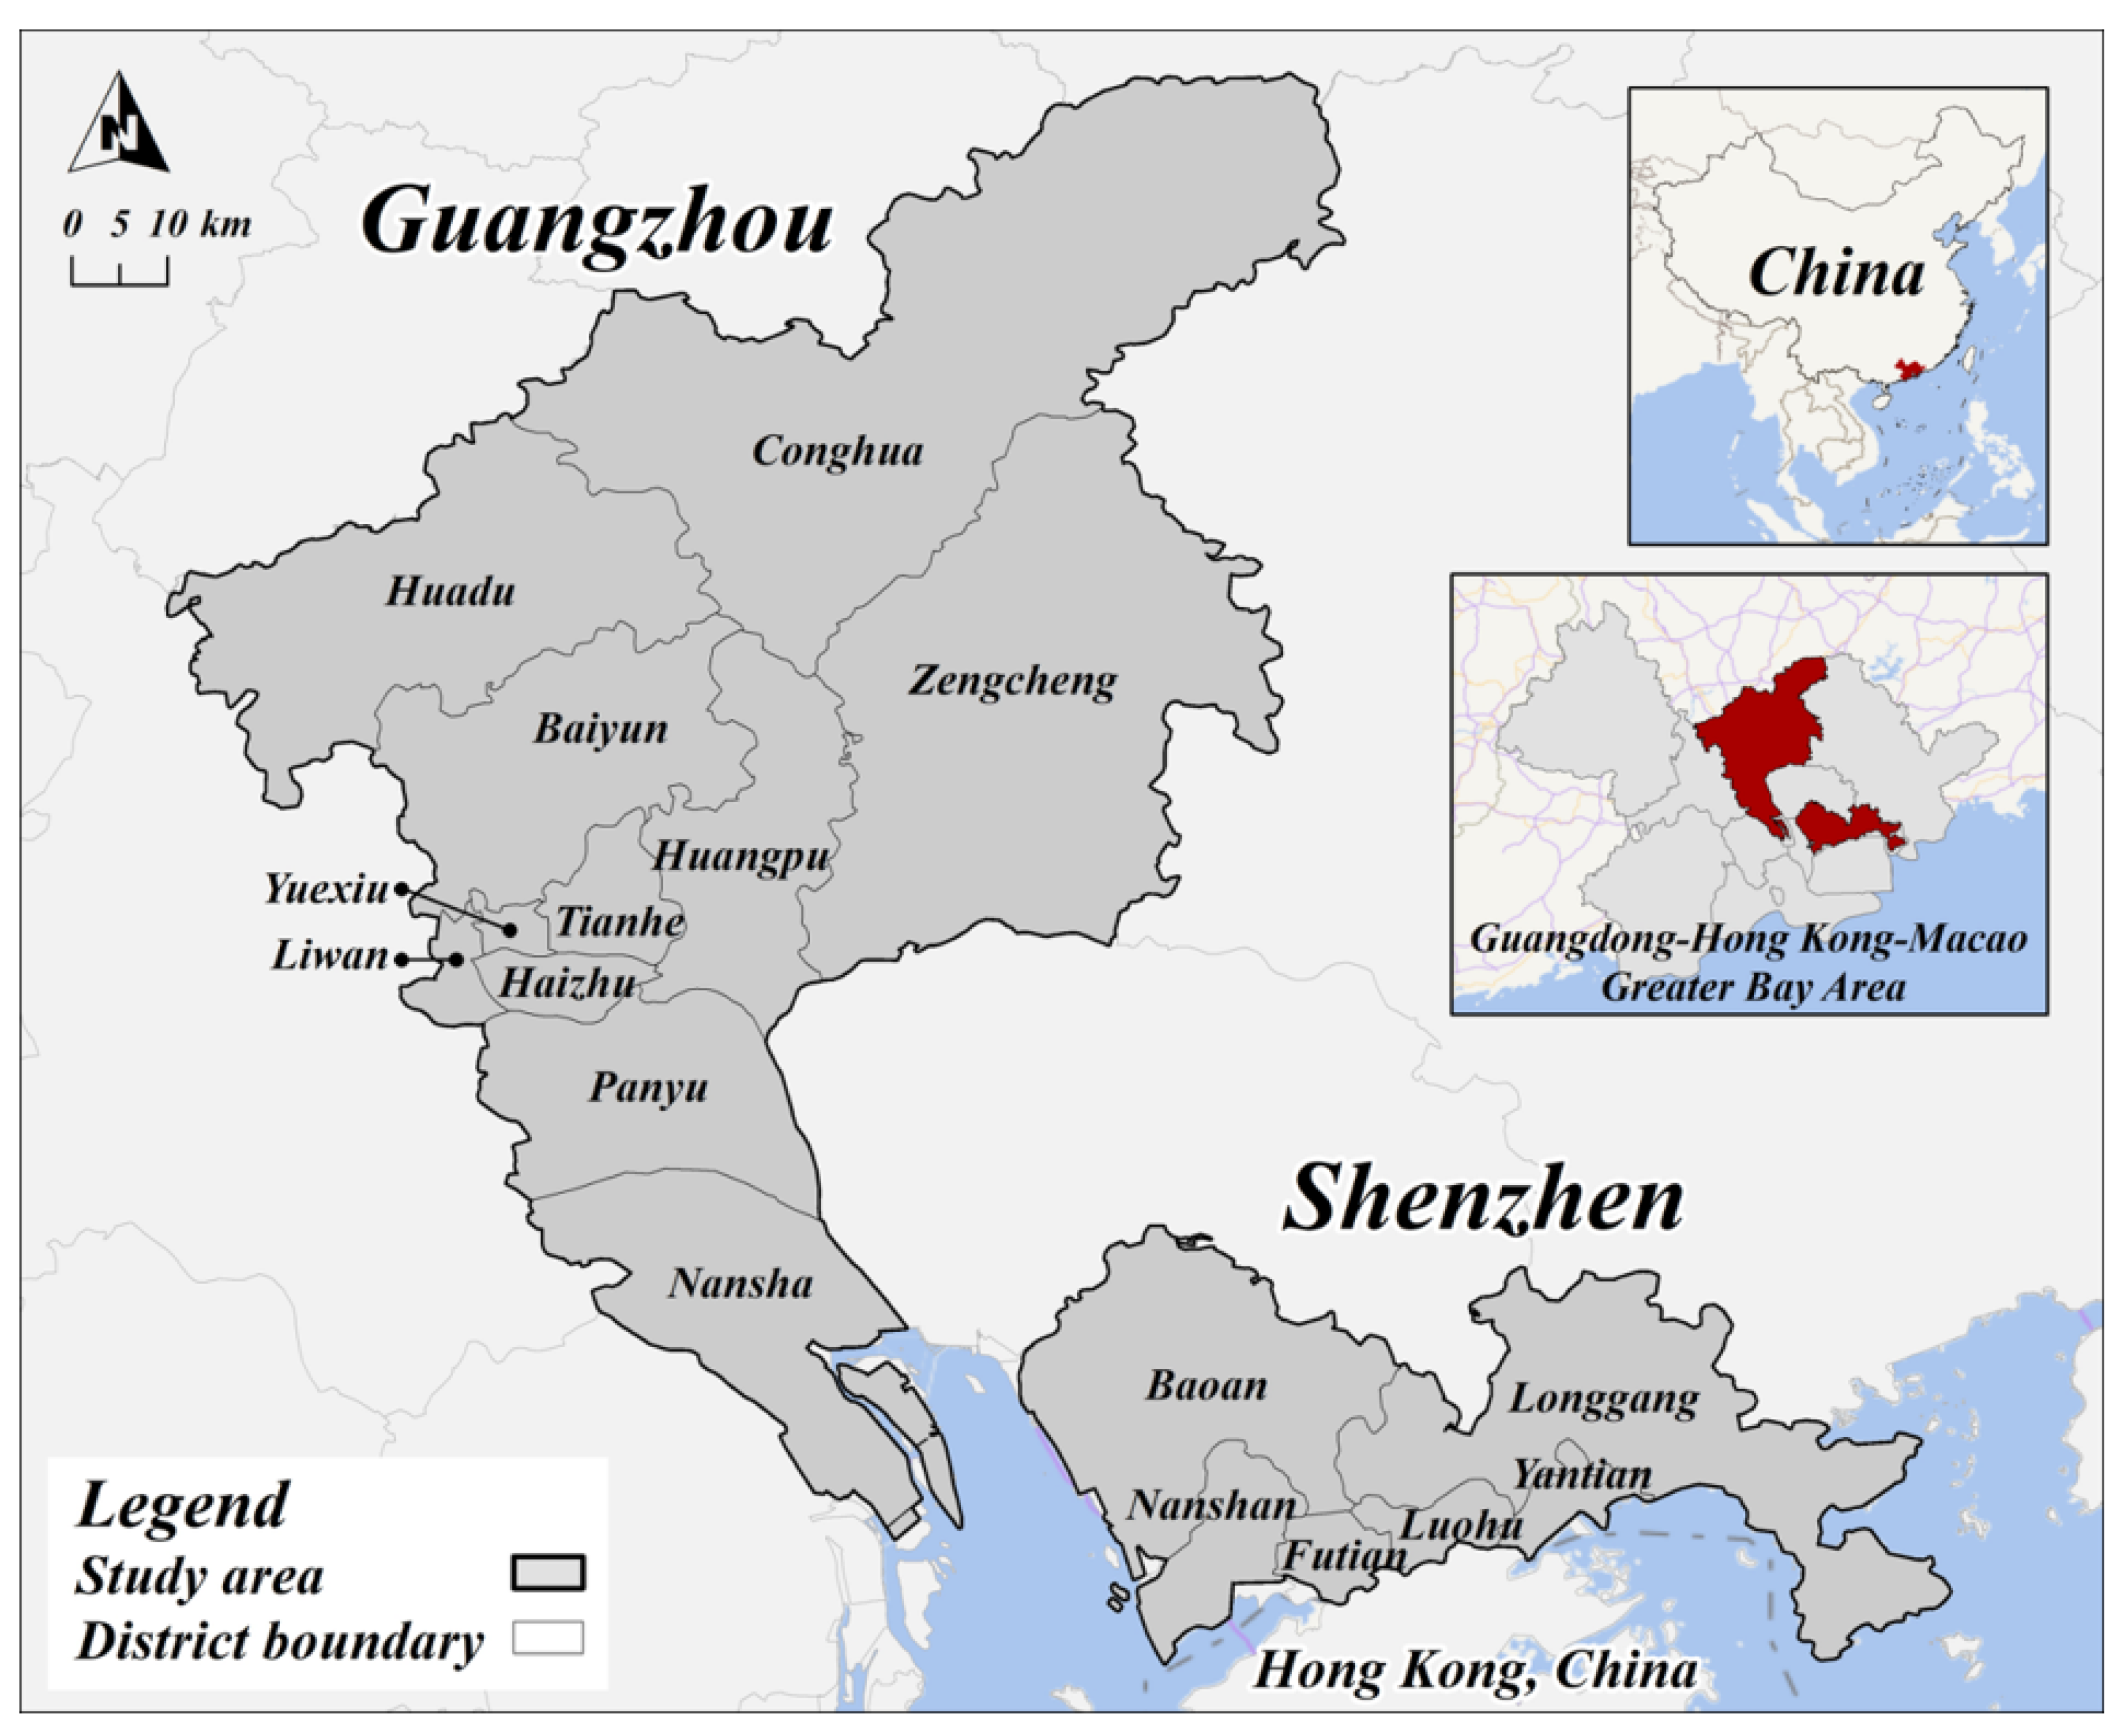
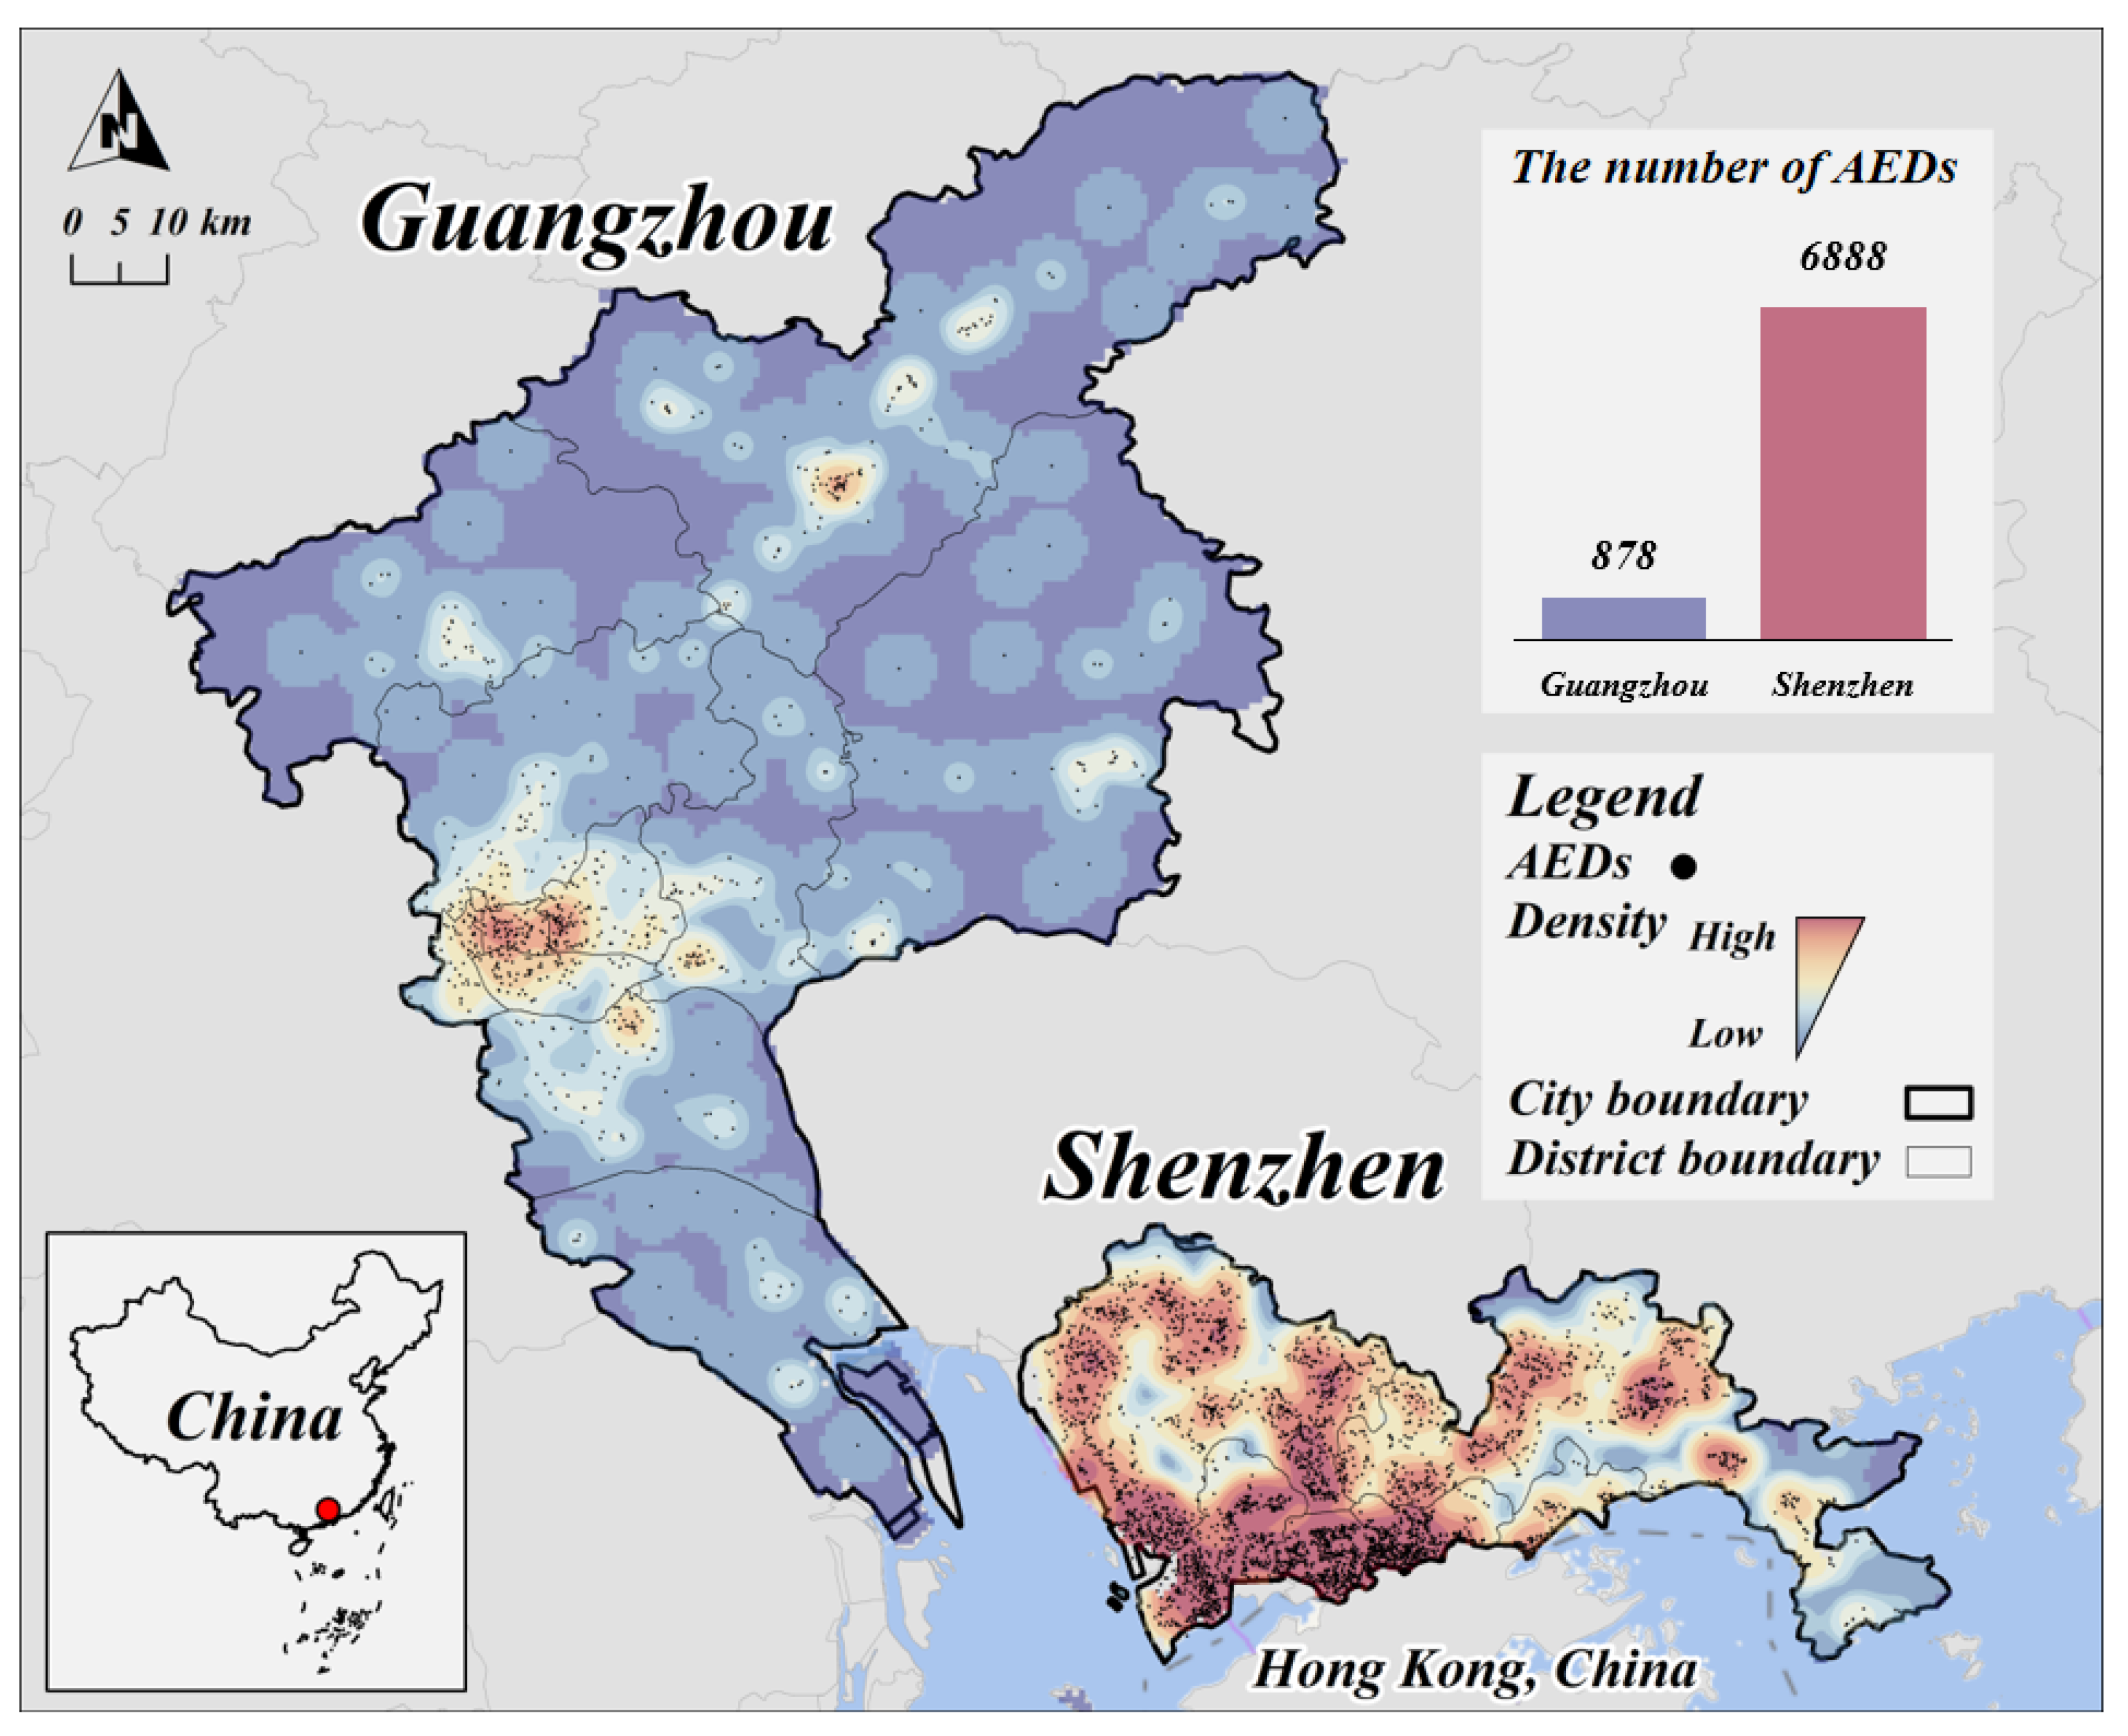
2.1. Study Area
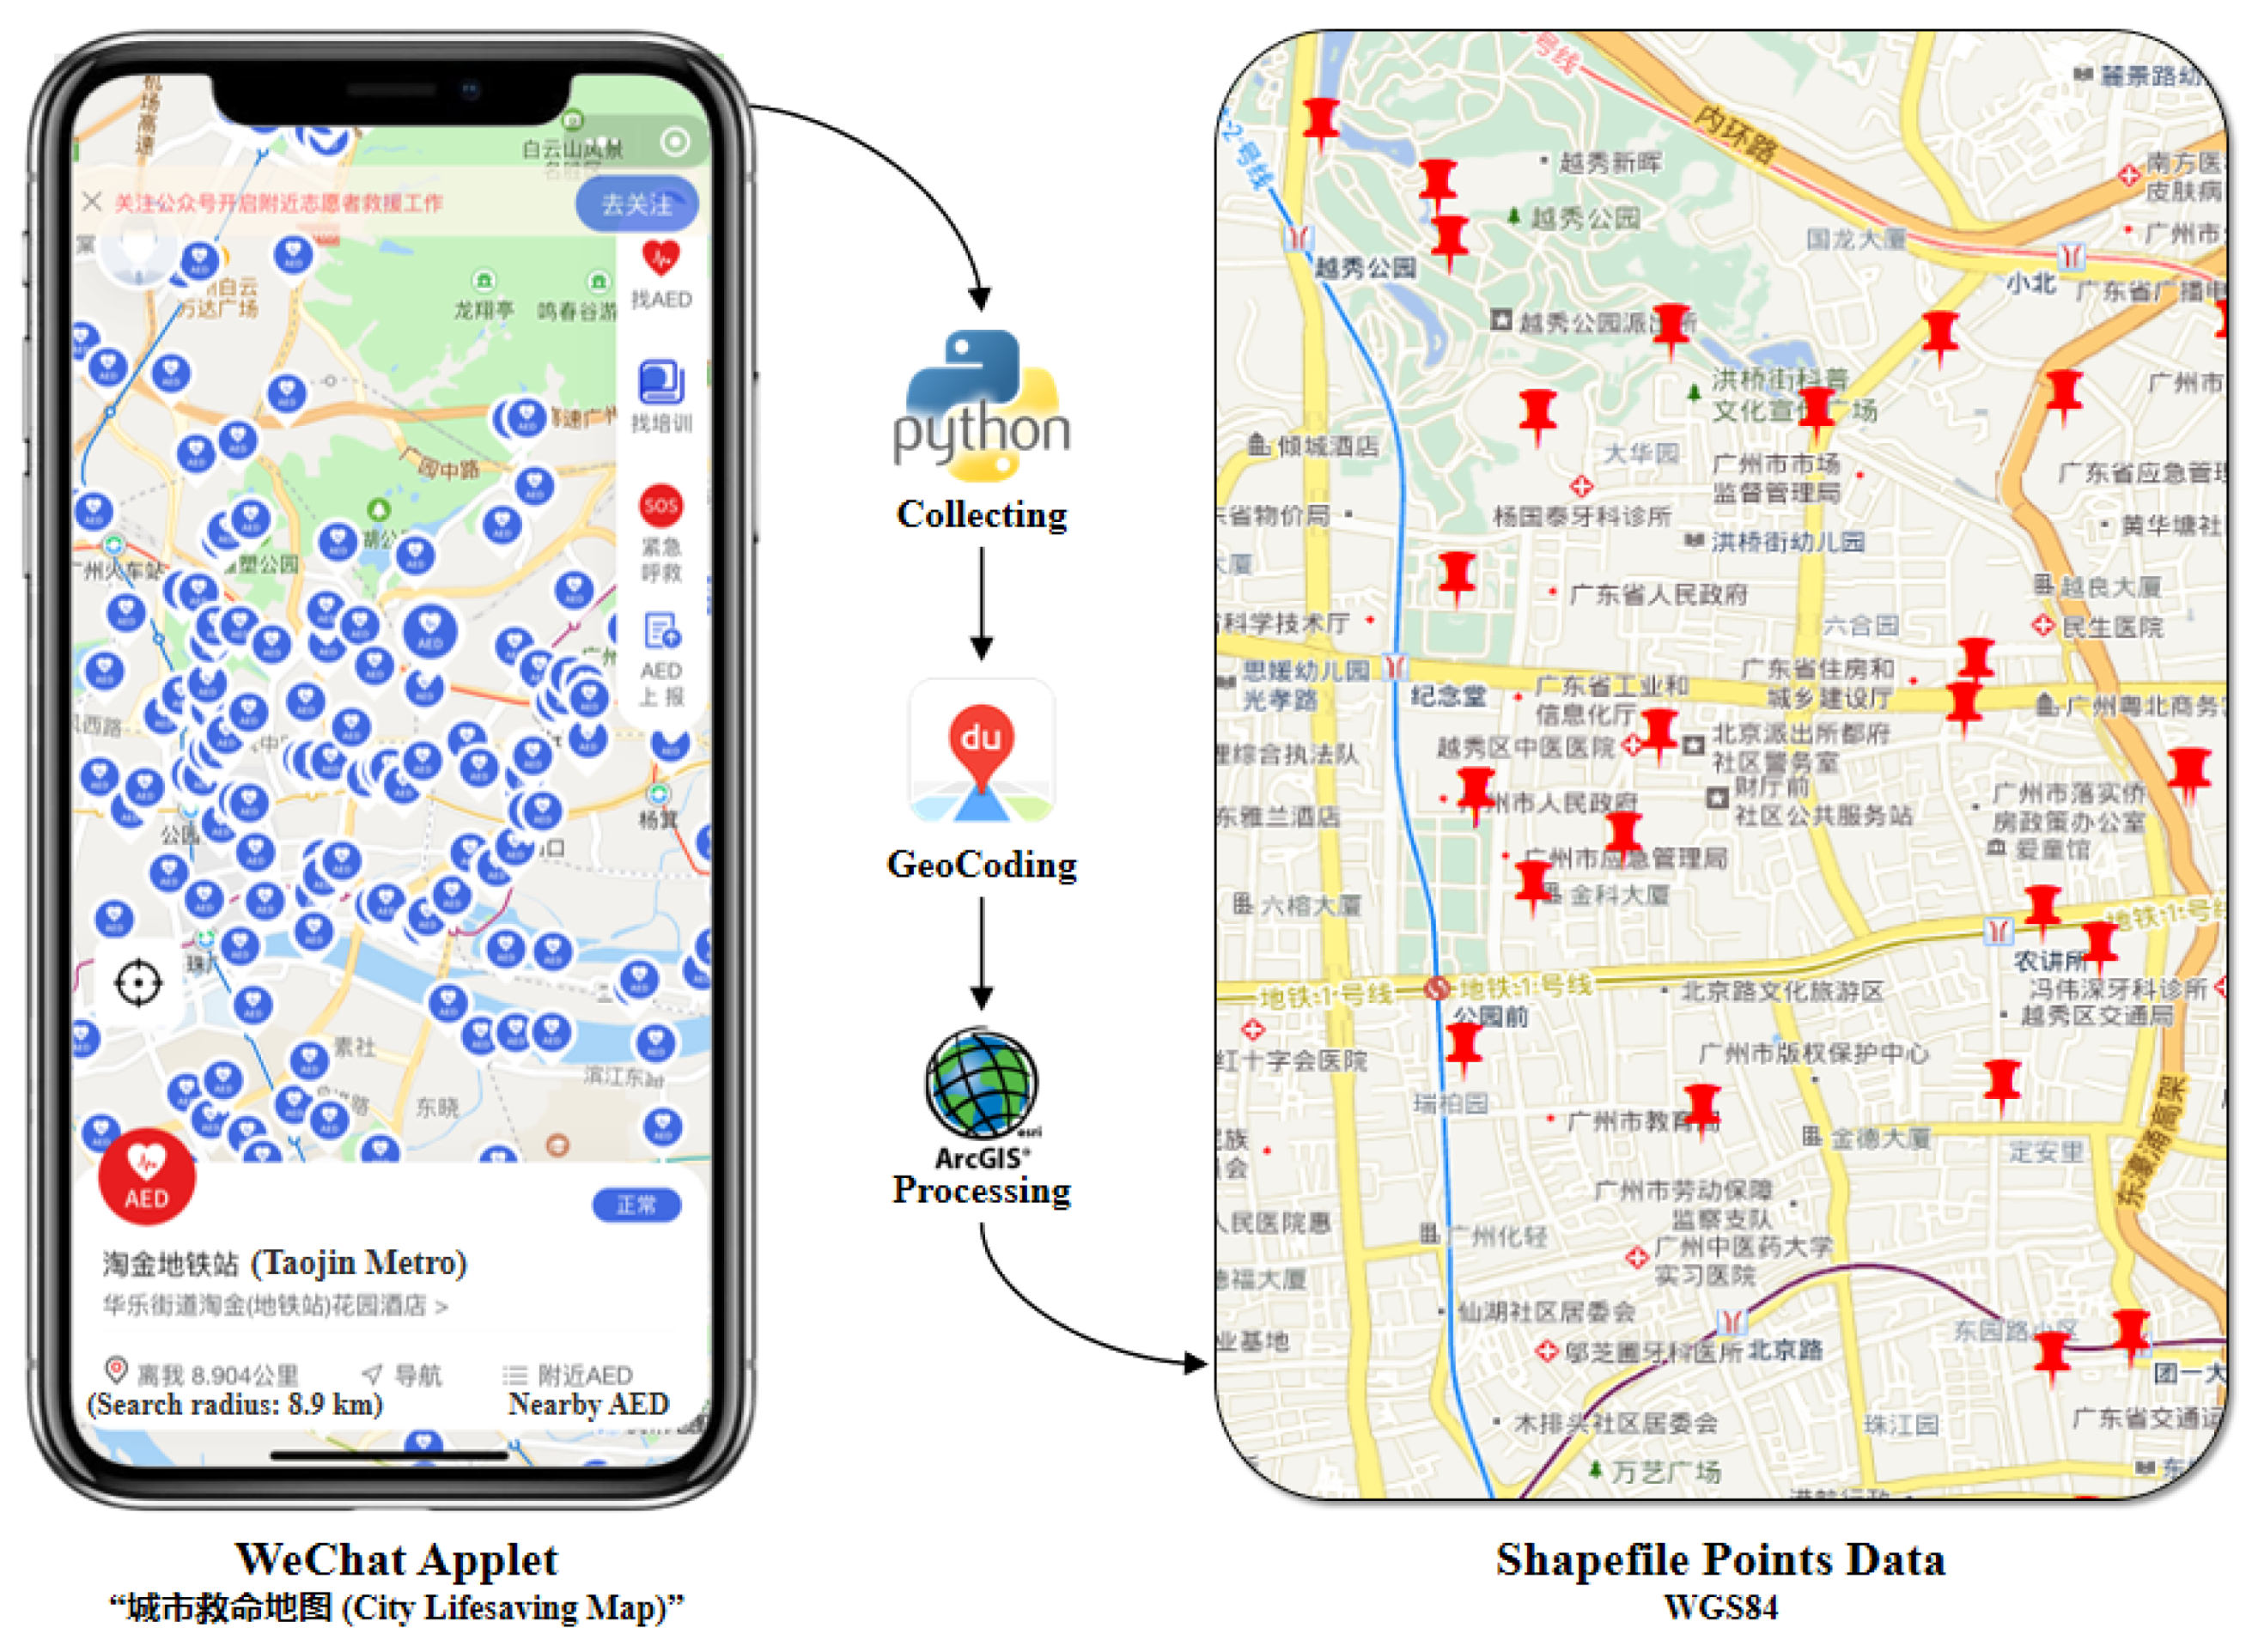
2.2. AED Data
2.3. Methods
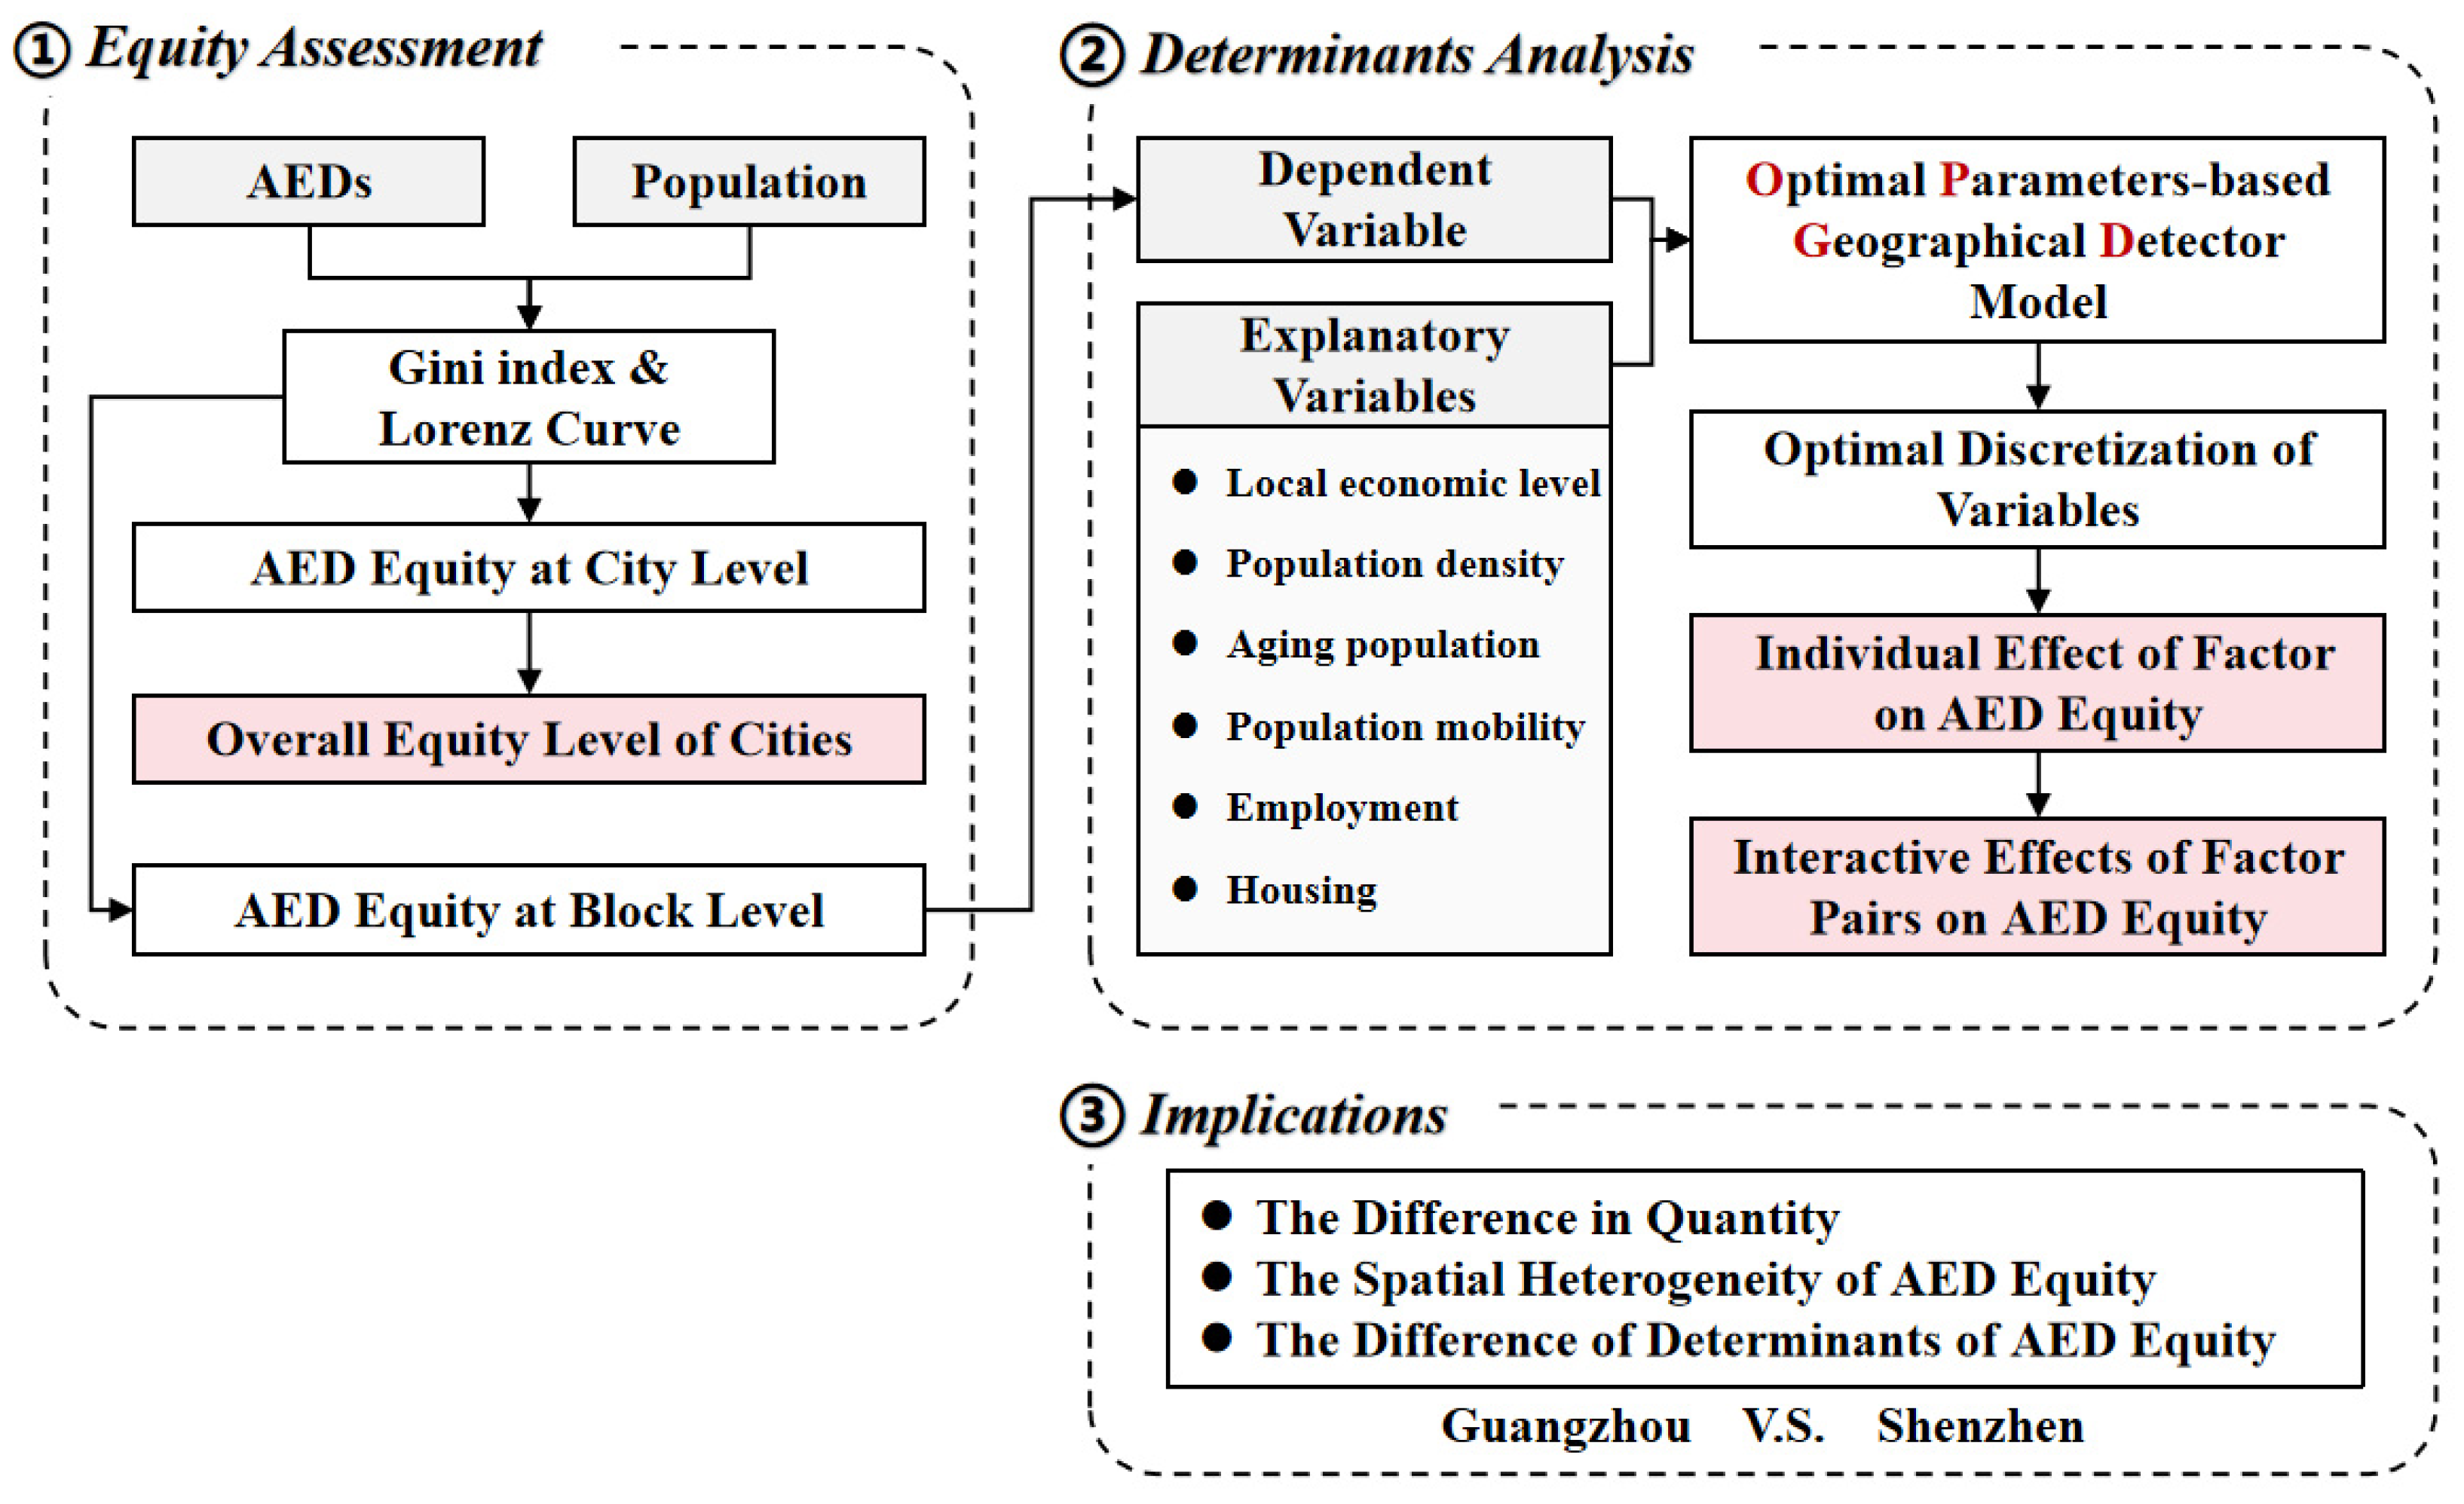
2.3.1. Overall Workflow
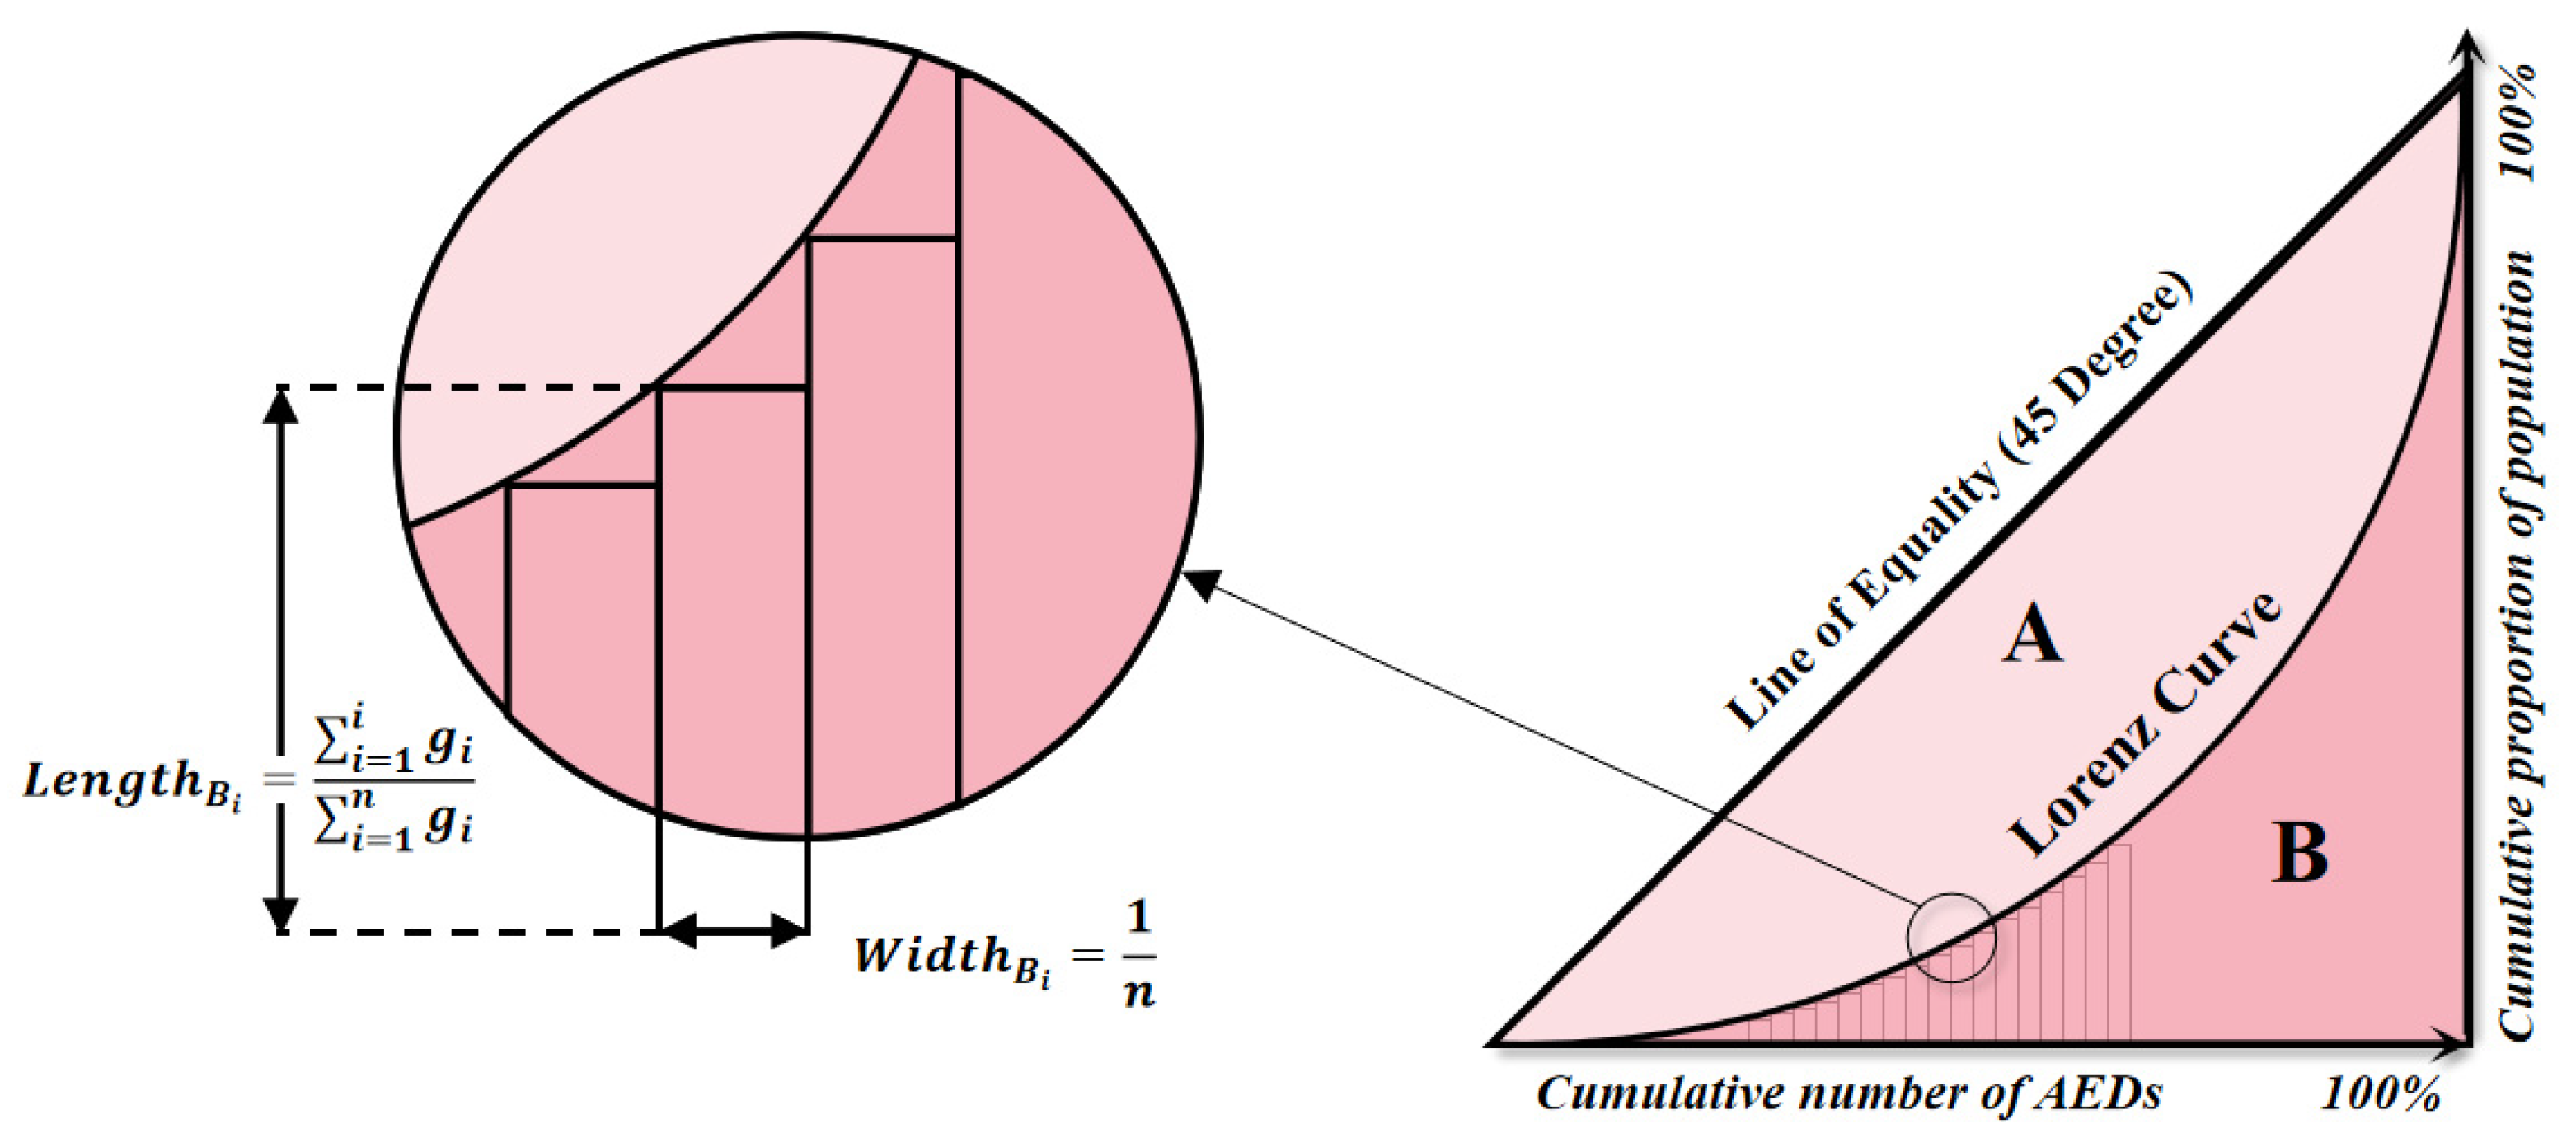
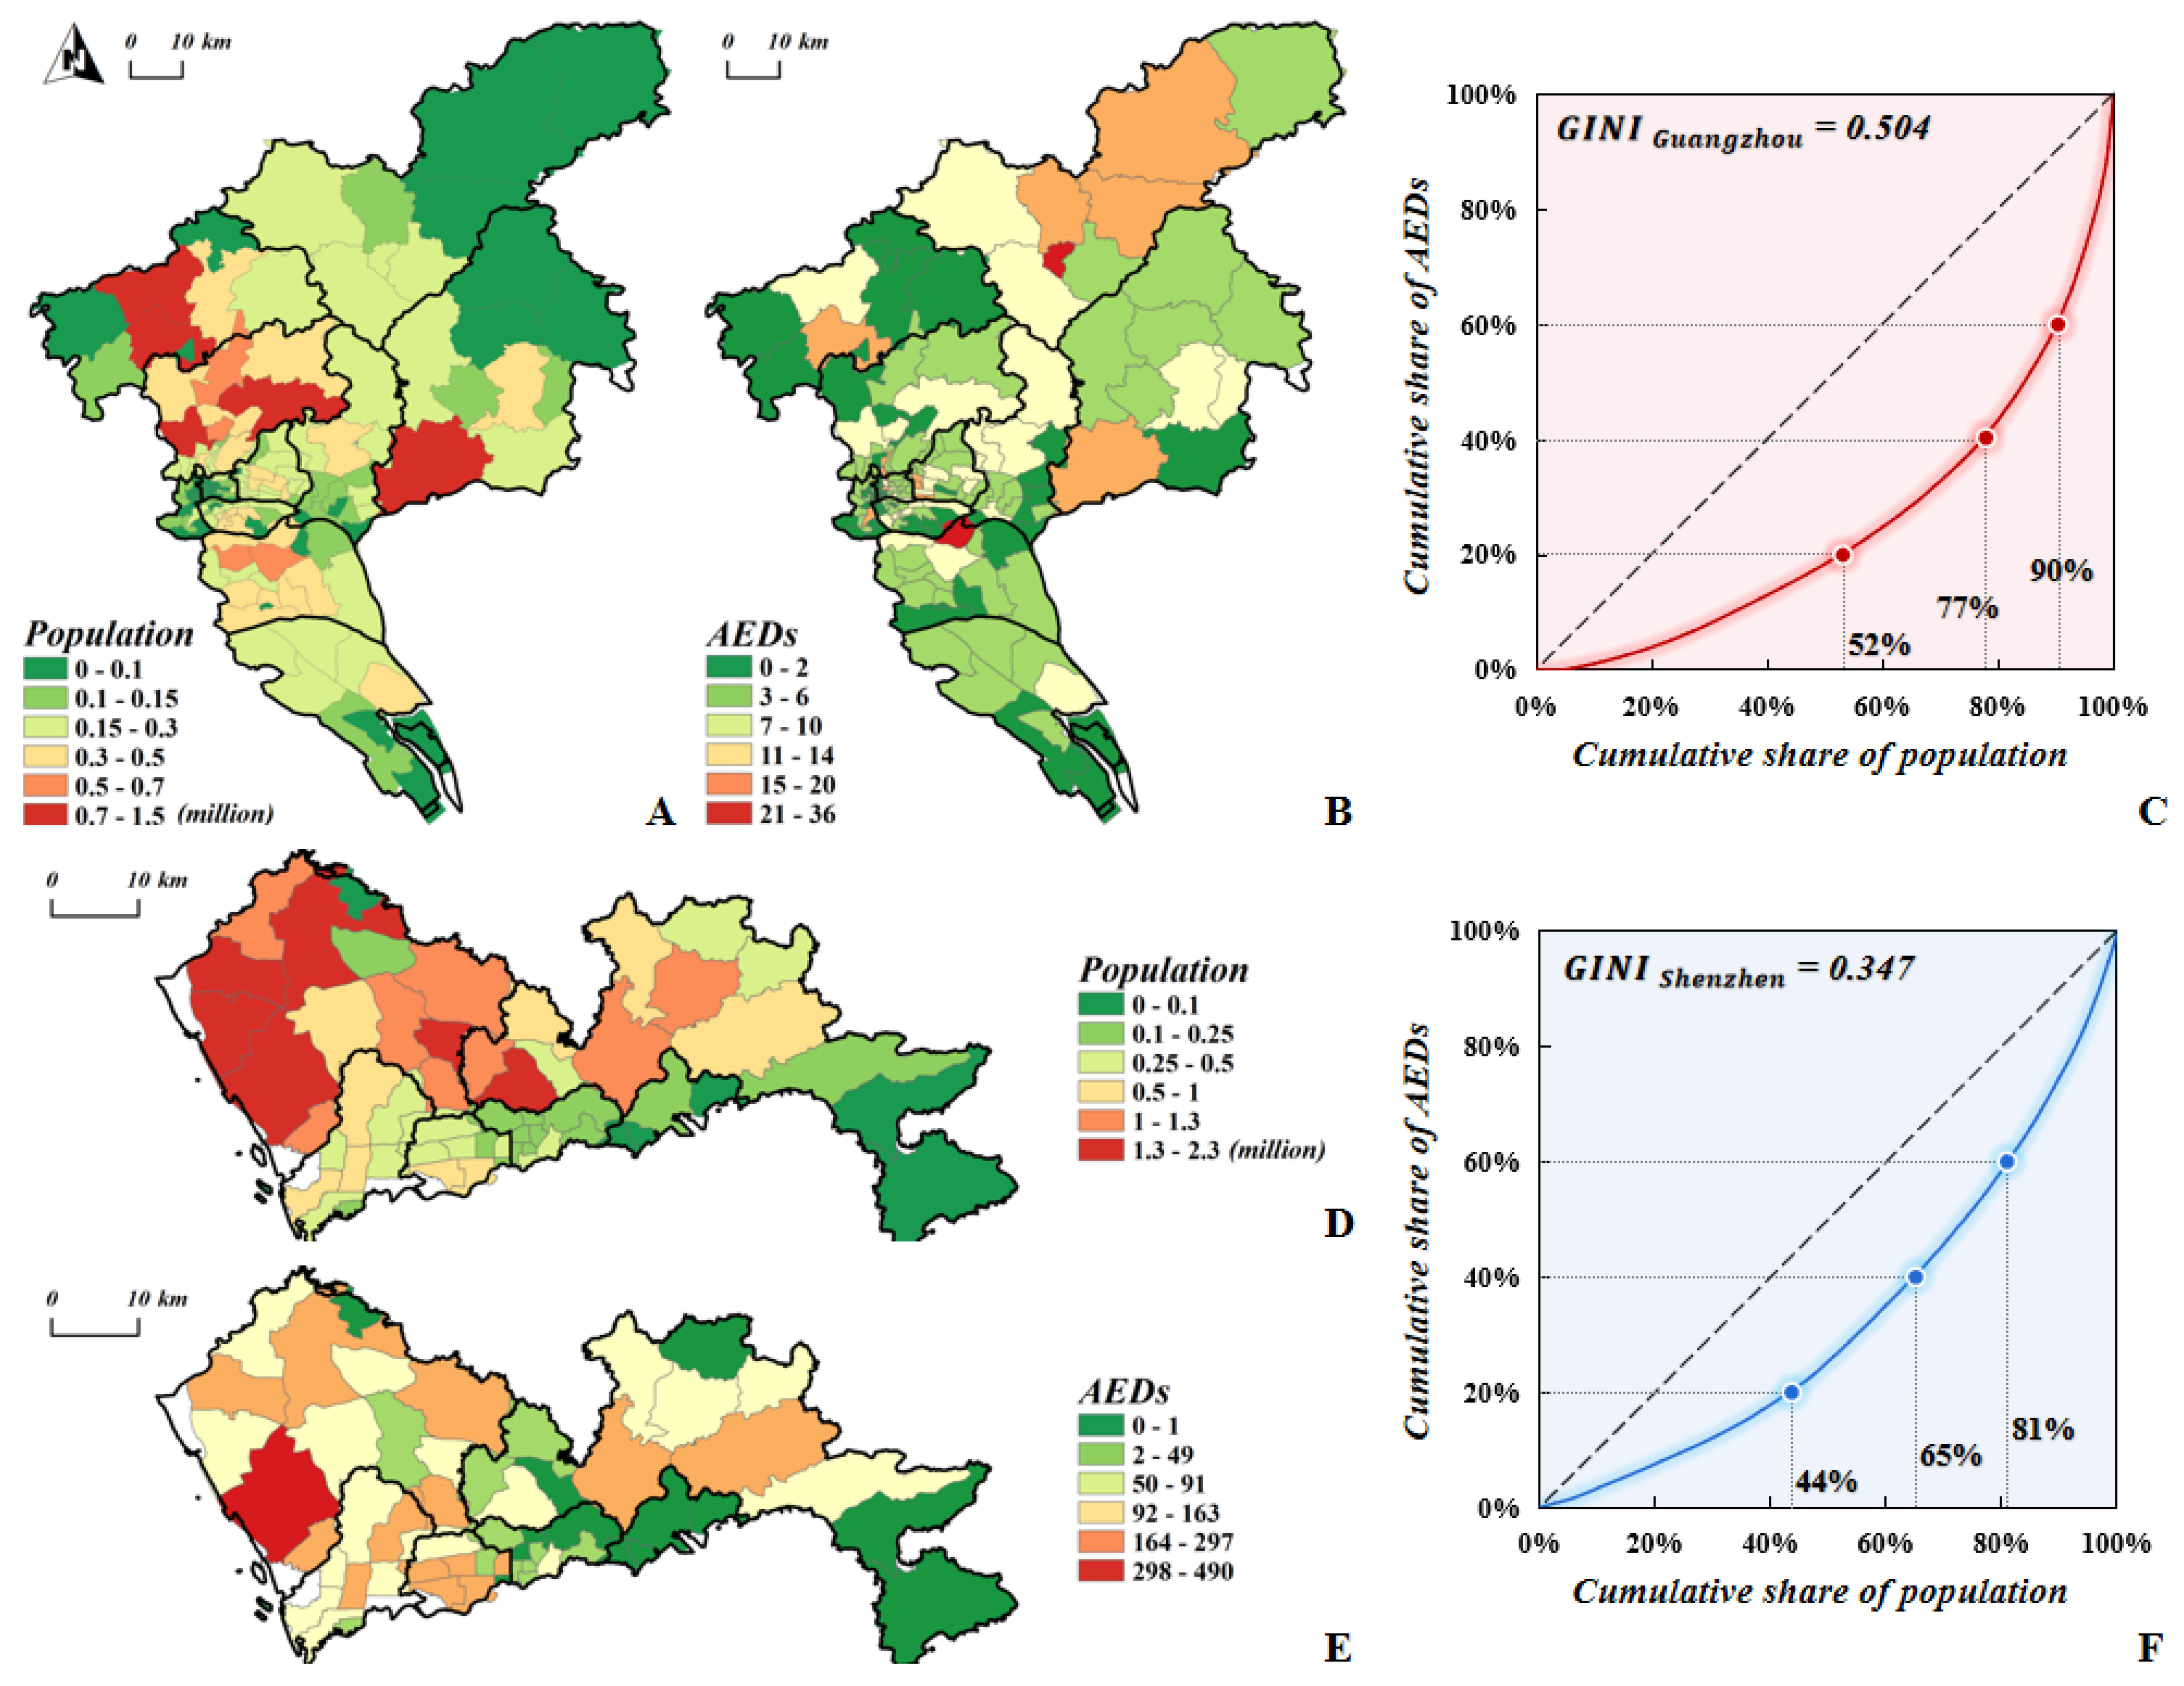
2.3.2. Equity Assessment with Gini Index and Lorenz Curve
2.3.3. Optimal Parameters-Based Geographical Detector (OPGD) Model
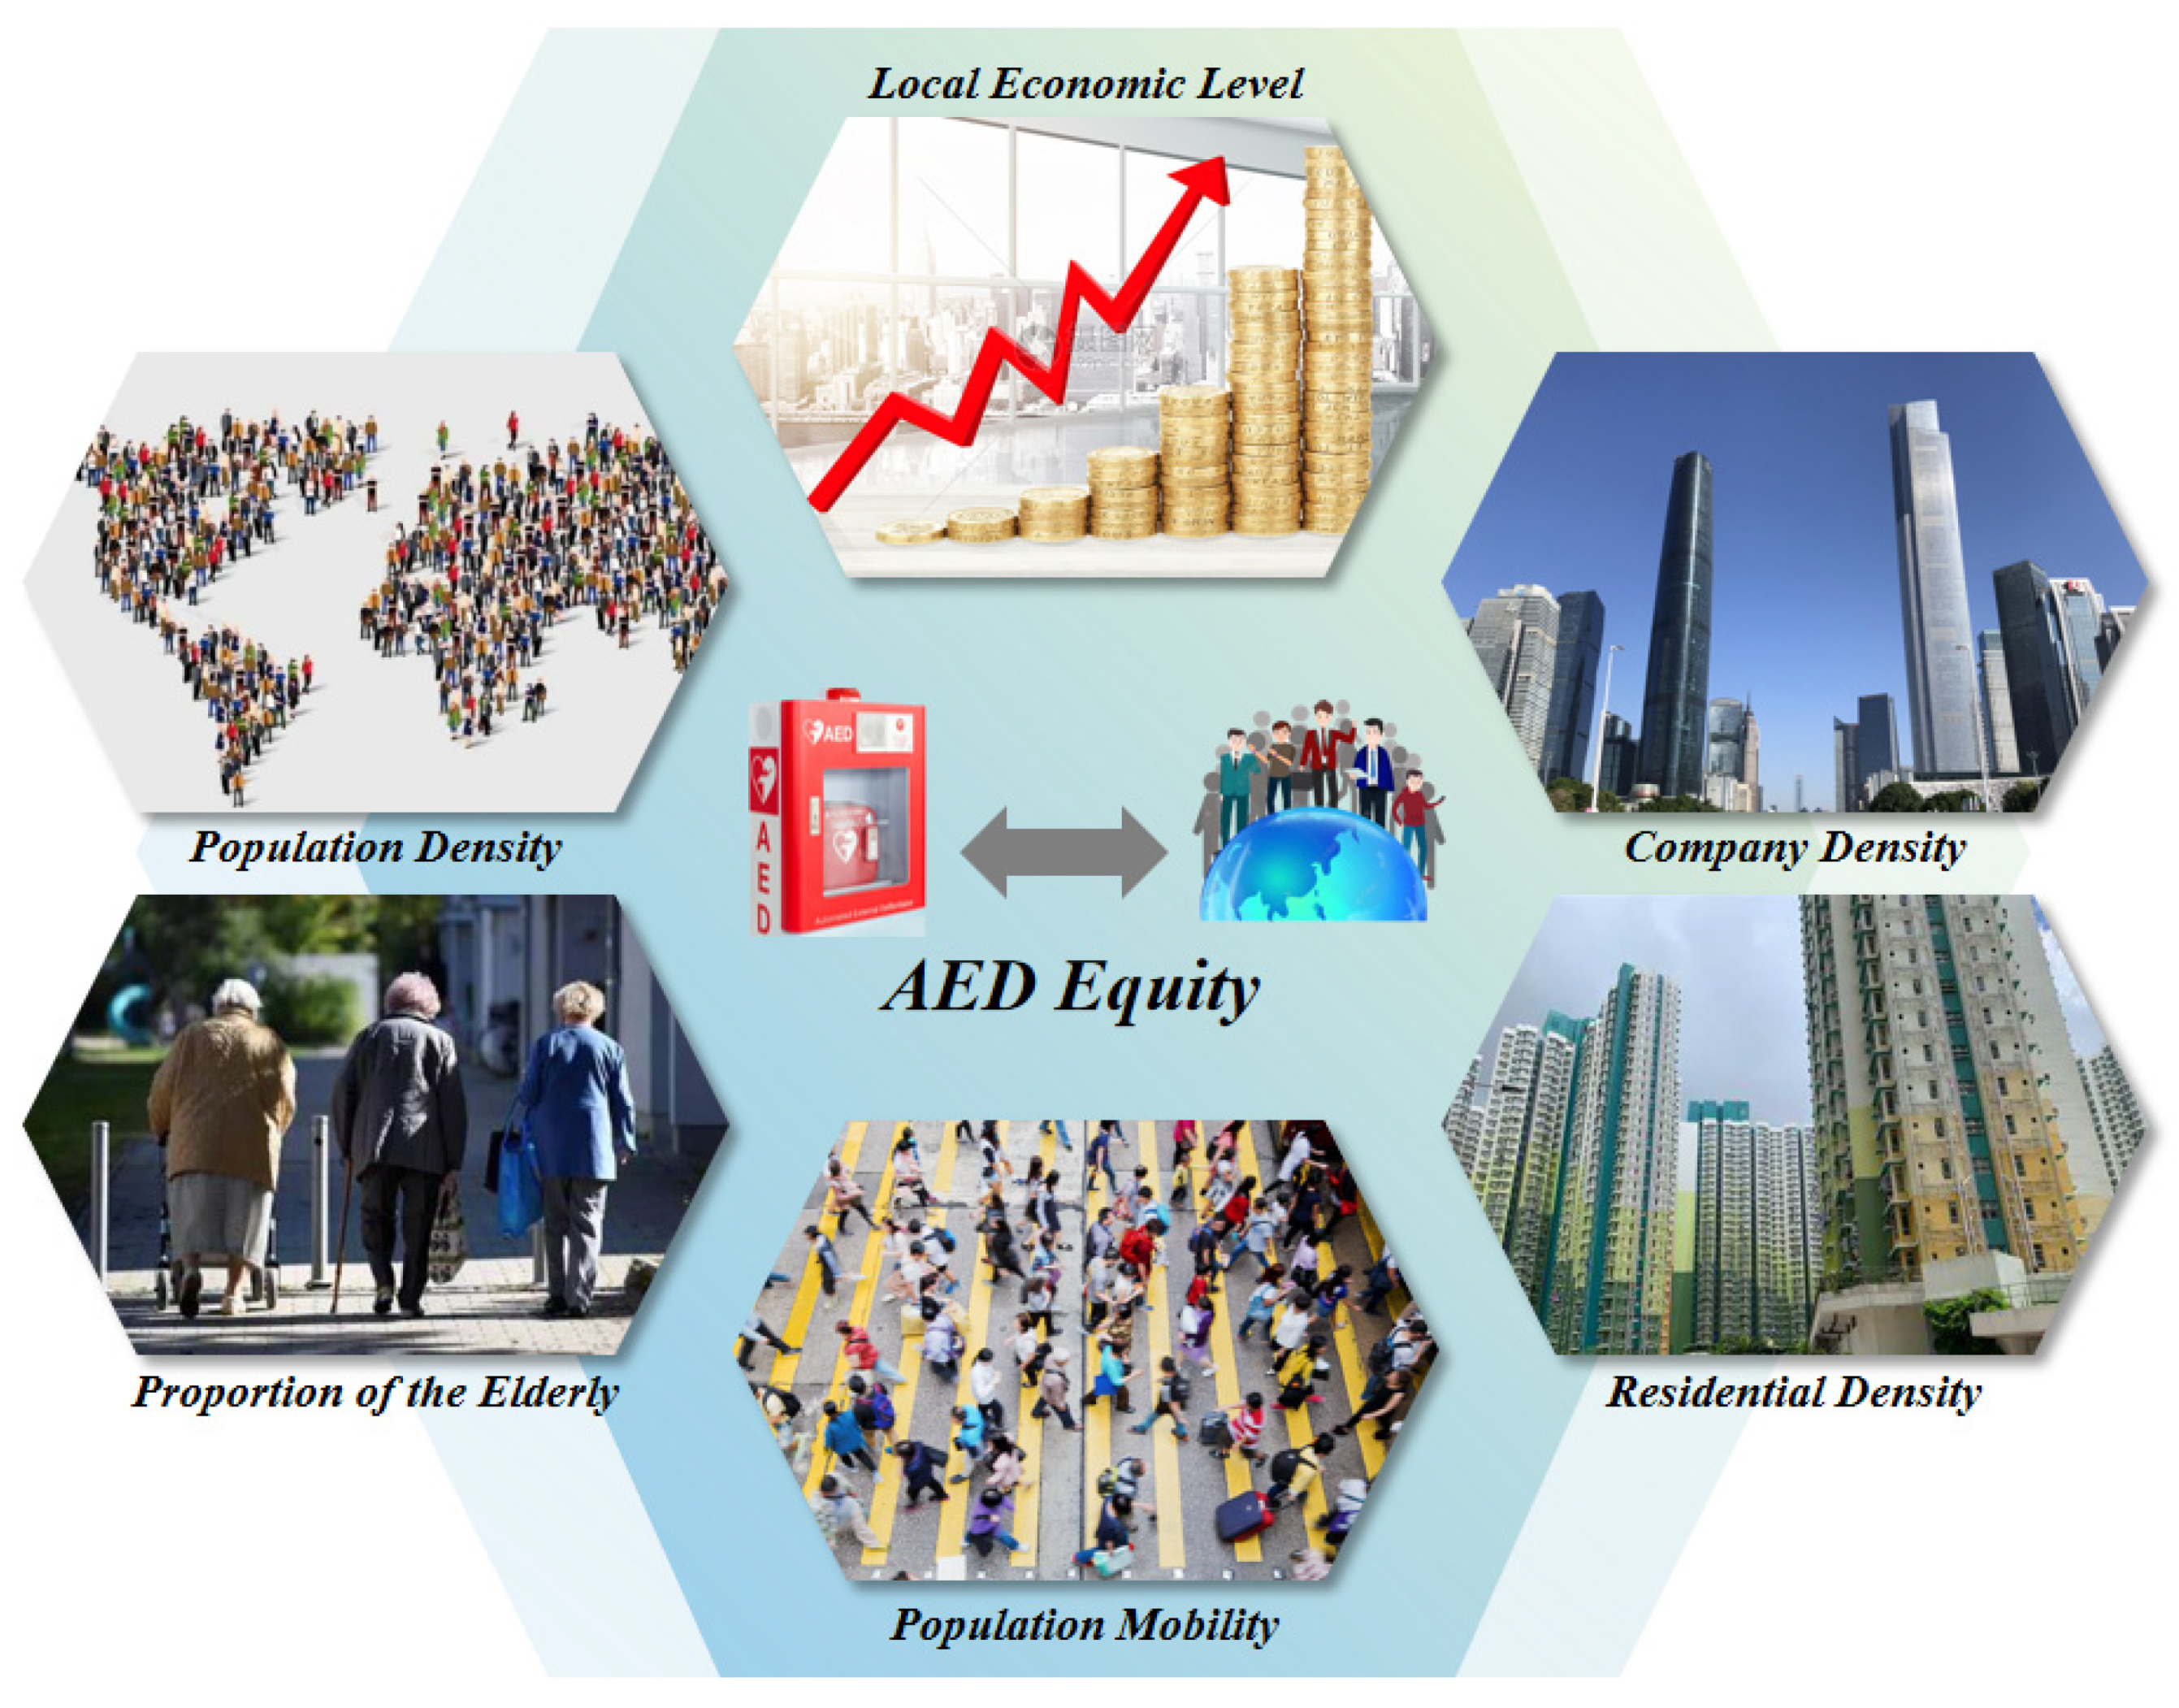
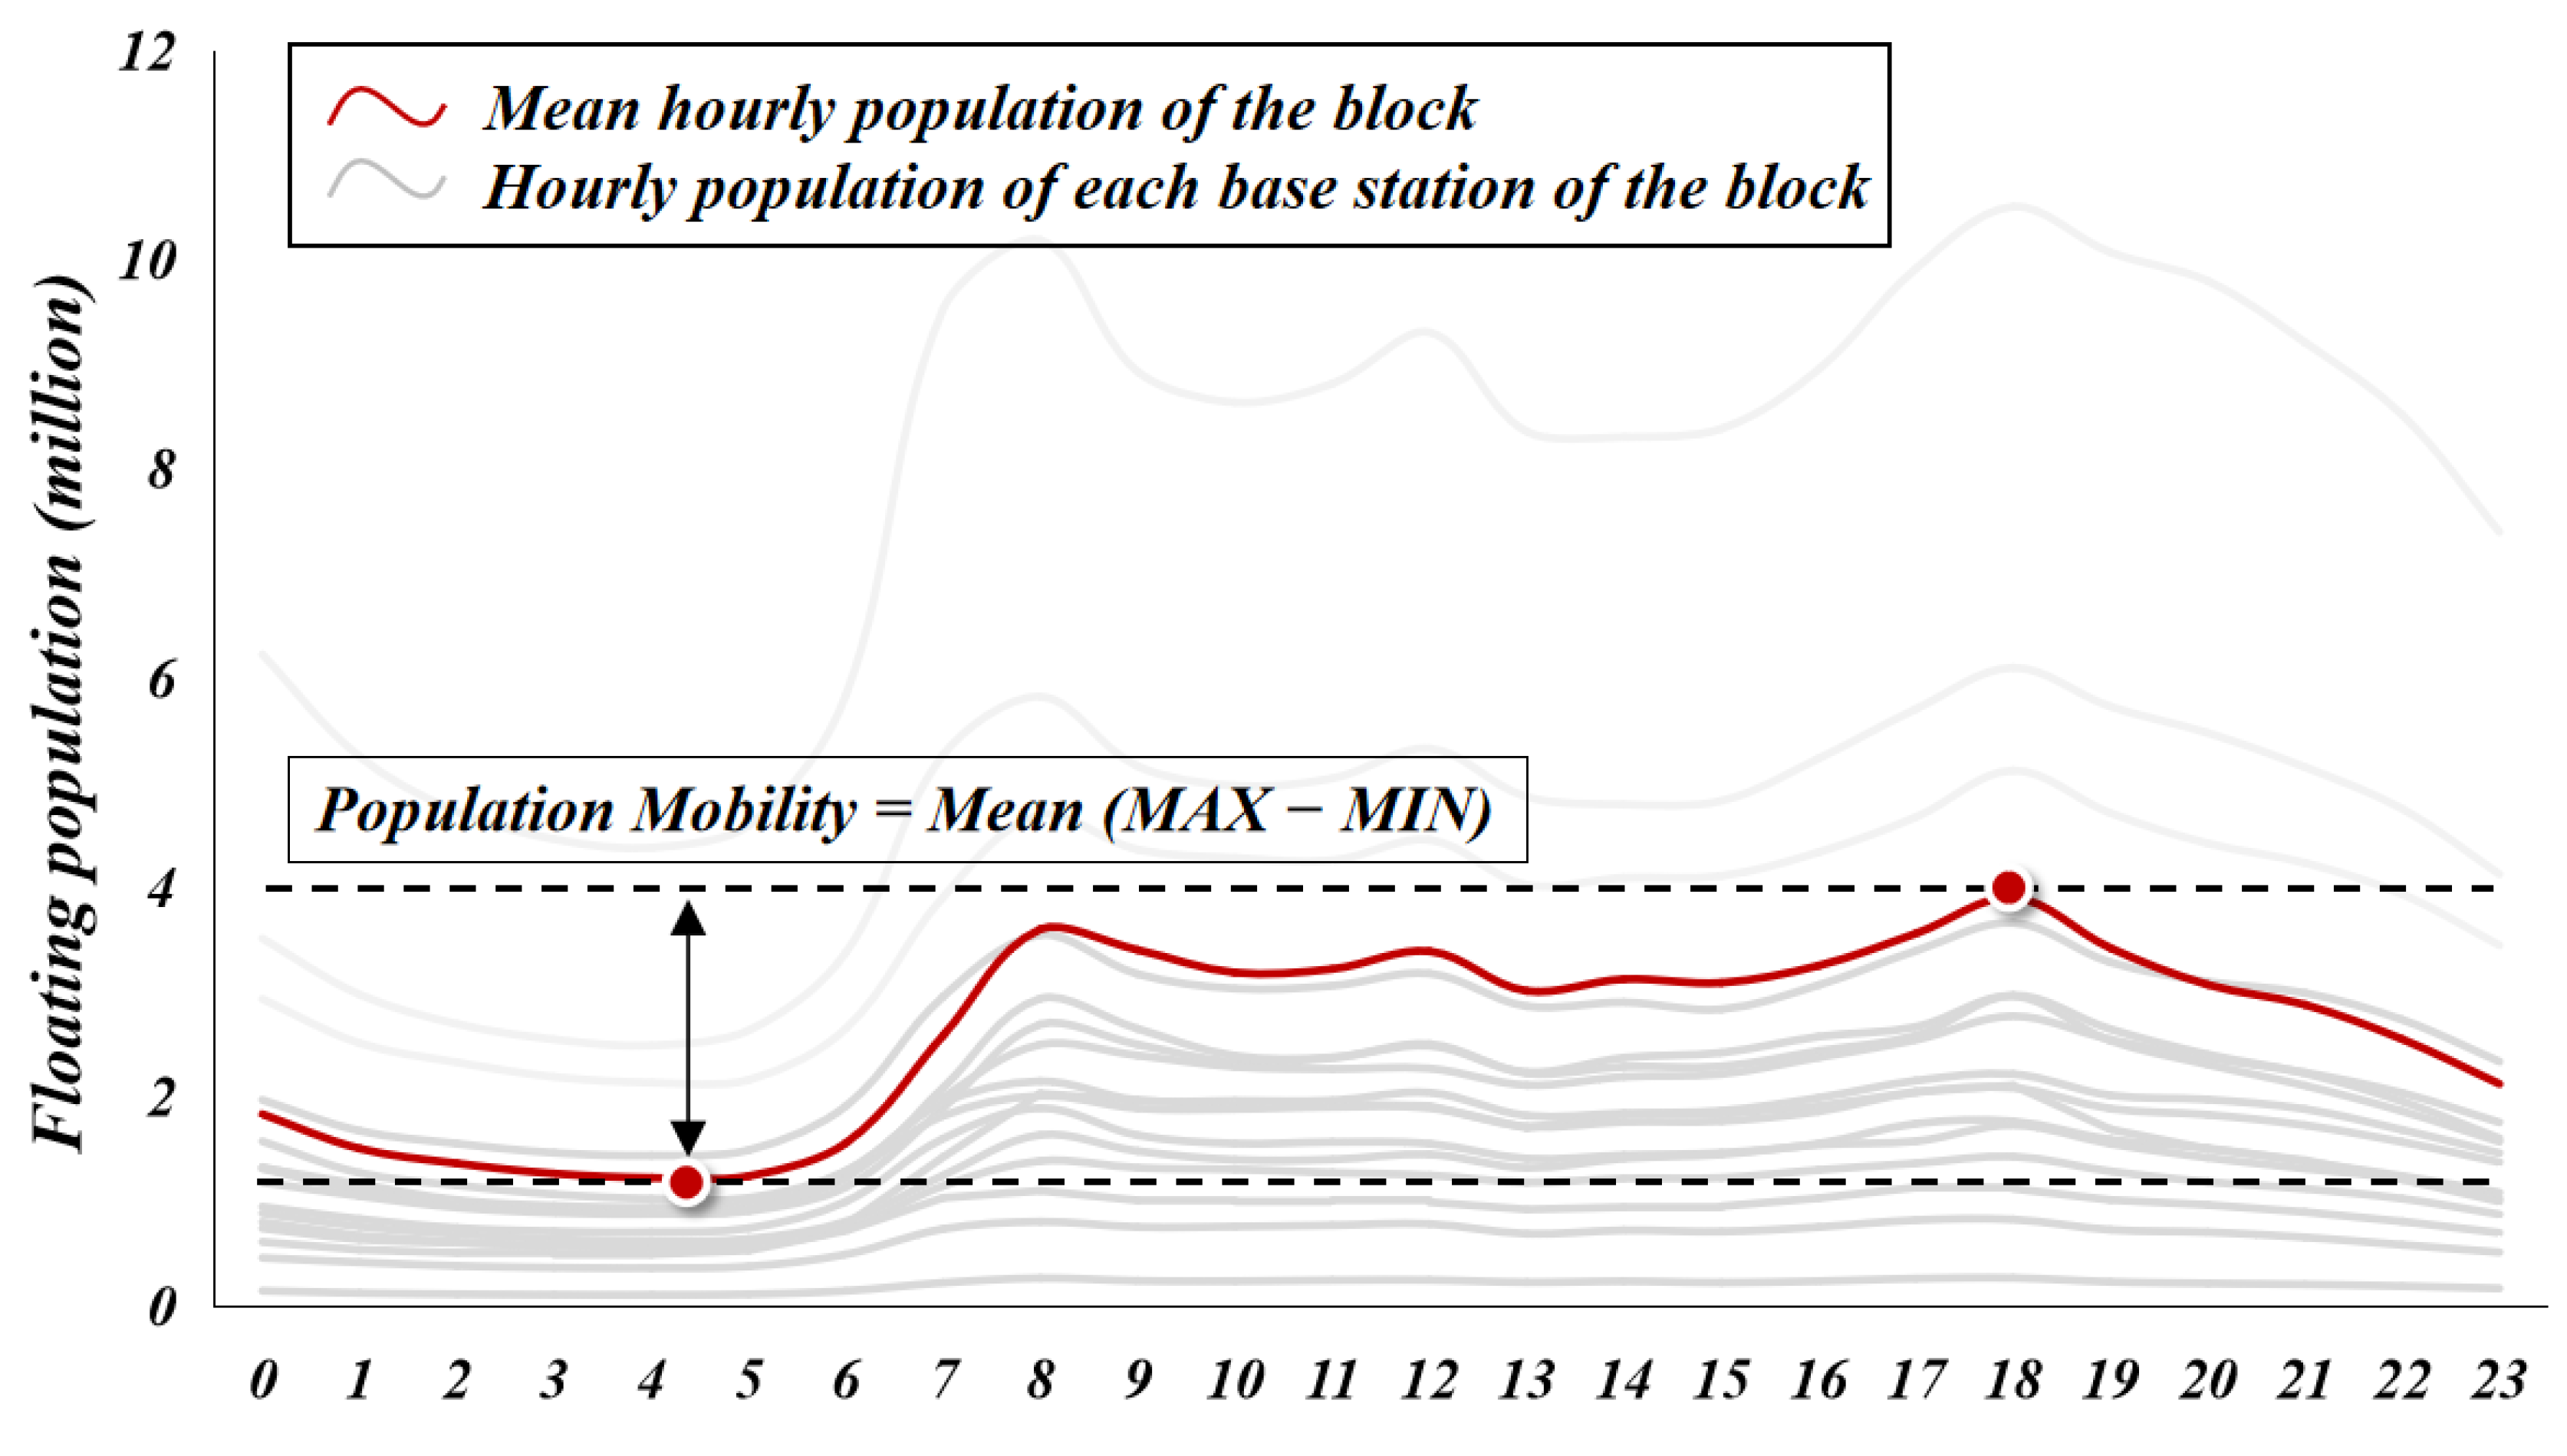
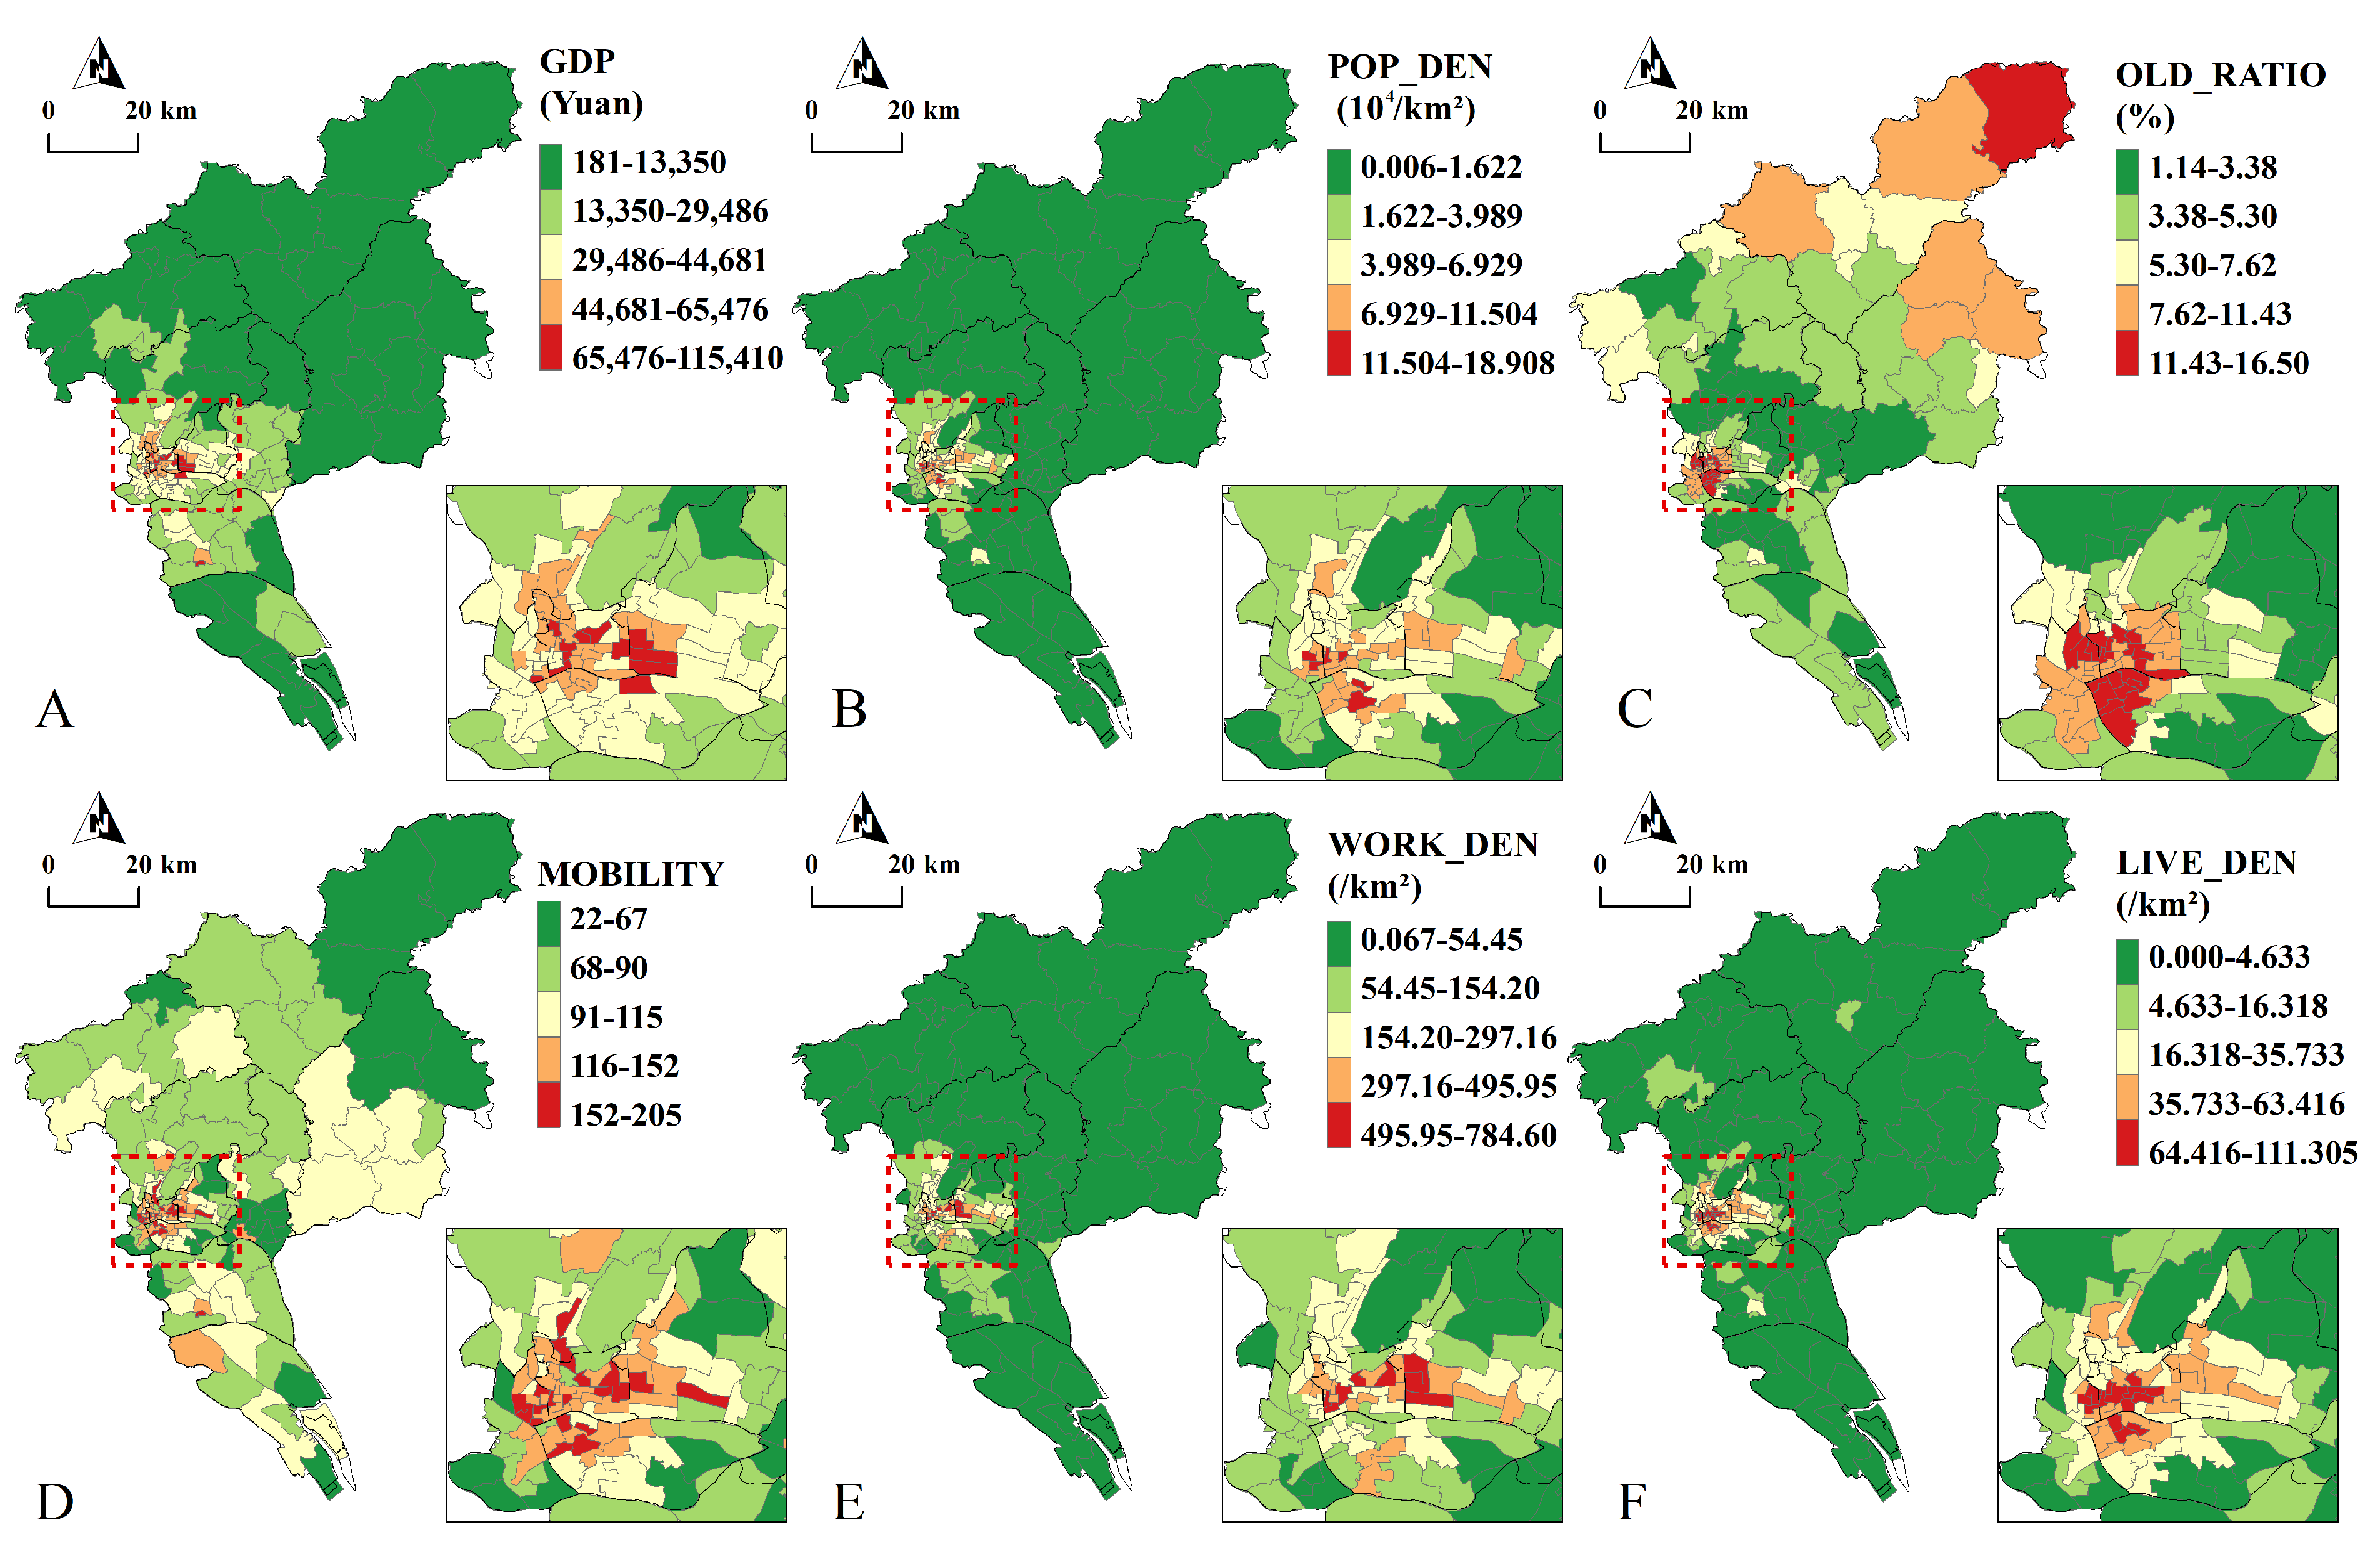
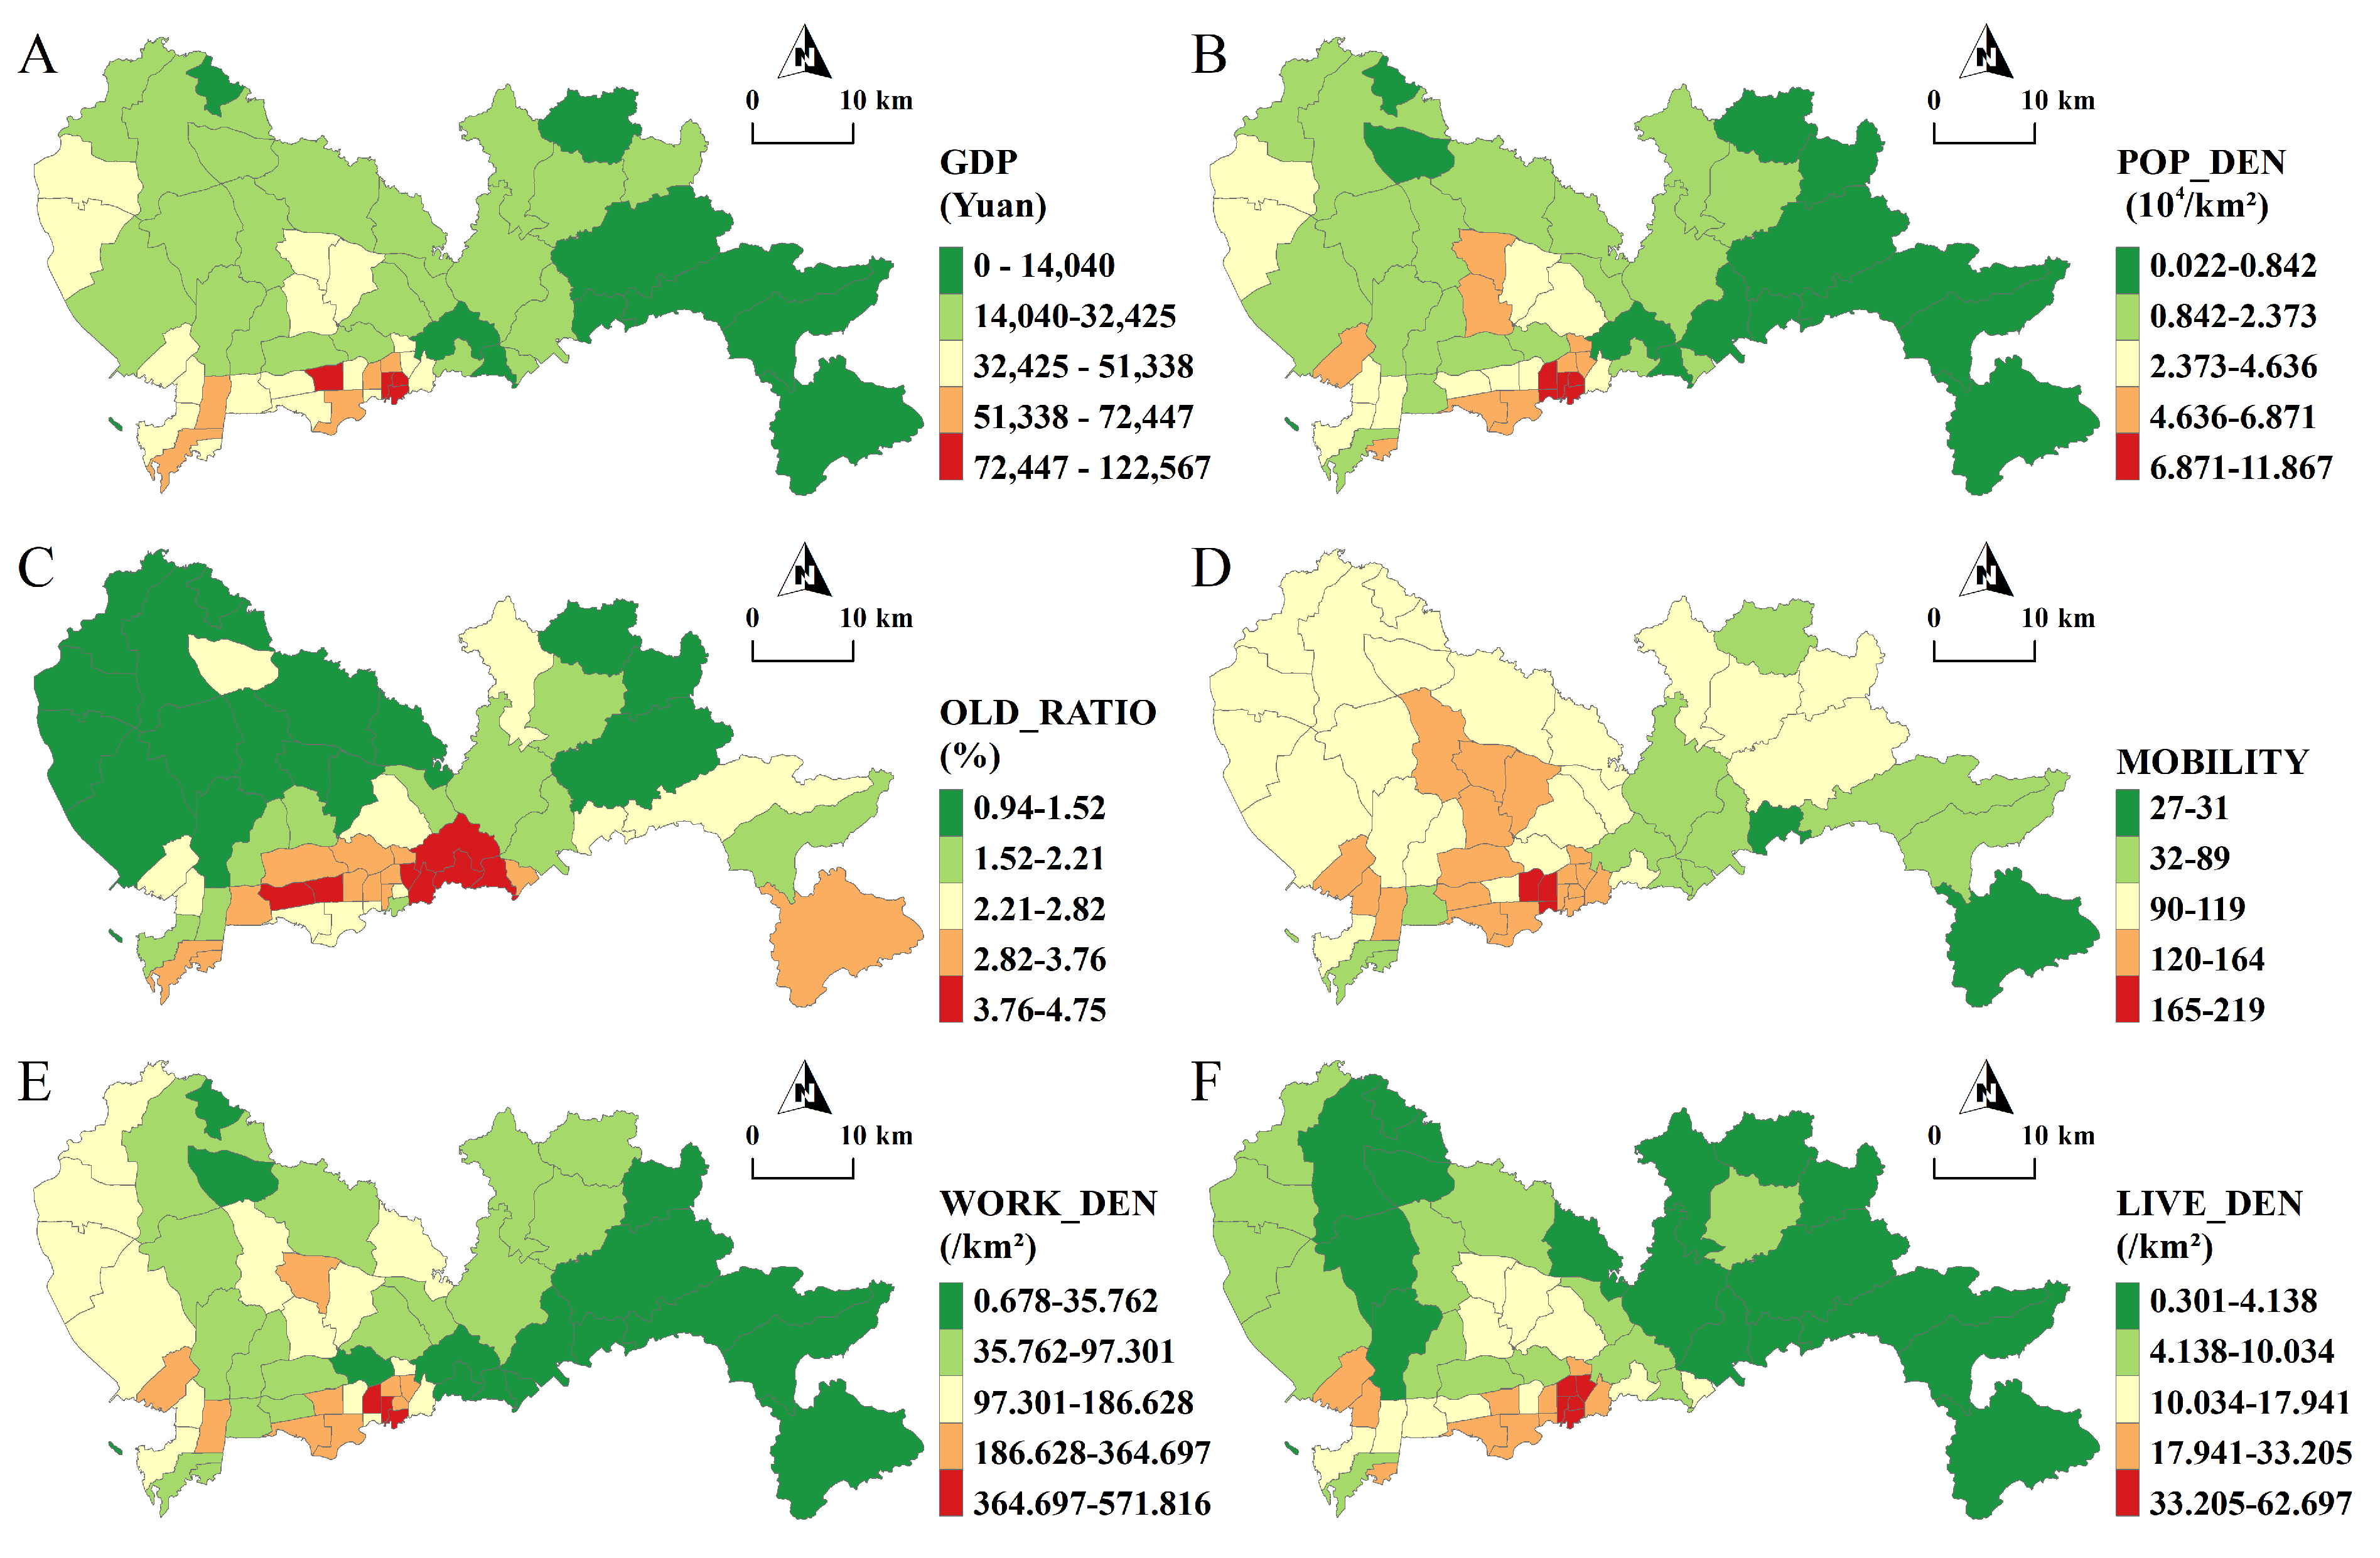
2.4. Potential Determinant Selection
3. Results and Discussion
3.1. The Number and Distribution of AEDs
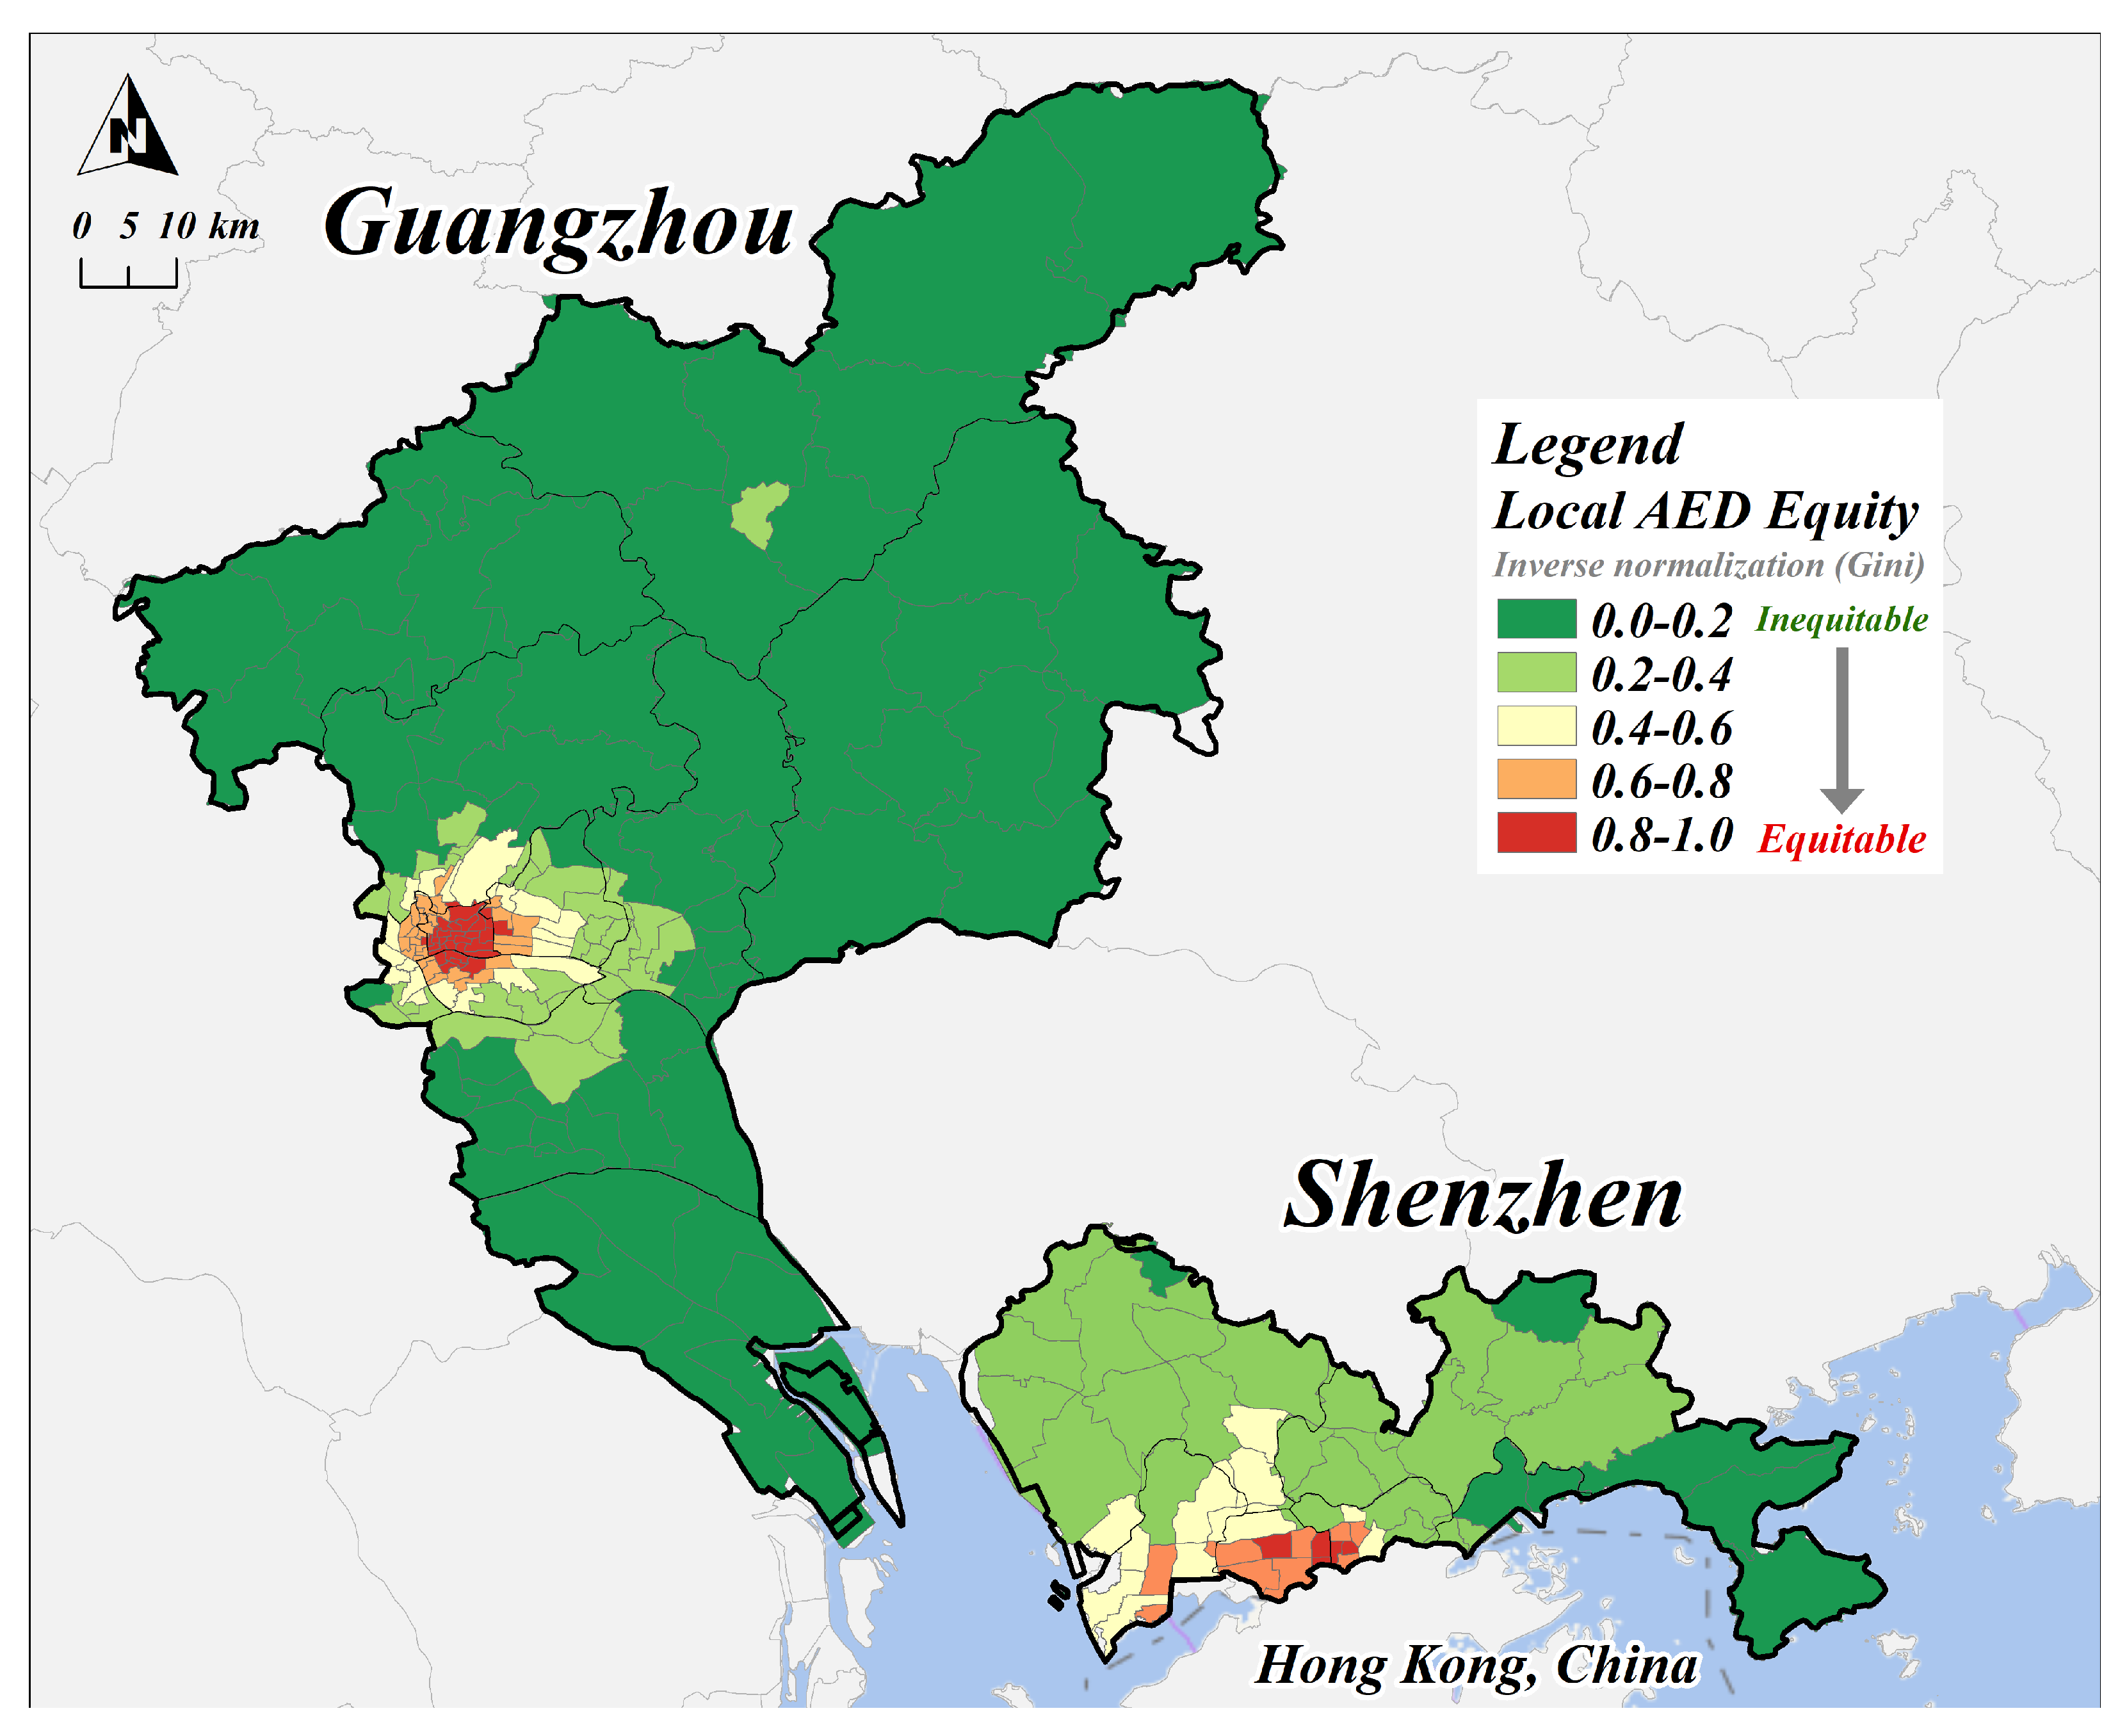
3.2. The Equity of AEDs
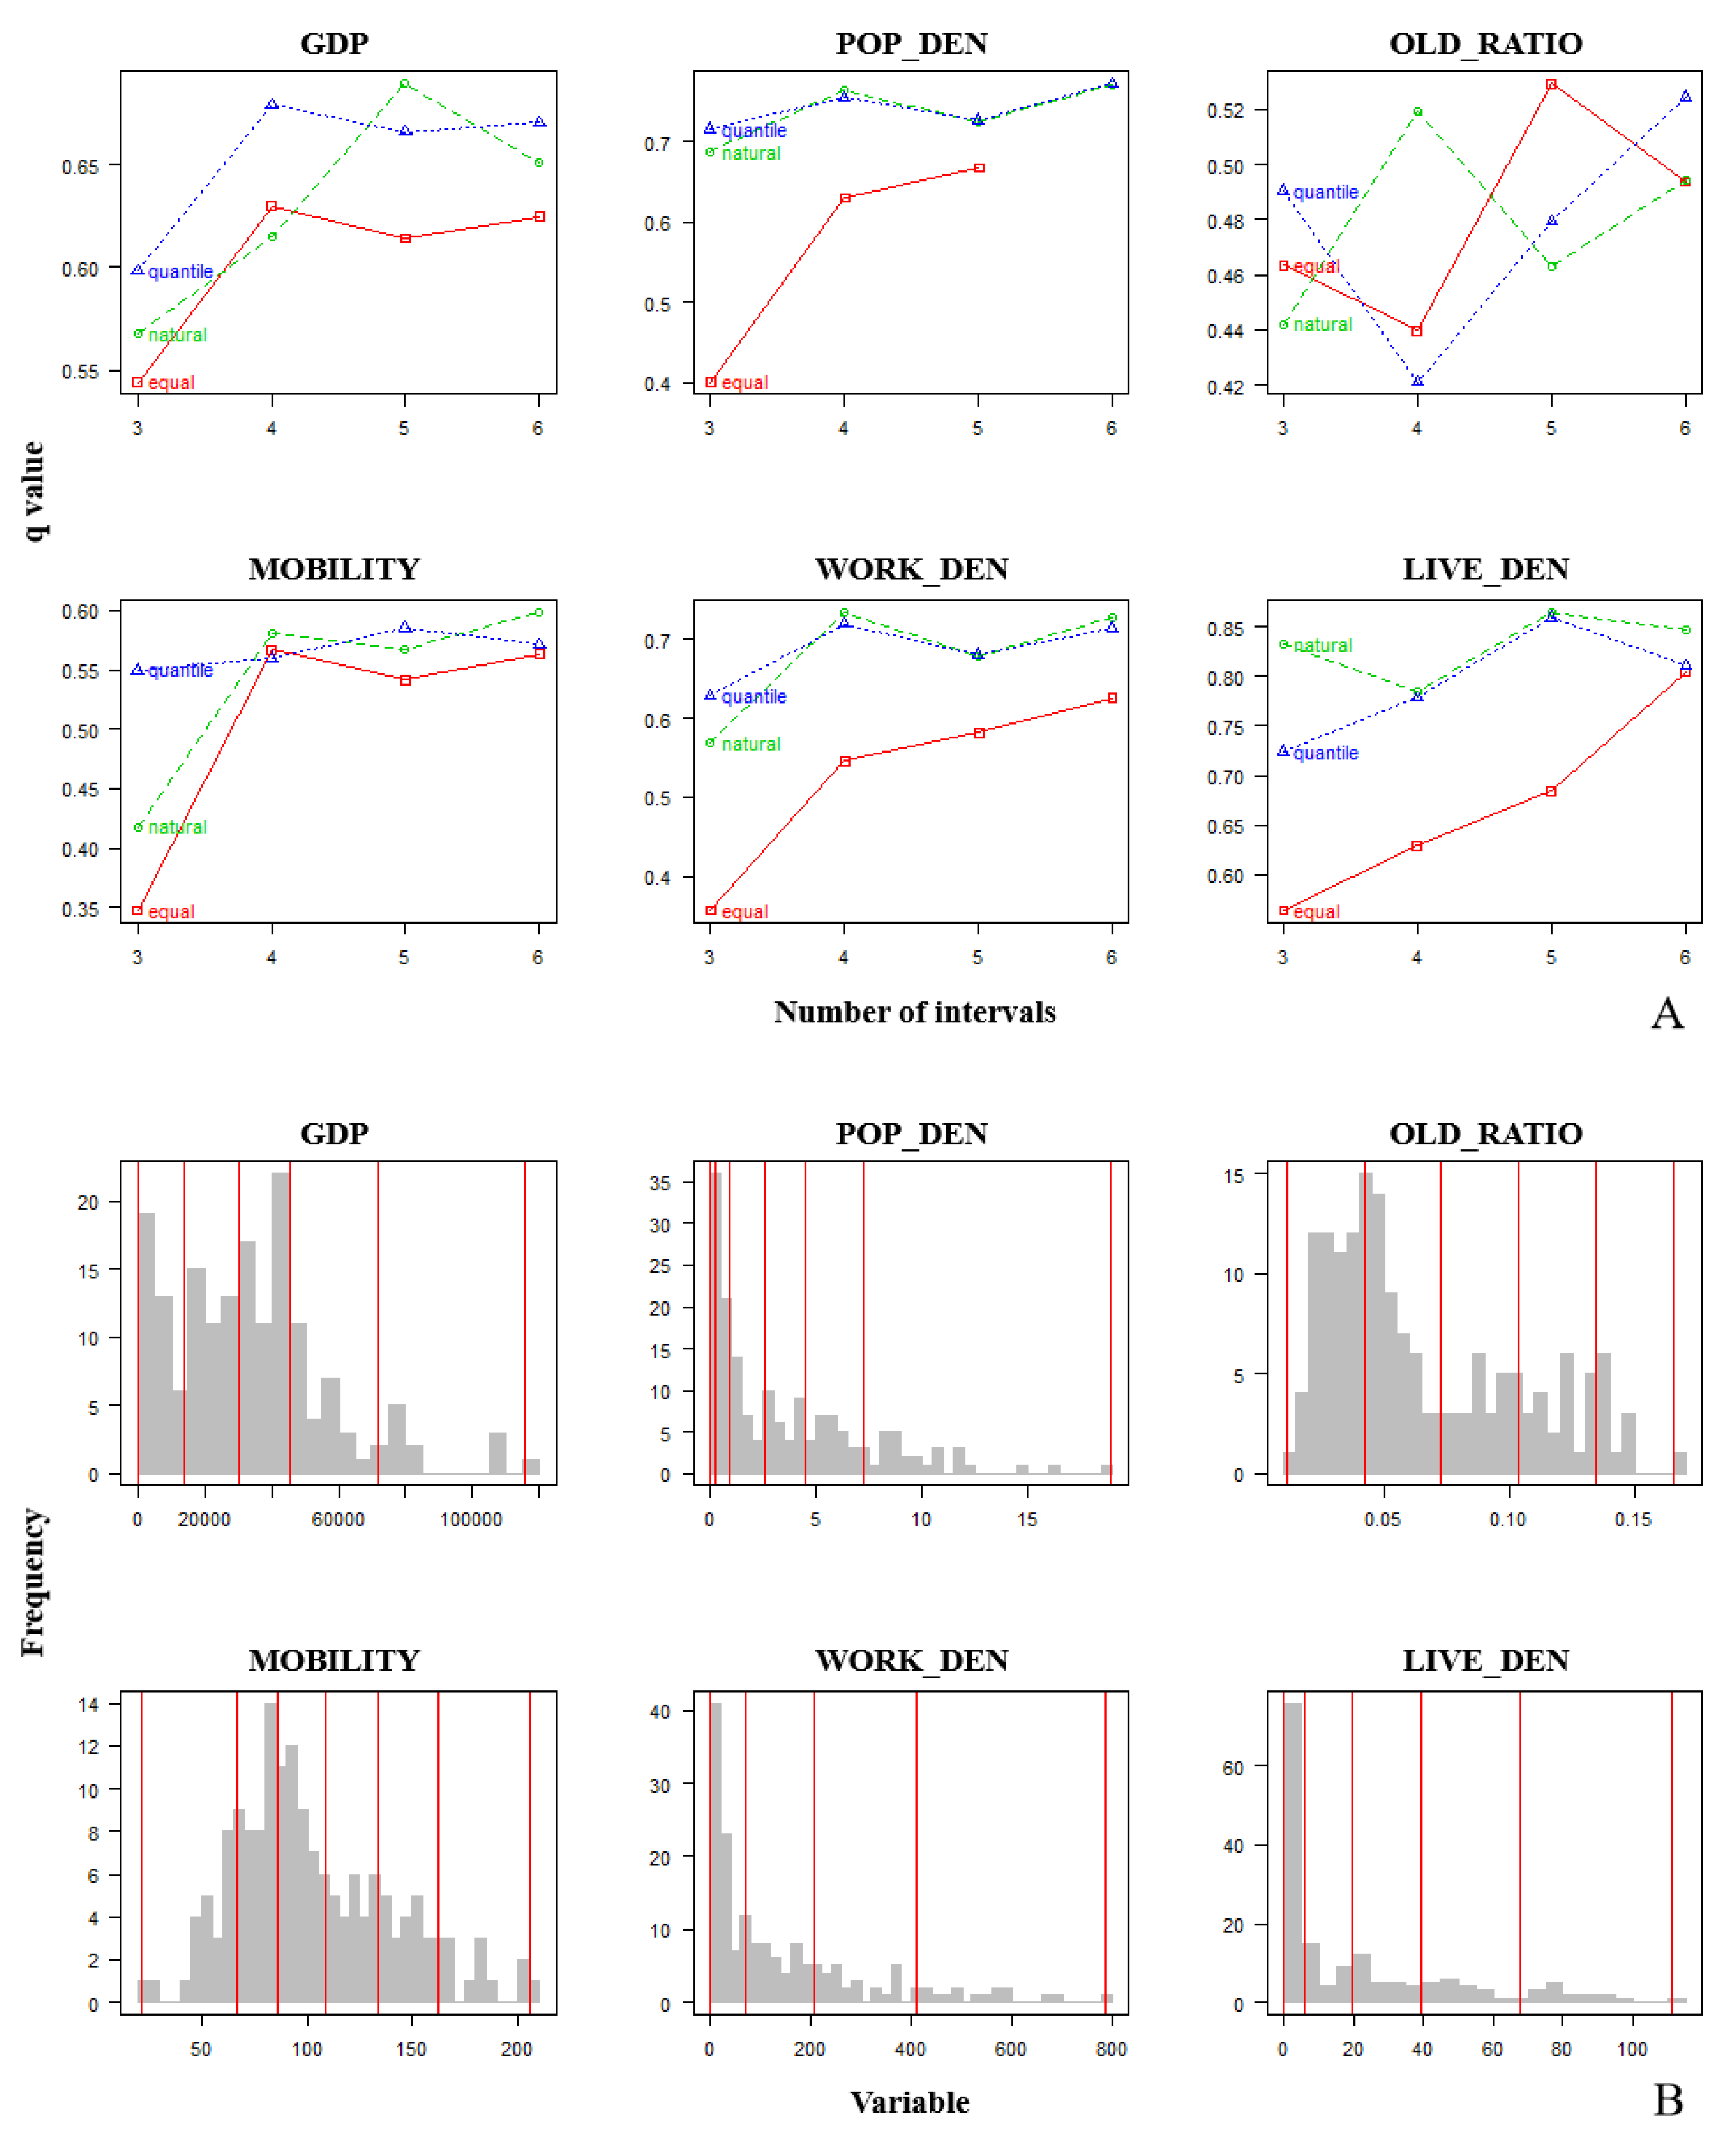
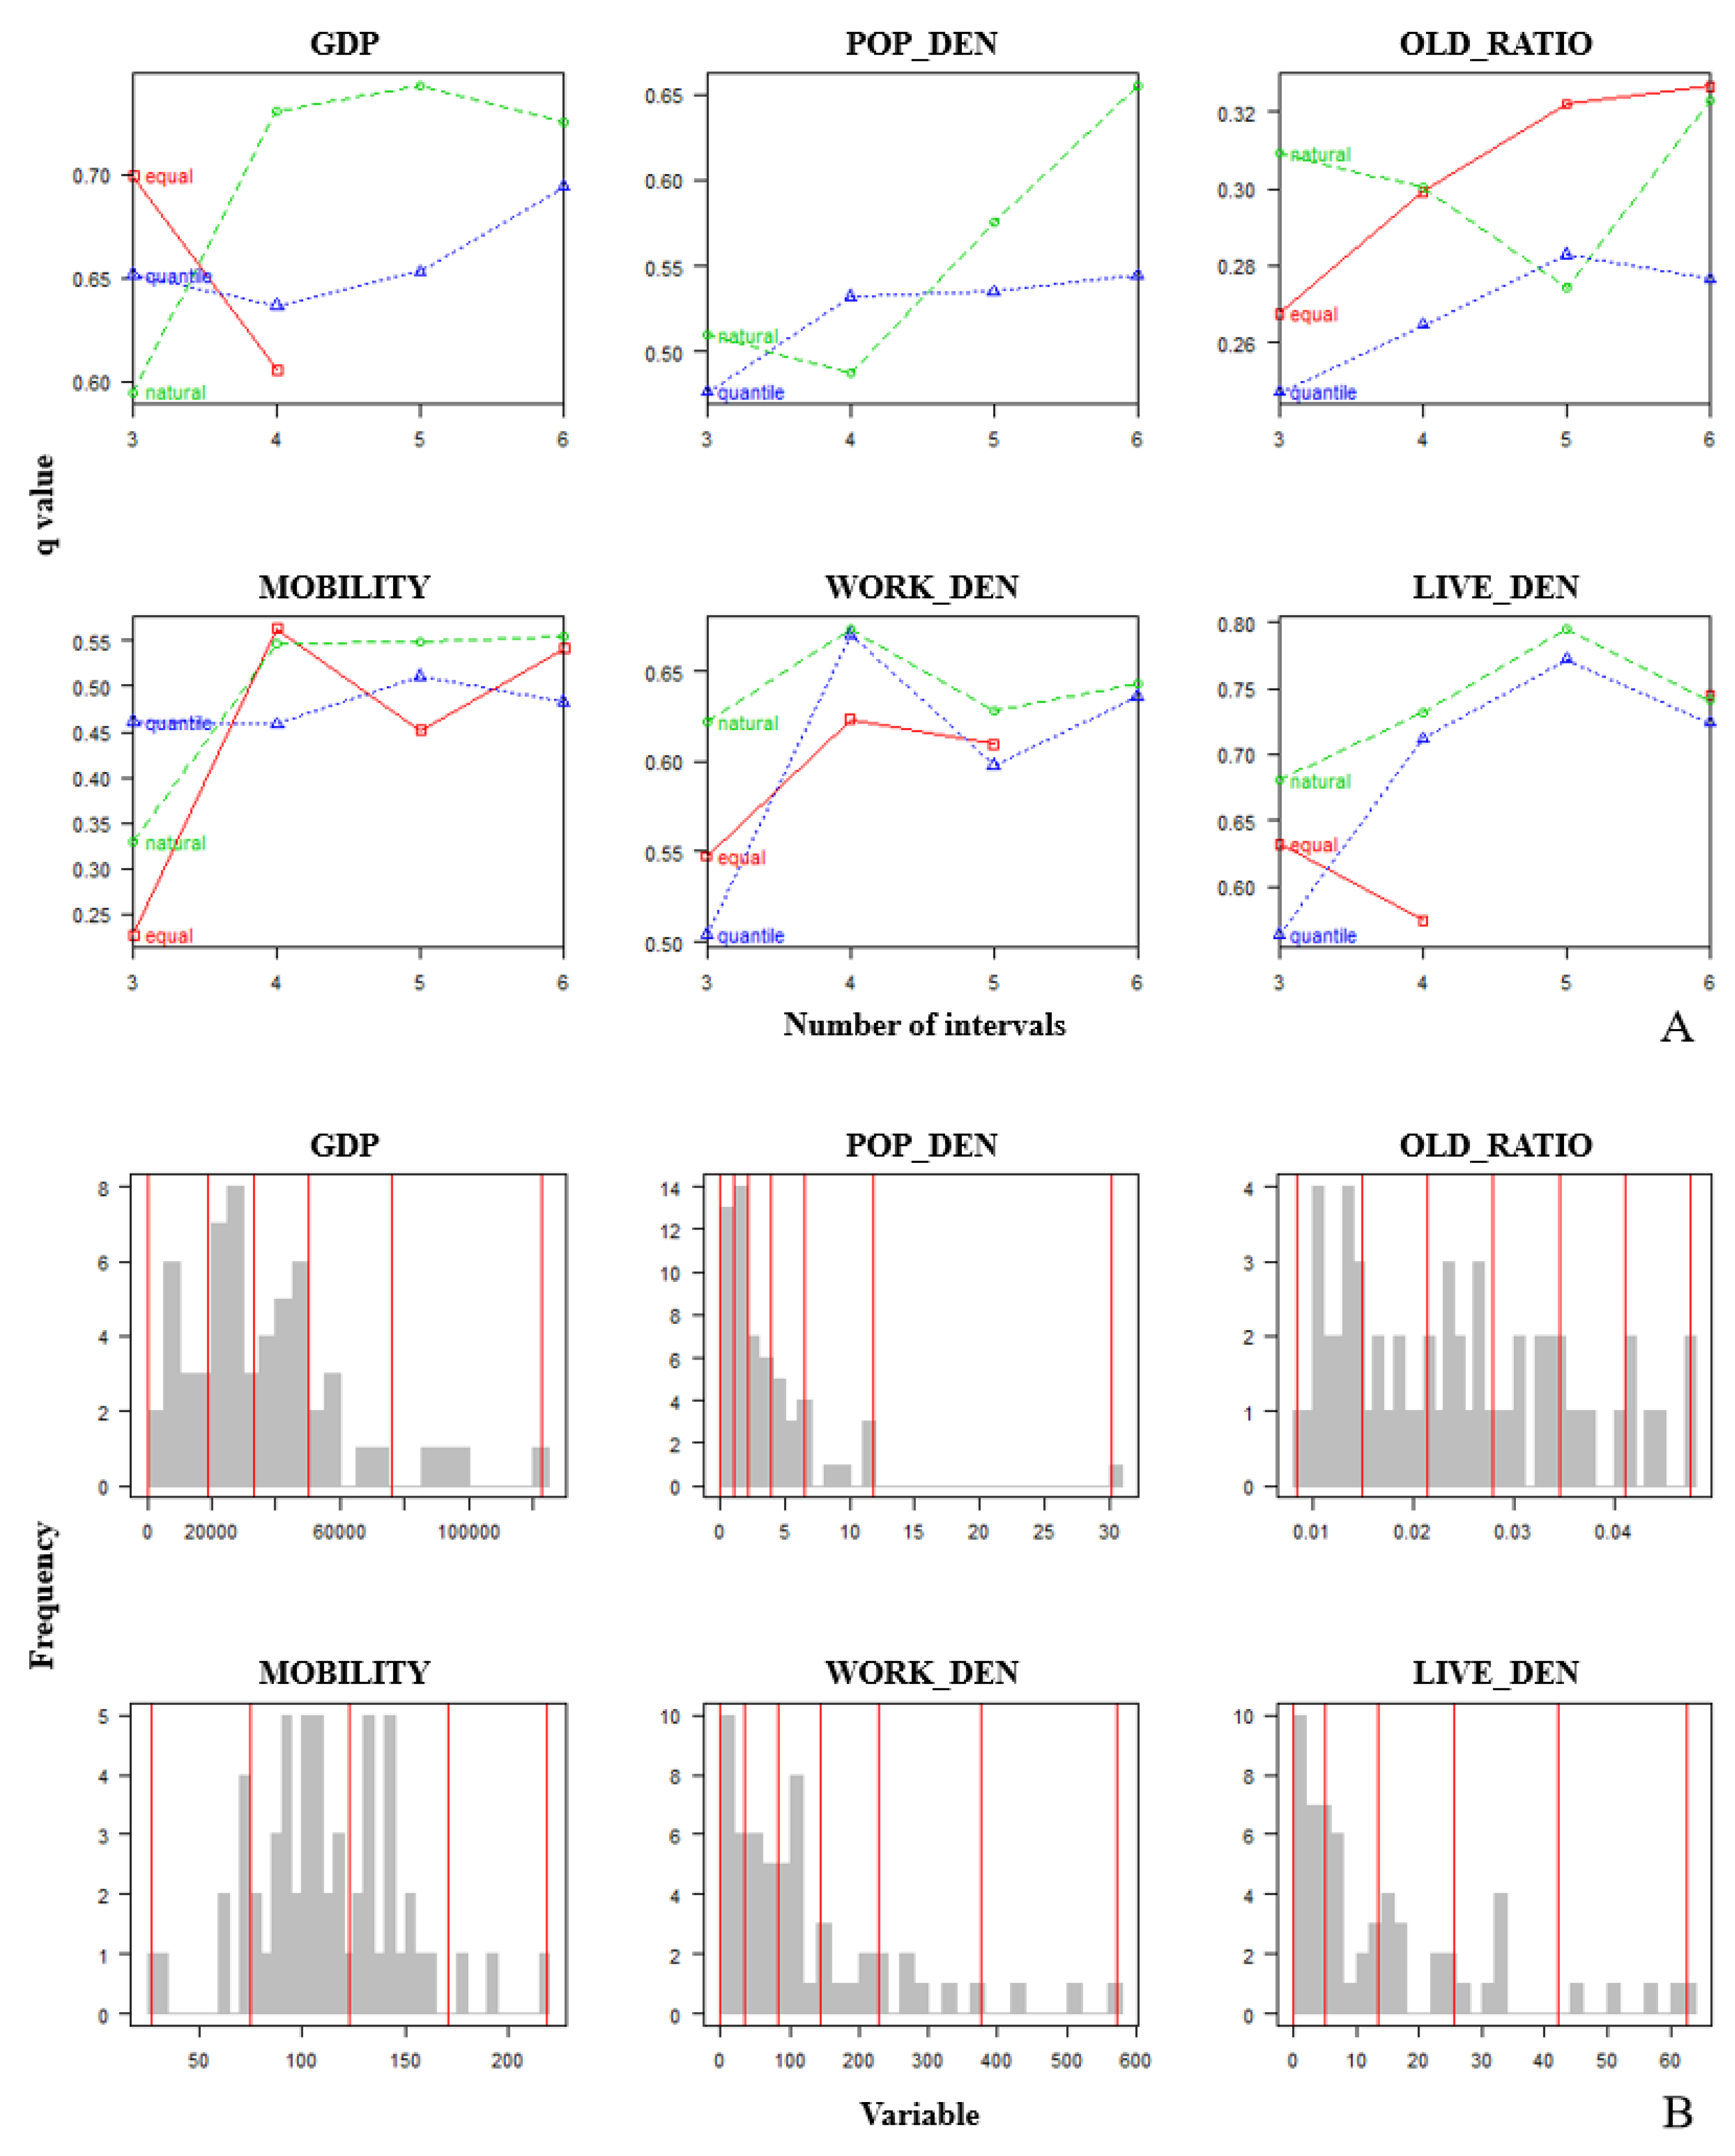
3.3. Optimal Discretization of Variables
3.4. Determinants of AED Equity Using the OPGD Model
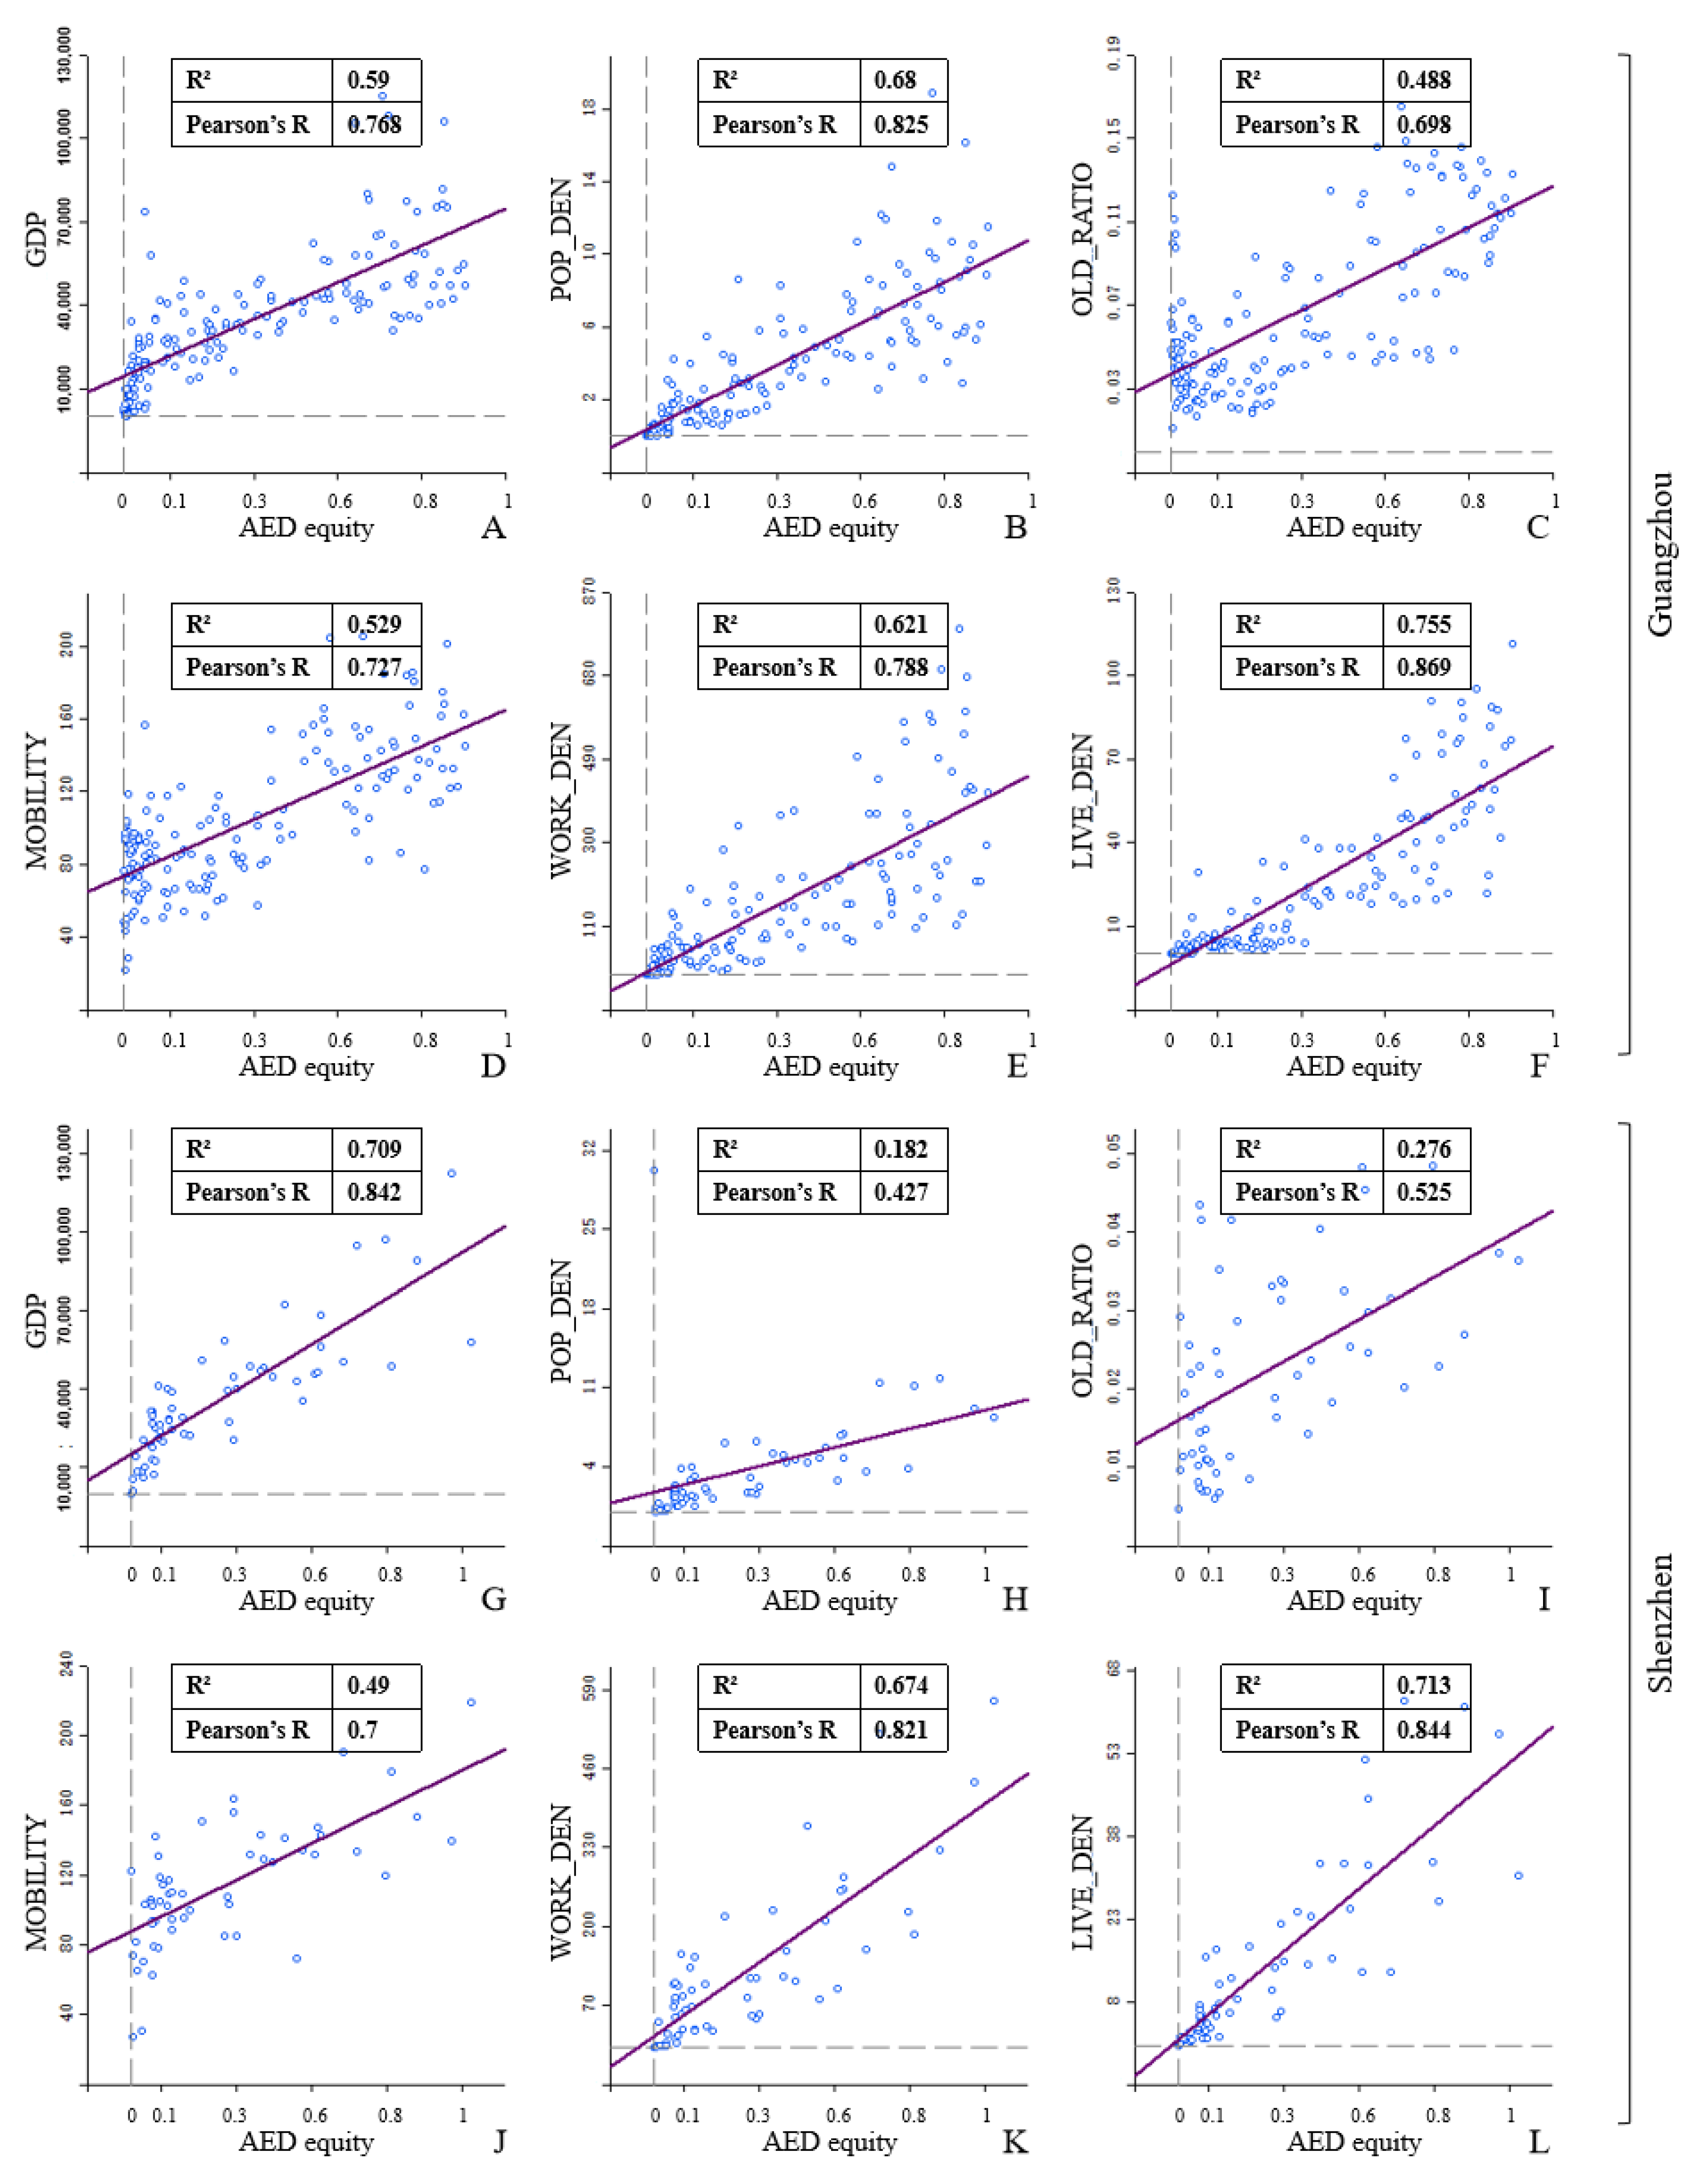
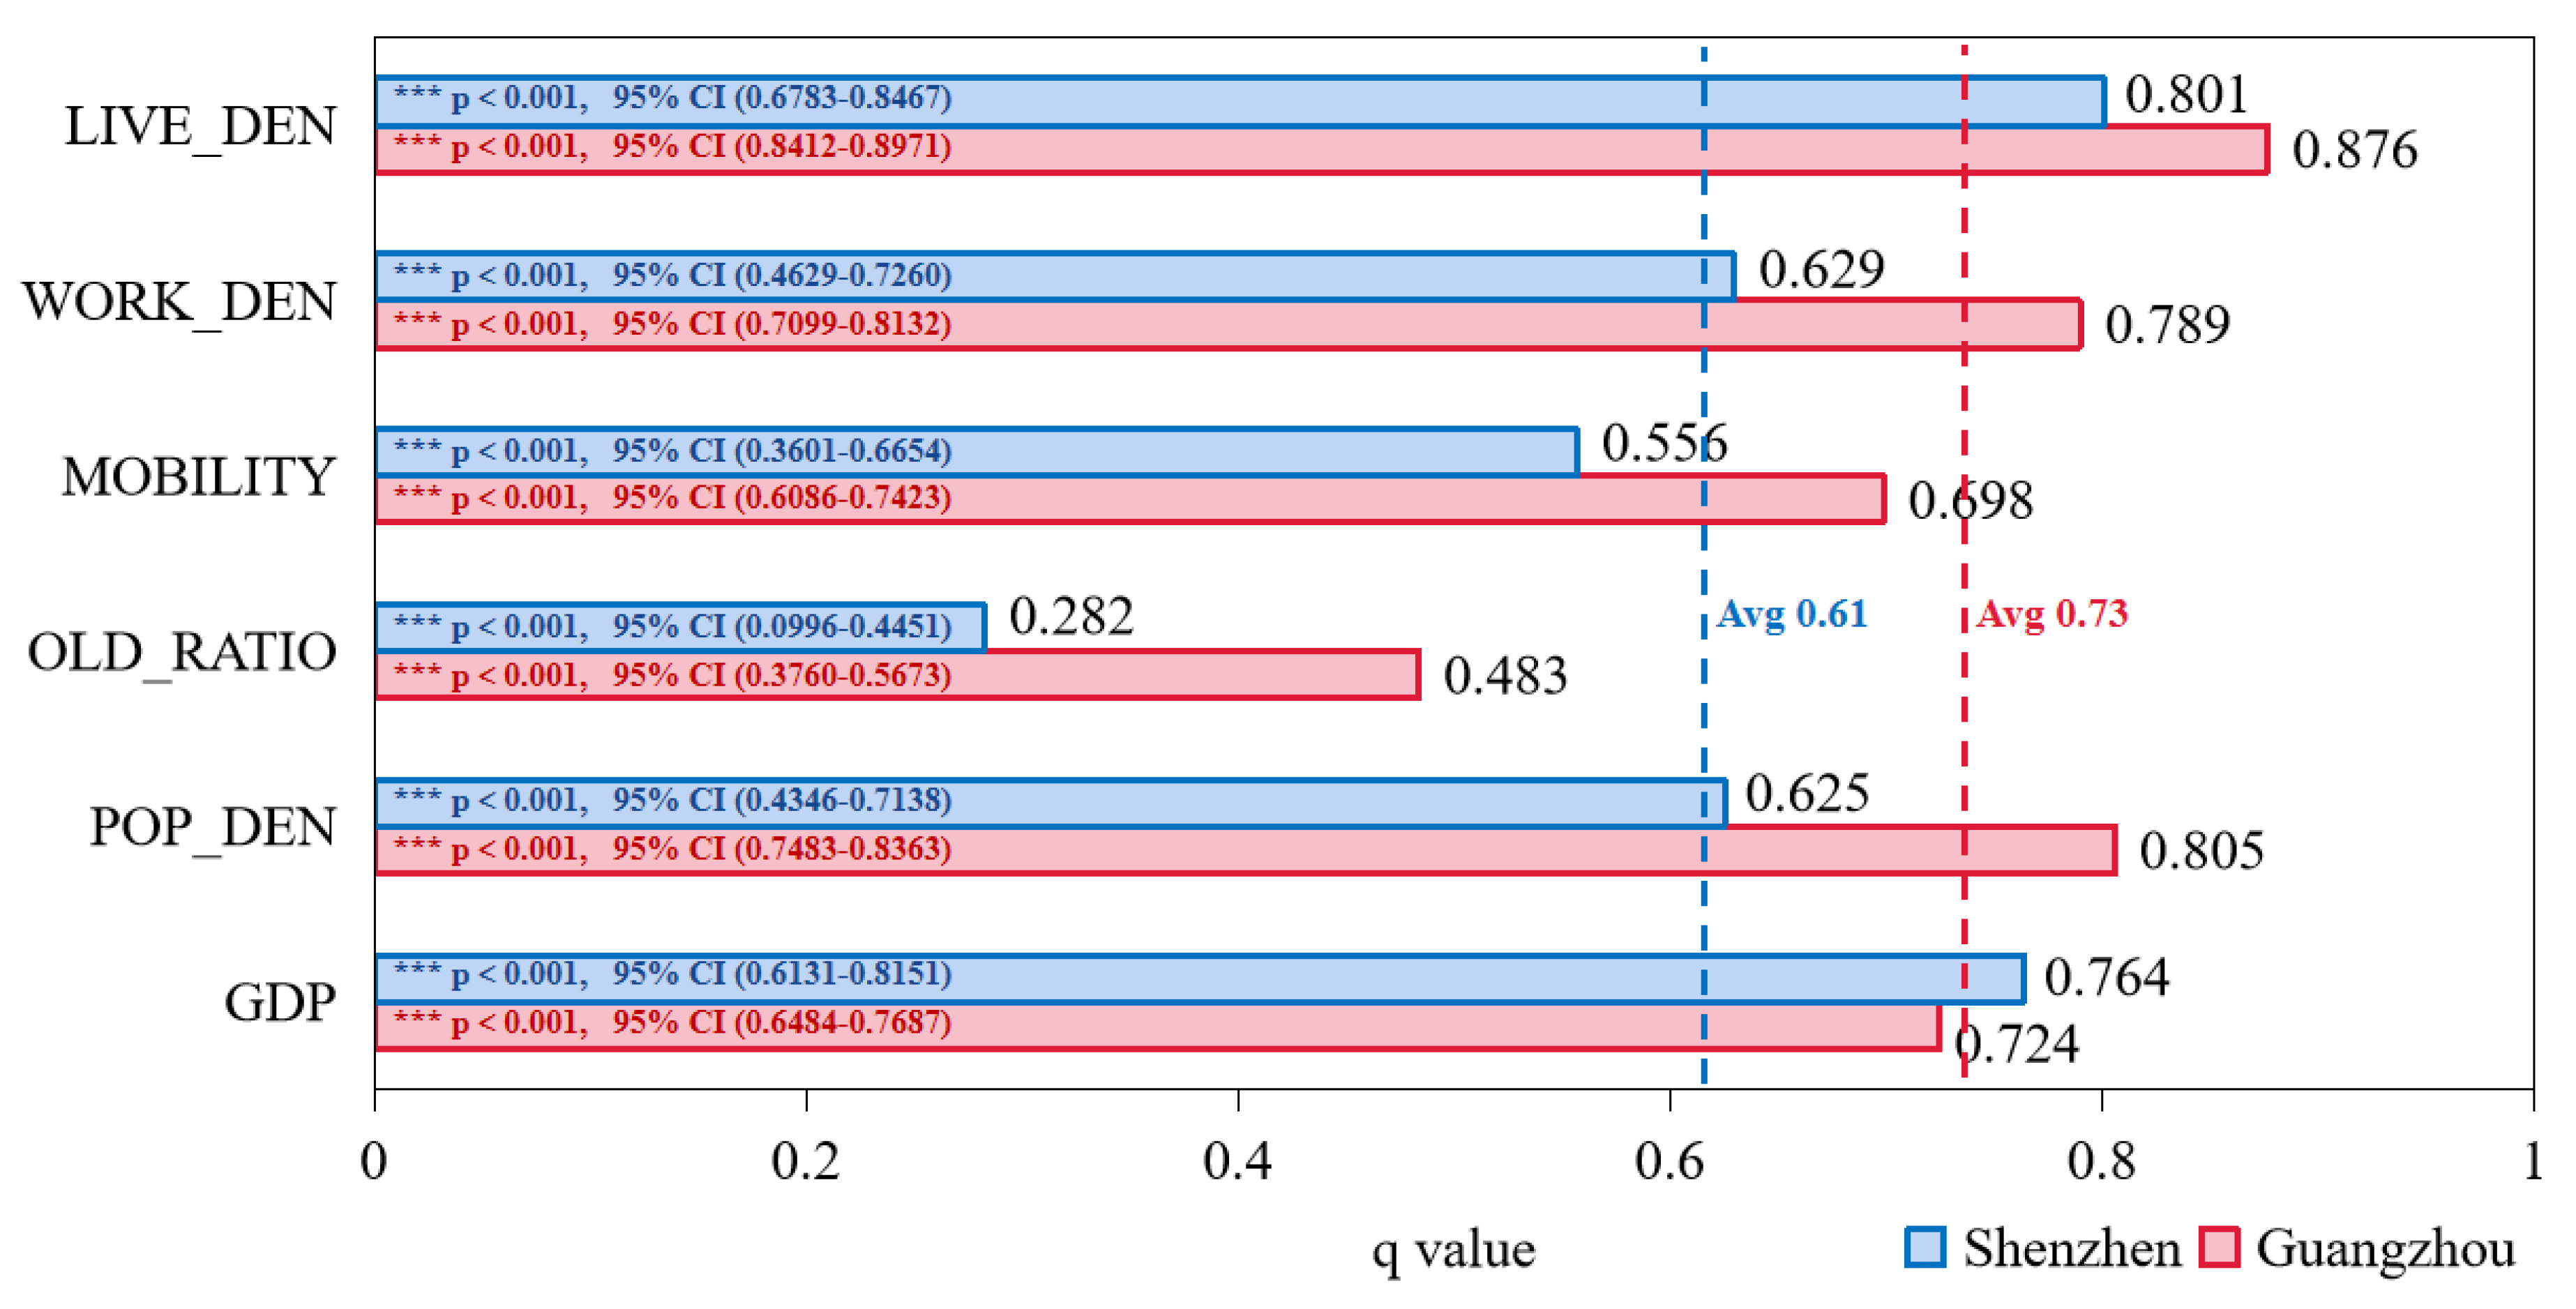
3.4.1. Individual Effect of Each Determinant on AED Equity
3.4.2. Interactive Effect of Determinant Pairs on AED Equity
3.5. Implications
4. Conclusions
Author Contributions
Funding
Data Availability Statement
Conflicts of Interest
References
- Kitamura, T.; Iwami, T.; Kawamura, T.; Nagao, K.; Tanaka, H.; Hiraide, A. Nationwide Public-Access Defibrillation in Japan. N. Engl. J. Med. 2010, 362, 994–1004. [Google Scholar] [CrossRef] [PubMed]
- Feero, S.; Hedges, J.R.; Stevens, P. Demographics of Cardiac Arrest: Association with Residence in a Low-Income Area. Acad. Emerg. Med. 1995, 2, 11–16. [Google Scholar] [CrossRef] [PubMed]
- Su, Y.-J.; Lai, Y.-C.; Chen, C.-C.; Chang, W.-H. Out-of-Hospital Cardiac Arrest in The Elderly. Int. J. Gerontol. 2008, 2, 67–71. [Google Scholar] [CrossRef]
- Folke, F.; Lippert, F.K.; Nielsen, S.L.; Gislason, G.H.; Hansen, M.L.; Schramm, T.K.; Sørensen, R.; Fosbøl, E.L.; Andersen, S.S.; Rasmussen, S.; et al. Location of Cardiac Arrest in a City Center: Strategic Placement of Automated External Defibrillators in Public Locations. Circulation 2009, 120, 510–517. [Google Scholar] [CrossRef]
- Brooks, S.C.; Hsu, J.H.; Tang, S.K.; Jeyakumar, R.; Chan, T.C.Y. Determining Risk for Out-of-Hospital Cardiac Arrest by Location Type in a Canadian Urban Setting to Guide Future Public Access Defibrillator Placement. Ann. Emerg. Med. 2013, 61, 530–538.e2. [Google Scholar] [CrossRef]
- Deakin, C.D.; Shewry, E.; Gray, H.H. Public Access Defibrillation Remains out of Reach for Most Victims of Out-of-Hospital Sudden Cardiac Arrest. Heart 2014, 100, 619–623. [Google Scholar] [CrossRef]
- Boutilier, J.J.; Brooks, S.C.; Janmohamed, A.; Byers, A.; Buick, J.E.; Zhan, C.; Schoellig, A.P.; Cheskes, S.; Morrison, L.J.; Chan, T.C.Y. Optimizing a Drone Network to Deliver Automated External Defibrillators. Circulation 2017, 135, 2454–2465. [Google Scholar] [CrossRef] [PubMed]
- Aeby, D.; Staeger, P.; Dami, F. How to Improve Automated External Defibrillator Placement for Out-of-Hospital Cardiac Arrests: A Case Study. PLoS ONE 2021, 16, e0250591. [Google Scholar] [CrossRef]
- Lin, B.-C.; Chen, C.-W.; Chen, C.-C.; Kuo, C.-L.; Fan, I.; Ho, C.-K.; Liu, I.-C.; Chan, T.-C. Spatial Decision on Allocating Automated External Defibrillators (AED) in Communities by Multi-Criterion Two-Step Floating Catchment Area (MC2SFCA). Int. J. Health Geogr. 2016, 15, 17. [Google Scholar] [CrossRef]
- Chen, G.; Widener, M.J.; Zhu, M.; Wang, C.C. Identification of Priority Areas for Public-Access Automated External Defibrillators (AEDs) in Metropolitan Areas: A Case Study in Hangzhou, China. Appl. Geogr. 2023, 154, 102922. [Google Scholar] [CrossRef]
- China Association for the Promotion of International Exchange of Medical Care Chest Pain Branch. Report on Cardiac Arrest and Cardiopulmonary Resuscitation in China (2022 Edition). Biomed. Environ. Sci. 2023, 36, 669–701. [Google Scholar]
- Hu, S. Report on Cardiovascular Health and Diseases in China 2019: An Updated Summary. Chin. Circ. J. 2020, 35, 3969. [Google Scholar]
- Bonnet, B.; Gama Dessavre, D.; Kraus, K.; Ramirez-Marquez, J.E. Optimal Placement of Public-Access AEDs in Urban Environments. Comput. Ind. Eng. 2015, 90, 269–280. [Google Scholar] [CrossRef]
- Tsai, Y.-S.; Ko, P.C.-I.; Huang, C.-Y.; Wen, T.-H. Optimizing Locations for the Installation of Automated External Defibrillators (AEDs) in Urban Public Streets through the Use of Spatial and Temporal Weighting Schemes. Appl. Geogr. 2012, 35, 394–404. [Google Scholar] [CrossRef]
- Fan, M.; Fan, K.; Leung, L. Walking Route–Based Calculation Is Recommended for Optimizing Deployment of Publicly Accessible Defibrillators in Urban Cities. JAHA 2020, 9, e014398. [Google Scholar] [CrossRef]
- Gianotto-Oliveira, R.; Gonzalez, M.M.; Vianna, C.B.; Monteiro Alves, M.; Timerman, S.; Kalil Filho, R.; Kern, K.B. Survival After Ventricular Fibrillation Cardiac Arrest in the Sao Paulo Metropolitan Subway System: First Successful Targeted Automated External Defibrillator (AED) Program in Latin America. JAHA 2015, 4, e002185. [Google Scholar] [CrossRef]
- Hare, T.S.; Barcus, H.R. Geographical Accessibility and Kentucky’s Heart-Related Hospital Services. Appl. Geogr. 2007, 27, 181–205. [Google Scholar] [CrossRef]
- Yeung, J.; Okamoto, D.; Soar, J.; Perkins, G.D. AED Training and Its Impact on Skill Acquisition, Retention and Performance—A Systematic Review of Alternative Training Methods. Resuscitation 2011, 82, 657–664. [Google Scholar] [CrossRef]
- Sun, C.L.F.; Karlsson, L.; Torp-Pedersen, C.; Morrison, L.J.; Folke, F.; Chan, T.C.Y. Spatiotemporal AED Optimization Is Generalizable. Resuscitation 2018, 131, 101–107. [Google Scholar] [CrossRef]
- Dao, T.H.D.; Zhou, Y.; Thill, J.-C.; Delmelle, E. Spatio-Temporal Location Modeling in a 3D Indoor Environment: The Case of AEDs as Emergency Medical Devices. Int. J. Geogr. Inf. Sci. 2012, 26, 469–494. [Google Scholar] [CrossRef]
- Zhang, J.; Mu, L.; Zhang, D.; Rajbhandari-Thapa, J.; Chen, Z.; Pagán, J.A.; Li, Y.; Son, H.; Liu, J. Spatiotemporal Optimization for the Placement of Automated External Defibrillators Using Mobile Phone Data. Int. J. Geo Inf. 2023, 12, 91. [Google Scholar] [CrossRef] [PubMed]
- Tsukigase, K.; Tanaka, H.; Takyu, H. Mismatch between Sites of Incidence of Out-of-Hospital Cardiac Arrest and Locations of Installed Automated External Defibrillator in the Tokyo Metropolitan Area. World J. Cardiovasc. Dis. 2017, 07, 185–194. [Google Scholar] [CrossRef]
- Tierney, N.J.; Reinhold, H.J.; Mira, A.; Weiser, M.; Burkart, R.; Benvenuti, C.; Auricchio, A. Novel Relocation Methods for Automatic External Defibrillator Improve Out-of-Hospital Cardiac Arrest Coverage under Limited Resources. Resuscitation 2018, 125, 83–89. [Google Scholar] [CrossRef]
- Purahong, B.; Anuwongpinit, T.; Juhong, A.; Kanjanasurat, I.; Pintaviooj, C. Medical Drone Managing System for Automated External Defibrillator Delivery Service. Drones 2022, 6, 93. [Google Scholar] [CrossRef]
- Pollack, R.A.; Brown, S.P.; Rea, T.; Aufderheide, T.; Barbic, D.; Buick, J.E.; Christenson, J.; Idris, A.H.; Jasti, J.; Kampp, M.; et al. Impact of Bystander Automated External Defibrillator Use on Survival and Functional Outcomes in Shockable Observed Public Cardiac Arrests. Circulation 2018, 137, 2104–2113. [Google Scholar] [CrossRef]
- Lwanga, A.; Garcia-Sayan, E.; Lwanga, S.; Karreman, E.; Mohamed, A. Automated External Defibrillators and Survival After Nonresidential Out of Hospital Cardiac Arrest in a Small North American City. Am. J. Cardiol. 2017, 119, 1979–1982. [Google Scholar] [CrossRef]
- Lorenzo, G.; Maria Antonia, B.; Piero Maria, B.; Andrea, P.; Guido Francesco, V.; Enrico Gianluca, C. Development of a Novel Framework to Propose New Strategies for Automated External Defibrillators Deployment Targeting Residential Out-of-Hospital Cardiac Arrests: Application to the City of Milan. Int. J. Geo Inf. 2020, 9, 491. [Google Scholar] [CrossRef]
- Deng, X.; Gao, F.; Liao, S.; Liu, Y.; Chen, W. Spatiotemporal Evolution Patterns of Urban Heat Island and Its Relationship with Urbanization in Guangdong-Hong Kong-Macao Greater Bay Area of China from 2000 to 2020. Ecol. Indic. 2023, 146, 109817. [Google Scholar] [CrossRef]
- Niu, Y.; Chen, R.; Liu, C.; Ran, P.; Chen, A.; Chen, X.; Kan, H. The Association between Ambient Temperature and Out-of-Hospital Cardiac Arrest in Guangzhou, China. Sci. Total Environ. 2016, 572, 114–118. [Google Scholar] [CrossRef]
- Dai, X.; He, X.; Zhou, Z.; Chen, J.; Wei, S.; Chen, R.; Yang, B.; Feng, W.; Shan, A.; Wu, T.; et al. Short-Term Effects of Air Pollution on out-of-Hospital Cardiac Arrest in Shenzhen, China. Int. J. Cardiol. 2015, 192, 56–60. [Google Scholar] [CrossRef]
- Song, Y.; Chen, B.; Ho, H.C.; Kwan, M.-P.; Liu, D.; Wang, F.; Wang, J.; Cai, J.; Li, X.; Xu, Y.; et al. Observed Inequality in Urban Greenspace Exposure in China. Environ. Int. 2021, 156, 106778. [Google Scholar] [CrossRef]
- Chen, Z.; Li, P.; Jin, Y.; Jin, Y.; Chen, J.; Li, W.; Song, X.; Shibasaki, R.; Chen, M.; Yan, D.; et al. Using Mobile Phone Big Data to Identify Inequity of Artificial Light at Night Exposure: A Case Study in Tokyo. Cities 2022, 128, 103803. [Google Scholar] [CrossRef]
- Li, C.-E.; Lin, Z.-H.; Hsu, Y.-Y.; Kuo, N.-W. Lessons from COVID-19 Pandemic: Analysis of Unequal Access to Food Stores Using the Gini Coefficient. Cities 2023, 135, 104217. [Google Scholar] [CrossRef]
- Zhang, D.; Zhang, G.; Zhou, C. Differences in Accessibility of Public Health Facilities in Hierarchical Municipalities and the Spatial Pattern Characteristics of Their Services in Doumen District, China. Land 2021, 10, 1249. [Google Scholar] [CrossRef]
- Yu, P.; Jian, I.Y.; Yung, E.H.K.; Chan, E.H.W.; Wong, M.S.; Chen, Y. Spatial Vertical Equity in Public General Hospitals: Towards a Sustainable Healthcare System. Land 2023, 12, 1498. [Google Scholar] [CrossRef]
- Song, Y.; Wang, J.; Ge, Y.; Xu, C. An Optimal Parameters-Based Geographical Detector Model Enhances Geographic Characteristics of Explanatory Variables for Spatial Heterogeneity Analysis: Cases with Different Types of Spatial Data. GIScience Remote Sens. 2020, 57, 593–610. [Google Scholar] [CrossRef]
- Wang, J.; Li, X.; Christakos, G.; Liao, Y.; Zhang, T.; Gu, X.; Zheng, X. Geographical Detectors-Based Health Risk Assessment and Its Application in the Neural Tube Defects Study of the Heshun Region, China. Int. J. Geogr. Inf. Sci. 2010, 24, 107–127. [Google Scholar] [CrossRef]
- Zhou, X.; Yeh, A.G.O. Understanding the Modifiable Areal Unit Problem and Identifying Appropriate Spatial Unit in Jobs–Housing Balance and Employment Self-containment Using Big Data. Transportation 2021, 48, 18. [Google Scholar] [CrossRef]
- Gao, F.; Li, S.; Tan, Z.; Wu, Z.; Zhang, X.; Huang, G.; Huang, Z. Understanding the Modifiable Areal Unit Problem in Dockless Bike Sharing Usage and Exploring the Interactive Effects of Built Environment Factors. Int. J. Geogr. Inf. Sci. 2021, 35, 1905–1925. [Google Scholar] [CrossRef]
- Gao, F.; Deng, X.; Liao, S.; Liu, Y.; Li, H.; Li, G.; Chen, W. Portraying Business District Vibrancy with Mobile Phone Data and Optimal Parameters-Based Geographical Detector Model. Sustain. Cities Soc. 2023, 96, 104635. [Google Scholar] [CrossRef]
- Zhou, S.; Xie, M.; Kwan, M.-P. Ageing in Place and Ageing with Migration in the Transitional Context of Urban China: A Case Study of Ageing Communities in Guangzhou. Habitat. Int. 2015, 49, 177–186. [Google Scholar] [CrossRef]
- Zhang, X.; Gao, F.; Liao, S.; Zhou, F.; Cai, G.; Li, S. Portraying Citizens’ Occupations and Assessing Urban Occupation Mixture with Mobile Phone Data: A Novel Spatiotemporal Analytical Framework. Int. J. Geo Inf. 2021, 10, 392. [Google Scholar] [CrossRef]
- Deng, X.; Liu, Y.; Gao, F.; Liao, S.; Zhou, F.; Cai, G. Spatial Distribution and Mechanism of Urban Occupation Mixture in Guangzhou: An Optimized GeoDetector-Based Index to Compare Individual and Interactive Effects. Int. J. Geo Inf. 2021, 10, 659. [Google Scholar] [CrossRef]
- Ravenscroft, N. The Vitality and Viability of Town Centres. Urban. Stud. 2000, 37, 2533–2549. [Google Scholar] [CrossRef]
- Zheng, Z.; Zhou, S.; Deng, X. Exploring Both Home-Based and Work-Based Jobs-Housing Balance by Distance Decay Effect. J. Transp. Geogr. 2021, 93, 103043. [Google Scholar] [CrossRef]
- Zhou, X. Spatial Variation of Self-Containment and Jobs-Housing Balance in Shenzhen Using Cellphone Big Data. J. Transp. Geogr. 2018, 68, 7. [Google Scholar] [CrossRef]
- Tian, L.; Yao, Z.; Fan, C.; Zhou, L. A Systems Approach to Enabling Affordable Housing for Migrants through Upgrading Chengzhongcun: A Case of Xiamen. Cities 2020, 105, 102186. [Google Scholar] [CrossRef]
- Liu, Y.; Li, Z.; Breitung, W. The Social Networks of New-Generation Migrants in China’s Urbanized Villages: A Case Study of Guangzhou. Habitat. Int. 2012, 36, 192–200. [Google Scholar] [CrossRef]
- Huang, C.-Y.; Wen, T.-H. Optimal Installation Locations for Automated External Defibrillators in Taipei 7-Eleven Stores: Using GIS and a Genetic Algorithm with a New Stirring Operator. Comput. Math. Methods Med. 2014, 2014, 241435. [Google Scholar] [CrossRef]
- Fotheringham, A.; Brunsdon, C.F.; Charlton, M. Geographically Weighted Regression: The Analysis of Spatially Varying Relationships; John Wiley & Sons: Hoboken, NJ, USA, 2003. [Google Scholar]
- Gao, F.; Li, S.; Tan, Z.; Zhang, X.; Lai, Z.; Tan, Z. How is Urban Greenness Spatially Associated with Dockless Bike Sharing Usage on Weekdays, Weekends, and Holidays? ISPRS Int. J. Geo. Inf. 2021, 10, 238. [Google Scholar] [CrossRef]
- Deng, X.; Gao, F.; Liao, S.; Li, S. Unraveling the Association between the Built Environment and Air Pollution from a Geospatial Perspective. J. Clean. Prod. 2023, 386, 135768. [Google Scholar] [CrossRef]


| City | Variable | Abbreviation | Max | Mean | SD |
|---|---|---|---|---|---|
| Guangzhou | Local GDP per capita | GDP | 115,410 | 33,197 | 23,027 |
| Population density | POP_DEN | 18.907 | 3.623 | 3.701 | |
| The proportion of the elderly | OLD_RATIO | 0.165 | 0.065 | 0.037 | |
| Local average mobility | MOBILITY | 205.294 | 102.468 | 37.117 | |
| Company density | WORK_DEN | 784.600 | 144.867 | 167.532 | |
| Residential density | LIVE_DEN | 111.305 | 21.063 | 26.532 | |
| Shenzhen | Local GDP per capita | GDP | 122,567 | 35,999 | 24,401 |
| Population density | POP_DEN | 30.215 | 3.658 | 4.551 | |
| The proportion of the elderly | OLD_RATIO | 0.047 | 0.024 | 0.010 | |
| Local average mobility | MOBILITY | 219.023 | 112.293 | 35.303 | |
| Company density | WORK_DEN | 571.816 | 121.740 | 124.890 | |
| Residential density | LIVE_DEN | 849.271 | 14.642 | 15.852 |
| City | Variable | Discretization Method | No. of Intervals |
|---|---|---|---|
| Guangzhou | GDP | Quantile | 4 |
| POP_DEN | Quantile | 6 | |
| OLD_RATIO | Natural | 4 | |
| MOBILITY | Natural | 6 | |
| WORK_DEN | Natural | 4 | |
| LIVE_DEN | Quantile | 5 | |
| Shenzhen | GDP | Natural | 5 |
| POP_DEN | Natural | 6 | |
| OLD_RATIO | Equal | 6 | |
| MOBILITY | Natural | 6 | |
| WORK_DEN | Natural | 6 | |
| LIVE_DEN | Quantile | 5 |
| City | Rank | Joint q Value ) | Variation Compared with | Variation Compared with | ||
|---|---|---|---|---|---|---|
| GZ | 1 | WORK_DEN | LIVE_DEN | 0.922 | 16.86% | 5.25% |
| 2 | OLD_RATIO | LIVE_DEN | 0.903 | 87.04% | 3.13% | |
| 3 | MOBILITY | LIVE_DEN | 0.901 | 29.06% | 2.83% | |
| 4 | MOBILITY | WORK_DEN | 0.900 | 28.87% | 14.01% | |
| 5 | GDP | LIVE_DEN | 0.898 | 24.07% | 2.54% | |
| SZ | 1 | GDP | LIVE_DEN | 0.894 | 34.59% | 5.02% |
| 2 | GDP | POP_DEN | 0.861 | 51.96% | 5.48% | |
| 3 | GDP | MOBILITY | 0.847 | 10.92% | 52.42% | |
| 4 | MOBILITY | LIVE_DEN | 0.845 | 12.69% | 37.75% | |
| 5 | POP_DEN | LIVE_DEN | 0.841 | 17.07% | 11.66% |
Disclaimer/Publisher’s Note: The statements, opinions and data contained in all publications are solely those of the individual author(s) and contributor(s) and not of MDPI and/or the editor(s). MDPI and/or the editor(s) disclaim responsibility for any injury to people or property resulting from any ideas, methods, instructions or products referred to in the content. |
© 2023 by the authors. Licensee MDPI, Basel, Switzerland. This article is an open access article distributed under the terms and conditions of the Creative Commons Attribution (CC BY) license (https://creativecommons.org/licenses/by/4.0/).
Share and Cite
Liao, S.; Gao, F.; Feng, L.; Wu, J.; Wang, Z.; Chen, W. Observed Equity and Driving Factors of Automated External Defibrillators: A Case Study Using WeChat Applet Data. ISPRS Int. J. Geo-Inf. 2023, 12, 444. https://doi.org/10.3390/ijgi12110444
Liao S, Gao F, Feng L, Wu J, Wang Z, Chen W. Observed Equity and Driving Factors of Automated External Defibrillators: A Case Study Using WeChat Applet Data. ISPRS International Journal of Geo-Information. 2023; 12(11):444. https://doi.org/10.3390/ijgi12110444
Chicago/Turabian StyleLiao, Shunyi, Feng Gao, Lei Feng, Jiemin Wu, Zexia Wang, and Wangyang Chen. 2023. "Observed Equity and Driving Factors of Automated External Defibrillators: A Case Study Using WeChat Applet Data" ISPRS International Journal of Geo-Information 12, no. 11: 444. https://doi.org/10.3390/ijgi12110444