Article

Evaluation of the Resilience of the Catering Industry in Hong Kong before and after the COVID-19 Outbreak Based on Point-of-Interest Data

Smart Cities Research Institute and Department of Land Surveying and Geo-Informatics, The Hong Kong Polytechnic University, Hong Kong, China
*
Author to whom correspondence should be addressed.
ISPRS Int. J. Geo-Inf. 2023, 12(11), 443; https://doi.org/10.3390/ijgi12110443
Submission received: 15 August 2023 / Revised: 9 October 2023 / Accepted: 25 October 2023 / Published: 27 October 2023

Abstract

:
COVID-19 has caused a serious economic shock which challenges the resilience of businesses around the world. Understanding the spatial distribution pattern of business resilience, as well as identifying factors that promote business resilience, is crucial to economic recovery. Most existing studies mainly analyze one side of the concept of resilience, such as how businesses closed, expanded, and innovated, while no studies take all the characteristics of resilience into account and analyze them from a geographical view. To fill this gap, this study first relates the method of calculating stability in ecology to geography, and proposes a point of interest (POI)-based index to evaluate an industry’s resilience in a city. Then, with the catering industry in Hong Kong as an example, the spatial distribution of resilience in June 2020 and December 2020 is investigated using the local indicators of spatial association (LISA) approach. An ordinary least squares (OLS) regression model is adopted to identify impactful factors on resilience. The results reveal that the resilience of restaurants is quite stable in local central areas, but areas near the checking points at Shenzhen in mainland China are severely affected. Most traditional location factors had the benefit of stabilization, while hospitals had negative responses. The presented analysis framework is possible to be easily generalized to other industries or cities. The overall result of the study provides a spatial understanding which would be essential as a reference for future urban planning regarding post-pandemic recovery.

1. Introduction

The outbreak of COVID-19 disarranged the orderly development of cities. In addition to the disturbance of the daily life of citizens, the global public health crisis severely affected local businesses. The Yelp data showed that 163,735 businesses in America were closed by September 2020, with 60% of them being permanently shut down [1]. Among various businesses, the situation for the catering industry, which is sensitive to customer flows and policy changes, was more challenging. On the customer source side, in addition to general ‘social distancing’ policies (such as city lockdowns, event cancellations, and working-from-home orders), specific restrictions regarding restaurants, such as shortening opening hours and takeaways only, made the situation worse. On the service supply side, the raw material supply chain was not guaranteed due to transportation restrictions and food safety concerns [2], in addition to the uncertainty around employment that the onset risk caused [3]. As a result, a large number of restaurants unexpectedly closed permanently. According to estimates from the National Restaurant Association, nearly 100,000 restaurants shut down during the first six months of the pandemic [4]. A national questionnaire survey presented by Meituan Research Institute in China revealed that over 90% of food practitioners were severely affected [5].
While some businessmen tightened their businesses, others chose to expand the market. From May 2020 to May 2021, 516 restaurants opened in Toronto, a number slightly greater than that of those which had closed (n = 429) [6]. Domino’s Pizza, a Michigan-based multinational pizza restaurant chain, saw same-store sales go up by 11% in 2020 and plans to expand to 2000 stores in the near future as a result [7]. Chipotle Mexican Grill (originates from Denver, America), a fast-casual restaurant chain specializing in Mexican cuisine, saw its total revenue increase by 7.1% to USD 6.0 billion in the full year of 2020 [8]. Most remarkably, their digital sales grew by 174.1% and accounted for 46.2% of sales. Hence, it cannot be said that it was not affected by the local lockdown caused by the epidemic. Similar trends were also observed regarding Starbucks (Starbucks Corporation, a multinational coffee shop which based in Seattle, America), and Papa John’s (Papa John’s International, the world’s third-largest pizza delivery company that originates from Jeffersonville, Indiana) [9,10]. A shift in consumer dining behavior and restaurant operations towards those online was also reflected during the pandemic response [2,11]. Although many governments around the world have distributed emergency disaster funds, changes have not been avoidable.
Meanwhile, a large number of studies indicate that COVID-19 accelerated the digitalization of business [12], and the catering industry is no exception [13,14,15]. With the help of digital tools, restaurants operators can keep their business, while the dining mode that allows the avoidance of contact with crowds has been favored by the public against the background of the epidemic. It is even an indispensable source of food for people who are self-quarantined at home [16].
Overall, it has been clear that COVID-19 has driven some restaurants to close down (existing restaurants closed), increased the number of new restaurants (new restaurants opened), and transferred the mode of earning (the industry developed a new path toward earnings, e.g., through online orders). As basic urban facilities, the resilience environment created by the catering industry contributes to regional culture and supports local spending and socio-economic vibrancy within a city [17,18]. If the catering industry undergoes thorough changes in the short term, city operations will be affected and even collapsed. Thus, it is essential to quantify the degree of change in restaurants and evaluate the industry’s resilience in cities in the COVID-19 context.
Currently, from the city perspective, there is no quantitative and geospatial way to measure industrial resilience. To fill this research gap, we first proposed a point of interest (POI)-based index. Then, as an empirical study, we applied the index to the catering industry of Hong Kong. The number of POIs in restaurant types in December 2019 (before the pandemic) was treated as the baseline. Since one of the research interests of this study is to understand the impact of the epidemic on the catering industry, studying the situation too long after the outbreak may make it unclear, and thus the state of the catering industry in 2020 is therefore taken as a focus. Meanwhile, taking into account that the impact occurs over time rather than immediately, we also collected data in June 2020 (a half-year after the outbreak) and December 2020 (a year after the outbreak) to represent the lasting impact of COVID-19. According to the analysis, the spatial distribution pattern in local central areas was more stable than were the boundaries. Although some studies claimed that there was a positive association between the severity of the pandemic and business closure, our results indicated that COVID-19 did not damage the resilience of the catering industry. Nevertheless, a negative correlation was observed with the number of hospitals, so the role of accessibility in the COVID-19 context beckons a revaluation.
The rest of this paper is organized as follows: In Section 2, we point out that the existing literature on restaurant closures is only one side of the concept of resilience. Then, the full concept of resilience is summarized and related studies are reviewed. In Section 3, we first describe the study background and materials. An index to measure the resilience of an industry from a city’s perspective is then proposed, and the study materials are used as examples to help illustrate this. In the last section, the LISA spatial analysis approach and two OLS-based models are used to measure catering industry resilience in Hong Kong. In Section 4, based on the analysis results, the spatial pattern and impact factors are identified. We conclude the study in Section 5. The index we established can easily extend to other industries provided that data are available. The overall result contributes to a spatial understanding of the catering industry under COVID-19 conditions and can serve as a basic reference for the formulation of sustainable urban planning policies in the post-pandemic period.

2. Literature Review

2.1. Studies on Restaurant Closures

As described above, many restaurants no longer exist. Researchers focused on the closures and have conducted several studies. By making use of POI data from SafeGraph, a study visualized the closure pattern of restaurants in the United States. The result indicated a closure peak between July 2020 and August 2020 [19]. Taking into account the disproportionate impact of COVID-19, Huang et al. [20] extracted the POIs of Black-owned restaurants in the United States and examined the differential influence of COVID-19 on those in cities. Similarly, Motoyama [21] observed a higher closure rate in poor and minority neighborhoods. Additionally, Li and Stoler [22] re-examined the traditional location theory against the pandemic background. Furthermore, a study linked POIs with mobile phone data to reveal correlations between customer characteristics and restaurants [23].
This kind of research focused on closed restaurants and linked them with their neighborhood characteristics. A macro-picture of failure was examined and we gained insight into how restaurants failed on an individual basis. However, it must be noted that the research did not have a city resilience perspective. Thus, the urban dynamic is not fully explored in the COVID-19 context.

2.2. Concept of City Resilience and Related Studies

Resilience thinking was first proposed in physics and is gradually developing in other fields; there are now three main interpretations: engineering, ecological, and evolutionary [24,25]. Firstly, the concept of engineering resilience focused on the recovery of the previous status of ability after the shock was experienced [26]. This assumption of resilience maintains an eternal state, which counters the characteristic of cities, which change over time; thus, it is not suitable for social research. Different from engineering resilience, ecological resilience considers an ecosystem can comprise multiple equilibrium states. External disturbances will affect a system, but at the same time can guide the system into a new stable state [27]. Lastly, evolution resilience emphasizes the self-adaptive ability of the system and the process of internal absorption and transformation [28].
In spite of the difference in definitions, it is possible to recognize three key characteristics when considering resilience [29]: robustness, which indicates the ability to resist pressure and maintain oneself; adaptability, which indicates whether or not an object can make adjustments and develop new paths to survive; recovery, which indicates the ability of the object to recover from damage to a stable status (old or new).
With that in mind, some practical social research has been conducted to quantify the resilience of urban entities after the public health crisis. A few studies consider operating status as the representation of resilience. In other words, if a business entity could survive amid the pandemic, then researchers see it as more resilient. Individually, several attributes of restaurants were extracted to understand what can help restaurants keep their business [30]. From the amenity cluster view, Bogang Juna et al. [31] found that the aggregation effect failed to increase the number of entities in the cluster, but that individual stores are more likely to survive when they are located in the cluster that provides related services. Specifically, Lee and Choi [32] investigated how the franchise effect would help franchises keep their stores and survive during the pandemic.
This kind of research uses the status of business entities (still open or closed) to represent resilience. Any closure was considered to lower resilience and further indicated the lack of ability to successfully adjust to the dramatic new social circumstances caused by the virus. In other words, all closures were virus-enforced and ‘unsuccessful’ [33]. However, it is possible that owners were supposed to stop services in a good way, or transfer them to other businesses that were likely to make more profit during the pandemic. This adaptive ability is in line with the definition of resilience but is underestimated. Entities can evolve by falling, transferring, or rising. When evaluating an industry within a city as a whole, focusing only on the fall side may mean taking positive changes for granted.
Other studies claimed that restaurants showed resilience by adopting multidimensional innovations to accommodate the new consumption environment reshaped by the pandemic. Quality description heavily relied on a large amount of social observation or content analysis, and was, as such, hard to quantify [3,6,34,35,36]. By using the judgments of restaurant managers and owners (in terms of whether or not they evaluated their business as resilient), Neise et al. [37] created a survey dataset and investigated the attributes of restaurants that impact business resilience. However, the data were the subjective opinions of the respondents, and the bias from the real turnover was unavailable. Working with a similar research question, considering the online delivery platforms that played a key role during the pandemic, scholars used online orders or customer reviews as indicators of business performance [38,39]. As a general rule, the more orders or comments there are, the more business the restaurants have, and the more resilient they are. More directly, Kim et al. [40] the obtained sales information of retail stores in Seoul from January 2019 to August 2020. Regardless of what efforts a business made to fight against the pandemic, sales naturally revealed the most accurate result. They defined slighter drops in the sales curve as higher robustness, and the faster the curve rose again, the higher the resilience. Also using time series data, Cristian Podesta et al. [41] analyzed the change in visits to POIs before, during, and also after Hurricane Harvey in the Houston metropolitan area in 2017. They quantified the resilience of different types of facilities according to the line features (drop, climb, and slope) of curves. Similarly, B. Wang et al. [42] examined the time series result of changes in visit numbers in 100 major restaurant chains in the United States. The researchers concluded that restaurants with heavy social functions were more resilient as it was seen that the number of visits recovered faster (slope).

2.3. Summary

So far, most studies have focused on the micro-level (the resilience of individuals) or meso-level (the resilience of industry). The status of business, the survey results from frontline employees, or the data created via location-based services (LBS) are obtained as indicators of resilience. Through various regression or clustering approaches, studies highlight what factors help individual businesses survive and which kinds of businesses can recover quickly from shocks. However, it remains unexplored how an industry is responding to shocks such as the above from a city perspective, a gap which this study aimed to fill. For an entire city, several business entities fall and rise, and this may be considered part of their normal evolution, while drastic changes may damage the city’s function. Therefore, the resilience of an industry requires attention. Qualifying the degree of change of an industry within a city may not only facilitate the development of the industry but also provide a reference for urban policies and insights into urban dynamics.
In this regard, this study focuses on the following research questions: (1) How can we qualify the resilience of facilities from a city perspective? (2) Using the catering industry in Hong Kong as a pilot study, what is the spatial resilience distribution half a year and one year after the outbreak? (3) How will COVID-19 affect resilience or do there exist other impactful factors?

3. Materials and Methods

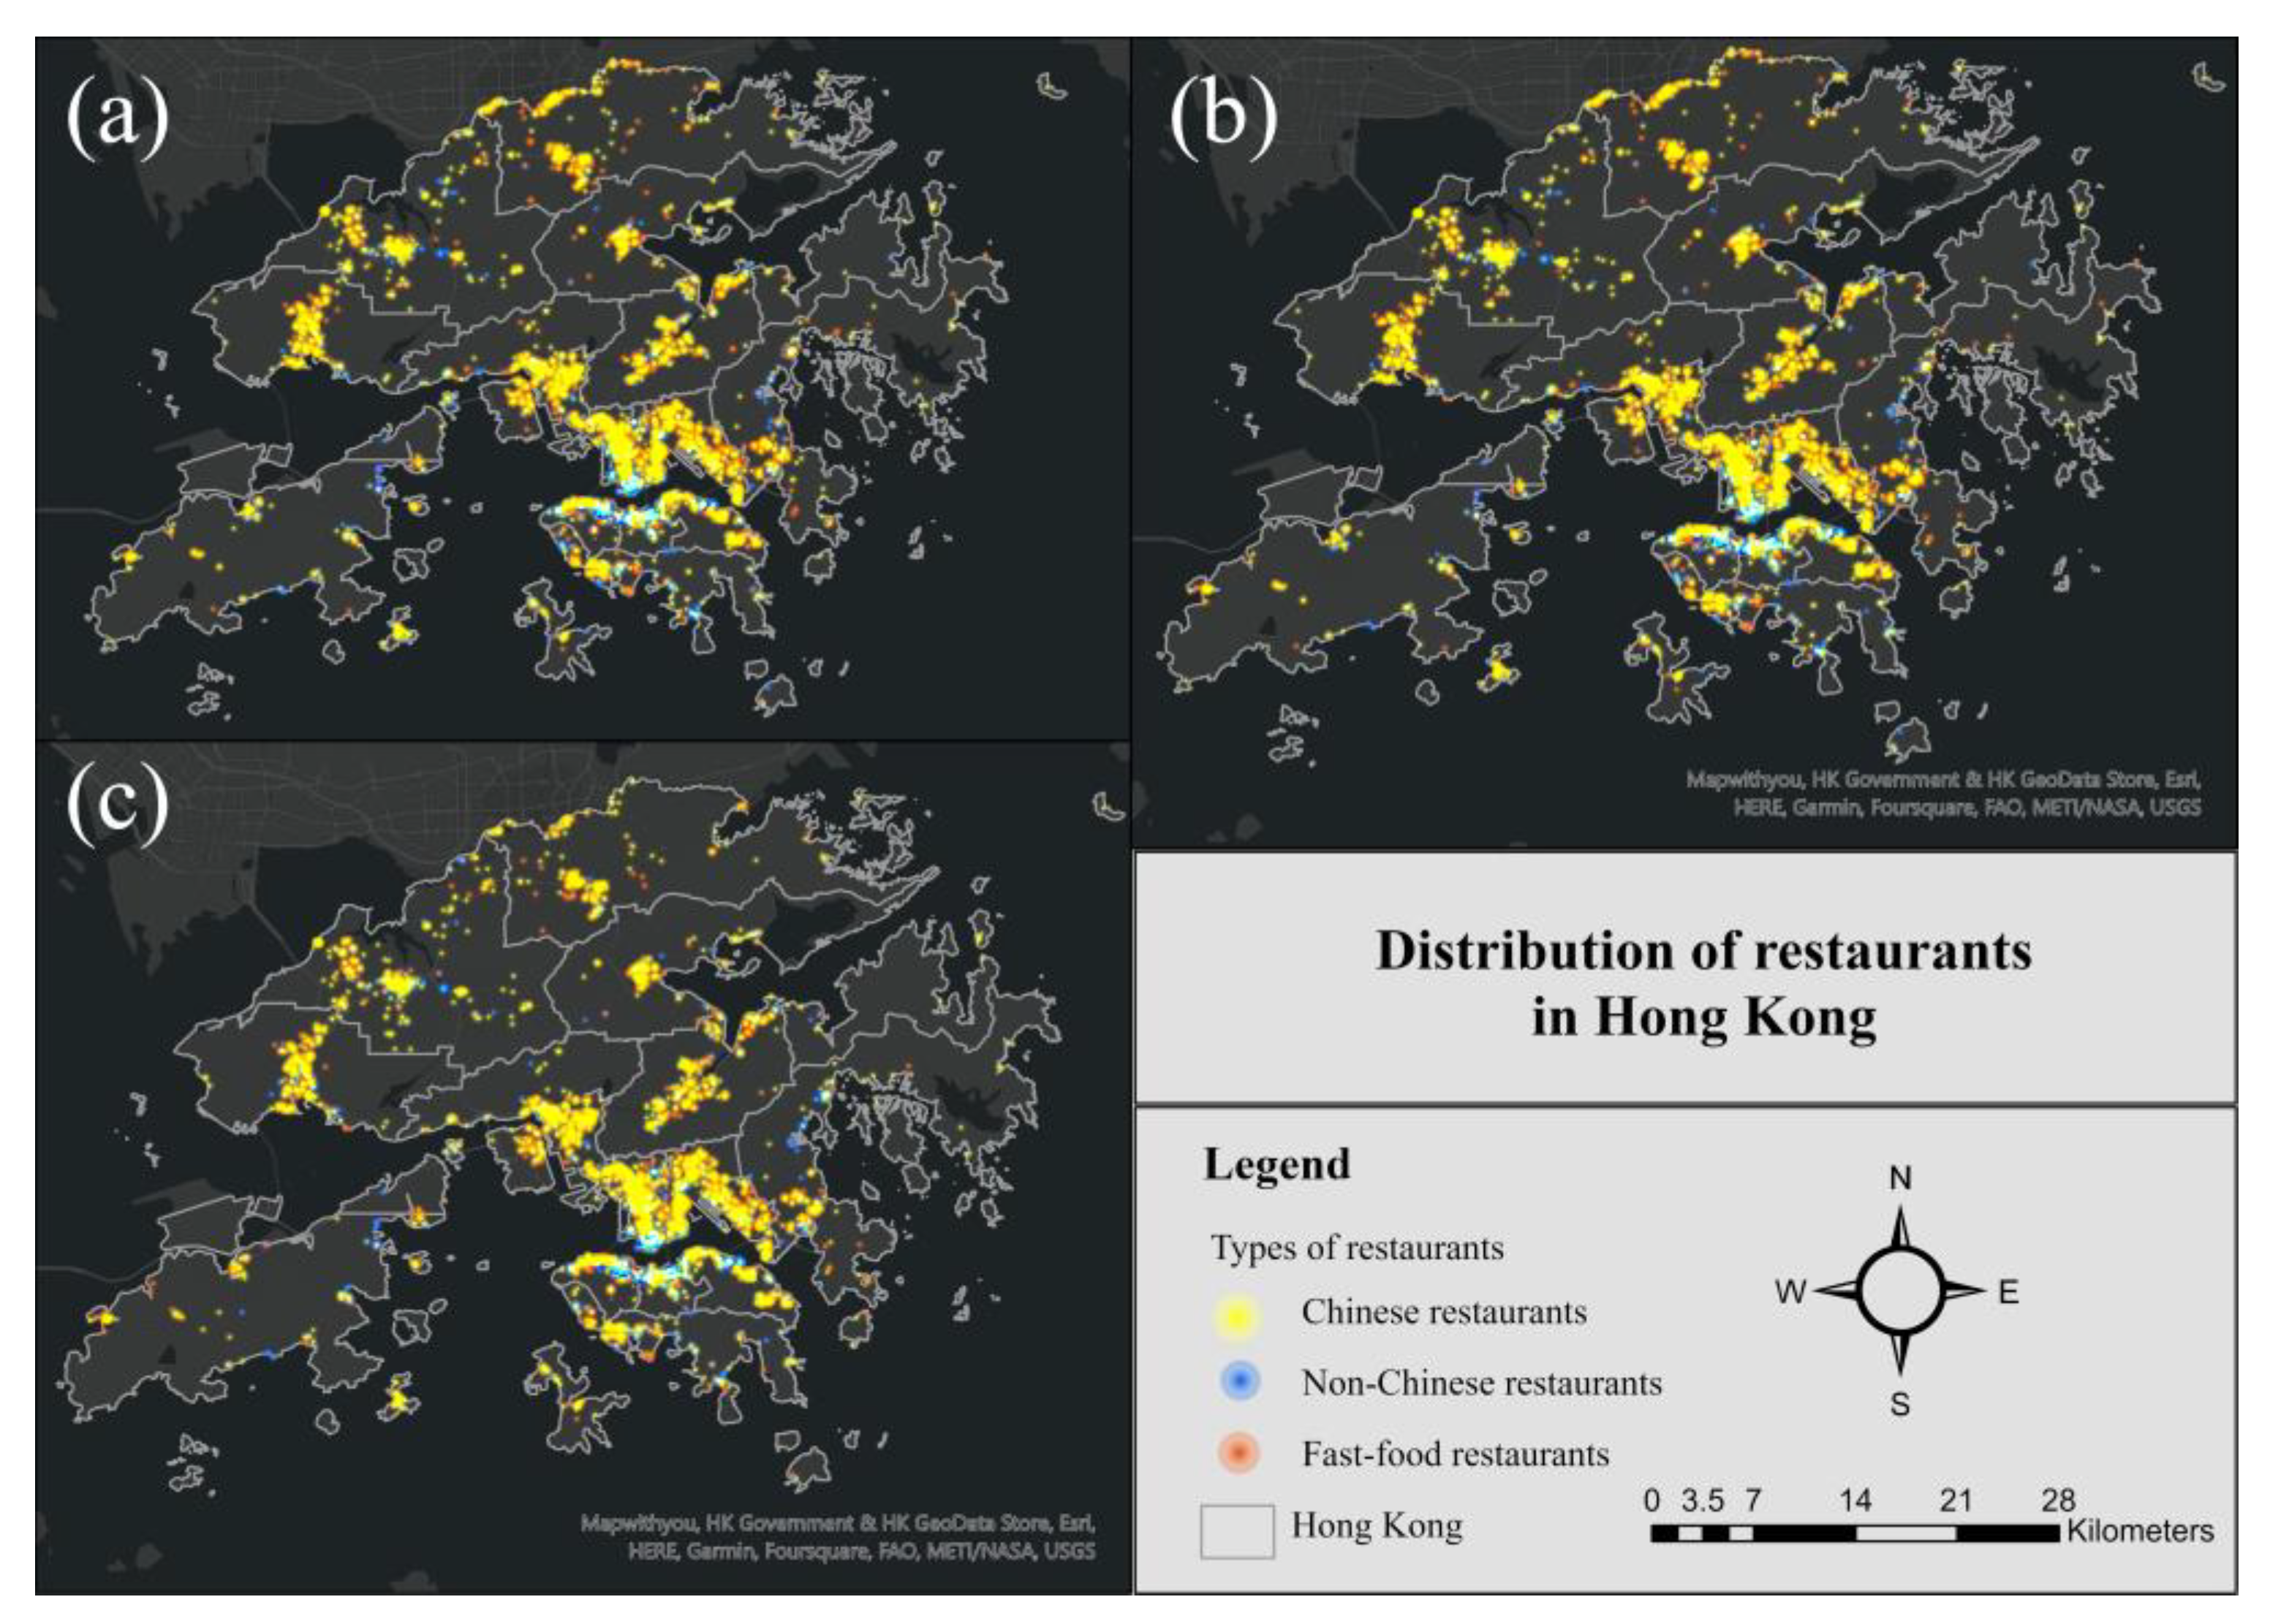
3.1. Study Areas and Data

3.1.1. Study Context

Among all kinds of urban entities, restaurants are the ones this study is particularly concerned about for three reasons. First, restaurants are basic urban amenities that reflect local consumption and demand more closely [43]. Second, without too many limitations, the distribution of restaurants is decentralized over the city, which also can be seen as an indicator of local socioeconomic conditions [44]. Third, as a consumer-intensive industry, restaurants are sensitive to policy changes and infectious diseases such as COVID-19 [45].
The research spatial scope comprises the Hong Kong Special Administrative Region (SAR). Hong Kong as a modern international metropolis offers a wide variety of dining options: (1) Chinese Restaurants, referring to restaurants that mainly serve Chinese cuisine; (2) Asian restaurants, referring to restaurants that serve a variety of African, Chinese, and Asian cuisines, such as Japanese, Korean, and Thai cuisines; (3) Western-style restaurants, referring to restaurants that mainly serve Western food, including but not limited to French, Italian, British, American, and Mexican cuisine; (4) fast food restaurants, where customers must pick up their meals and sit down by themselves; (5) bars, which specialize in serving alcoholic beverages and a small selection of prepared dishes or snacks; (6) other dining establishments, including coffee shops, beverage shops, herbal tea shops, establishments providing party dining services, and establishments not mentioned in the above categories. In the years before the outbreak of COVID-19, the gross domestic product (GDP) of accommodation and food services was about 3% [46]. By 2019, over twenty-three hundred thousand people were engaged in food and beverage services. They provide multilevel job opportunities, from roles as cooks and waiters to managerial roles, accounting for over 8% of all employment [47]. On the other hand, the variety of cuisines enhances local residents’ lifestyles and plays a vital role in attracting tourists, promoting cultural exchange, and business engagements, making the canteen industry an essential economic driver. However, the number has dramatically decreased due to the devastating effects of COVID-19. It is possible to imagine that merchants make efforts to balance high costs and profits. As a fundamental infrastructure of the commercial sector that the economy depends heavily upon, the resilience of the catering industry urgently needs to be studies.

3.1.2. Data Source

Three datasets were involved in this study. (1) POI data on restaurant categories were used. This included restaurant POI data for three periods (Figure 1): December 2019 (before the outbreak), June 2020 (six months after the outbreak), and December 2020 (one year after the outbreak). All of the locations and labeling information on restaurants were obtained from AutoNavi Map (a leading mobile map provider in China) with a consistent technique. The major classifications of restaurants were further divided into three subclassifications, which were Chinese restaurants, non-Chinese restaurants, and fast-food restaurants. These are the pillars of Hong Kong’s catering industry (Section 3.1.1). In spite of the fact that the original dataset from AutoNavi Map provided finer classifications, we did not adopt it due to the consideration of accuracy. (2) Confirmed case data in Hong Kong in whole 2020, collected from the Hong Kong COVID-19 thematic website, were also used. Residential addresses (i.e., where a patient lived when infection was confirmed), the date when a case was confirmed, and the type of case (local case, epidemiologically linked with local case, imported case, or epidemiologically linked with imported case) were recorded in detail. Among all the cases, import cases were excluded since they were not engaged within society due to the quarantine. (3) Population and urban built environment components were also considered. We first attempted to obtain related data from the Hong Kong government before other open data sources were checked. More specifically, the raster of population distribution in 2019 was provided by ‘Data for Good’ with a 30 m spatial resolution. As the analysis unit in this study is a cell, the statistics published by the Hong Kong government using the scale of tertiary planning units (TPUs) are too coarse. Information related to the hospital was collected from Hong Kong GeoData Store; Hong Kong markets (referring to food-centered streets in Hong Kong as special urban features) were identified from the Hong Kong Markets thematic website. The land utilization raster in Hong Kong with a 10 m spatial resolution was downloaded from the Planning Department of Hong Kong. The shapefiles of road networks and MTR stations were obtained from OpenStreet Map, while shopping malls were extracted from a AutoNavi Map.

3.1.3. Data Processing

Instead of distinct boundaries, distance is the most limiting issue in terms of people’s daily activities. A previous study identified that 0.8 km–1 km is a general activity range for an individual [48]. The whole areas for this study were therefore divided into 1 km × 1 km squares.
OLS-based regression models were developed to examine what factors affect resilience. The dependent variable was the resilience of restaurants in a grid (for the measurement method, see Section 3.2). In order to assess the relationship between COVID-19 and restaurant resilience, the number of confirmed cases in each grid was included as a dependent variable. Case numbers may directly influence the business of restaurants, while they also can be seen as a contextual environmental and spatial proxy [22]. Hospital numbers, particularly, were included as COVID-19-realted factors. To avoid coming across patients around hospitals, people may take a detour, which may decrease the volume of crowds nearby. Due to the high incidence in the elderly [49] and thereby the likelihood of close physical contact being the main mode of transmission [50], elder density and population density were added to the models. Additionally, neighborhood location factors have been proven as the most influential factors for a restaurant to succeed [45]. Therefore, some man-made surroundings and land characteristics were extracted to represent urban circumstances. Specifically, the land use index, building coverage ratio, residential area, and park numbers were used to describe the urbanization degree [22,51,52,53]. Commercial areas, shopping malls, and market numbers were included to reflect the aggregation effect [22]. Accessibility was determined according to road density and MTR stations [52,53].
Bearing in mind the above, in total, 12 variables for the urban built environment, 2 variables for population characteristics, and 1 variable for the situation of the epidemic were used as explanatory variables. All variables were computed on a grid scale. All processing was conducted using ArcGIS Pro and Python 3.5. Details of the variables are shown in Table 1.

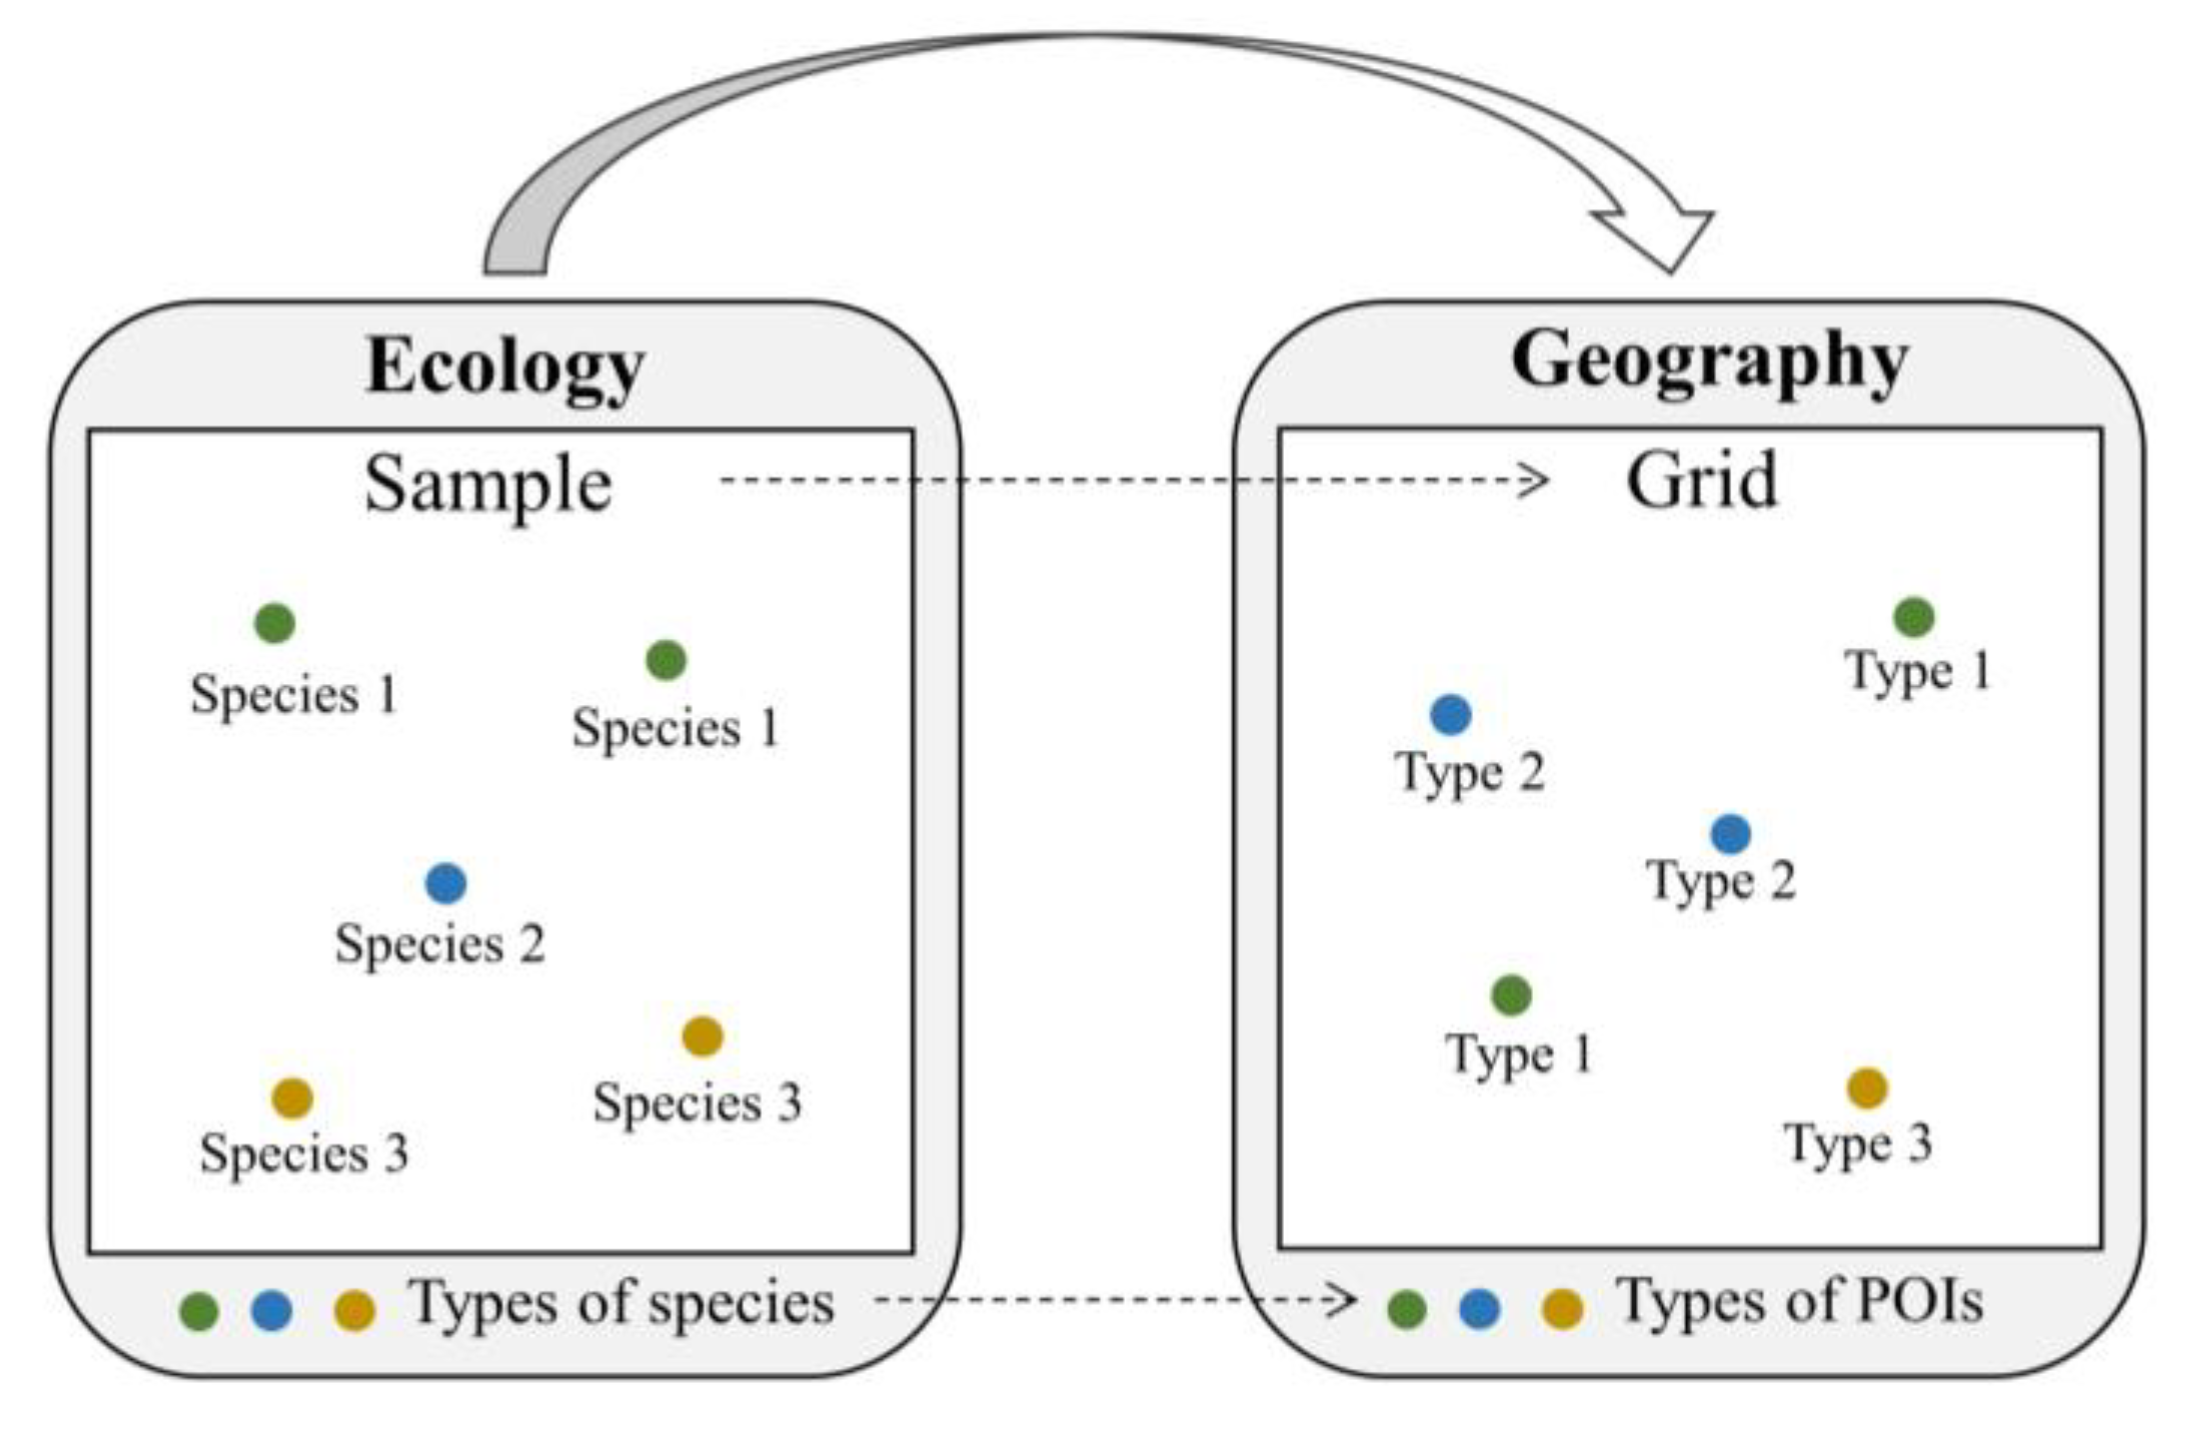
3.2. Proposed POI-Based Index to Measure Restaurant Resilience

To illustrate the proposed index, we first introduce the concept and mathematical logic of temporal stability in ecology. Then, through an analogy, this study aims to import the idea into geography to evaluate industry resilience based on POIs and analyses the fitness.
Unlike the LBS data source, which is hard to access and usually underestimates non-mobile phone user groups such as those composed of children and the elderly, POI data are relatively easy to obtain, up-to-date, and more universal. To bridge the gap between resilience theory and application, the temporal stability concept from the ecology field is borrowed. The analysis unit in the ecology field is called a ‘sample’, where the areas are equal and various plants grow. A large number of duplicate samples is used to find statistical results. In every single sample, temporal stability, S T , is measured as below:
S T = μ T δ T = A b u n d a n c e V a r i a n c e + C o v a r i a n c e
Assuming two observation time points, t 1 and t 2 ( t 1 , t 2 T ) , the number of each type of plant in the sample is recorded, where μ T is the mean number of plants in a sample between t 1 and t 2 , which represents mean abundance in ecology. The standard deviation, δ T , is calculated via the total number of plants in t 1 and t 2 , and can be rewritten as the root square of the sum of variance and covariance.
The three components in the equation represent three interspecific interactions in a sample. On the numerator side, if increasing diversity increases the average overall biomass of a community, such an effect is called over-yielding. Accordingly, in commerce, this is similar to a commercial collective area, such as a shopping mall or public market. Various commercial facilities form clusters to increase customer flow and earn more profit. Taking the numerator of Equation (1), the increase results in higher temporal stability. On the denominator side, variance describes the fluctuation of a single type of species with diversity, called the portfolio effect, while covariance quantifies the fluctuation between types, called the covariance effect. The former assumes that the relative fluctuation in a diversified community may be smaller than that in a relatively simple community. Such an assumption is also applied in economics; a diversified investment experiences less fluctuation on average, hence the famous saying ‘Don’t put all your eggs in one basket’. Similarly, a spatial unit with a variety of restaurants may fluctuate more than others. For the latter, a positive covariance means two species have a positive interaction, while a negative covariance means an increased number of one species will lead to a decrease in that of another. If covariance equals 0, then the two species are totally independent. The latter part can be seen as promotion (positive covariance), competition (negative covariance), or no correlation (zero covariance) within restaurants. A detailed illustration can be found in [54]. It is noteworthy that this study is more focused on the overall result of the expression rather than the separate parts. Mathematically, the whole expression is the reciprocal of the coefficient of variation. When no variation occurs, the denominator equals zero, resulting in maximal (infinite) temporal stability. Conversely, if the variation is large, temporal stability will be small (close to 0).
Comprehensively considering the mechanism of interaction and the mathematical meaning, an analogy is drawn from the species in ecology to the types of POIs in geography (Figure 2).
The equation can then be rewritten as follows:
S T = μ T δ T = N u m b e r   o f   P O I s ¯ V a r i a n c e + C o v a r i a n c e
where μ T is the mean number of POIs in the sample between t 1 and t 2 , while δ T is the standard deviation within a grid.
In fact, this is not the first attempt to use ecology concepts as references in geography. Shannon’s index, which originates from the communication theory for prediction, was developed by Claude Shannon in 1948 [55]. Once it was published, ecologists imported this index to investigate biological diversity in a community in a large amount of research. In geoinformatics, this index is widely used to calculate land use diversity and POI diversity.
This indicator demonstrates resilience thinking in the following ways. One aspect is robustness. We agree that urban society would not recover the same situation, but a place with resilience is unlikely to experience a drastic shift in a short time. To express this view in mathematics, the median was used as the threshold. If the stability value of the observed grid was higher than the median, it was considered either more resilient; otherwise, it was considered less resilient.
The other aspect is adaptability. Within a study area, two observed time points, t 1 and t 2 , are set, and the number in t 1 is taken as the standard; then, the number of each type of POI in t 2 is compared with that in t 1 . Note that as long as all the numbers are unchanged, temporal stability would reach the maximum (infinite). Even if inner changes have occurred, it is considered that the changes would not affect the entire community. Using restaurants as an example, say one Chinese restaurant is permanently closed, while the other Chinese restaurant is newly opened; if all else remains unchanged, this change would not be reflected in the result because of the lack of change in the number of participating items. What is expressed is the idea that this design can give some space to allow an area to make some adjustments in the face of external shocks, and it is considered ‘stable’ in a mathematical way. This flexibility comprises the idea of resilience (adaptability). In contrast, if many Chinese restaurants close, or transform into other types, such as Non-Chinese restaurants, the change in types would be detected and thereby be reflected in the result.
The final aspect is recovery. A place can either recover the status prior to the occurrence of a shock, or it may transfer to another new balanced status. If data are available, it is possible to identify unusual changes by means of analyzing the time series result of the index.
In the next section, the above index is applied to the catering industry of Hong Kong. Furthermore, to avoid confusion, in this manuscript, ‘resilience’ is used rather than ‘temporal stability’.

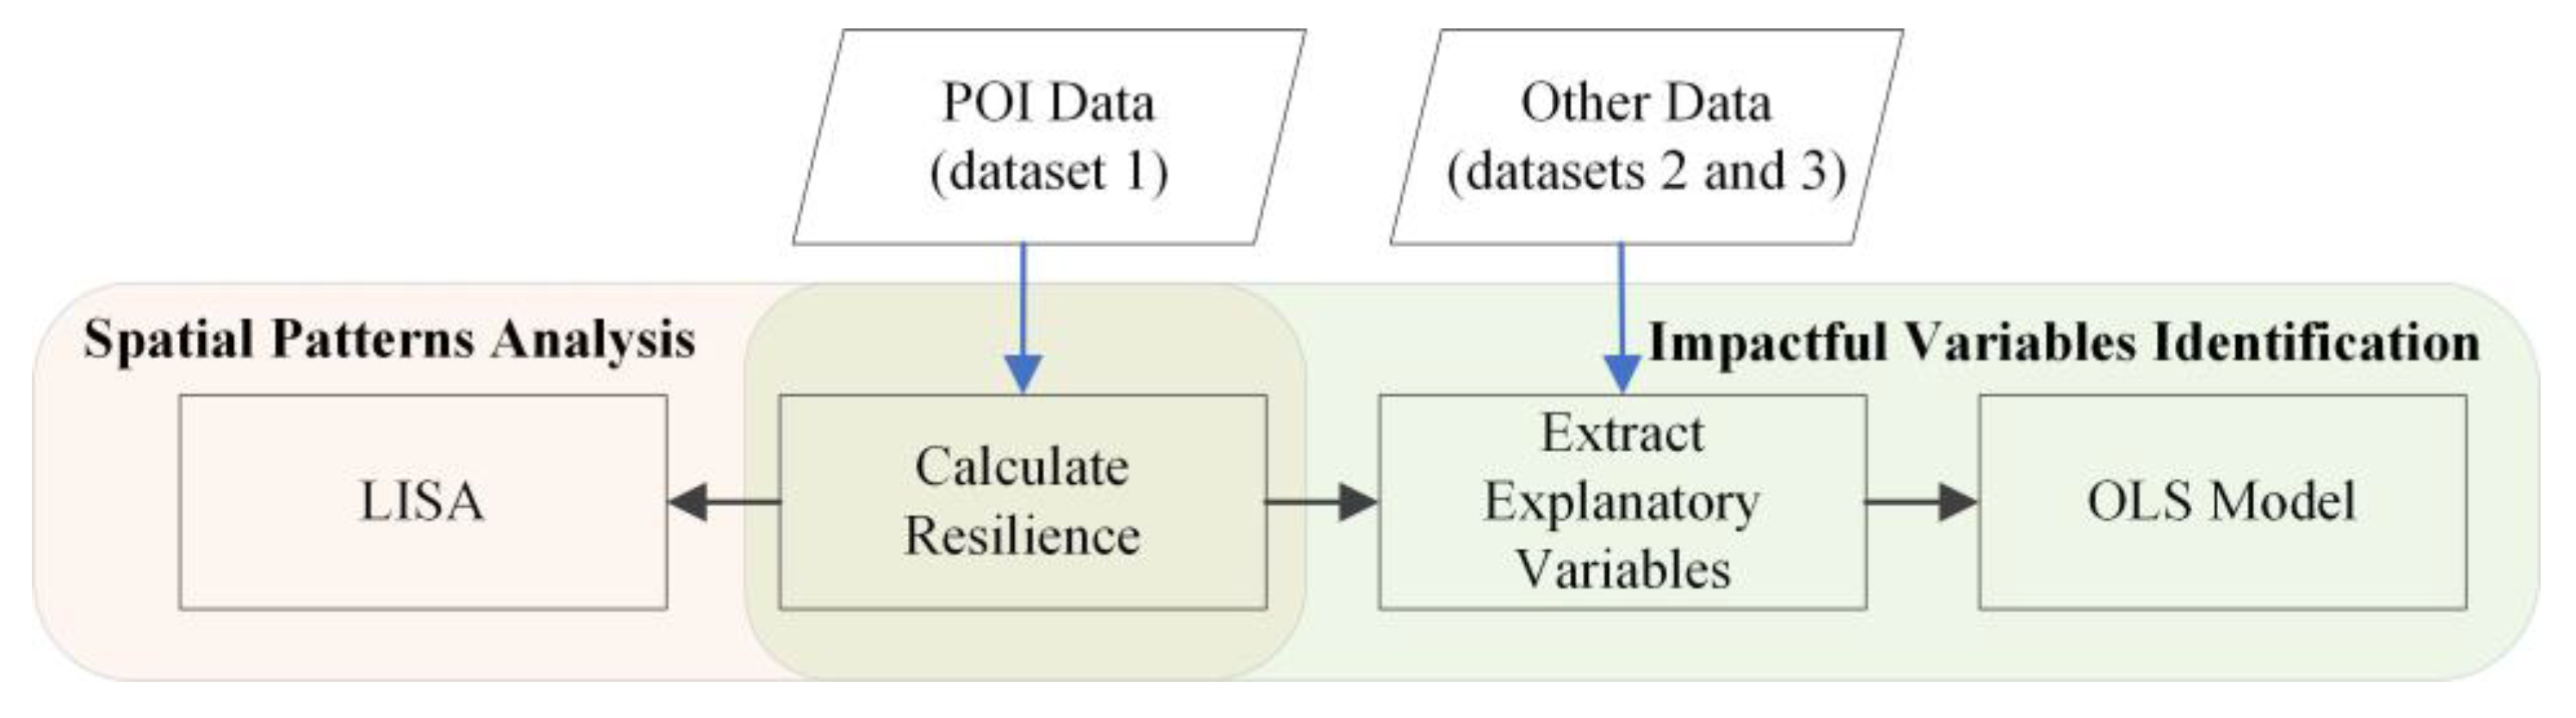
3.3. Analysis and Model Design

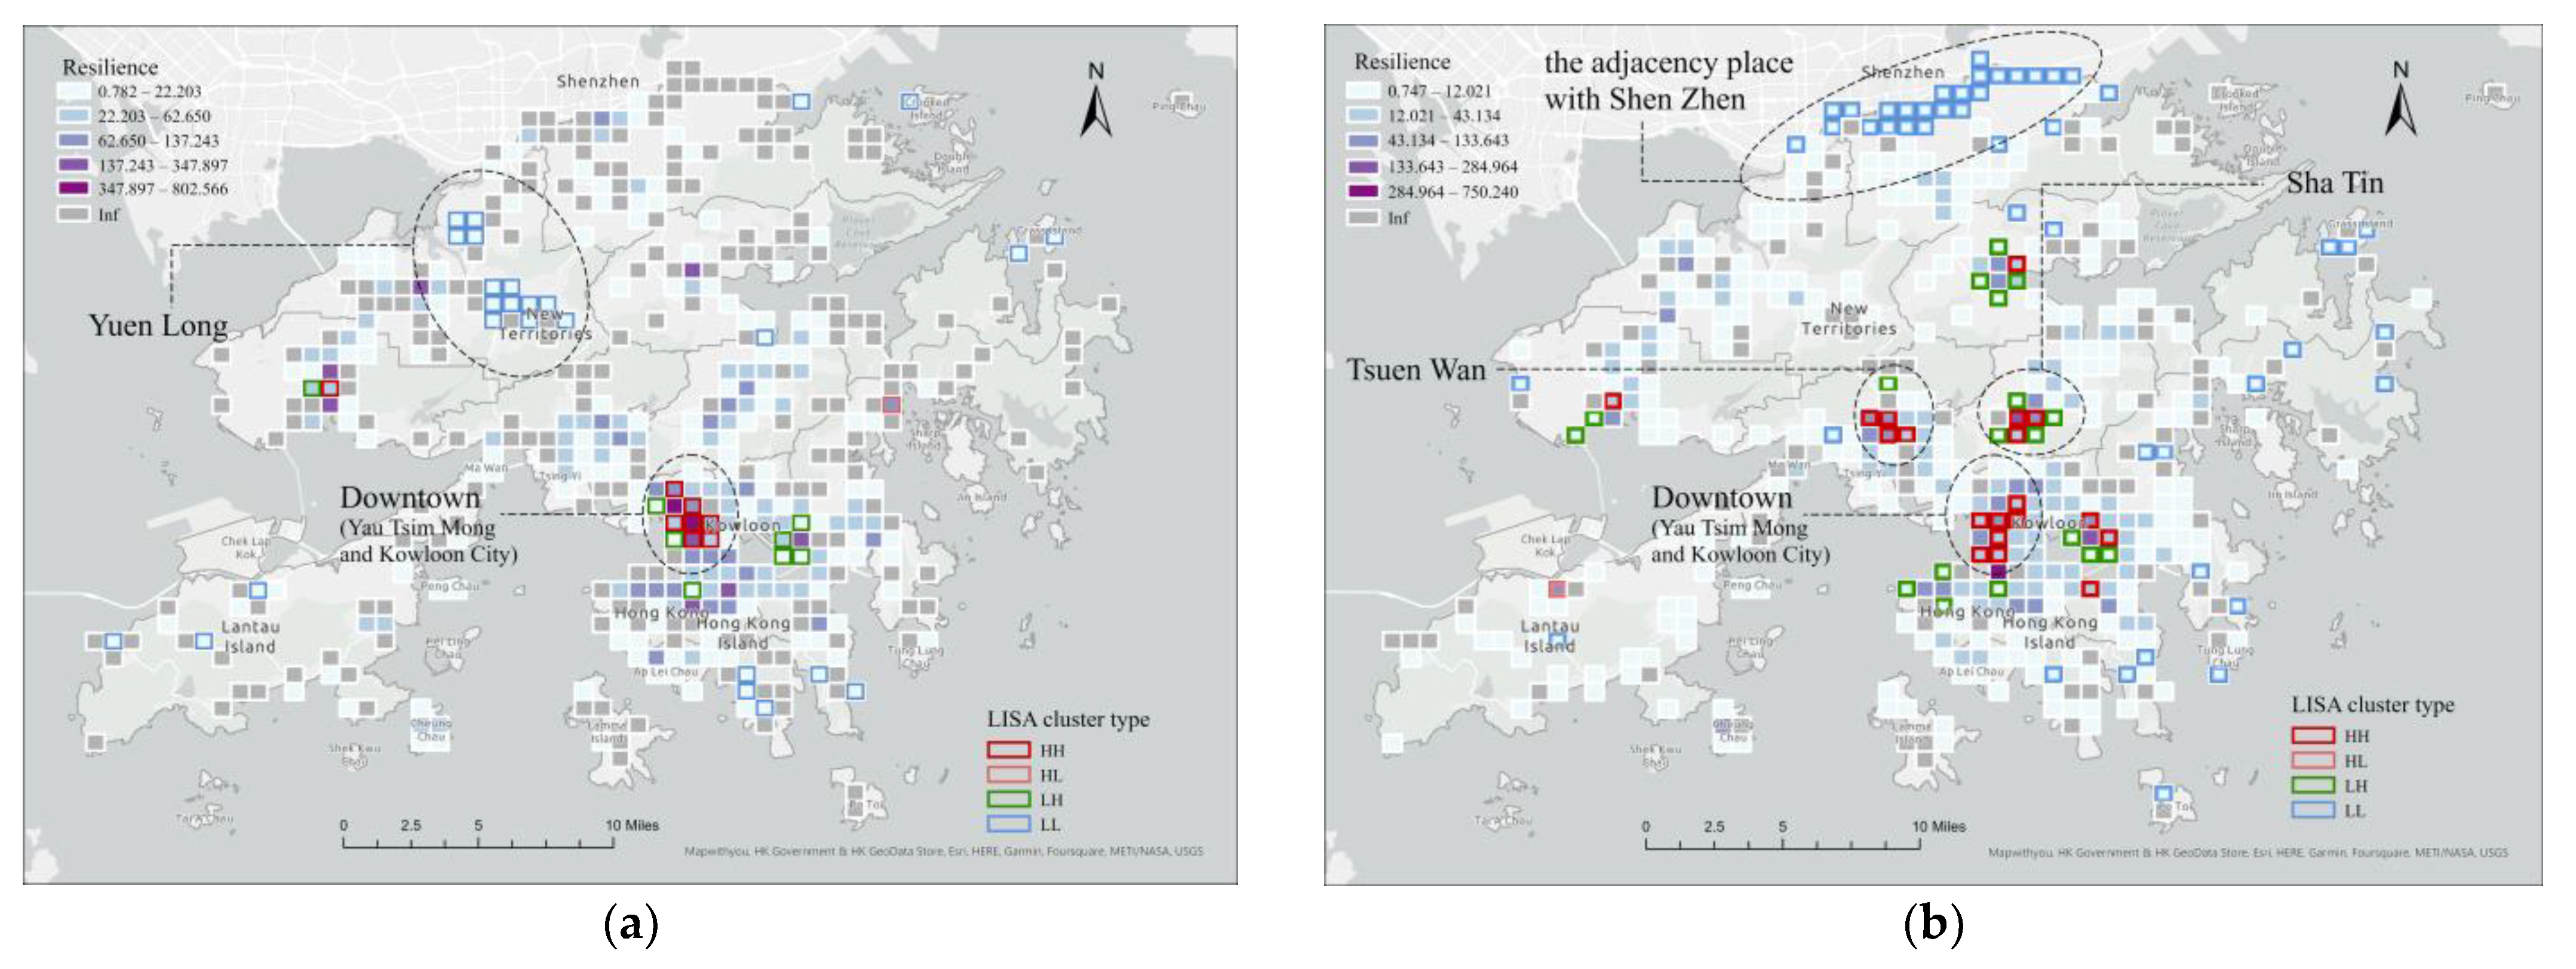
3.3.1. Local Indicators of Spatial Association

Anselin’s local Moran’s I is widely used in spatial analysis [56,57]. By visualizing the results conducted in ArcGIS, we examined restaurant resilience patterns as follows [58]:
I i = x i x ¯ σ 2 j = 1 , j i n [ w i j ( x j x ¯ ) ]
where x i is the value of variable x at location i; x ¯ is the average value of x with the sample number of n; x j is the value of variable x at all the other locations (where ji); σ 2 is the variance of variable x; and w i j is a weight matrix.
Spatial clusters appear when similar values surround the interest value, including patterns of high highs or low lows. Outliers are low values surrounded by high values in a space, and vice versa.

3.3.2. OLS-Based Linear Regression Model

Two OLS-based linear regression models were built to calculate the relationship between stability and all independent variables described above. The dependent variable adopted resilience in June 2020 (used in Model 1) and December 2020 (used in Model 2). The number of confirmed cases within each duration represented the severity of the outbreak. To distinguish the effect of the COVID-19 pandemic and others, several traditional location factors and population characteristics have been used as independent variables to express external determinants. Accessibility, the built environment, agglomeration effect, and other amenities were the main considered aspects. Population density and elder density were applied as confounding variables due to the high correlation with the infection rate.
Using the OLS approach, the error terms are assumed to be independent across the area of study and uncorrelated with the independent variables [59]. The expression with 15 dependent variables is shown below:
y = β 0 + i = 1,2 , , 15 β i x i + ε
where y is the resilience, β 0 is the intercept, β i represents the regression coefficients of x i , and ε is the random error.
A threshold of 5 was set for the variance inflation factor (VIF) to confirm multicollinearity. The Moran’s I of residuals was calculated to determine whether or not spatial autocorrelation could exist. The spatial variability test was conducted to determine if an advanced spatial regression model was required. An analysis of robustness was conducted 1000 times using bootstrapping.
The overall analysis process is shown below (Figure 3).

4. Results

We begin this section by giving descriptive statistics about how the amount changed. Using the index we proposed in the above section, we measure the resilience of the catering industry in Hong Kong in each grid. Additionally, the spatial distribution of the index is explored using LISA. Finally, OLS regression is used to identify impactful factors.

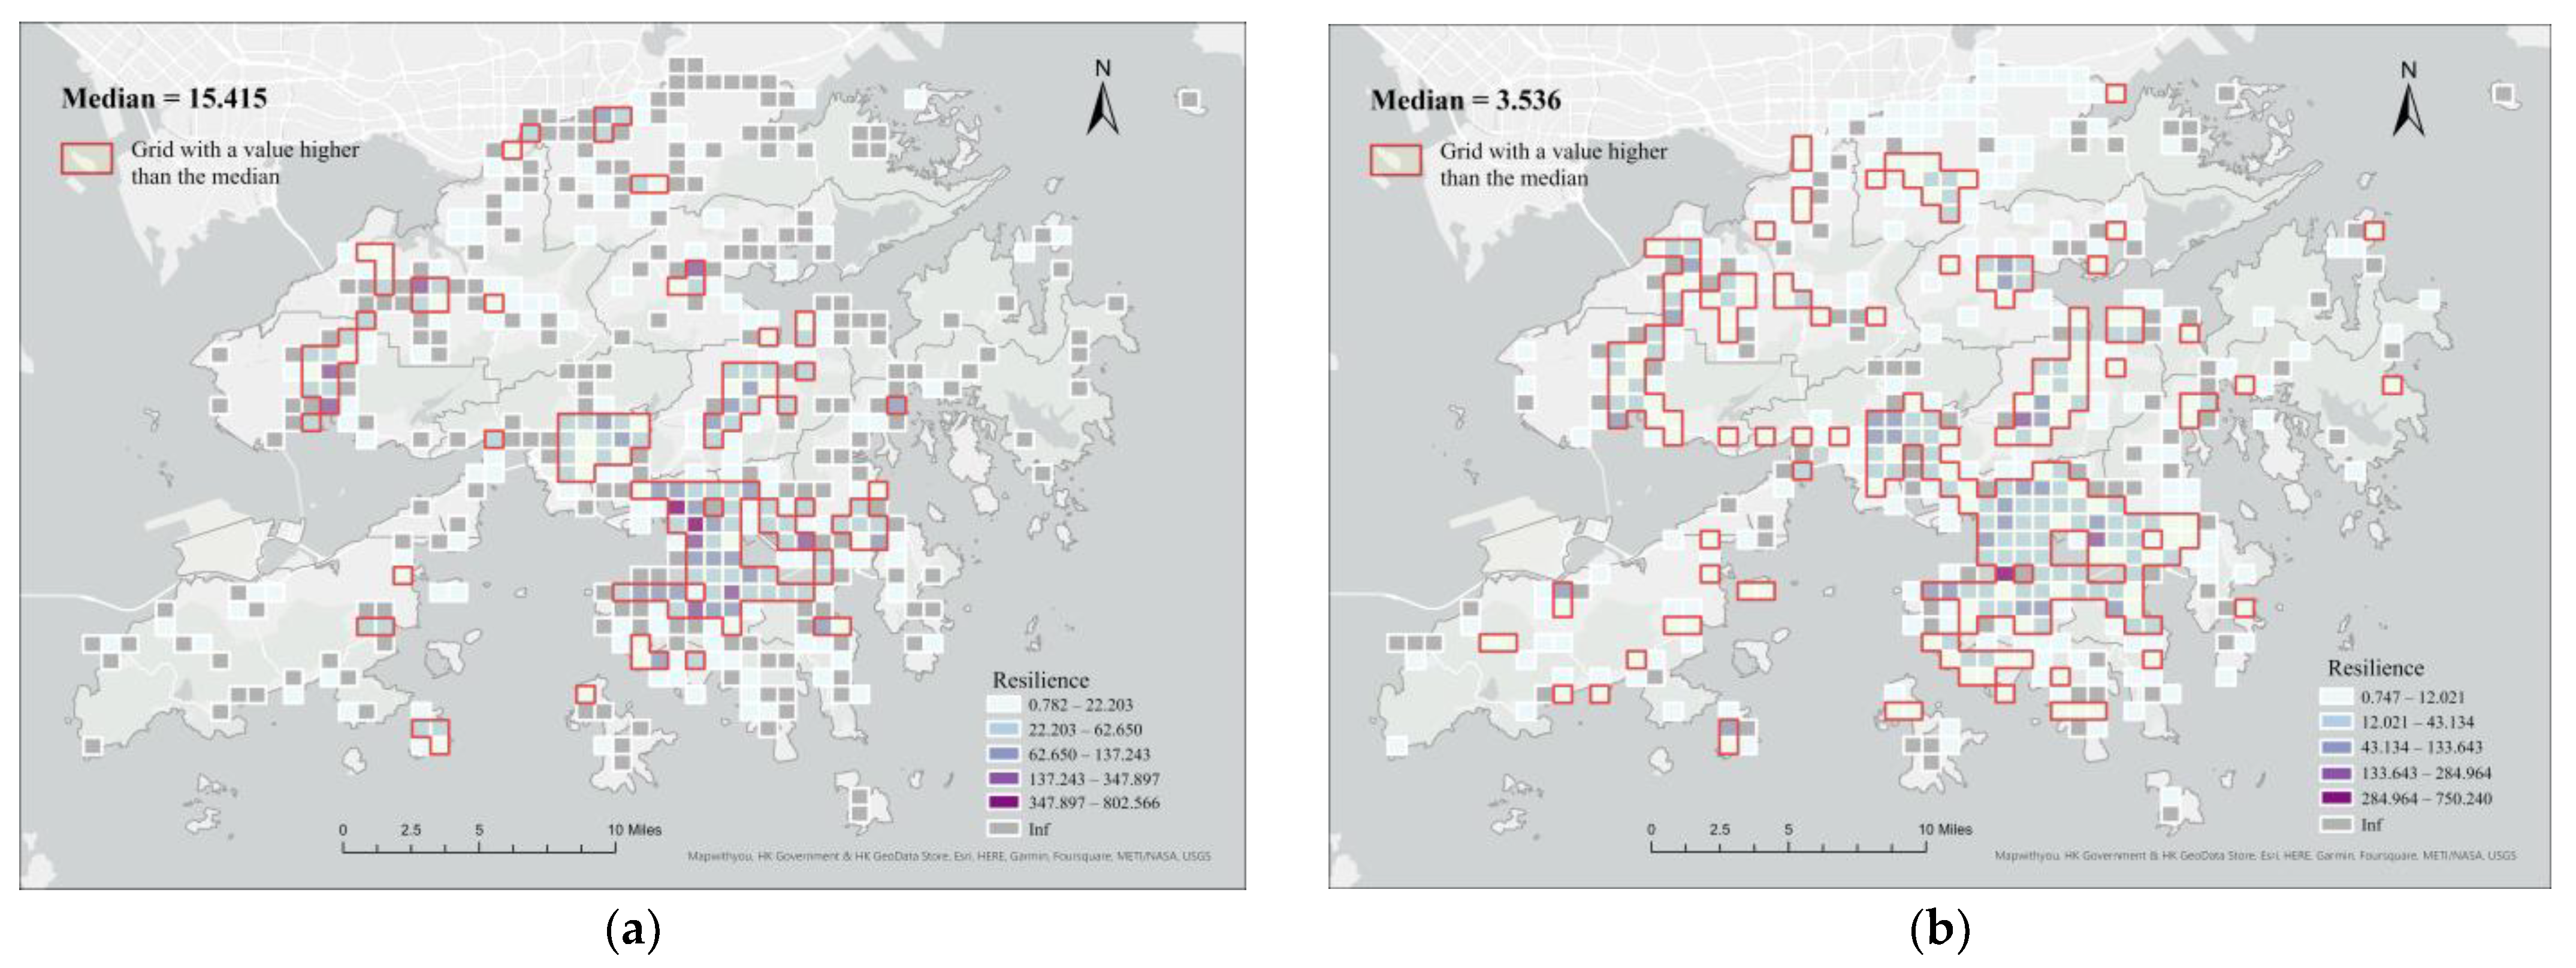
4.1. Spatial Patterns in Resilience

In terms of descriptive statistics, the POI number in December 2019 was used as the baseline. In June 2020, a slight fluctuation in this number was observed, and the change became more significant in December 2020 (Table 2). This is in accordance with official statistics showing that from 2019 to 2020, a markable decline in employment of over 14%, from 256,166 to 219,146, was observed, and sales also decreased from 141,779 to 114,293 [47].
We then visualized the index spatially (Figure 4). In June 2020, most analysis units equaled infinity, indicating high resilience generally. As the result of local Moran’s I, several high-high clusters (HH) were detected in the central area, Yau Tsim Mong and Kowloon City, while a low-low (LL) cluster was shown in Yuen Long, a comparatively new town area. In December 2020, the high-high (HH) cluster in the downtown area remained, together with two other smaller clusters in Tsuen Wan and Sha Tin. Inversely, a large low-low (LL) cluster emerged near the place adjacent to Shen Zhen, which is more likely to have been due to the long-term shutdown of ports. Plummeted customer flows, obviously, make business difficult to sustain. Comparing these two results, the high-high cluster in the central area was comparatively stable. However, a significant difference was identified around the port.
The distribution divided by the median (Figure 5) showed that the downtown and residential concentration areas (around Sha Tin and Tsuen Wan) tend to be more stable, indicating higher resilience. The areas gradually extended into the surrounding area, suggesting a relationship with land use type.

4.2. Results of Two Ordinary Least-Squares Regression Models

As abovementioned, if a unit whose number does not change reaches infinite stability, it does not import regression. A full model with all independent variables is then established. Population density, in which the VIF was greater than 5, was excluded due to the multicollinearity problem. All the other variables were normalized before being used in the final model. An adjusted R-squared value was adopted to evaluate the model’s performance. The spatial autocorrelation of the regression residuals was examined using Moran’s I.
Two OLS models that used resilience in June 2020 and December 2020 were fitted, respectively. Despite few variables being statistically significant, both of the two models showed a good capacity with the adjusted R-squared reaching 0.559 and 0.647. Moran’s I in both of the two models was insignificant, suggesting no spatial autocorrelation in the regression residuals. Although we attempted to fit the geographically weighted regression model (GWR model), the spatial variability test [60] showed it as insignificant, indicating ‘no necessity for use’. In this regard, the basic OLS model was kept as the final example. The coefficient results are summarized in Table 3. Most coefficients and correlations were kept the same during the two periods with few variables being inversed. The details are given below.
Of most concern is the COVID-19-related variable. Research has confirmed the positive relationship between the pandemic’s severity and business closure [22]. However, the results of this current study suggest that analysis, based specifically on a city view, would present ‘a different story’. After controlling other variables, the statistically negligible results indicated that there was no direct linear association between the number of cases and the resilience of restaurants. However, it is noteworthy to find a significantly negative impact of hospitals on the resilience of restaurants. One possible explanation from the customer flow aspect is that the visible aggregation of patients triggers anxiety and the fear of being infected. The perceived infection risks decrease people’s willingness to go close to such areas.
Meanwhile, the impact of land use on resilience is greatest as suggested by the highest coefficient, and the correlation is significantly positive. Usually, higher mixed land use means a more balanced community, with a diverse range of urban facilities. Geographic proximity helps people easily meet their basic needs without too many costs in such a community [61,62]. This result emphasizes the importance of balanced urban planning.
The BCR is the second factor of impact, and studies have confirmed the BCR as one of the essential spatial drivers of urban vitality [52,63]. A higher building coverage ratio indicates a higher possibility of commercially active interactions between the city and humans [64]. Restaurants are therefore more likely to be exposed to people and generate transactions, which is helpful for resilience.
The third influential variable is public residential areas. Public residential areas include subsidized and temporary housing created by the Hong Kong government. According to the Population Census in 2021 [65], about half of the citizens lived in public community areas the other half lived in private housing, with others living in rural buildings. Spatially, rural buildings are distributed in areas away from downtown areas. Regarding price, private dwellings usually cost much more than public housing does, and may play a role in distinguishing demographics to some degree, such as spending habits and income levels. Hence, only public residential areas showed a positive relationship with restaurant resilience.
In line with the traditional theory that the agglomeration of commercial facilities benefits the survival of businesses [31,66], shopping malls and markets were seen to be positively associated with the resilience of restaurants. With the coefficient staying the same in both models, the significance, however, increased in the latter case, elucidating strong reliability. Nevertheless, the commercial area was insignificant in both models. The possible reason may be the following: restaurants may attract more visitors by aggregating with other commercial facilities and benefit from increased interest in those facilities that already exist [45]. However, the interest in visiting commercial areas exhibited variability during the pandemic [67]. Some areas had more visitors while others did not, resulting in the aggregation effect only working in a specific way. Therefore, it caused shopping malls, markets, and commercial areas to show a difference effect.
Another interesting finding is that the positive effect of metro stations in the first half-year did not remain so for the full year. This finding can be supported by research into significant MTR travel volume reductions in Hong Kong [68]. The advantage of being near the transport center appeared to have disappeared. Additionally, road density was never significant. The result indicated that the importance of accessibility appeared to have been significantly undermined during the COVID-19 period. This is possibly related to peoples’ altered travel preferences and fear of catching the virus [69]. A worldwide reduction in public transit ‘ridership’ was observed, together with a shift from public transport to private car-based/bicycle-based commuting [70,71]. Such changes weakened traditional location factor efficacy regarding the fostering of business.

5. Discussion

In this study, we claim there is a possibility to qualify an industry’s resilience from a city view based on POI data.
Regarding research question 1, measuring industry resilience from a city view, a systematic review of the resilience theory is presented to confirm the major implications of the pandemic. Incorporating these characteristics, an index is proposed to qualify the industry’s resilience from a city perspective, contributing to theoretical development. The mathematical form of the index’ origin from the coefficient of variation has already been applied in biology to measure community stability. This study further extends the application fields to geography.
By applying the index in the catering industry in Hong Kong, we found that in the first half-year after the outbreak, most areas were quite stable (infinite), and the overall number of restaurants even slightly increased. The is similar to the situation found in Toronto [6]. The trend is in line with official statistics on restaurants with licenses [72]; however, the presented dataset contains more and illustrates a faster response to changes. Regarding the case in Hong Kong, it can be assumed that the almost continuous fall in rental indices from the end of 2019 may have boosted restaurant openings in the first half of 2020 [73]. However, with the crisis ongoing, the obvious decrease in the total number of restaurants implied that the negative impact of COVID-19 outweighed the benefits by the end of 2020.
Regarding research question 2, the exploration of the resilience spatial distribution patterns, similarly to the way that the catering industry distribution obeyed the traditional central place theory [74], a trend was also identified regarding resilience distribution, with the highest clusters being comparatively stable in the downtown area, where there were smaller clusters around, and with low-low clusters being near the city’s periphery. Such distribution characteristics may partly relate to the self-attributes of restaurants. The central area may have more high-end or corporate-owned dining restaurants, which may have had the benefit of resilience in the form of multiple resources [37]. The low-low clusters in areas bordering mainland China indicated that business was highly dependent on cross-boundary passenger traffic. In general, the spatial distribution of resilience was consistent in two of the investigated periods (June 2020 and December 2020). The differences, between the two distributions, showed a expandingtrend in changes, from central to surrounding areas. Some slight changes first occurred in local central areas, which are residential- or business-based, but hardly any change in the urban fringe area occurred. A further look at the end of 2020 showed that the change in the observed area had gradually expanded. The result indicates that the central area may be more sensitive and also capable of fast renovations.
With regard to research question 3, identifying possible influential factors, although a study confirmed that the number of confirmed cases corresponds to the failure of restaurants [22], our result indicates that it did not ruin restaurants’ resilience in the spatial structure. The city showed its resilience in fighting the pandemic. In fact, the fostering of ‘Two-dish meal-boxes’ could be seen as a reflection of the adaptability of the catering industry. The popularity of affordable prices and the takeaway dining style remained during the pandemic. A few restaurant owners even transformed their own business to specialize in operating ‘Two-dish mealboxes’ [75]. From a city’s historical view, rapid transformation may relate to the local background. A previous study claimed that the community responded even faster than the government did in the face of COVID-19 [76,77]. The painful cost of SARS in 2003 is a collective experience and memory of the disaster for local citizens in Hong Kong. On the other hand, the government distributed the first round of anti-epidemic fund targets among catering business, which could somewhat relieve the financial pressure. Nevertheless, restaurants near hospitals were affected.
Generally, the positive impact of traditional location factors was indicated via previous studies. One exception is that the MTR station density did not work when the measuring range was expanded to the full year of 2020. A possible explanation is that people’s travel behavior was reshaped after experiencing four surge outbreaks, as other studies found [69], weaking the effect of accessibility.
Lastly, concerning the modifiable areal unit problem (MAUP), we conducted the same regression with a resolution of 500 m × 500 m to confirm the resulting robustness (see Table S1). The main regression result was in line with the 1 km grid, except more other factors became significant on a finer scale. Additionally, the coefficients showed good robustness in the 1000-run bootstrap test (see Tables S2 and S3).
Still, this study has limitations. Firstly, when applying the index, there are two specific situations that need to be considered. Briefly, 0.1 was added to the denominator of the current method in order to avoid zeros, which can occur when an analysis unit has previously contained POIs but no longer does during the latter time point. The second scenario is that if nothing changed in the grid during the examination period, the index of that grid would reached infinity and be excluded from regression, which may have caused a bias. A more elegant mathematical form is needed to address the problem. Furthermore, even though spatial heterogeneity is already tested in the current models, information such as restaurant attributes is lacking, so some of these may be overlooked. Lastly, the model examines only the linear relationship, so a more complex model is needed to explore any underlying connection that may possibly exist.

6. Conclusions

Resilience is multi-dimensional concept and can be interpreted from different views. Despite the many studies that have been conducted to investigate business status after the shock of COVID-19, this research places emphases on individual business entities. This study aims to overcome the lack of exploration concerning how a business withstands crises from a macro-view, which can give a global and spatial insight.
By applying the resilience index to this study based on the catering industry of Hong Kong, our result shows that the local central area, regardless of whether it was residential- or business- based, was more resilient. The confirmed cases did not destroy the spatial distribution of the industry unlike what people’s intuition suggests. Instead, COVID-19-related features such as hospitals had a negative impact on resilience while urbanization, accessibility, and aggregation effects in commercial areas have positive effects in stabilizing resilience. MTR station density in such circumstances lost some efficacy perhaps due to MTR avoidance behavior.
In light of these understandings, urban planners and policy makers should pay special attention to the recovery of businesses in strategic locations. Whether or not the advantages exist depends on whether or not people change their travel habits permanently after a pandemic ends, which takes time to observe. Furthermore, suburban areas need special attention to prevent an exacerbation of social inequality in the post-pandemic era.

Supplementary Materials

The following supporting information can be downloaded at https://www.mdpi.com/article/10.3390/ijgi12110443/s1. Table S1: Result of two regression models in within 500 m × 500 m. Table S2: Robustness test results for two regression models within 1 km × 1 km using the bootstrap percentile method. Table S3: Robustness test results for two regression models within 500 m × 500 m using the bootstrap percentile method.

Author Contributions

Conceptualization, Yijia Liu and Anshu Zhang; methodology, Yijia Liu; formal analysis, Yijia Liu; writing—original draft preparation, Yijia Liu; writing—review and editing, Yijia Liu, Yue Yu and Linya Peng; visualization, Yijia Liu and Linya Peng; supervision, Wenzhong Shi; project administration, Wenzhong Shi; funding acquisition, Wenzhong Shi. All authors have read and agreed to the published version of the manuscript.

Funding

This research was funded by The Hong Kong Research Grants Council [C5079-21G] and the Hong Kong Polytechnic University (Otto Poon Charitable Foundation Smart Cities Research Institute Work Program [CD03].

Data Availability Statement

Not applicable.

Conflicts of Interest

The authors declare no conflict of interest.

References

  1. Yelp. Yelp: Local Economic Impact Report; Yelp: San Francisco, CA, USA, 2020; Available online: https://www.yelpeconomicaverage.com/business-closures-update-sep-2020 (accessed on 29 May 2023).
  2. Wang, X.; Zhao, F.; Tian, X.; Min, S.; von Cramon-Taubadel, S.; Huang, J.; Fan, S. How Online Food Delivery Platforms Contributed to the Resilience of the Urban Food System in China during the COVID-19 Pandemic. Glob. Food Sec. 2022, 35, 100658. [Google Scholar] [CrossRef] [PubMed]
  3. Li, B.; Zhong, Y.Y.; Zhang, T.; Hua, N. Transcending the COVID-19 Crisis: Business Resilience and Innovation of the Restaurant Industry in China. J. Hosp. Tour. Manag. 2021, 49, 44–53. [Google Scholar] [CrossRef]
  4. National Restaurant Association. 100,000 Restaurants Closed Six Months into Pandemic; National Restaurant Association: Washington, DC, USA, 2020; Available online: https://restaurant.org/research-and-media/media/press-releases/100,000-restaurants-closed-six-months-into-pandemic/ (accessed on 29 May 2021).
  5. Meituan Research Institute. The Impact of the COVID-19 on China’s Catering Industry: Research from 32,000 Questionnaires; Meituan Research Institute: Beijing, China, 2020; Available online: https://mri.meituan.com/research/report (accessed on 31 May 2020).
  6. Li, Y.; Sungur, E.; Jimenez, A.; Brail, S. Covid-19, Urban Economic Resilience and the Pandemic Pivot: Toronto’s Restaurant Scene. Reg. Stud. Reg. Sci. 2022, 9, 1–4. [Google Scholar] [CrossRef]
  7. Evening Standard. Domino’s Pizza ‘to Open 200 New Stores and Create 7,000 Jobs’ after Recording Busiest Ever Week in 2020; Evening Standard: London, UK, March 2021; Available online: https://www.standard.co.uk/business/dominos-pizza-group-expansion-stores-jobs-b923008.html (accessed on 2 May 2021).
  8. Chipotle Mexican Grill. Chipotle Announces Fourth Quarter And Full Year 2020 Results; Chipotle Mexican Grill: Newport Beach, CA, USA, 2021. [Google Scholar]
  9. QSR. How COVID-19 Made Starbucks a Stronger Restaurant Chain. QSR, 28 July 2021. Available online: https://www.qsrmagazine.com/fast-food/how-covid-19-made-starbucks-stronger-restaurant-chain(accessed on 29 May 2023).
  10. Business Wire. Papa John’s Announces Fourth Quarter and Full Year 2021 Financial Results; Business Wire: San Francisco, CA, USA, 2022. [Google Scholar]
  11. Zhang, N.; Jia, W.; Lei, H.; Wang, P.; Zhao, P.; Guo, Y.; Dung, C.H.; Bu, Z.; Xue, P.; Xie, J.; et al. Effects of Human Behavior Changes during the Coronavirus Disease 2019 (COVID-19) Pandemic on Influenza Spread in Hong Kong. Clin. Infect. Dis. 2021, 73, E1142–E1150. [Google Scholar] [CrossRef] [PubMed]
  12. Nanda, A.; Xu, Y.; Zhang, F. How Would the COVID-19 Pandemic Reshape Retail Real Estate and High Streets through Acceleration of E-Commerce and Digitalization? J. Urban Manag. 2021, 10, 110–124. [Google Scholar] [CrossRef]
  13. Ludin, D.; Holler, M.; Wellbrock, W.; Mueller, E. How COVID-19 Accelerates Business Model Innovation and Digital Technological Transformation in the Hospitality Industry: A Focus on Restaurants in Baden-Wuerttemberg. Int. J. Innov. Technol. Manag. 2022, 19, 2242002. [Google Scholar] [CrossRef]
  14. Ferreira, D.; Carmo, R.M.; Vale, M. Is the COVID-19 Pandemic Accelerating the Platformisation of the Urban Economy? Area 2022, 54, 443–450. [Google Scholar] [CrossRef] [PubMed]
  15. Albuquerque, H.; Ramazanova, M.; Borges, I.; Silva, F.M.; Marques, J. Analysis of the Consumer Behaviour Regarding the Use of Online Food Delivery Apps During Covid-19 Sanitary Restrictions in Portugal. In Smart Innovation, Systems and Technologies; Springer Science and Business Media Deutschland GmbH: Berlin, Germany, 2022; Volume 284, pp. 385–396. [Google Scholar] [CrossRef]
  16. Li, C.; Mirosa, M.; Bremer, P. Review of Online Food Delivery Platforms and Their Impacts on Sustainability. Sustainability 2020, 12, 5528. [Google Scholar] [CrossRef]
  17. Liang, X.; Andris, C. Measuring McCities: Landscapes of Chain and Independent Restaurants in the United States. Environ. Plan. B Urban Anal. City Sci. 2022, 49, 585–602. [Google Scholar] [CrossRef]
  18. Arribas-Bel, D.; Bakens, J. Use and Validation of Location-Based Services in Urban Research: An Example with Dutch Restaurants. Urban Stud. 2019, 56, 868–884. [Google Scholar] [CrossRef]
  19. Zhai, W.; Yue, H. Economic Resilience during COVID-19: An Insight from Permanent Business Closures. Environ. Plan. A 2022, 54, 219–221. [Google Scholar] [CrossRef]
  20. Huang, X.; Bao, X.; Li, Z.; Zhang, S.; Zhao, B. Black Businesses Matter: A Longitudinal Study of Black-Owned Restaurants in the COVID-19 Pandemic Using Geospatial Big Data. Ann. Am. Assoc. Geogr. 2023, 113, 189–205. [Google Scholar] [CrossRef]
  21. Motoyama, Y. Is COVID-19 Causing More Business Closures in Poor and Minority Neighborhoods? Econ. Dev. Q. 2022, 36, 124–133. [Google Scholar] [CrossRef] [PubMed]
  22. Li, H.; Stoler, J. COVID-19 and Urban Futures: Impacts on Business Closures in Miami-Dade County. Ann. Am. Assoc. Geogr. 2022, 113, 834–856. [Google Scholar] [CrossRef]
  23. Wang, S.; Wang, R.; Huang, X.; Li, Z.; Bao, S. A GIS-Based Analytical Framework for Evaluating the Effect of COVID-19 on the Restaurant Industry with Big Data. Big Earth Data 2023, 7, 47–68. [Google Scholar] [CrossRef]
  24. Mehmood, A. Of Resilient Places: Planning for Urban Resilience. Eur. Plan. Stud. 2016, 24, 407–419. [Google Scholar] [CrossRef]
  25. Barata-Salgueiro, T.; Erkip, F. Retail Planning and Urban Resilience-An Introduction to the Special Issue. Cities 2014, 36, 107–111. [Google Scholar] [CrossRef]
  26. Gunderson, L. Comparing Ecological and Human Community Resilience. 2009. Available online: https://merid.org/wp-content/uploads/2019/09/Comparing-Ecological-and-Human-Community-Resilience.pdf (accessed on 20 July 2021).
  27. Holling, C.S. Resilience and Stability of Ecological System. Annu. Rev. Ecol. Syst. 1973, 4, 1–23. [Google Scholar] [CrossRef]
  28. Davoudi, S.; Brooks, E.; Mehmood, A. Evolutionary Resilience and Strategies for Climate Adaptation. Plan. Pract. Res. 2013, 28, 307–322. [Google Scholar] [CrossRef]
  29. De Freitas, R.S.G.; Stedefeldt, E. COVID-19 Pandemic Underlines the Need to Build Resilience in Commercial Restaurants’ Food Safety. Food Res. Int. 2020, 136, 109472. [Google Scholar] [CrossRef]
  30. Karniouchina, K.; Sarangee, K.; Theokary, C.; Kübler, R. The Impact of the COVID-19 Pandemic on Restaurant Resilience: Lessons, Generalizations, and Ideas for Future Research. Serv. Sci. 2022, 14, 121–138. [Google Scholar] [CrossRef]
  31. Jun, B.; Jara-Figueroa, C.; Yu, D. The Economic Resilience of a City: The Effect of Relatedness on the Survival of Amenity Shops during the COVID-19 Pandemic. Camb. J. Reg. Econ. Soc. 2022, 15, 551–573. [Google Scholar] [CrossRef]
  32. Lee, J.H.; Choi, H.M. Sustainable Restaurant Franchising: Franchisor Social Support for Franchisee Resilience and Intention to Retain Business during the COVID-19 Pandemic. J. Hosp. Tour. Manag. 2023, 54, 415–425. [Google Scholar] [CrossRef]
  33. Headd, B. Redefining Business Success Distinguishing Between Closure and Failure. Small Bus. Econ. 2003, 21, 51–61. [Google Scholar] [CrossRef]
  34. Madeira, A.; Palrão, T.; Mendes, A.S. The Impact of Pandemic Crisis on the Restaurant Business. Sustainability 2021, 13, 40. [Google Scholar] [CrossRef]
  35. Messabia, N.; Fomi, P.R.; Kooli, C. Managing Restaurants during the COVID-19 Crisis: Innovating to Survive and Prosper. J. Innov. Knowl. 2022, 7, 100234. [Google Scholar] [CrossRef]
  36. Arslan, A.; Kamara, S.; Zahoor, N.; Rani, P.; Khan, Z. Survival Strategies Adopted by Microbusinesses during COVID-19: An Exploration of Ethnic Minority Restaurants in Northern Finland. Int. J. Entrep. Behav. Res. 2022, 28, 448–465. [Google Scholar] [CrossRef]
  37. Neise, T.; Verfürth, P.; Franz, M. Rapid Responding to the COVID-19 Crisis: Assessing the Resilience in the German Restaurant and Bar Industry. Int J Hosp Manag 2021, 96, 102960. [Google Scholar] [CrossRef]
  38. Liu, W.; Choi, T.-M.; Niu, X.; Zhang, M.; Fan, W.; Member, S. Determinants of Business Resilience in the Restaurant Industry During the COVID-19 Pandemic: A Textual Analytics Study on an O2O Platform Case. IEEE Trans. Eng. Manag. 2022, 1–14. [Google Scholar] [CrossRef]
  39. Türkeș, M.C.; Stăncioiu, A.F.; Băltescu, C.A.; Marinescu, R.C. Resilience Innovations and the Use of Food Order & Delivery Platforms by the Romanian Restaurants during the Covid-19 Pandemic. J. Theor. Appl. Electron. Commer. Res. 2021, 16, 3218–3247. [Google Scholar] [CrossRef]
  40. Kim, D.; Yun, J.; Kim, K.; Lee, S. A Comparative Study of the Robustness and Resilience of Retail Areas in Seoul, Korea before and after the Covid-19 Outbreak, Using Big Data. Sustainability 2021, 13, 3302. [Google Scholar] [CrossRef]
  41. Podesta, C.; Coleman, N.; Esmalian, A.; Yuan, F.; Mostafavi, A. Quantifying Community Resilience Based on Fluctuations in Visits to Points-of-Interest Derived from Digital Trace Data. J. R. Soc. Interface 2021, 18, 20210158. [Google Scholar] [CrossRef] [PubMed]
  42. Wang, B.; Williams, M.; Duarte, F.; Zheng, S. Demand for Social Interactions: Evidence from the Restaurant Industry during the COVID-19 Pandemic. J. Reg. Sci. 2022, 62, 830–857. [Google Scholar] [CrossRef]
  43. Waldfogel, J. The Median Voter and the Median Consumer: Local Private Goods and Population Composition. J. Urban Econ. 2008, 63, 567–582. [Google Scholar] [CrossRef]
  44. Dong, L.; Ratti, C.; Zheng, S. Predicting Neighborhoods’ Socioeconomic Attributes Using Restaurant Data. Proc. Natl. Acad. Sci. USA 2019, 116, 15447–15452. [Google Scholar] [CrossRef] [PubMed]
  45. Wu, M.; Pei, T.; Wang, W.; Guo, S.; Song, C.; Chen, J.; Zhou, C. Roles of Locational Factors in the Rise and Fall of Restaurants: A Case Study of Beijing with POI Data. Cities 2021, 113, 103185. [Google Scholar] [CrossRef]
  46. Census Statistics Department of Hong Kong Government. Gross Domestic Product (GDP) by Economic Activity at Current Prices; Census Statistics Department of Hong Kong Government: Hong Kong, China. Available online: https://www.censtatd.gov.hk/en/web_table.html?id=310-34101 (accessed on 20 May 2023).
  47. Census Statistics Department of Hong Kong Government. Principal Statistics for All Establishments by Industry Grouping (Accommodation and Food Services Sector); Census Statistics Department, Hong Kong Government: Hong Kong, China. Available online: https://www.censtatd.gov.hk/en/web_table.html?id=625-76101 (accessed on 31 March 2023).
  48. Sousa, E.D.; Forsyth, A.; Grant, R.A.; Koepp, J.; Oakes, J.M.; Schmitz, K.H.; Zimmerman, J.; Rodriguez, D.; Song, Y. Twin Cities Walking Study Environment and Physical Activity: GIS Protocols; University of Minnesota: Minneapolis, MN, USA, 2005; Available online: http://www.designcenter.umn.eduForsyth@umn.edu (accessed on 10 December 2022).
  49. Dadras, O.; SeyedAlinaghi, S.A.; Karimi, A.; Shamsabadi, A.; Qaderi, K.; Ramezani, M.; Mirghaderi, S.P.; Mahdiabadi, S.; Vahedi, F.; Saeidi, S.; et al. COVID-19 Mortality and Its Predictors in the Elderly: A Systematic Review. In Health Science Reports; John Wiley and Sons Inc.: Hoboken, NJ, USA, 2022. [Google Scholar] [CrossRef]
  50. World Health Organization. Modes of Transmission of Virus Causing COVID-19: Implications for IPC Precaution Recommendations; World Health Organization: Geneva, Switzerland, 2020; Available online: https://www.who.int/news-room/commentaries/detail/modes-of-transmission-of-virus-causing-covid-19-implications-for-ipc-precaution-recommendations (accessed on 4 March 2022).
  51. Le, Q.H.; Shin, H.; Kwon, N.; Ho, J.; Ahn, Y. Deep Learning Based Urban Building Coverage Ratio Estimation Focusing on Rapid Urbanization Areas. Appl. Sci. 2022, 12, 11428. [Google Scholar] [CrossRef]
  52. Lin, J.; Zhuang, Y.; Zhao, Y.; Li, H.; He, X.; Lu, S. Measuring the Non-Linear Relationship between Three-Dimensional Built Environment and Urban Vitality Based on a Random Forest Model. Int. J. Environ. Res. Public Health 2023, 20, 734. [Google Scholar] [CrossRef]
  53. Zhang, A.; Shi, W.; Tong, C.; Zhu, X.; Liu, Y.; Liu, Z.; Yao, Y.; Shi, Z. The Fine-Scale Associations between Socioeconomic Status, Density, Functionality, and Spread of COVID-19 within a High-Density City. BMC Infect. Dis. 2022, 22, 274. [Google Scholar] [CrossRef]
  54. Lehman, C.L.; Tilman, D. Biodiversity, Stability, and Productivity in Competitive Communities. Am. Nat. 2000, 156, 534–552. [Google Scholar] [CrossRef]
  55. Spellerberg, I.F.; Fedor, P.J. A Tribute to Claude-Shannon (1916–2001) and a Plea for More Rigorous Use of Species Richness, Species Diversity and the “Shannon-Wiener” Index. Glob. Ecol. Biogeogr. 2003, 12, 177–179. [Google Scholar] [CrossRef]
  56. Su, S.; Jiang, Z.; Zhang, Q.; Zhang, Y. Transformation of Agricultural Landscapes under Rapid Urbanization: A Threat to Sustainability in Hang-Jia-Hu Region, China. Appl. Geogr. 2011, 31, 439–449. [Google Scholar] [CrossRef]
  57. Zhang, C.; Luo, L.; Xu, W.; Ledwith, V. Use of Local Moran’s I and GIS to Identify Pollution Hotspots of Pb in Urban Soils of Galway, Ireland. Sci. Total Environ. 2008, 398, 212–221. [Google Scholar] [CrossRef] [PubMed]
  58. Anselin, L. Local Indicators of Spatial Association—LISA. Geogr. Anal. 1995, 27, 93–115. [Google Scholar] [CrossRef]
  59. Yao, Y.; Shi, W.; Zhang, A.; Liu, Z.; Luo, S. Examining the Diffusion of Coronavirus Disease 2019 Cases in a Metropolis: A Space Syntax Approach. Int. J. Health Geogr. 2021, 20, 17. [Google Scholar] [CrossRef] [PubMed]
  60. Brunsdon, C.; Fotheringham, S.; Charlton, M. Geographically Weighted RegressionÐmodelling Spatial Non-Stationarity. J. R. Stat. Soc. Ser. D (Stat.) 1998, 47, 431–443. [Google Scholar]
  61. Frank, L.D.; Engelke, P.O. The Built Environment and Human Activity Patterns The Built Environment and Human Activity Patterns: Exploring the Impacts of Urban Form on Public Health. J. Plan. Lit. 2001, 16, 202–218. [Google Scholar] [CrossRef]
  62. Cervero, R. Mixed Land-Uses and Commuting: Evidence from the American Housing Survey. Trunspn. Res. A 1996, 30, 361–377. [Google Scholar] [CrossRef]
  63. Xiao, L.; Lo, S.; Liu, J.; Zhou, J.; Li, Q. Nonlinear and Synergistic Effects of TOD on Urban Vibrancy: Applying Local Explanations for Gradient Boosting Decision Tree. Sustain. Cities Soc. 2021, 72, 103063. [Google Scholar] [CrossRef]
  64. Ren, Z.; Jiang, B.; Seipel, S. Capturing and Characterizing Human Activities Using Building Locations in America. ISPRS Int. J. Geo-Inf. 2019, 8, 200. [Google Scholar] [CrossRef]
  65. Hong Kong Government. Hong Kong Population Census in 2021; Hong Kong Government: Hong Kong, China. Available online: https://www.census2021.gov.hk/en/index.html (accessed on 31 May 2023).
  66. Garavito Hernández, Y.; Francisco, J.; Galvis, R.; William, J.; Capacho, V. Business Survival, a Literary Review of Internal and External Determinants. Criterio Libre 2021, 18, 261–279. [Google Scholar] [CrossRef]
  67. Eom, S.; Nishihori, Y. Investigation on Visiting Pattern Change in Commercial Areas during Covid-19: A Case Study of 21 Cities in Japan. In ISPRS Annals of the Photogrammetry, Remote Sensing and Spatial Information Sciences; Copernicus GmbH: Göttingen, Germany, 2022; Volume 5, pp. 41–48. [Google Scholar] [CrossRef]
  68. Zhang, N.; Jia, W.; Wang, P.; Dung, C.H.; Zhao, P.; Leung, K.; Su, B.; Cheng, R.; Li, Y. Changes in Local Travel Behaviour before and during the COVID-19 Pandemic in Hong Kong. Cities 2021, 112, 103139. [Google Scholar] [CrossRef] [PubMed]
  69. Zhou, M.; Ma, H.; Wu, J.; Zhou, J. Metro Travel and Perceived COVID-19 Infection Risks: A Case Study of Hong Kong. Cities 2023, 137, 104307. [Google Scholar] [CrossRef] [PubMed]
  70. Harrington, D.M.; Hadjiconstantinou, M. Changes in Commuting Behaviours in Response to the COVID-19 Pandemic in the UK. J. Transp. Health 2022, 24, 101313. [Google Scholar] [CrossRef] [PubMed]
  71. Thomas, F.M.F.; Charlton, S.G.; Lewis, I.; Nandavar, S. Commuting before and after COVID-19. Transp. Res. Interdiscip. Perspect. 2021, 11, 101313. [Google Scholar] [CrossRef] [PubMed]
  72. Food and Environmental Hygiene Department in Hong Kong. Restaurant Licences. Available online: https://data.gov.hk/en-data/dataset/hk-fehd-fehdlmis-restaurant-licences (accessed on 13 June 2023).
  73. Rating and Valuation Department. Rental Indices For Hong Kong Property Market; Rating and Valuation Department of Hong Kong Government: Hong Kong, China. Available online: https://www.rvd.gov.hk/doc/en/statistics/graph1.pdf (accessed on 19 April 2023).
  74. Mulligan, G.F. Agglomeration-and-Central-Place-Theory-a-Review-of-the-Literature. Int. Reg. Sci. Rev. 1984, 9, 1–42. [Google Scholar] [CrossRef]
  75. Central News Agency. Due to the Epidemic Situation in Hong Kong, All Kinds of Flat-Priced Two-Meal Meals Are Popular. Economic Daily, 13 September 2022. Available online: https://money.udn.com/money/story/5603/6609110(accessed on 19 January 2023).
  76. Kwok, C.Y.T.; Wong, M.S.; Chan, K.L.; Kwan, M.P.; Nichol, J.E.; Liu, C.H.; Wong, J.Y.H.; Wai, A.K.C.; Chan, L.W.C.; Xu, Y.; et al. Spatial Analysis of the Impact of Urban Geometry and Socio-Demographic Characteristics on COVID-19, a Study in Hong Kong. Sci. Total Environ. 2021, 764, 144455. [Google Scholar] [CrossRef]
  77. Lau, B.H.P.; Chan, C.L.W.; Ng, S.M. Resilience of Hong Kong People in the COVID-19 Pandemic: Lessons Learned from a Survey at the Peak of the Pandemic in Spring 2020. Asia Pac. J. Soc. Work Dev. 2021, 31, 105–114. [Google Scholar] [CrossRef]
Figure 1. Distribution of restaurants in Hong Kong in (a) December 2019; (b) June 2020; (c) December 2020.
Ijgi 12 00443 g001
Figure 2. Analogy object from ecology to geography.
Ijgi 12 00443 g002
Figure 3. The overall analysis process.
Ijgi 12 00443 g003
Figure 4. The spatial distribution of the resilience of restaurants in Hong Kong in (a) June 2020; (b) December 2020.
Ijgi 12 00443 g004
Figure 5. The areas with a higher value of resilience than the median in (a) June 2020; (b) December 2020.
Ijgi 12 00443 g005
Table 1. Explanatory and response variables of the study.
VariablesDescriptionMeanStd. Dev.
Response variables
Resilience in June 2020
(for Model 1)
Calculated using POIs in December 2019 and June 2020,
abbreviated as ‘Resilience in June 2020’
36.881.0
Resilience in December 2020
(for Model 2)
Calculated using POIs in December 2019 and December 2020,
abbreviated as ‘Resilience in December 2020’
13.943.6
Explanatory variables
COVID-19
Case number
(only in Model 1)
The case number in the grid until 31 June 20210.971.25
Case number
(only in Model 2)
The case number in the grid until 31 December 202116.4018.09
Population characteristics
Population densityThe population density in the grid
(person/Km2)
27,448.4130,302.93
Elder densityDensity of elders in the grid (person/Km2)5227.106466.30
Urban built environment components
Accessibility
Road densityRoad density in km. per grid1.132.93
MTR station numberNumber of shopping malls per grid1.883.96
Land use characteristics
Land use indexEntropy-based land use mix index per grid0.720.17
Building coverage
ratio
BCR, building coverage area in km2. per grid0.160.10
Private residentialPrivate residential areas per grid0.080.11
Public residentialPublic residential areas per grid0.060.09
Rural settlementRural settlement areas per grid0.050.09
Agglomeration
Commercial areaCommercial areas per grid0.020.05
Shopping Mall numberNumber of shopping malls per grid0.760.87
Market numberNumber of markets per grid0.330.63
Amenity
Hospital numberNumber of hospitals per grid0.110.37
Park numberNumber of parks per grid0.330.64
VariablesDescriptionMeanStd. Dev.
Response variables
Resilience in June 2020
(for Model 1)
Calculated using POIs in December 2019 and June 2020, abbreviated as ‘Resilience in June 2020’36.881.0
Resilience in December 2020
(for Model 2)
Calculated using POIs in December 2019 and December 2020, abbreviated as ‘Resilience in December 2020’13.943.6
Explanatory variables
COVID-19Case number
(only in Model 1)
The case number in the grid until 31 June 20210.971.25
Case number
(only in Model 2)
The case number in the grid until 31 December 202116.4018.09
Population characteristicsPopulation densityThe population density in the grid
(person/Km2)
27,448.4130,302.93
Elder densityDensity of elders in the grid (person/Km2)5227.106466.30
AccessibilityRoad densityRoad density in km. per grid1.132.93
MTR station numberNumber of shopping malls per grid1.883.96
Land use characteristicsLand use indexEntropy-based land use mix index per grid0.720.17
Building coverage ratioBCR, building coverage area in km2. per grid0.160.10
AgglomerationPrivate residentialPrivate residential areas per grid0.080.11
Public residentialPublic residential areas per grid0.060.09
Rural settlementRural settlement areas per grid0.050.09
Commercial areaCommercial areas per grid0.020.05
Shopping Mall numberNumber of shopping malls per grid0.760.87
Market numberNumber of markets per grid0.330.63
AmenityHospital numberNumber of hospitals per grid0.110.37
Park numberNumber of parks per grid0.330.64
Table 2. Changes in the number of restaurants in two periods.
Chinese
Restaurants
Non-Chinese
Restaurants
Fast-Food
Restaurants
All
December 2019 (baseline)13,4106924579726,131
June 202013,9096848556226,319
Fluctuation 14.0%−1.0%−4.0%0.7%
December 202013,1126547494324,603
Fluctuation 2−2.0%−5.0%−17.0%−6.0%
1,2 Two fluctuations are relative to the number in 2019.
Table 3. Result of two regression models.
  Variables  Model Results (Coefficients and Significance)
  Model 1
(Resilience in June 2020)
  Model 2
(Resilience in December 2020)
  Case number  0.006  −0.002
  Elder density  0.043  −0.030
  Road density  −0.005  0.016
  MTR station number  0.051 **  0.025
  Land use characteristics
  Land use index  1.462 ***  1.209 ***
  Building coverage ratio  0.595 ***  0.623 ***
  Private residential  −0.049  0.048
  Public residential  0.224 **  0.419 ***
  Rural settlement  −0.097  −0.084
  Commercial area  −0.044  0.054
  Shopping mall number  0.077  0.072 *
  Market number  0.236 *  0.240 **
  Hospital number  0.058  −0.235 *
  Park number  0.063  0.044
  Intercept  1.156 ***  0.579 ***
Observations  263  410
Adjusted R-squared  0.559  0.647
Moran’s I for residuals  −0.010  0.024
Note: * p < 0.10. ** p < 0.05. *** p < 0.01.
Disclaimer/Publisher’s Note: The statements, opinions and data contained in all publications are solely those of the individual author(s) and contributor(s) and not of MDPI and/or the editor(s). MDPI and/or the editor(s) disclaim responsibility for any injury to people or property resulting from any ideas, methods, instructions or products referred to in the content.

