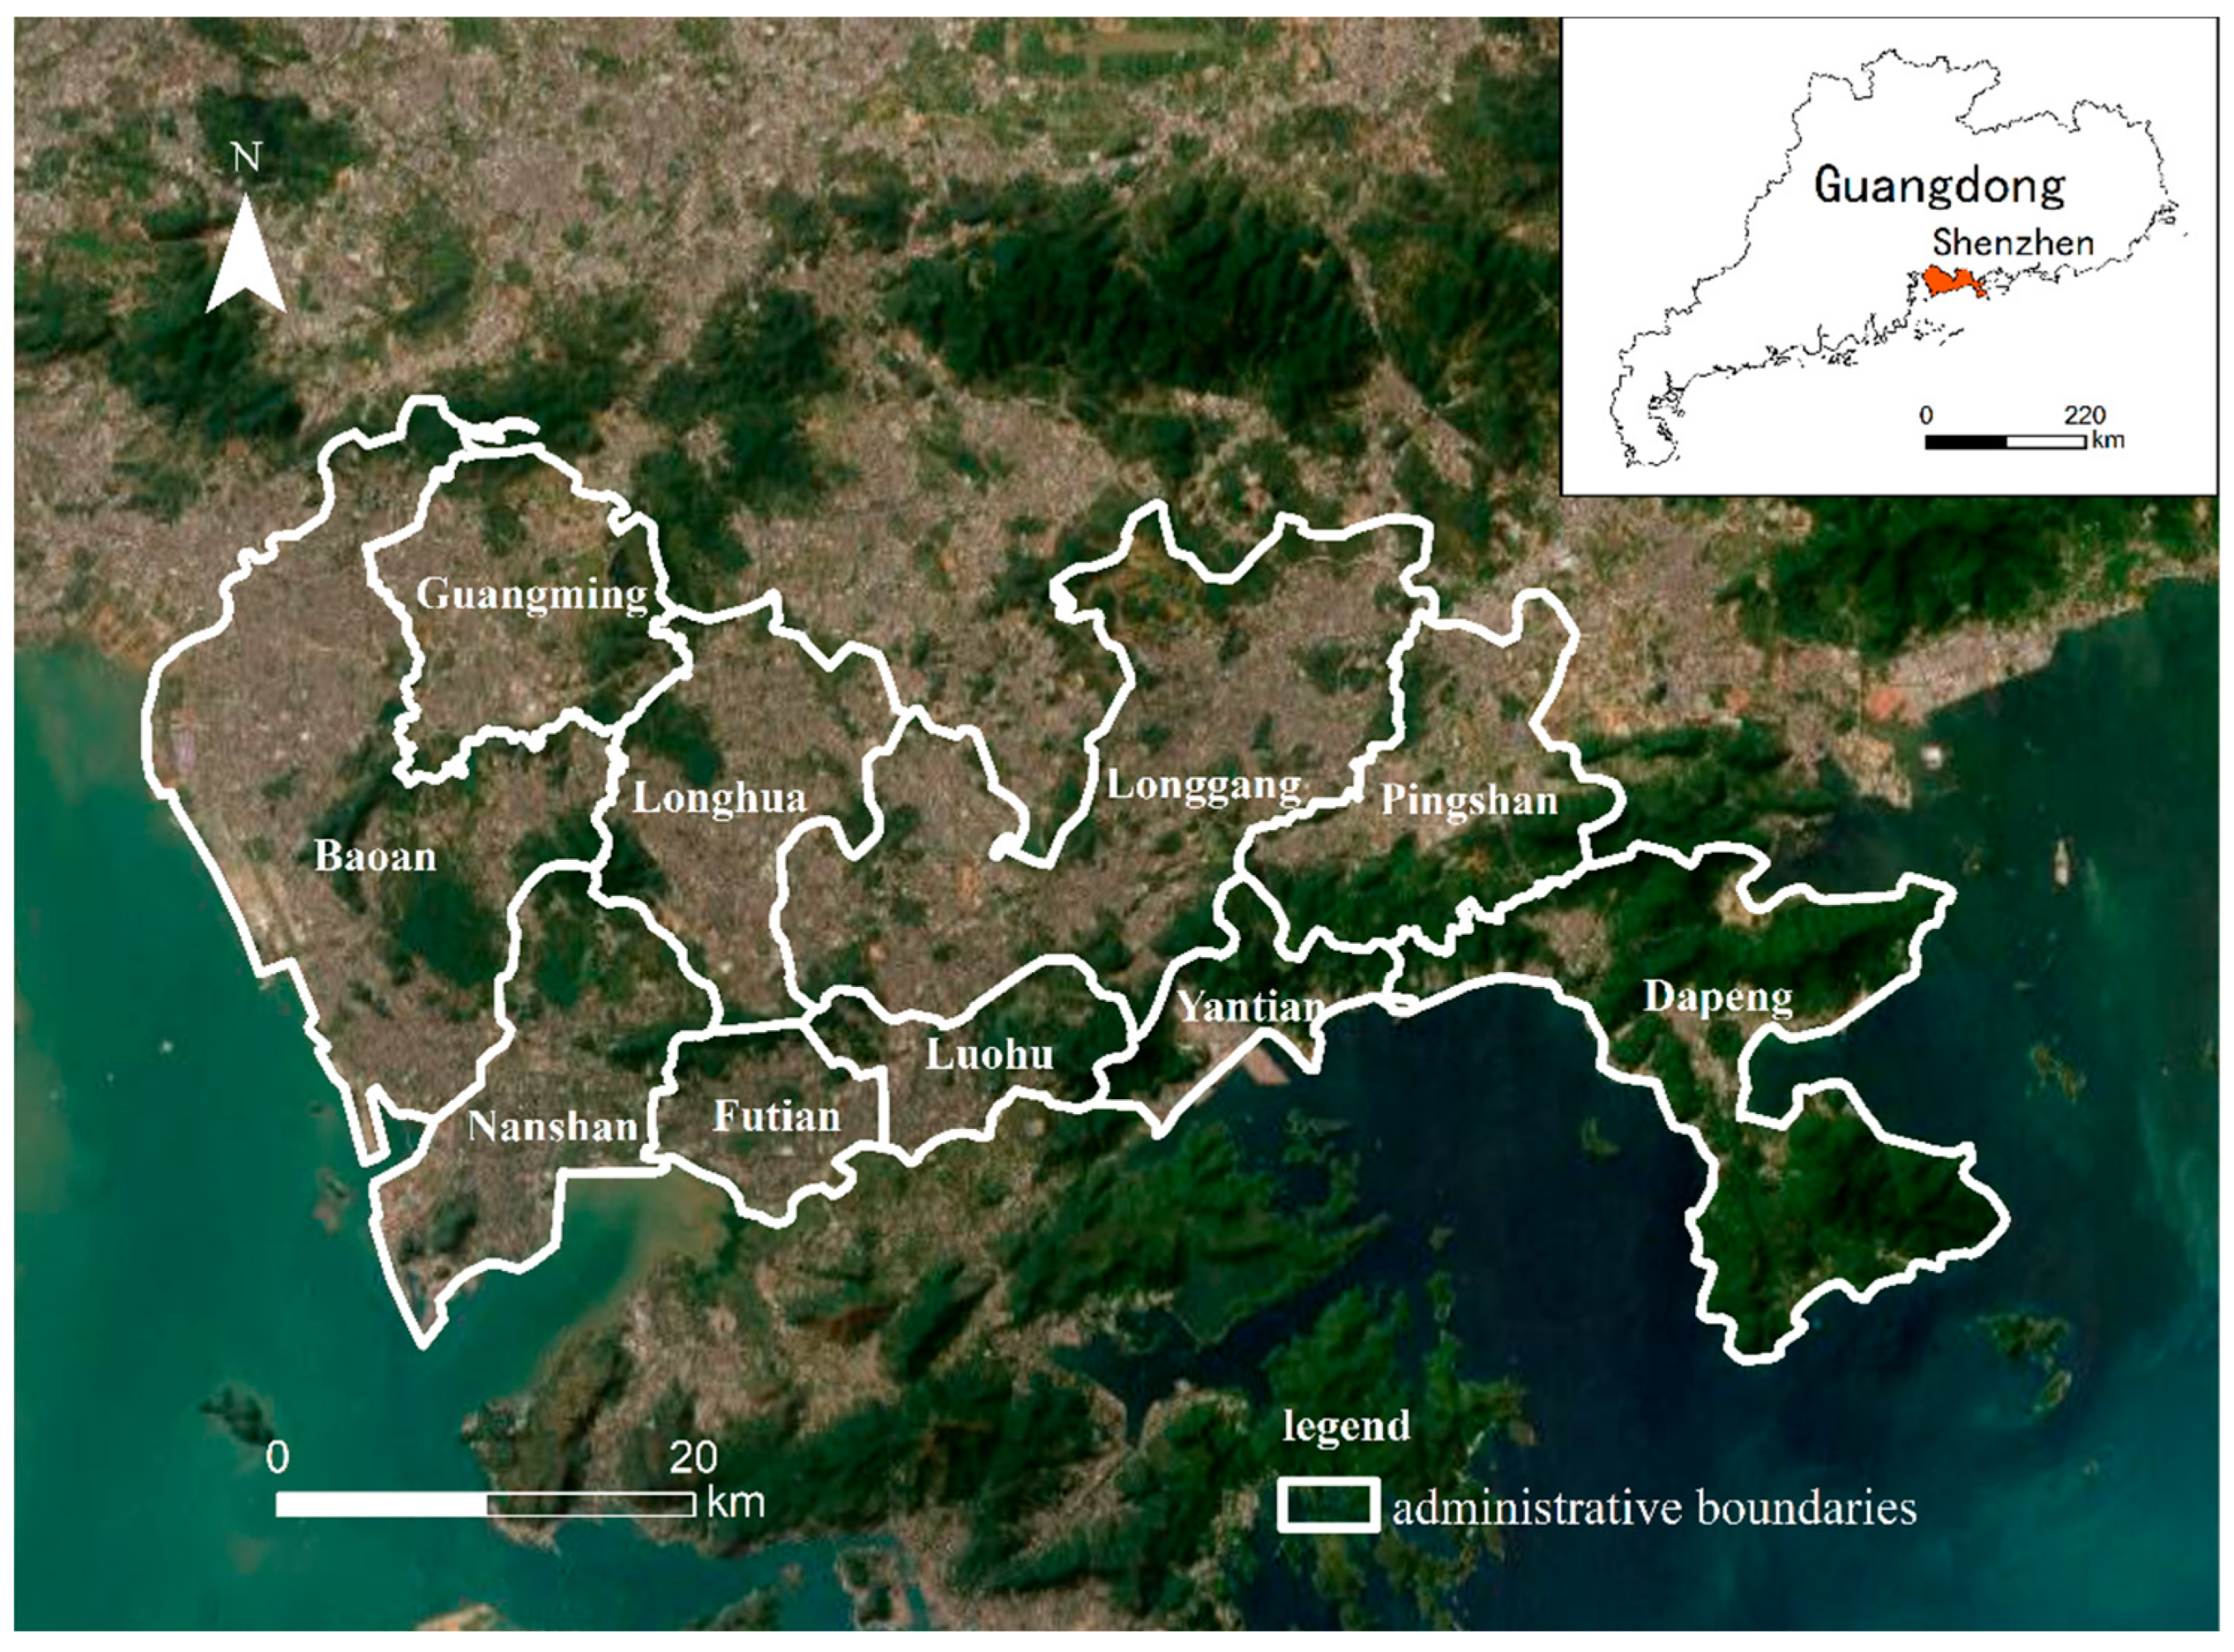
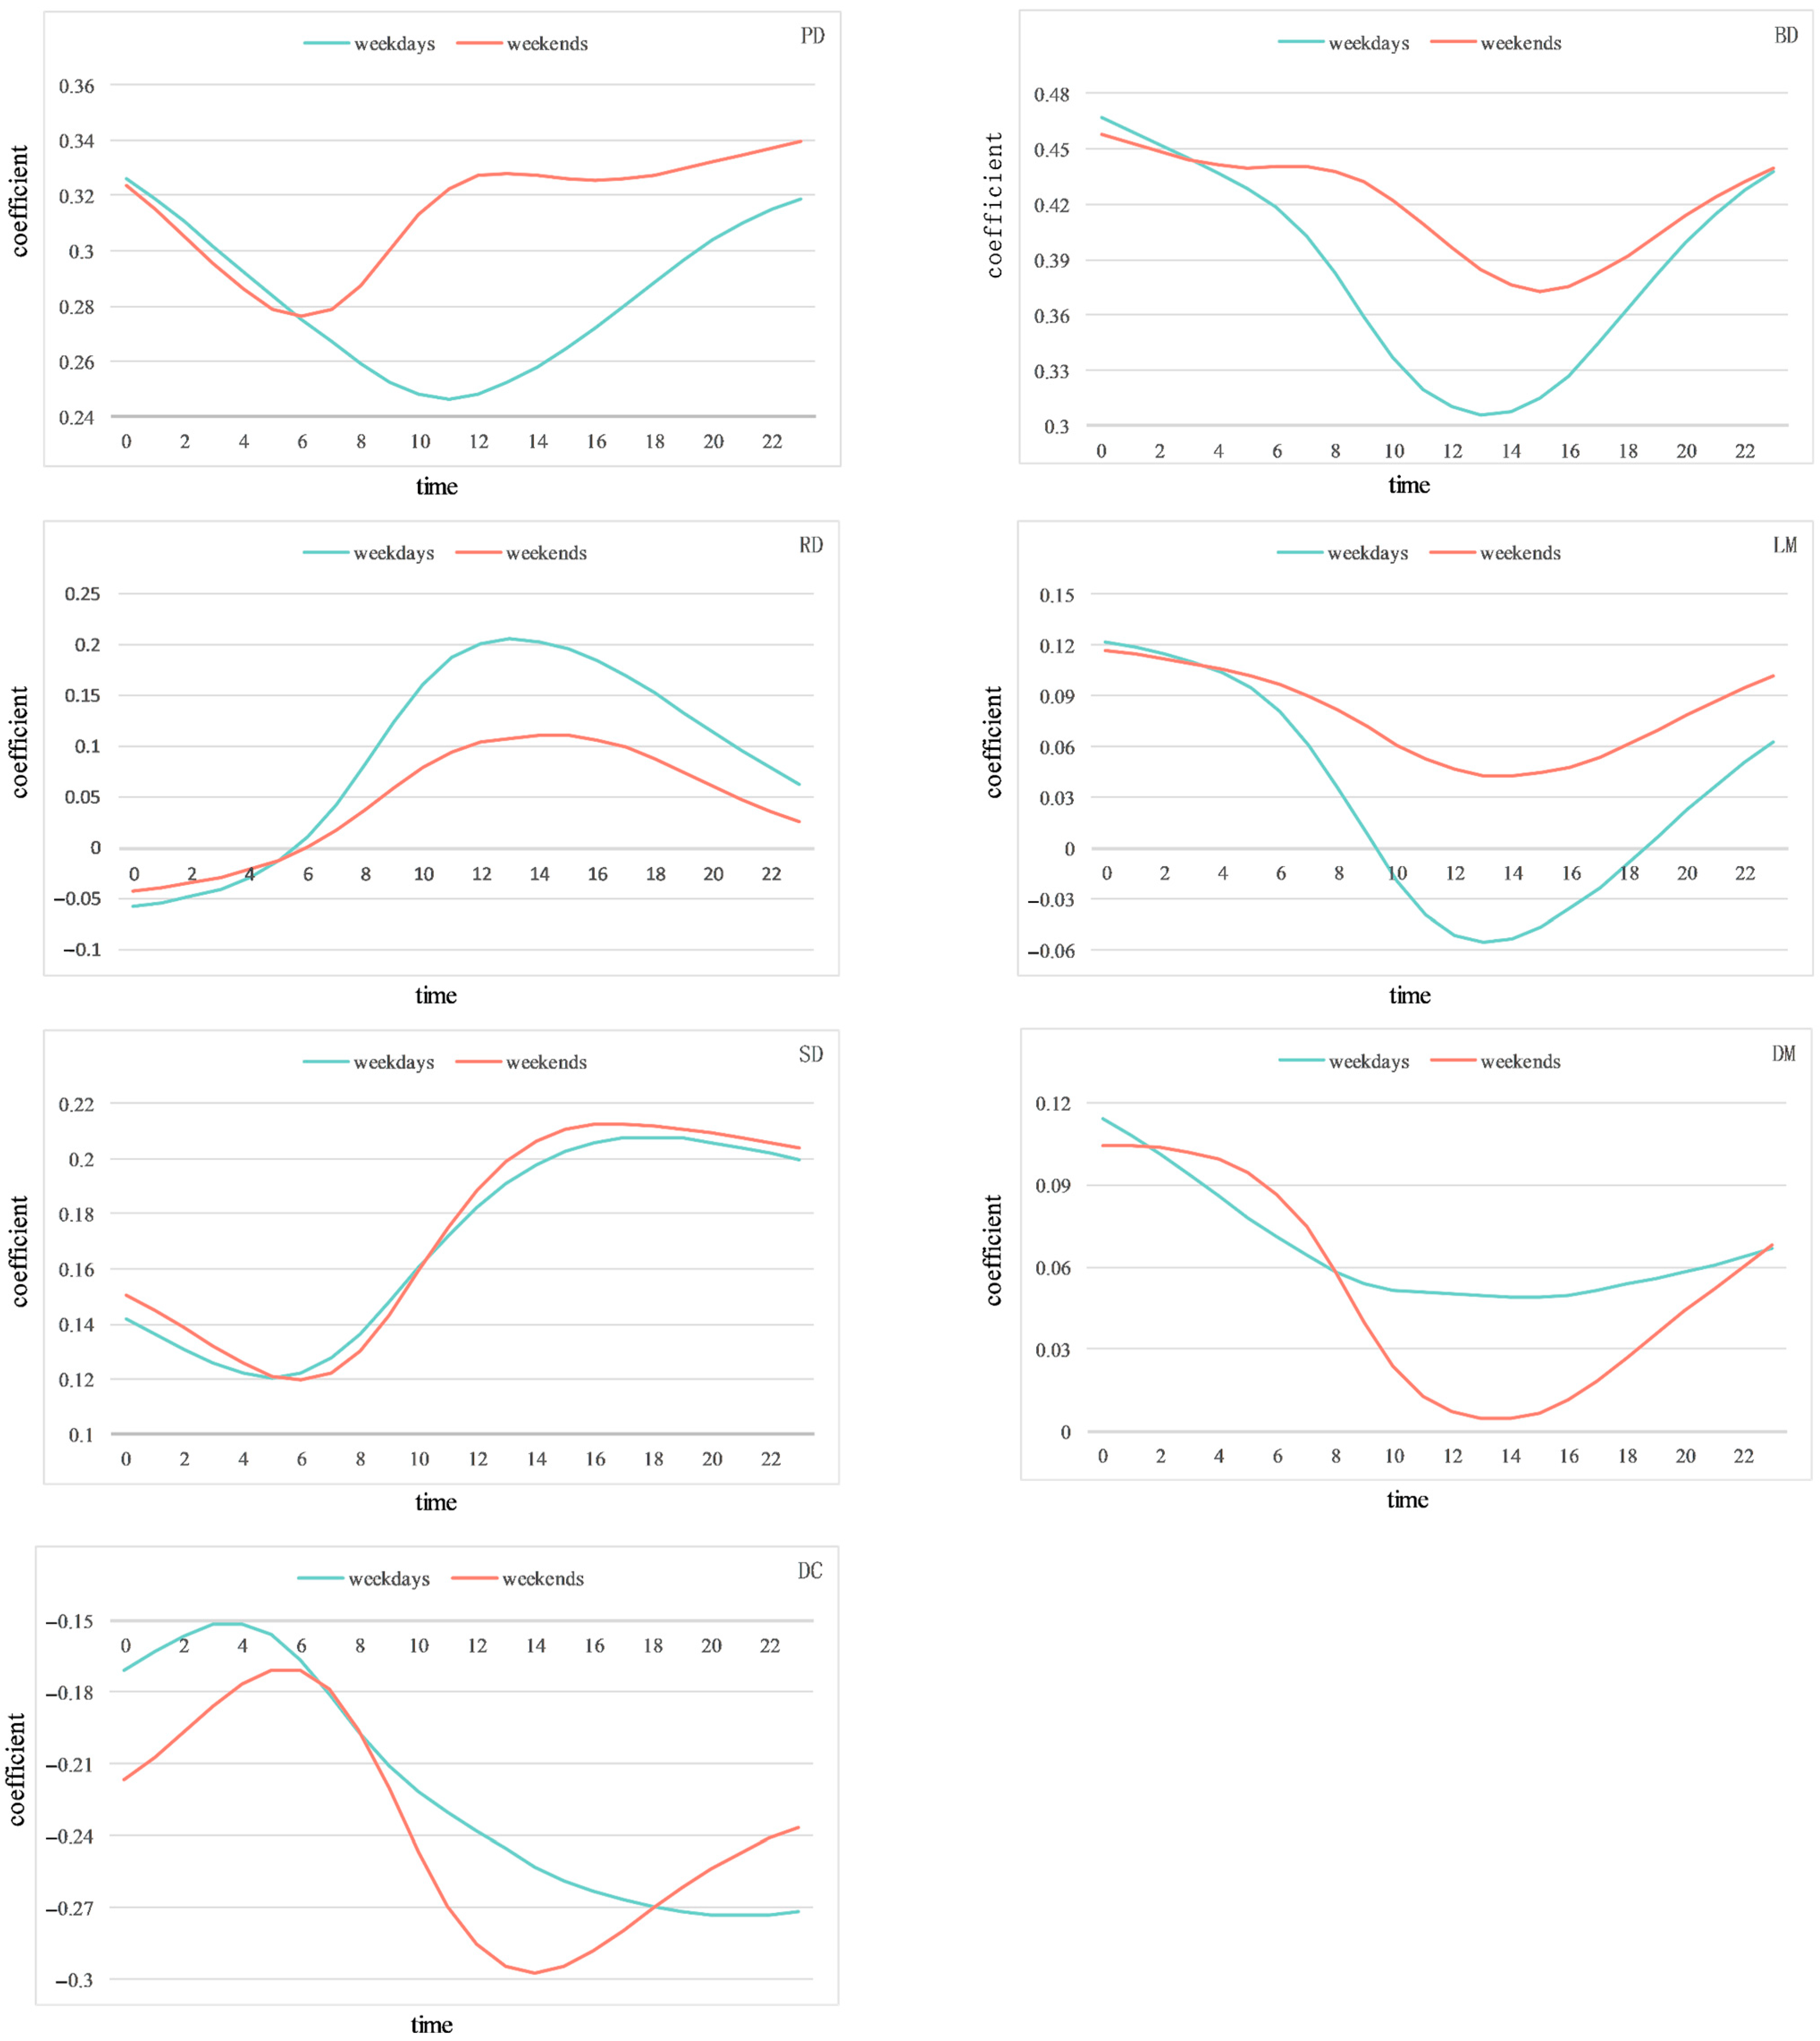
4.3.3. Spatial–Temporal Analysis of GTWR Regression Coefficients
To better understand the spatiotemporal heterogeneity of the relationship between built environment factors and urban vitality, the 24 h averages of coefficients and the averages of 331 TAZ units were calculated for weekdays and weekends, respectively. A visualization of the statistical results is shown in
Figure 6.
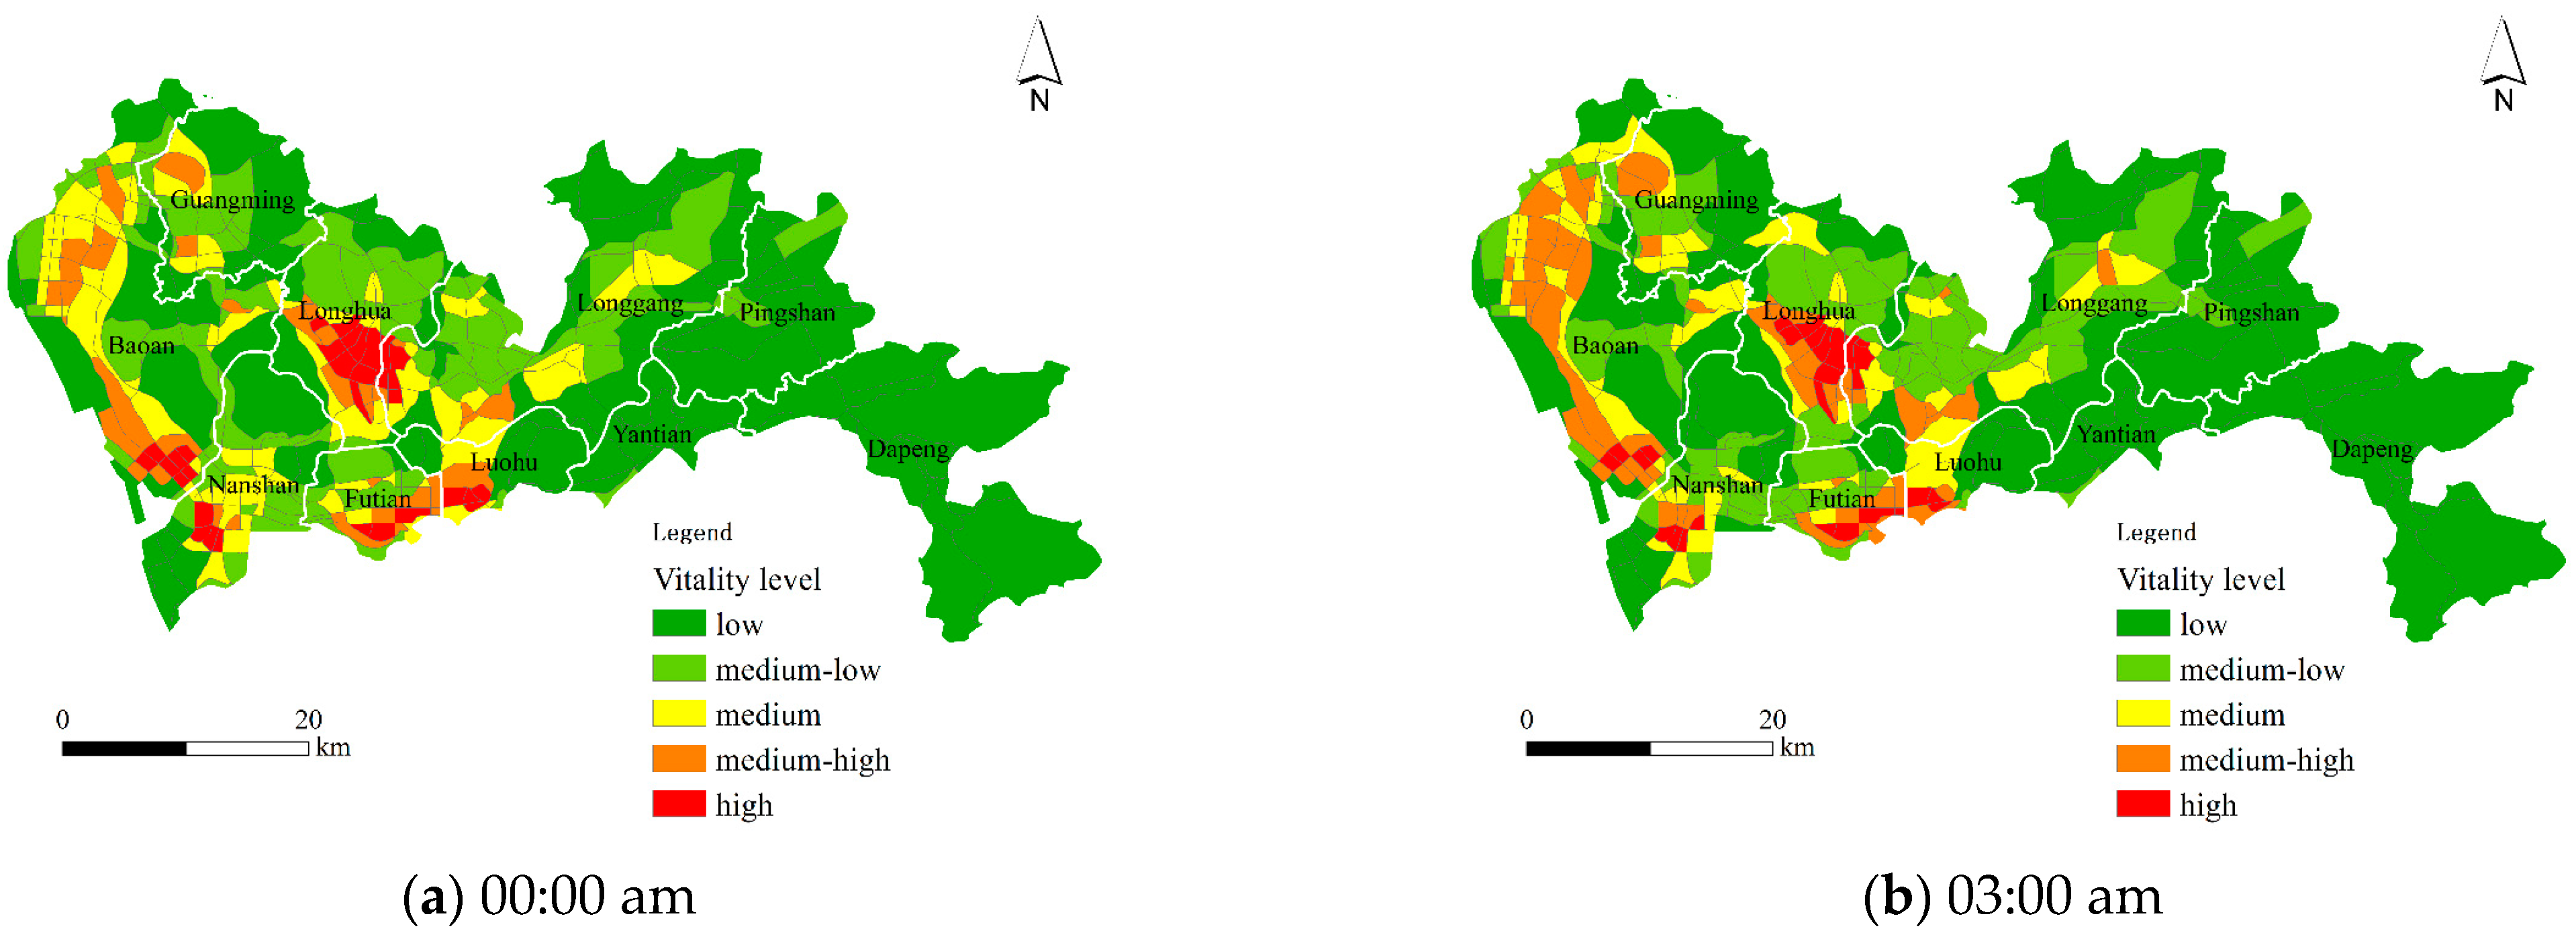
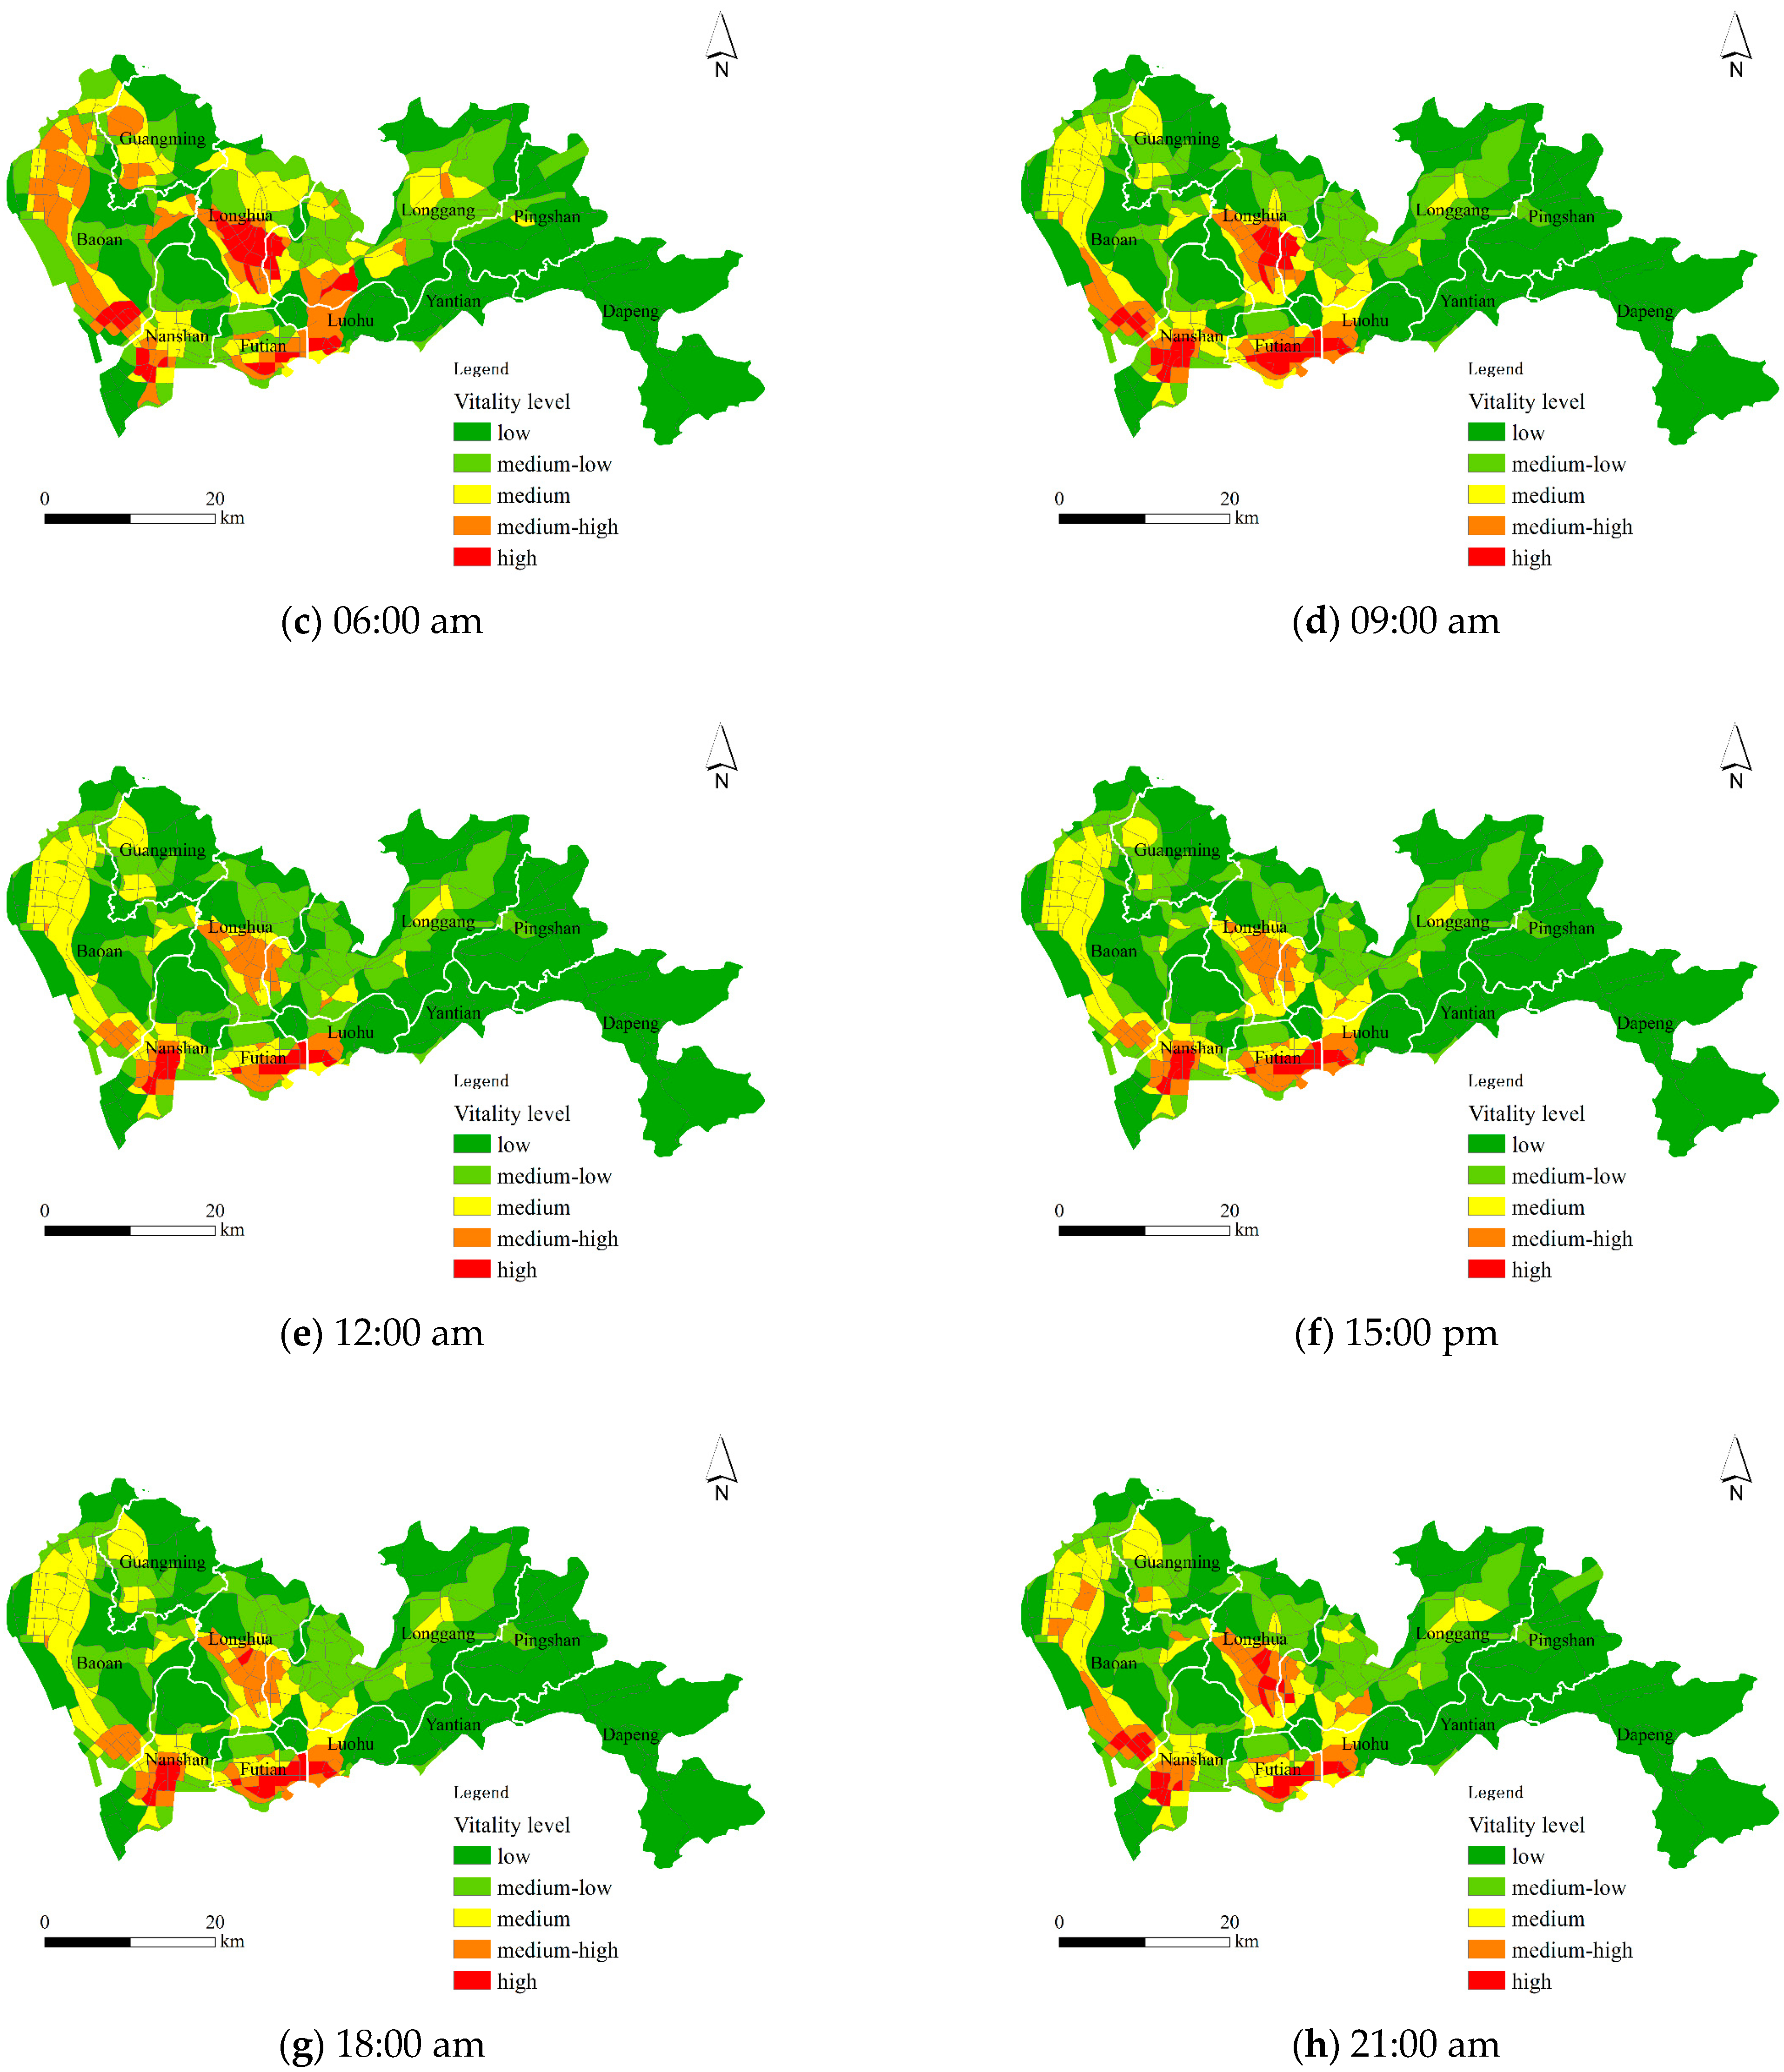
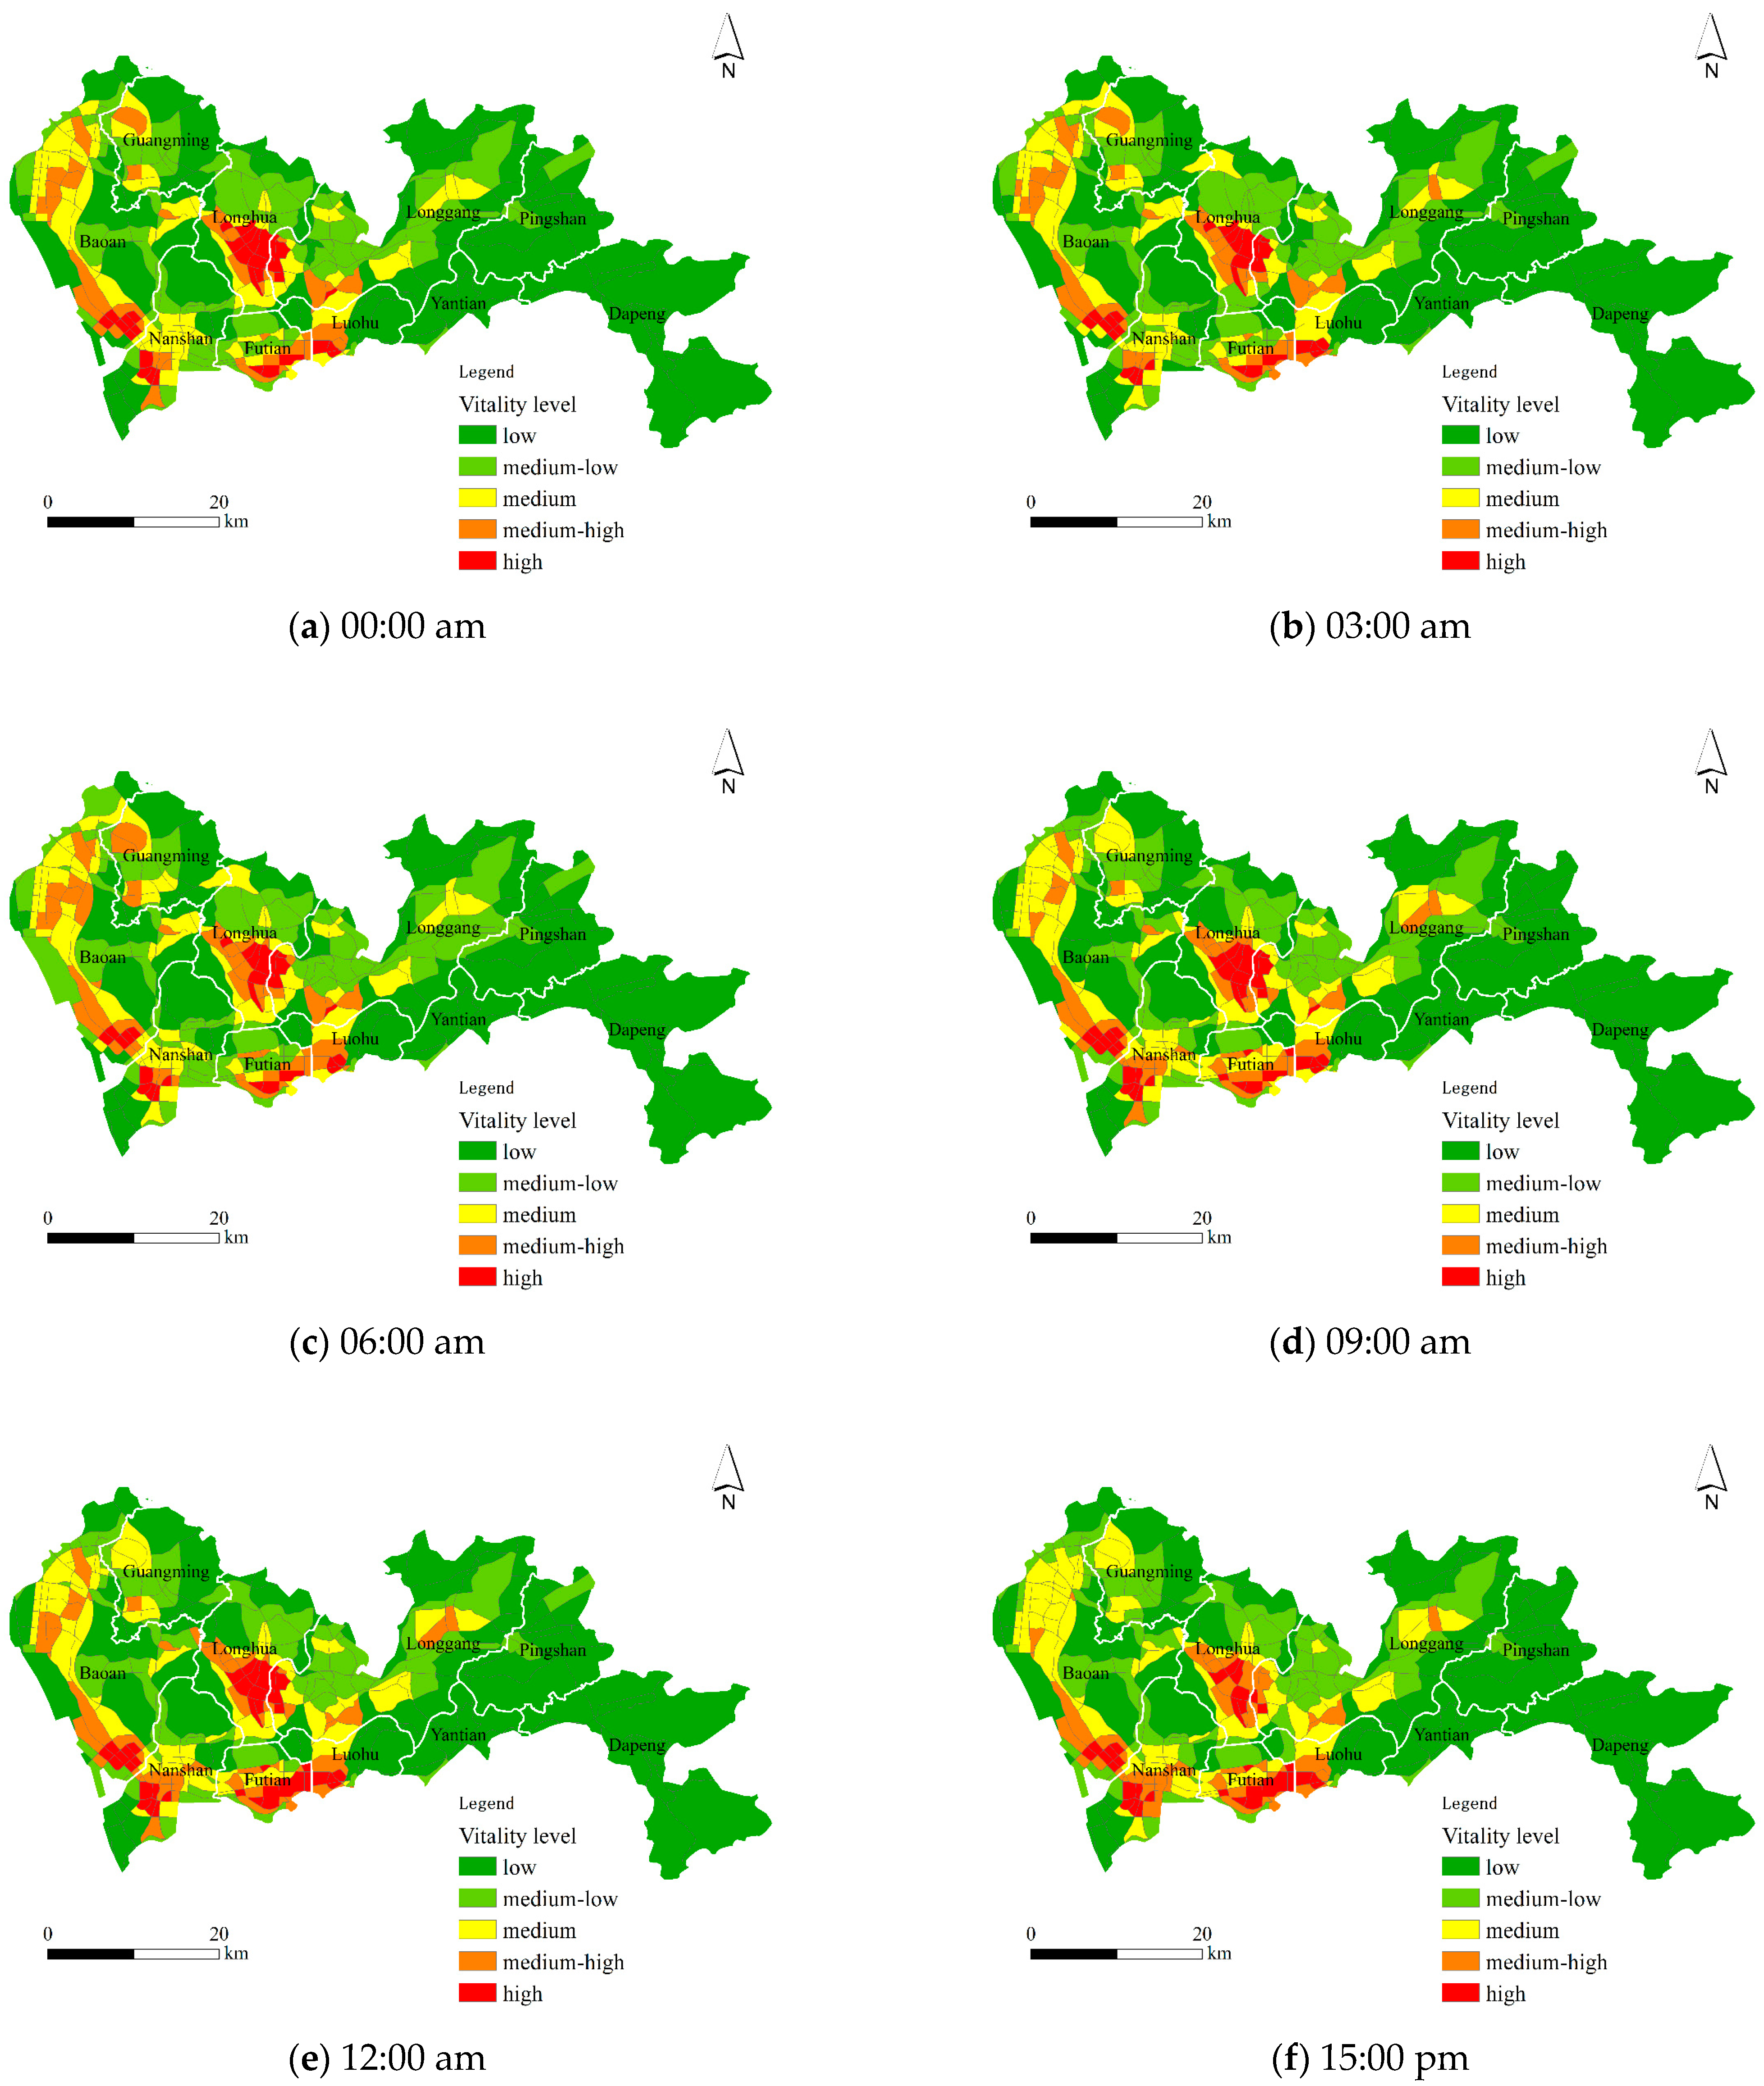
From an overall perspective, the regression coefficients of population density and building density were positive on weekdays and weekends, indicating a positive effect on urban vitality. Population is the main body of the urban system, and buildings, as one of the main places of human activities, can reflect the development of a city to a certain extent. Therefore, population density and building density usually have a significant positive effect on urban vitality. The coefficients of population density and building density showed a trend of first decreasing and then increasing throughout the day. On weekdays, the absolute value of the coefficient of population density reached its lowest value at 11:00 a.m., while the absolute value of the coefficient of building density reached its lowest value at 13:00 p.m. This indicated that the effects of population density and building density on urban vitality were enhanced in the afternoon. On weekends, the difference in the change characteristics between the coefficients of population density and building density was significant. Throughout the weekends, the coefficient of population density exhibited a characteristic pattern of initially decreasing, then increasing, and finally stabilizing. Among them, the influence of population density on urban vitality gradually decreased during the nighttime. After 6:00 a.m., the influence of population density gradually increased and finally reached its maximum at around 12:00 p.m. and stabilized thereafter.
The absolute values of the coefficient of building density maintained a high value until 6:00 a.m., and then showed a trend of initially decreasing and then increasing, indicating that building density showed a stronger effect during nighttime than daytime. It was noticed that the absolute values of the coefficients of population density and building density were generally higher on weekends than on weekdays. One possible explanation is that, compared to weekdays, on weekends, residents tend to have a higher proportion of leisure and recreational activities usually happening in commercial areas with a high building density. Thus, the density indicator had a stronger effect on them.
On weekdays and weekends, the coefficients of road network density were positive, except for the period from 0:00 a.m. to 6:00 a.m., indicating that there was a significant diurnal difference in the influence of road network density on urban vitality. That is, road network density showed a significant positive correlation with urban vitality during the daytime and peaked at around 14:00 p.m. The possible reason for this is that people are still mainly active during the day. The absolute values of the road network density coefficients during weekdays were greater than those of weekends, indicating that road network density had a stronger effect on urban vitality during weekdays. This finding can be explained by the fact that residents need to commute to their workplaces and engage in various activities on weekdays. Residents have more freedom in their travel arrangements on the weekends, so the effect of road network density on urban vitality was slightly weaker.
The absolute value of the coefficient of functional mix was consistently low, indicating that functional mix had little impact on urban vitality. Furthermore, there was a notable difference in the coefficient values of functional mix between weekdays and weekends. On weekdays, the functional mix coefficient was positive, except for the period from 10:00 a.m. to 18:00 p.m. It is possible that the effect of functional mix was not reflected, since the period between 10:00 a.m. and 18:00 p.m. is usually working hours, which is dominated by the work activities of urban residents. However, functional mix had a positive effect on urban vitality during weekends. It can be inferenced that residents preferred to visit commercial centers or scenic areas on weekends, which usually have a high degree of mix.
The coefficients of bus stop density were positive on weekdays and weekends, and the variation characteristics were very similar, suggesting that bus stop density had a significant effect on urban vitality. Bus stop density had a stronger effect on urban vitality during the daytime than the nighttime. A possible explanation is that, as the public transport mode with the widest coverage, buses are the preferred transport mode for many residents and thus have a significant enhancement effect on urban vitality. Since most bus routes stopped running at night, the intensity of their effect was higher during the daytime than the nighttime.
Unlike bus station density, distance to metro stations had a positive correlation with urban vitality. That is, the further the distance from the metro station, the higher the urban vitality. This finding challenges our perception that proximity to metro stations would enhance urban vitality. A possible explanation is that the metro station is often not the ultimate destination, and residents usually need a feeder trip after getting off the metro. The value of the coefficient on the weekends showed a trend of initially decreasing and then increasing, reaching the lowest value at 14:00 p.m.
The coefficient of distance to the CBD was negative on weekdays and weekends, indicating that distance to the CBD consistently had negative impact on urban vitality. On weekdays, the absolute value of the coefficient stayed at a low value between 0:00 a.m. and 6:00 a.m., and increased slowly after 6:00 a.m., indicating that the CBD had a stronger influence on urban vitality during the daytime than the nighttime. The reason may be that Shenzhen’s CBD is a comprehensive area for technology, finance, politics, and other functions. During the daytime on weekdays, residents usually gather in the CBD for working and living, so the closer the area to the CBD, the higher the urban vitality. On weekends, the absolute value of the coefficient was also high during the daytime and low during the nighttime, indicating that the CBD is also attractive to residents on weekends and has a boosting effect on urban vitality.
The 24 h averages of the model coefficients for each TAZ unit on weekdays and weekends were calculated, and the visualization results are shown from
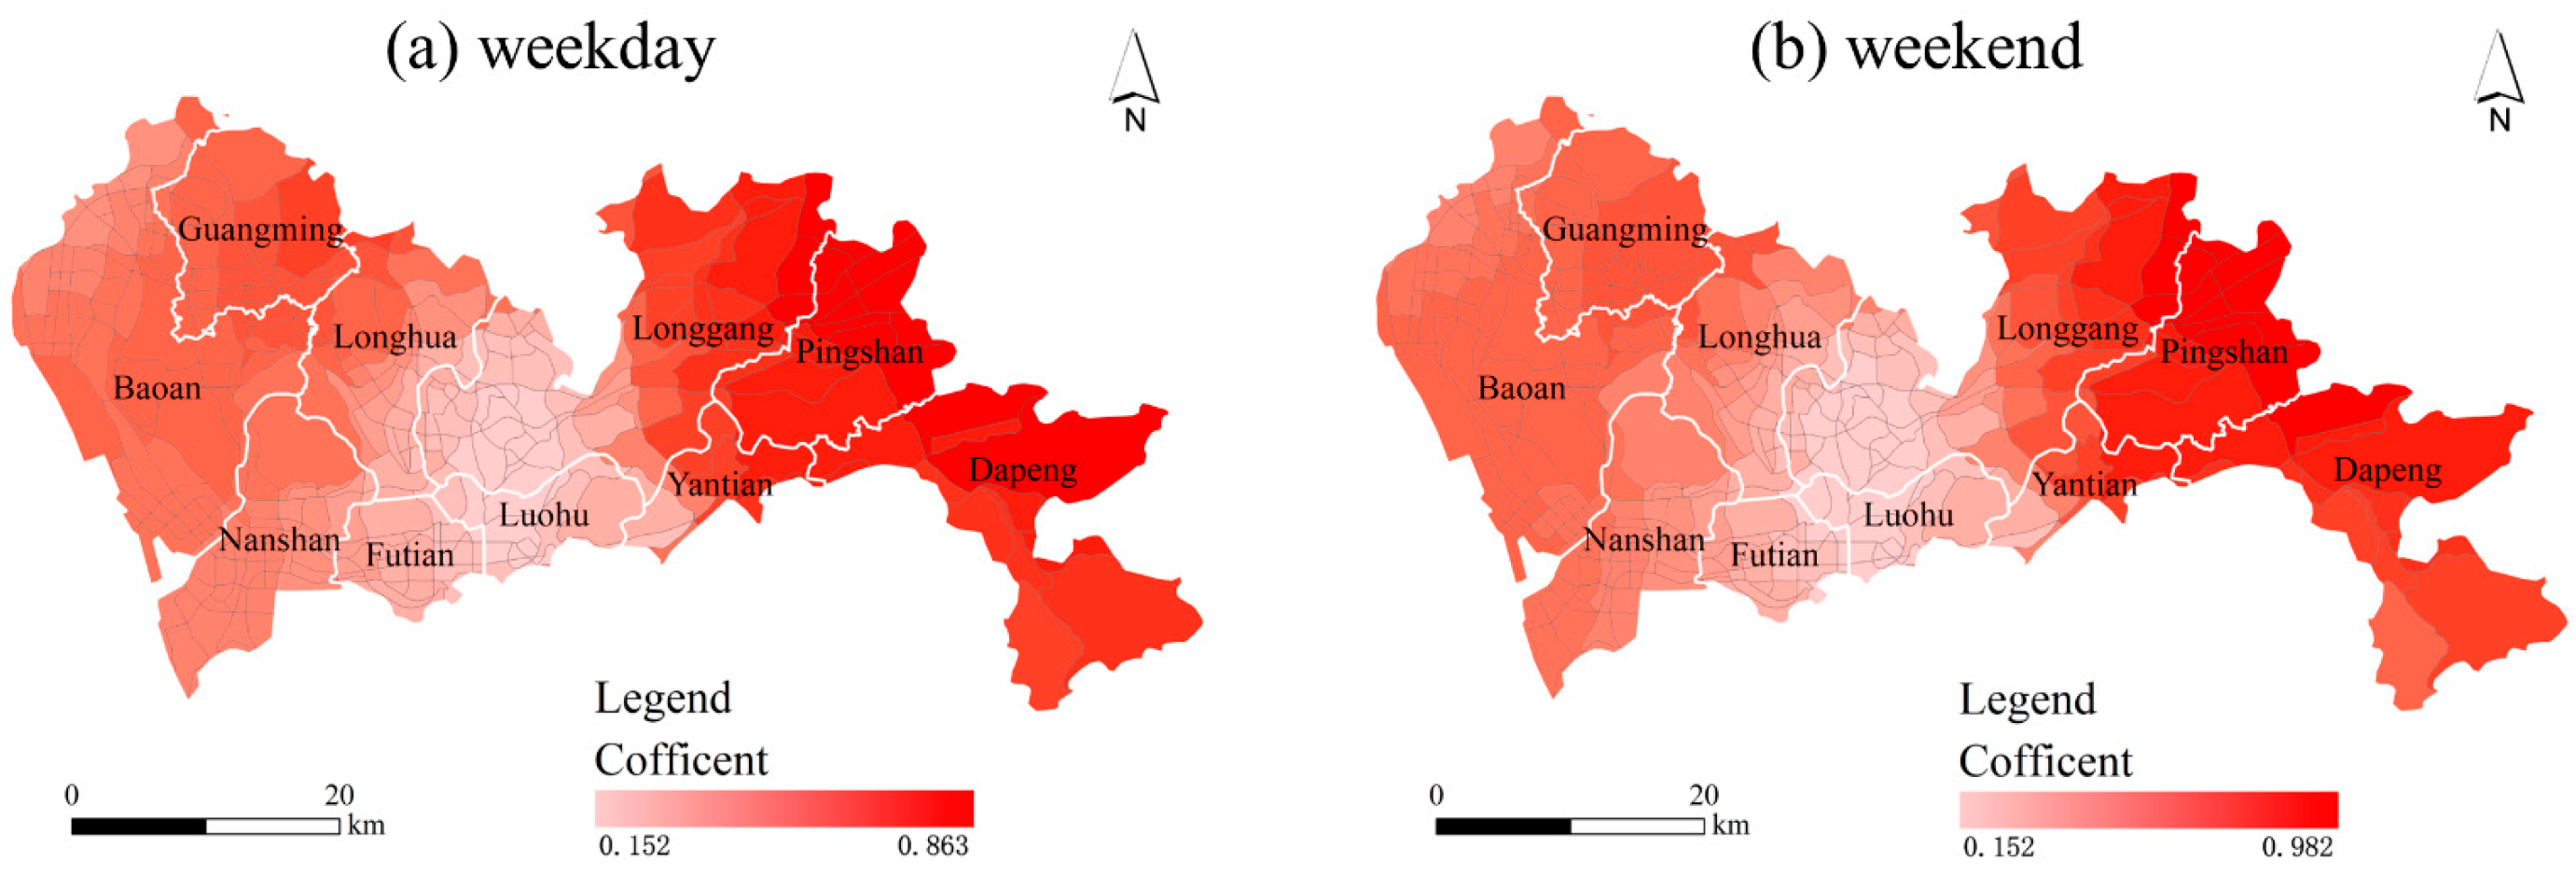
Figure 7,
Figure 8,
Figure 9,
Figure 10,
Figure 11,
Figure 12 and
Figure 13. The regions with positive regression coefficients are represented by warm tones and vice versa by cool tones. The impact of built environment factors on urban vitality showed significant differences with the TAZ units. The comparison showed that the distribution patterns of the same built environment factor on weekdays and weekends were roughly similar, indicating that the differences in the effects of individual built environment factors depended more on the differences between TAZ units.
- (1)
Density
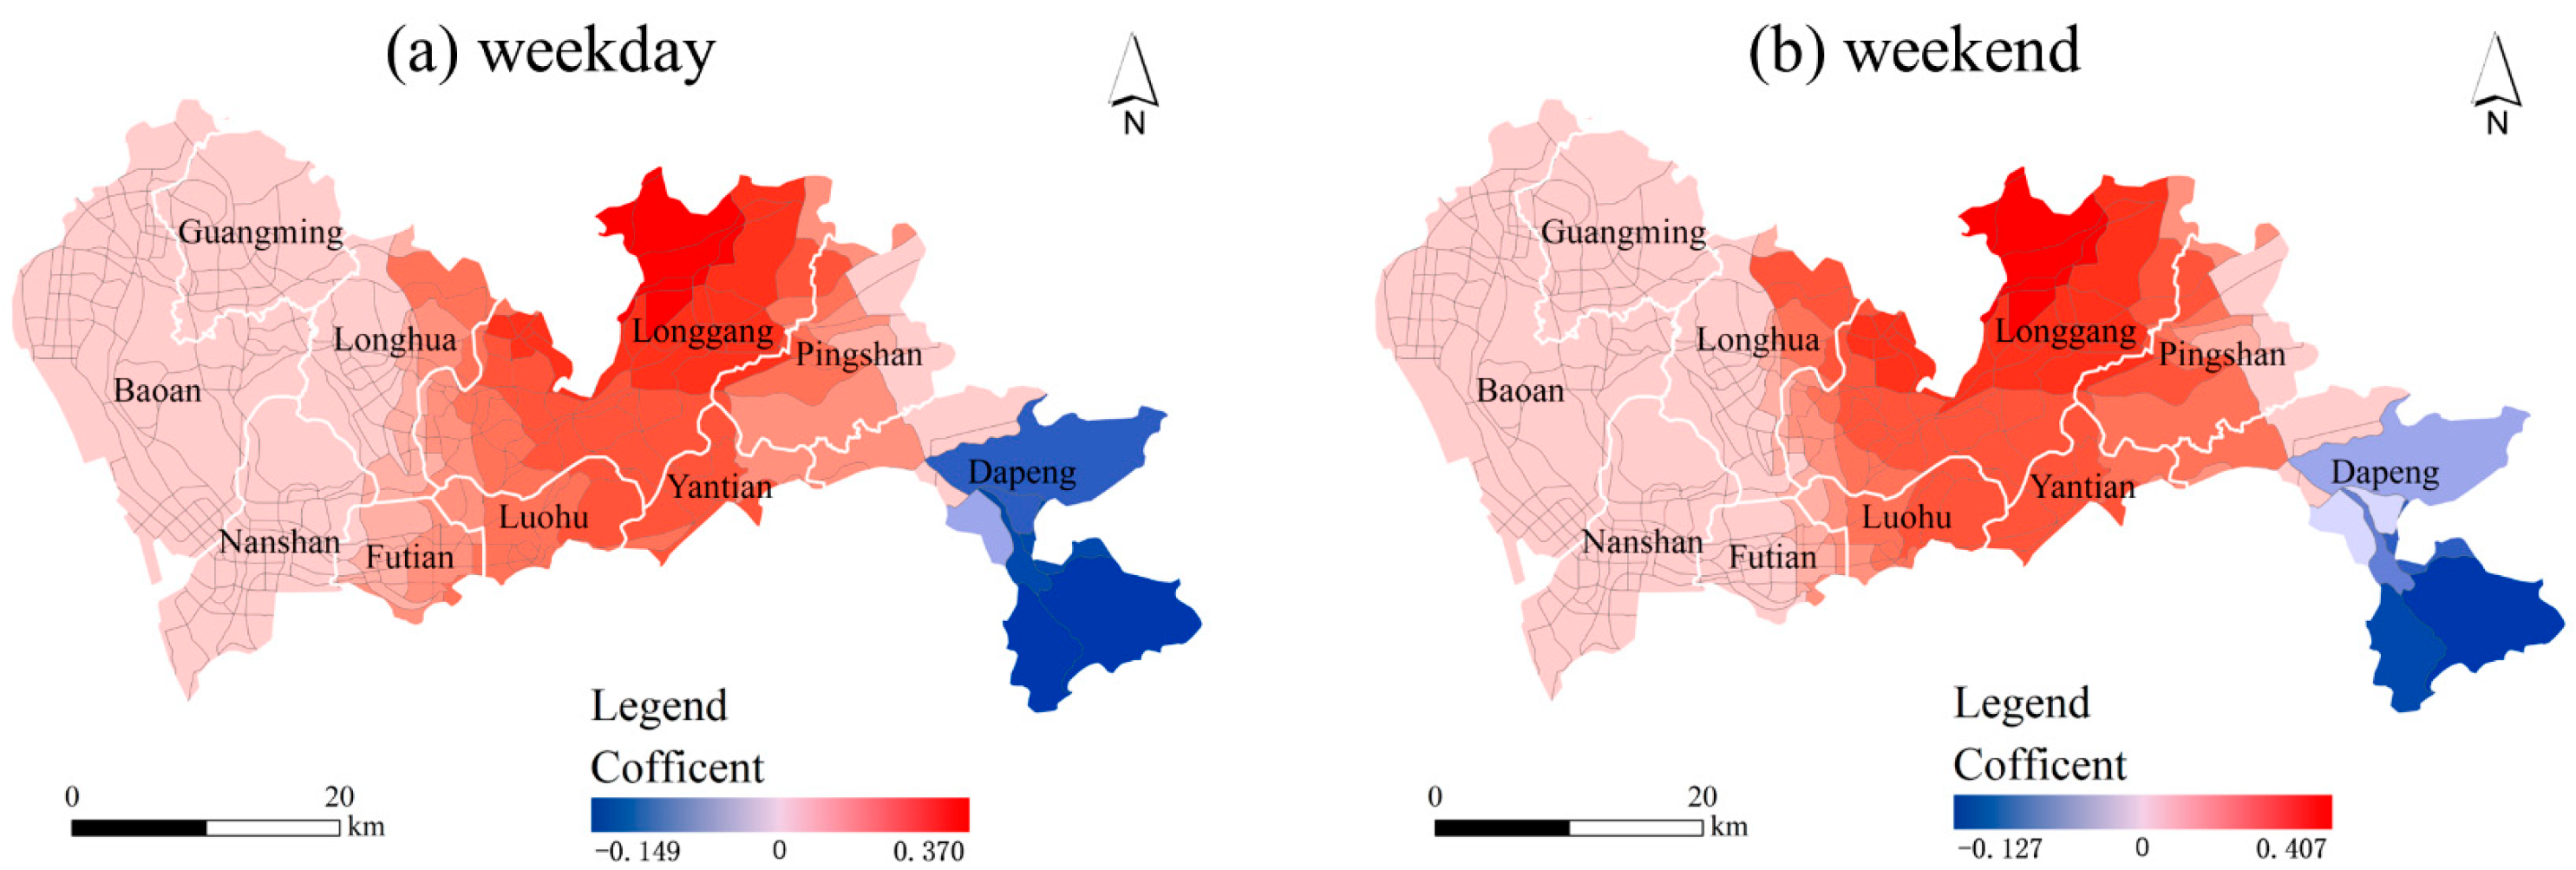
Figure 7.
Coefficient map of population density.
Figure 7.
Coefficient map of population density.
Figure 8.
Coefficient map of building density.
Figure 8.
Coefficient map of building density.
The effect of population density on urban vitality was strongest in the eastern part of Shenzhen, including the Pingshan District, Dapeng New District, Longgang District, and the eastern part of the Yantian District. These areas are suburban regions with a relatively lower population density. Therefore, increasing the distribution of population in these areas is beneficial for the improvement of urban vitality. In the central and southern parts of Shenzhen, the intensity of the effect of population density was lower, including the central areas of Futian District, Nanshan District, and Luohu District. These areas are the core areas of Shenzhen, where industries and businesses are more developed and have a strong attraction to urban residents. Therefore, increasing the population density in central areas may have some effect on urban vitality, but it is not as significant as that in suburban regions.
Unlike population density, the effect of building density showed a clear circular structure, with coefficient values decreasing in all directions centered on the Shenzhen CBD. This finding suggested that proximity to the CBD played a crucial role in the relationship between building density and urban vitality. The reason may be that the CBD of Shenzhen is a vibrant area that encompasses various sectors such as technology, finance, and entertainment, making it highly attractive to residents. This area is more densely populated but has a relatively less built-up area, so an appropriate increase in buildings will have a significant effect on urban vitality. In contrast, the effect of increasing building density on the urban vitality in non-core areas of Shenzhen was less pronounced.
- (2)
Design
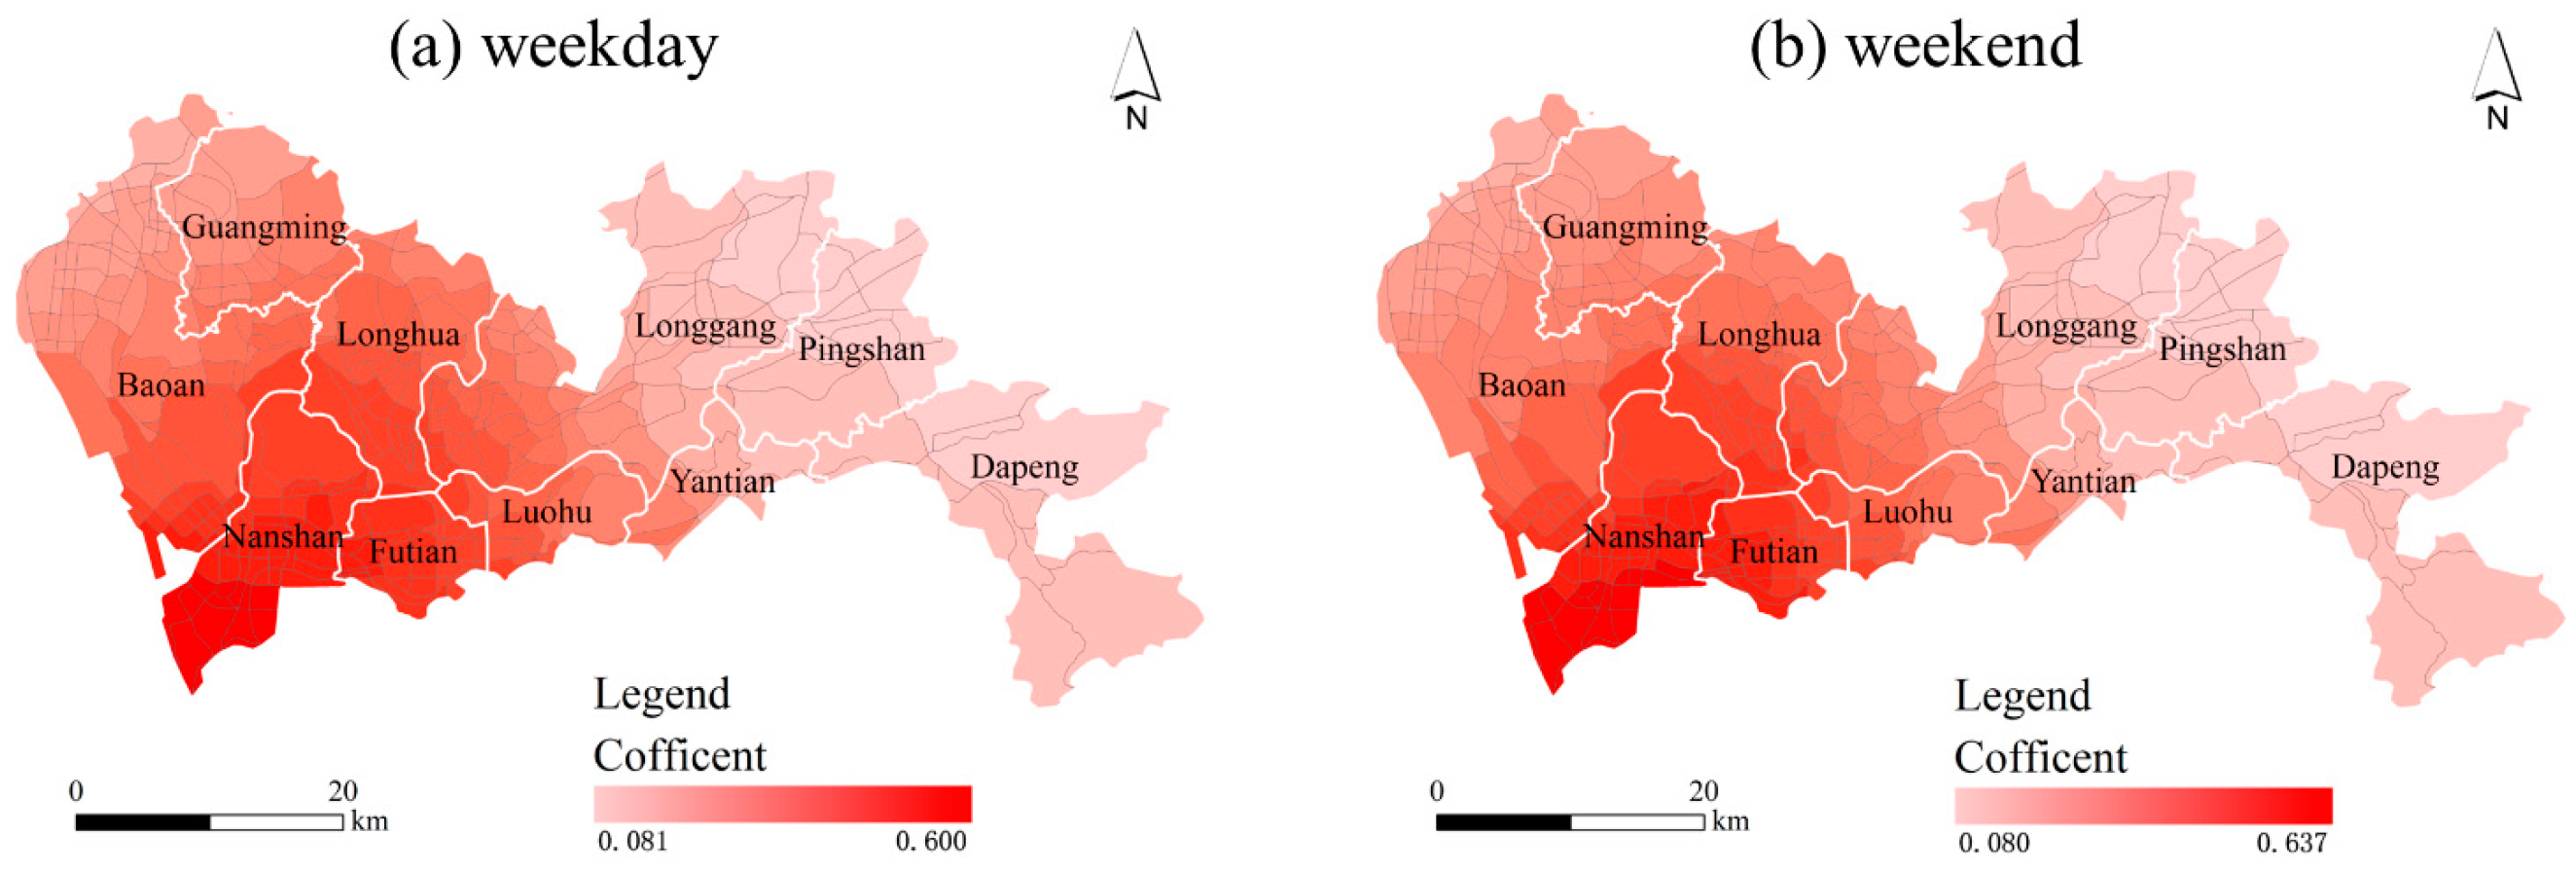
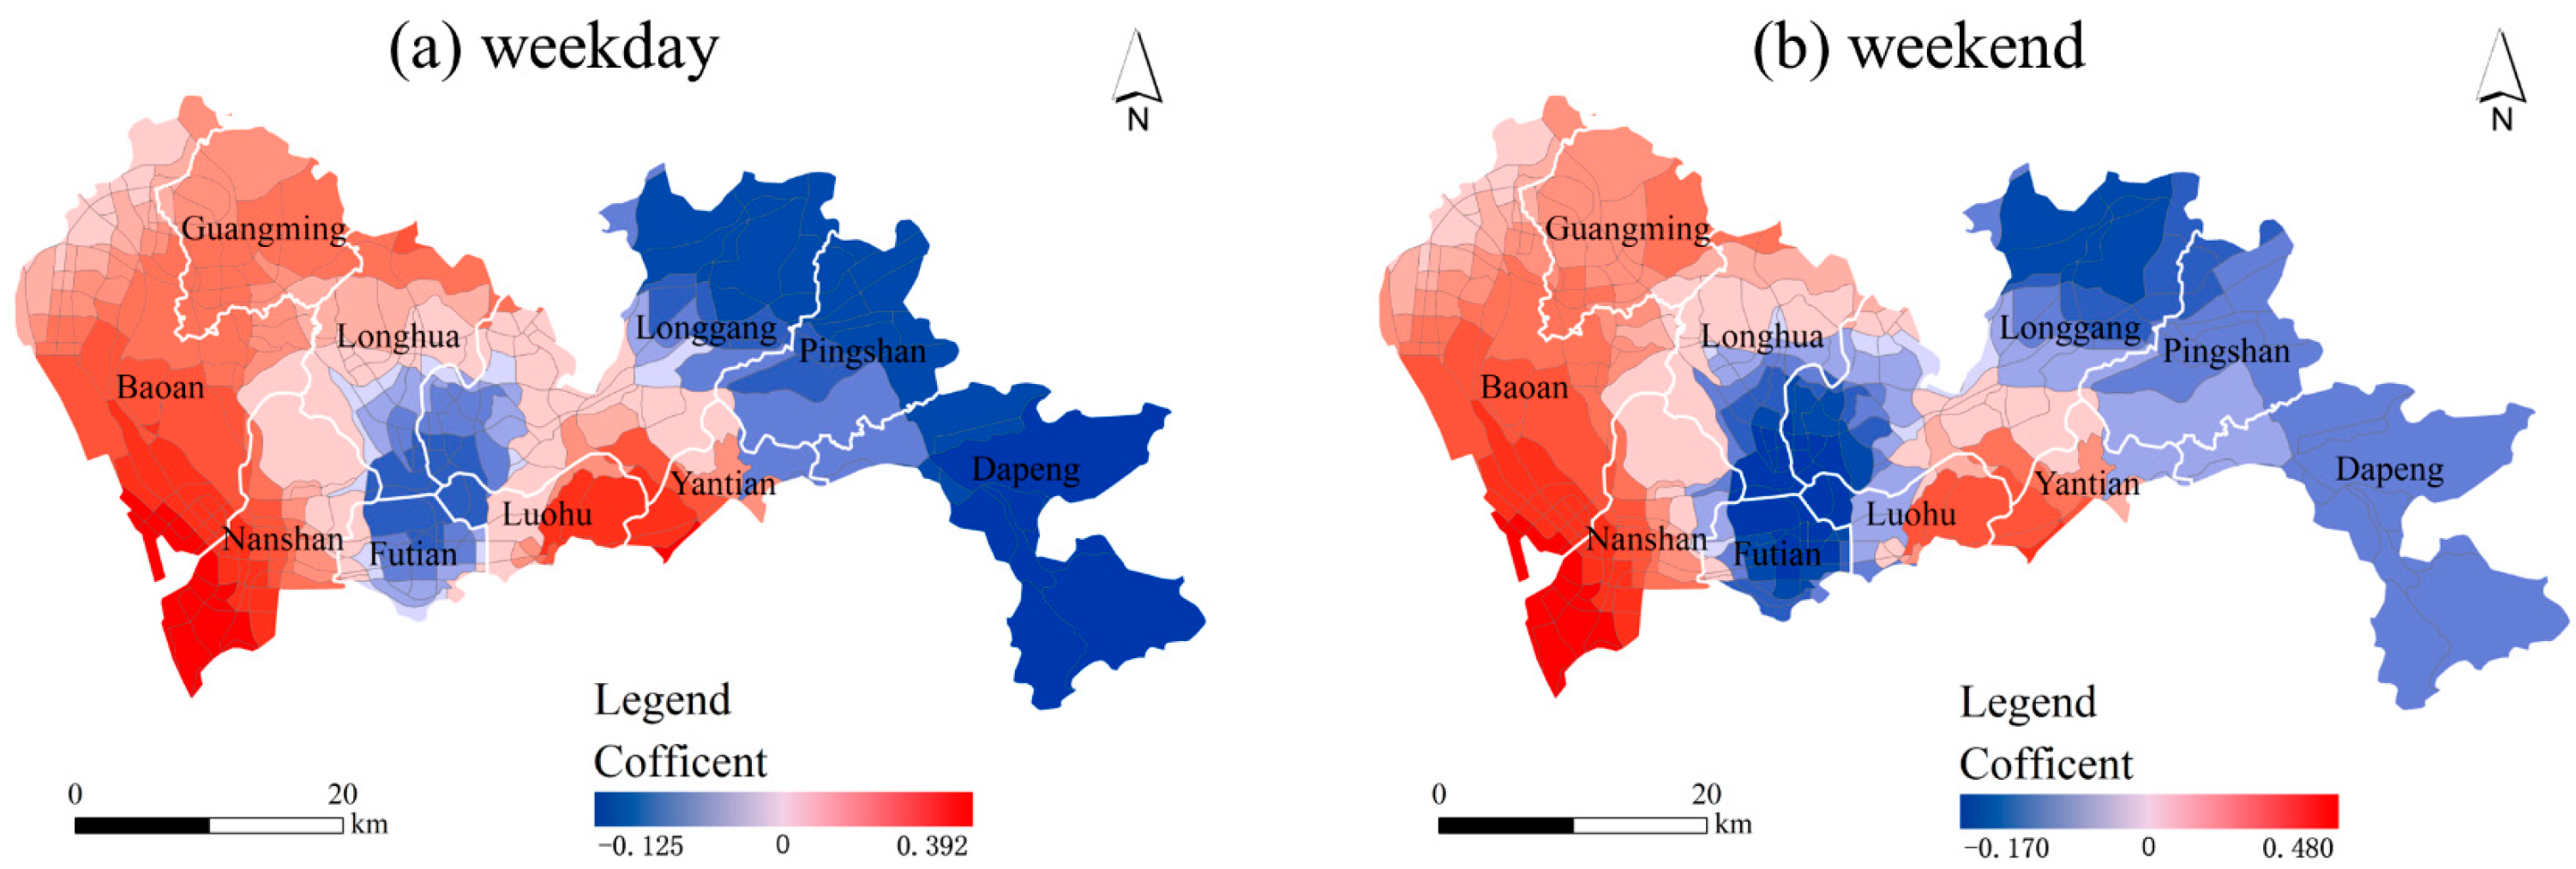
Figure 9.
Coefficient map of road density.
Figure 9.
Coefficient map of road density.
The effect of road network density on the urban vitality in Shenzhen exhibited spatial variations, and there were subtle differences between the patterns on weekdays and weekends. On weekdays, the effect of road network density on urban vitality showed a positive effect in the central and western parts of the city, and it was especially strongest in the northwest. Thus, increasing the road network density in these areas can promote more population activities to increase urban vitality. In the eastern parts of the study area, road network density showed a negative effect. This may be because the east of Shenzhen is dominated by mountains, forests, and green areas with fewer populations. On the weekends, the negative impact areas besides the eastern part also contained Nanshan District, Futian District, and part of Longhua District. The reasons could be related to reduced commuting needs and a shift in residents’ activities towards leisure and recreational areas, where road network density may have a relatively smaller influence.
- (3)
Diversity
Figure 10.
Coefficient map of functional mixture.
Figure 10.
Coefficient map of functional mixture.
Functional mix exhibited both positive and negative effects on urban vitality on weekdays and weekends. The positive impact areas were mainly concentrated in the eastern and western parts of Shenzhen, especially in four districts such as Bao’an District, Guangming District, Nanshan District, and Longhua District. Therefore, appropriately increasing the degree of mixed land use in such areas can promote urban vitality. On the other hand, the negative impact areas were mainly concentrated in the central and western parts of Shenzhen, including Luohu District, Yantian District, Longgang District, and Pingshan District. Among them, the negative effect was most prominent in the eastern parts of the Yantian and Luohu districts. The possible explanation is that such areas not only have a certain distribution of industrial and commercial facilities, but also have many green areas such as mountains and parks, and thus have more diverse land use types. The negative effect of functional mix on urban vitality in these regions may indicate that the effects of some factors, such as limited accessibility or inadequate infrastructure, outweighed the positive influence of mixed land use.
- (4)
Distance to transit
Figure 11.
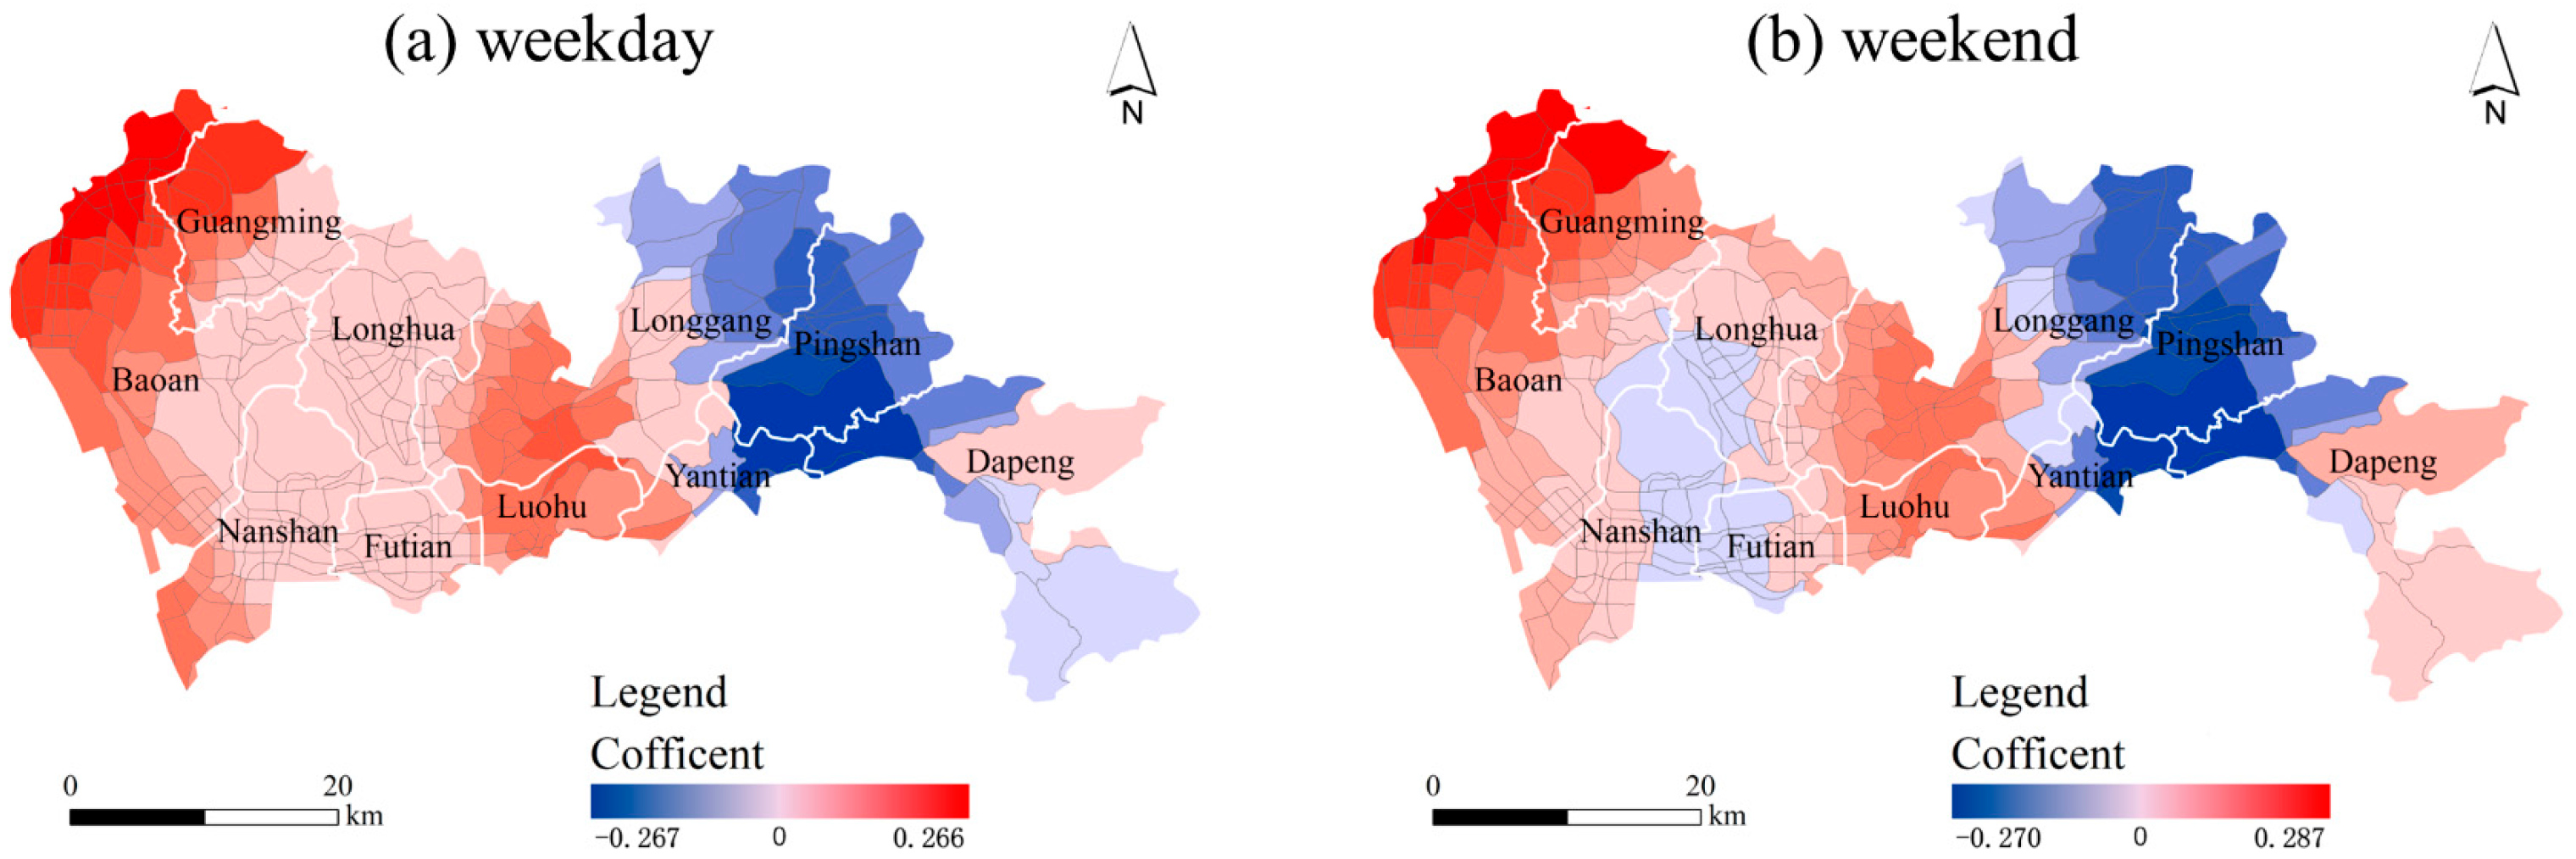
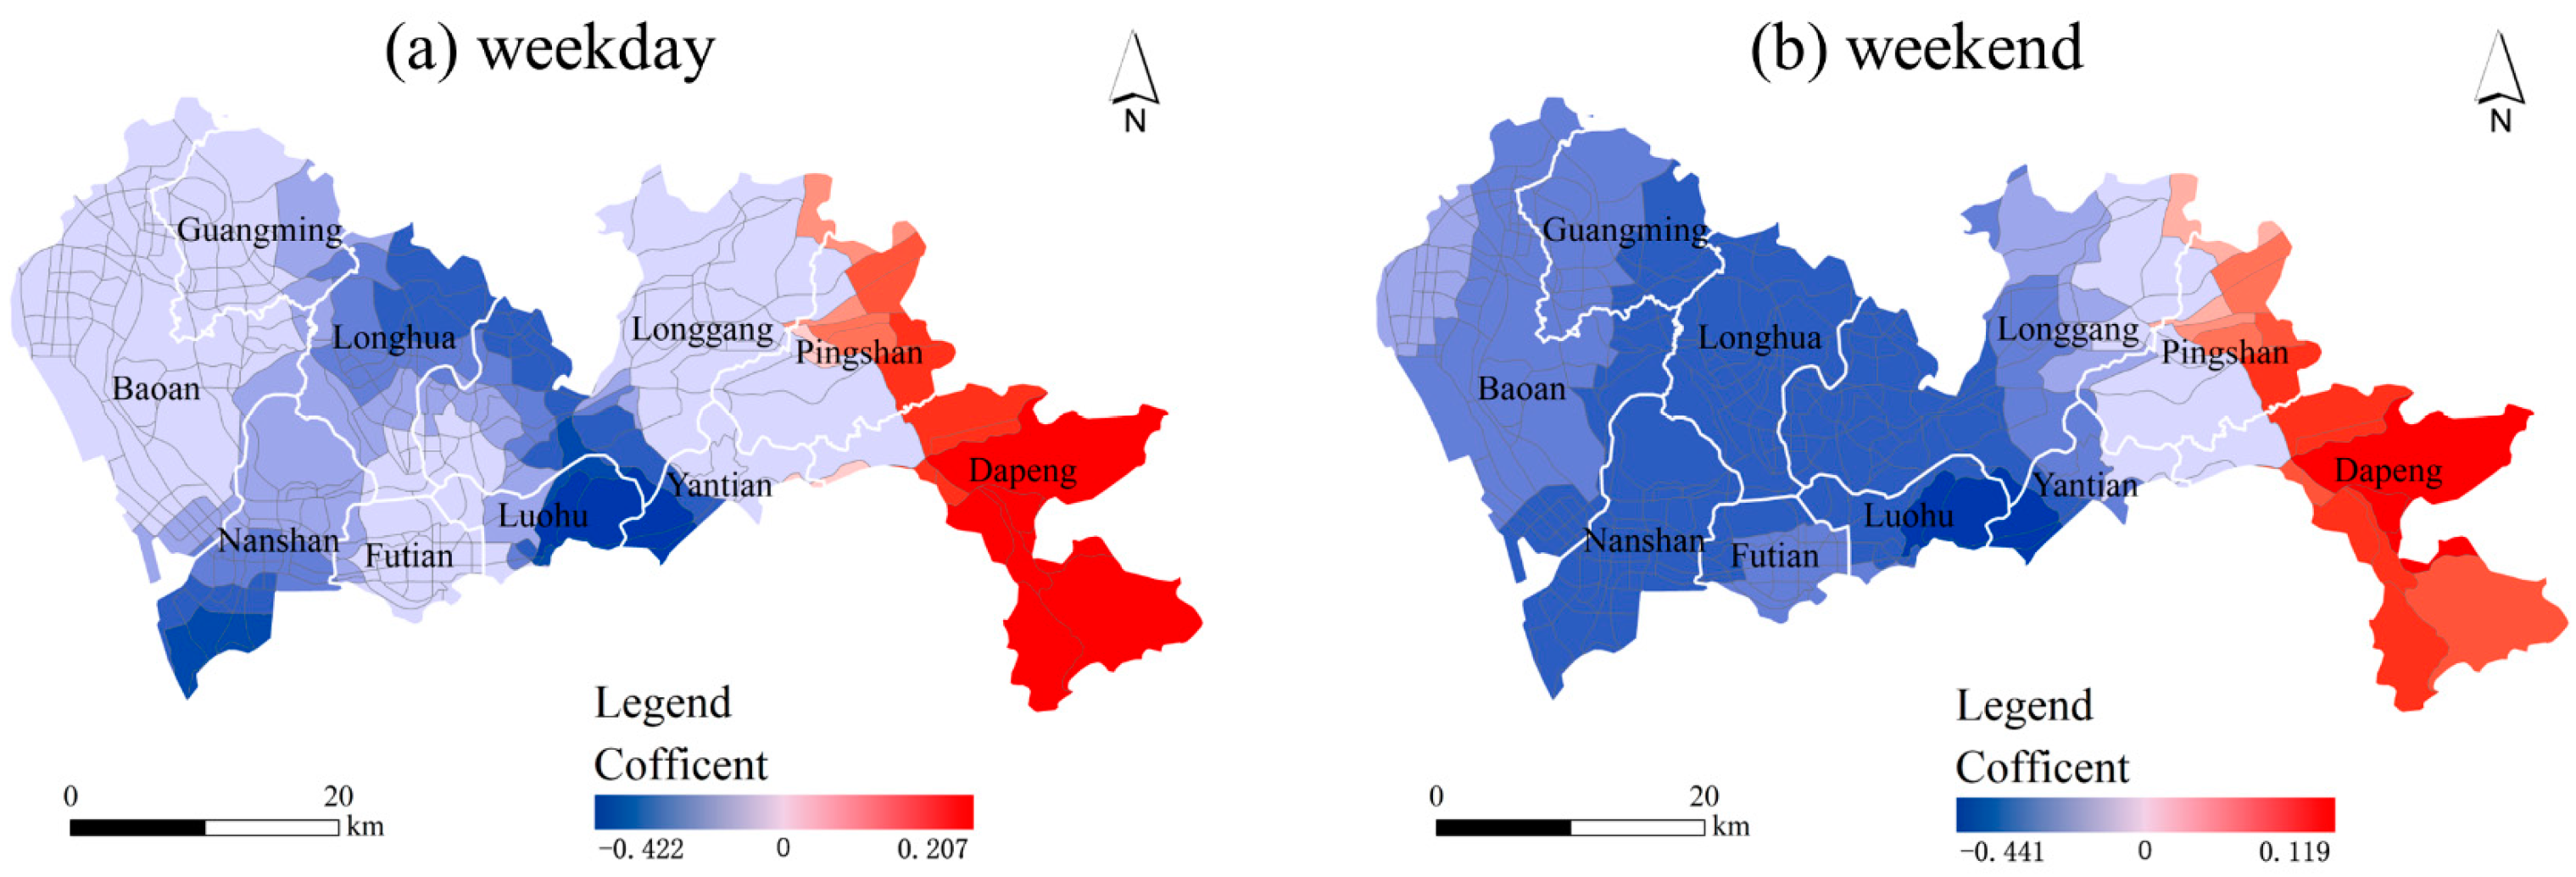
Coefficient map of bus stop density.
Figure 11.
Coefficient map of bus stop density.
Figure 12.
Coefficient map of distance to metro.
Figure 12.
Coefficient map of distance to metro.
Except for Dapeng new district, the effects of bus stop density on the urban vitality in the study area were positive. Therefore, increasing the deployment of bus stops in these areas can contribute to urban vitality. It is worth noting that the effect of bus stop density on urban vitality was most significant in Yantian district and Longgang district. The possible explanation is that Yantian district and Longgang district have fewer subway stations compared to the western part of Shenzhen; thus, buses have become the preferred transportation mode for residents. Therefore, the effect of increasing the density of bus stops in such areas would be more prominent. The variation in the coefficient values of distance from metro stations was more pronounced within the study area than the density of bus stops. In the eastern and central parts of Shenzhen, the coefficient of distance to the metro station was negative, indicating that, the closer to the metro station in such areas, the higher the urban vitality. These areas included suburban areas such as Pingshan District, Dapeng New District, and eastern Longgang District, as well as more developed areas such as Futian District and Longhua District. This result indicated that the opening of new subway stations had a certain promotion effect on the vitality in these areas. Outside of these areas, the coefficient of distance to the metro station was positive, especially in the southwest. This result implied that the accessibility of metro stations in such areas may not have a promoting effect on urban vitality.
- (5)
Destination accessibility
Figure 13.
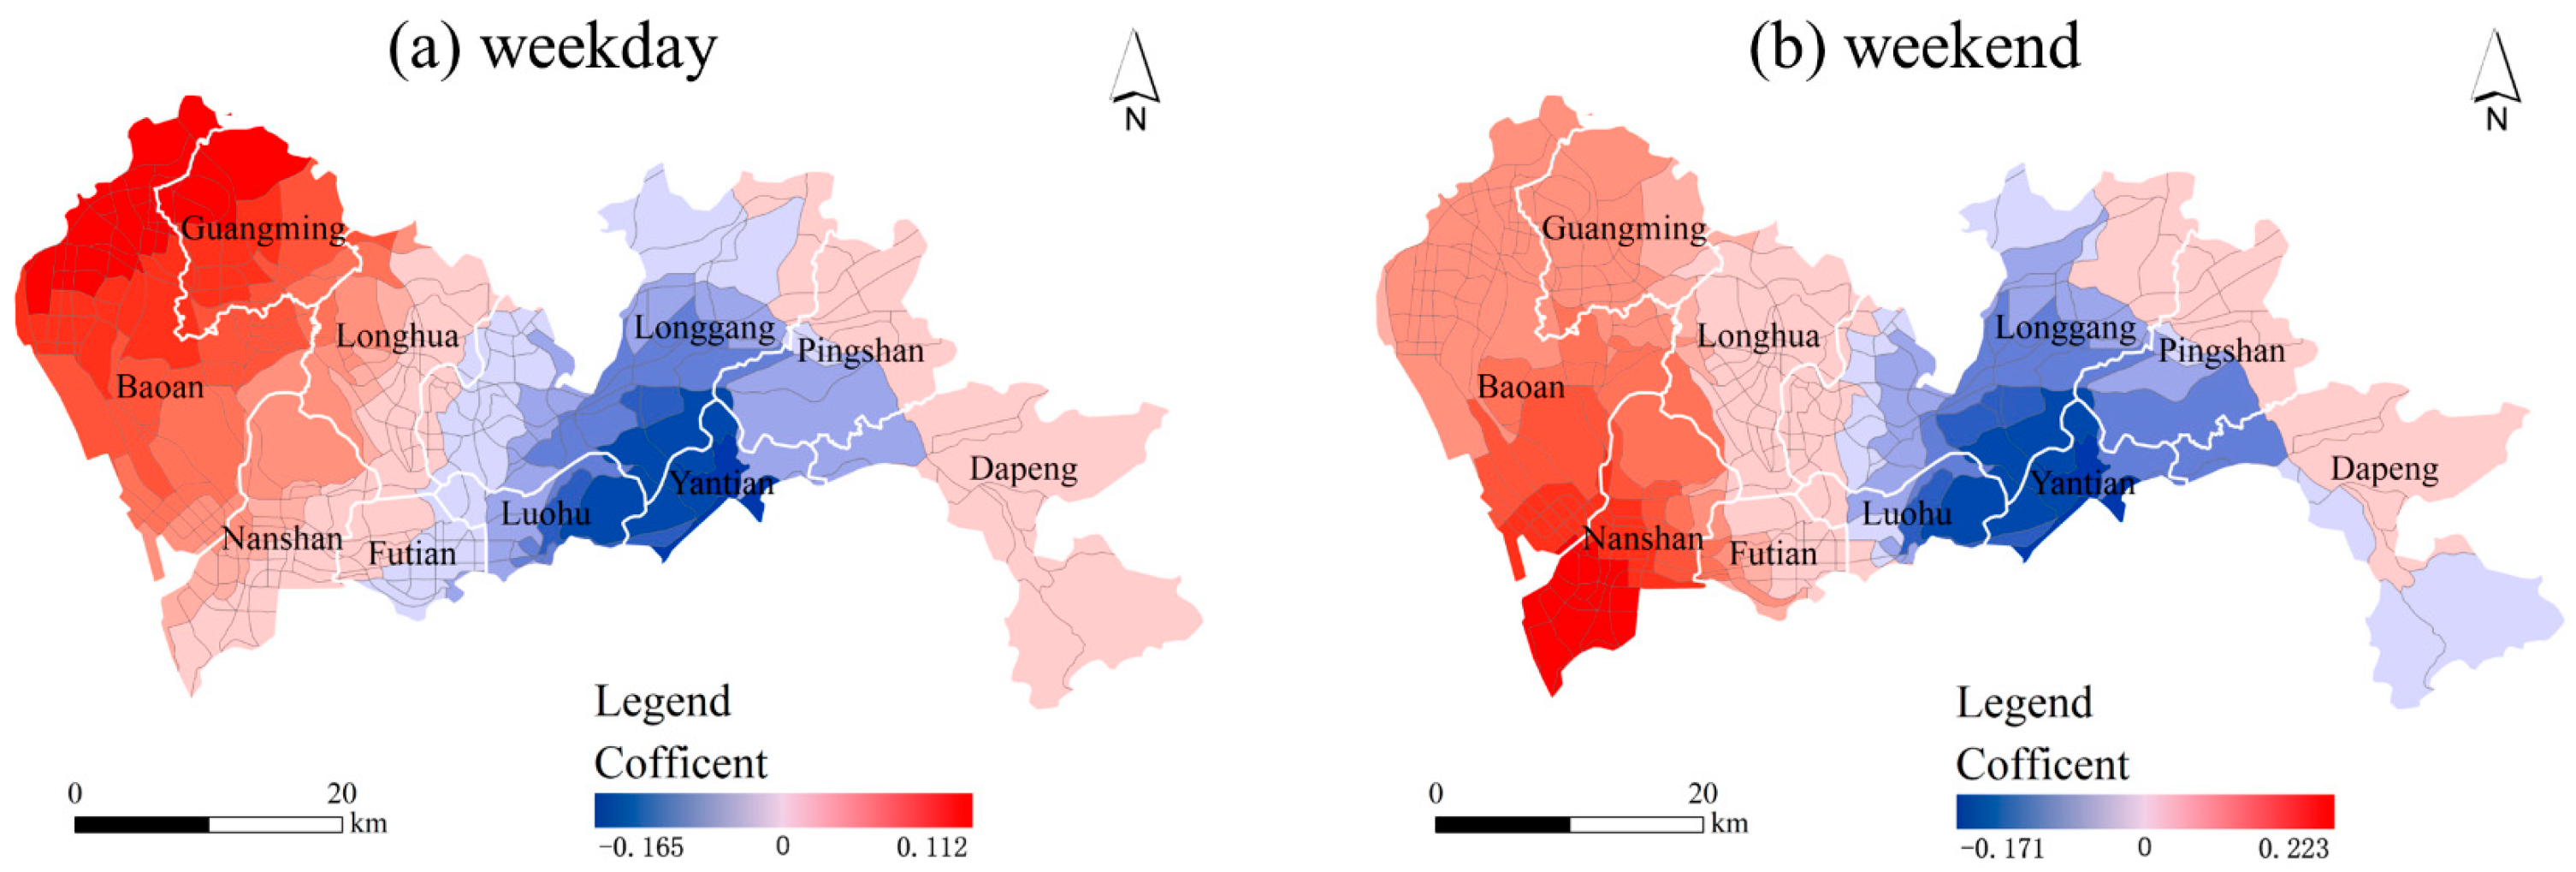
Coefficient map of distance to CBD.
Figure 13.
Coefficient map of distance to CBD.
Except for in Dapeng New District and the eastern part of Pingshan District, distance from the CBD mainly showed a negative correlation with urban vitality. This means that, the closer an area was to the CBD, the higher its urban vitality. The CBD serves as the hub for economic, technological, and cultural activities, and benefits from excellent municipal transportation and infrastructure. As a result, it plays a crucial role in enhancing urban vitality. However, it is important to note that the influence of the CBD on surrounding areas is somewhat limited. To this end, we proposed building a polycentric urban structure within Shenzhen to improve the accessibility of the entire region to the CBD. By establishing multiple centers of economic, social, and cultural activities in different parts of the city, the vitality of the total area can be enhanced.
The above results revealed that urban vitality was the result of the complex effects of different built environment factors, and different regions were affected due to their own characteristics. Therefore, urban planning strategies should be developed according to the actual situation of each region to enhance urban vitality.


