

The Analyses of Land Use and Prevention in High-Density Main Urban Areas under the Constraint of Karst Ground Subsidence: Study of Wuhan City, China

Abstract
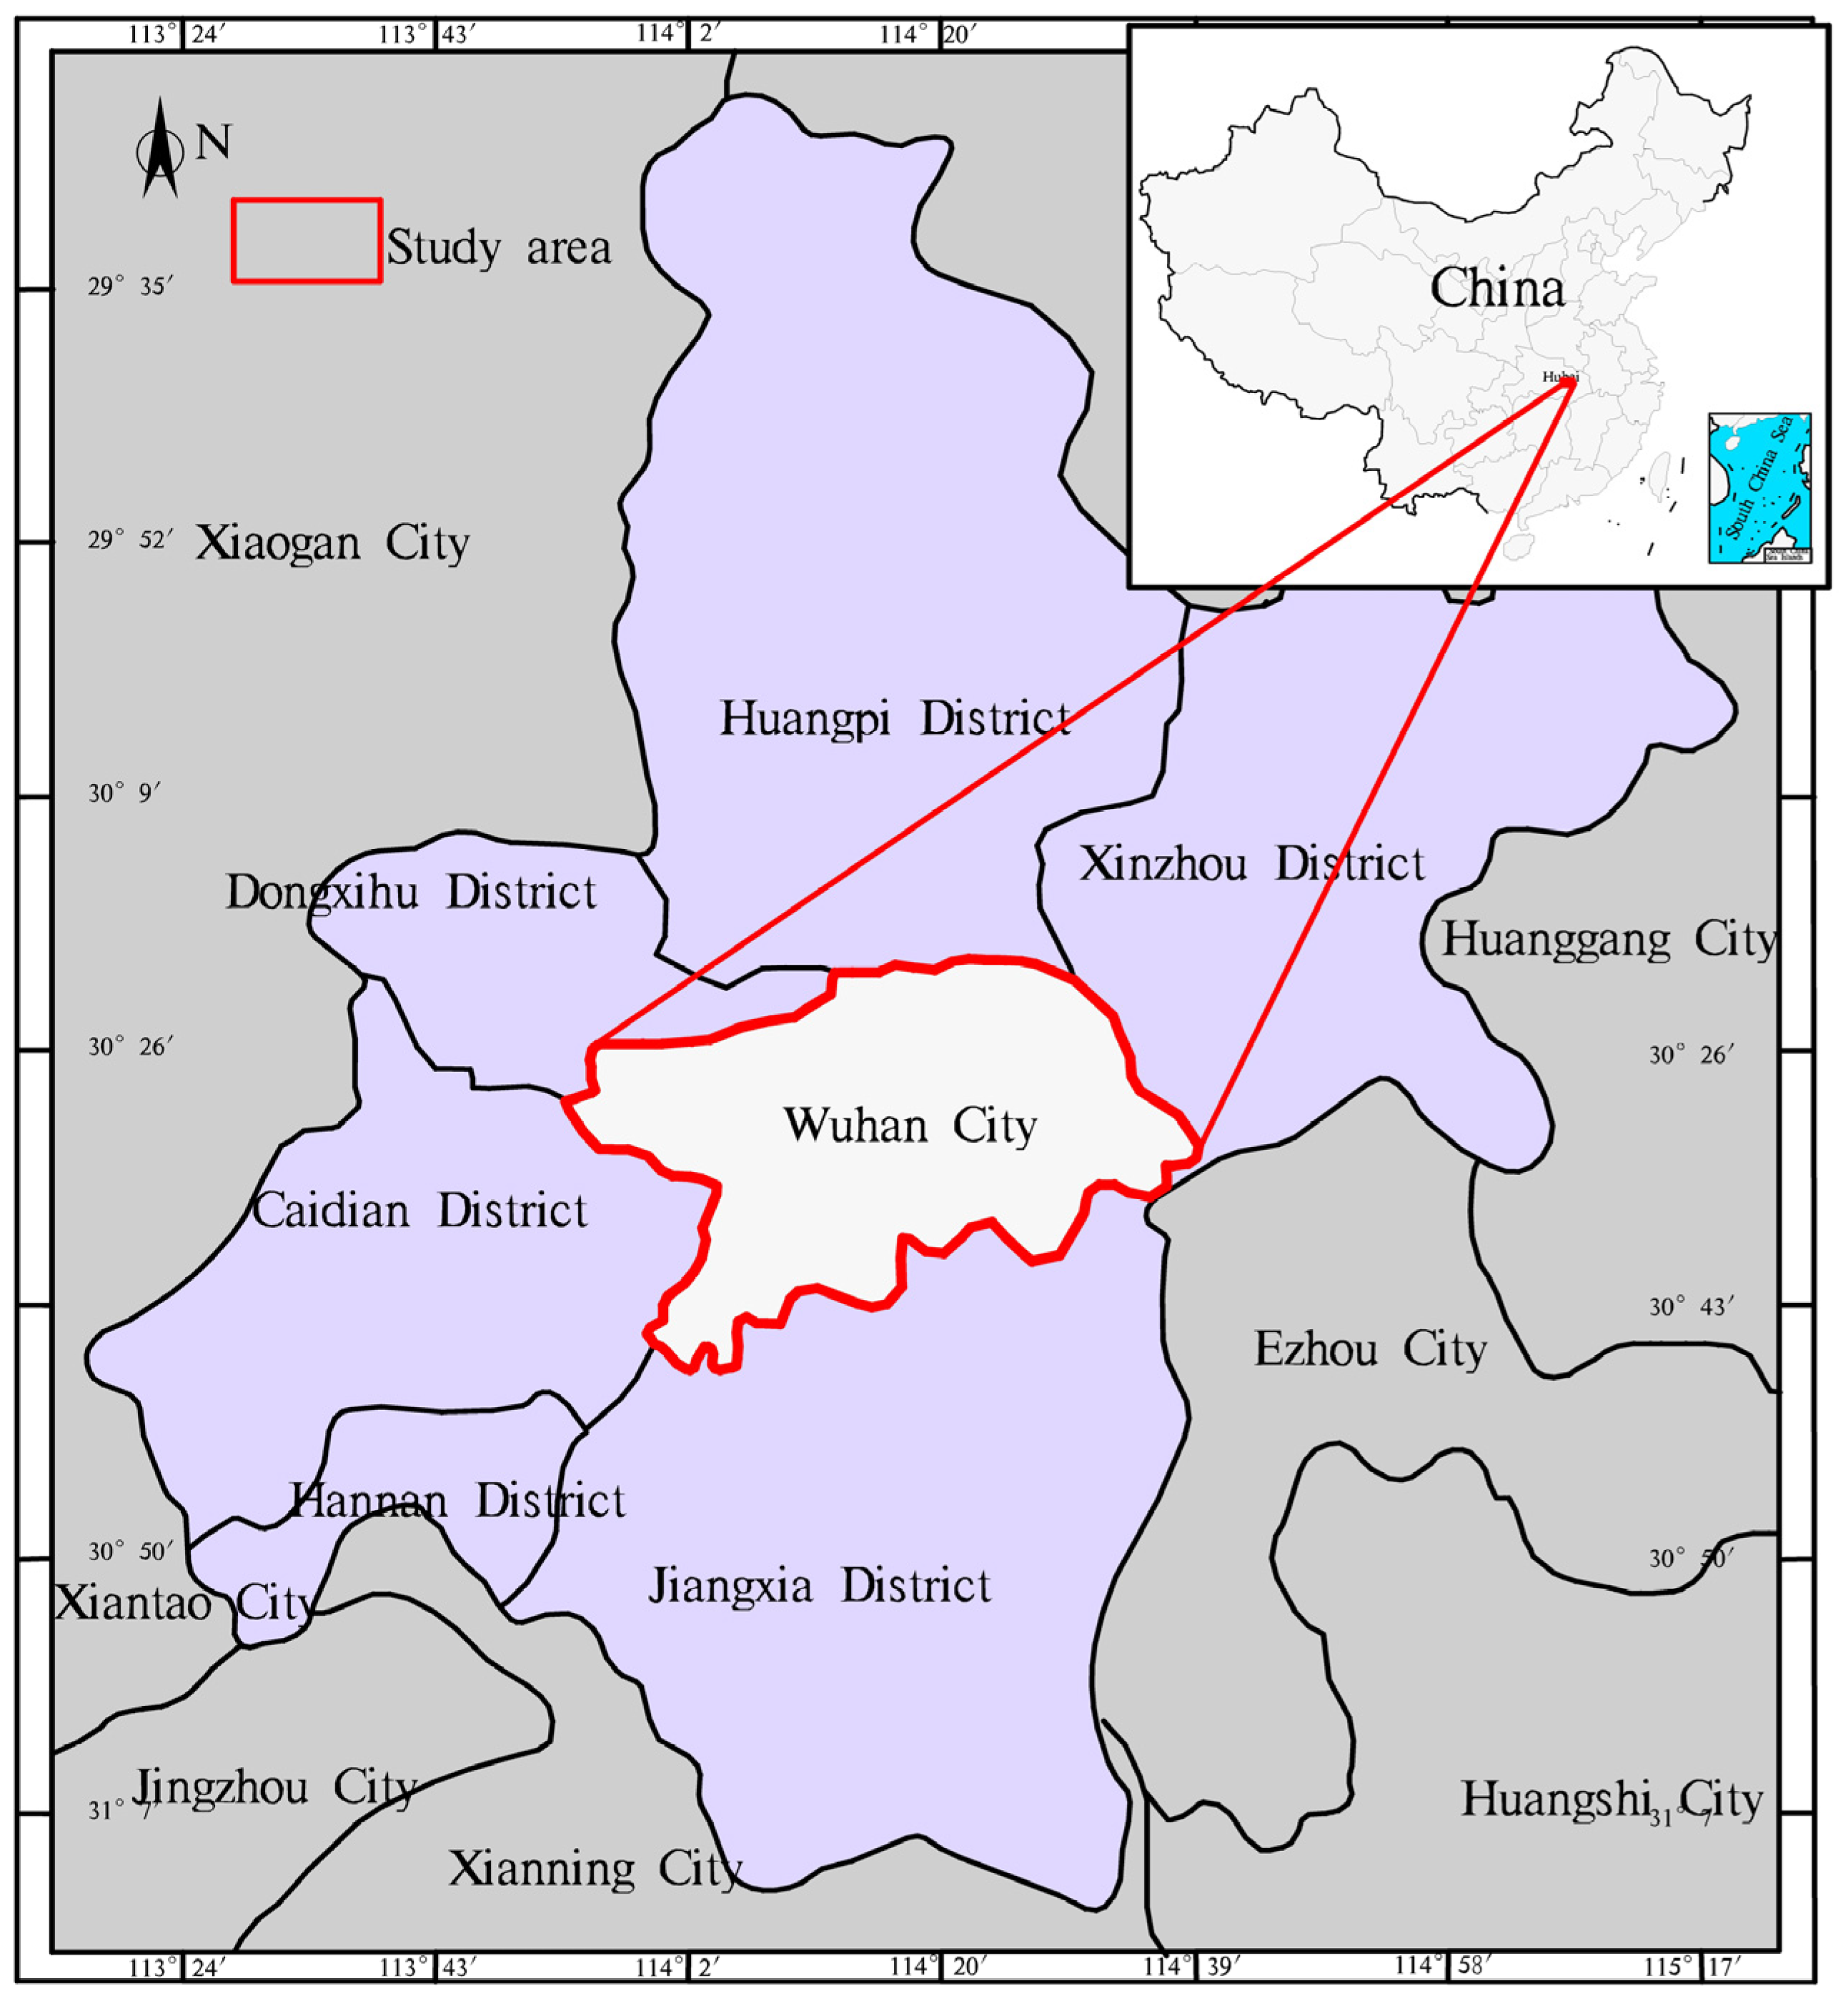
:1. Introduction
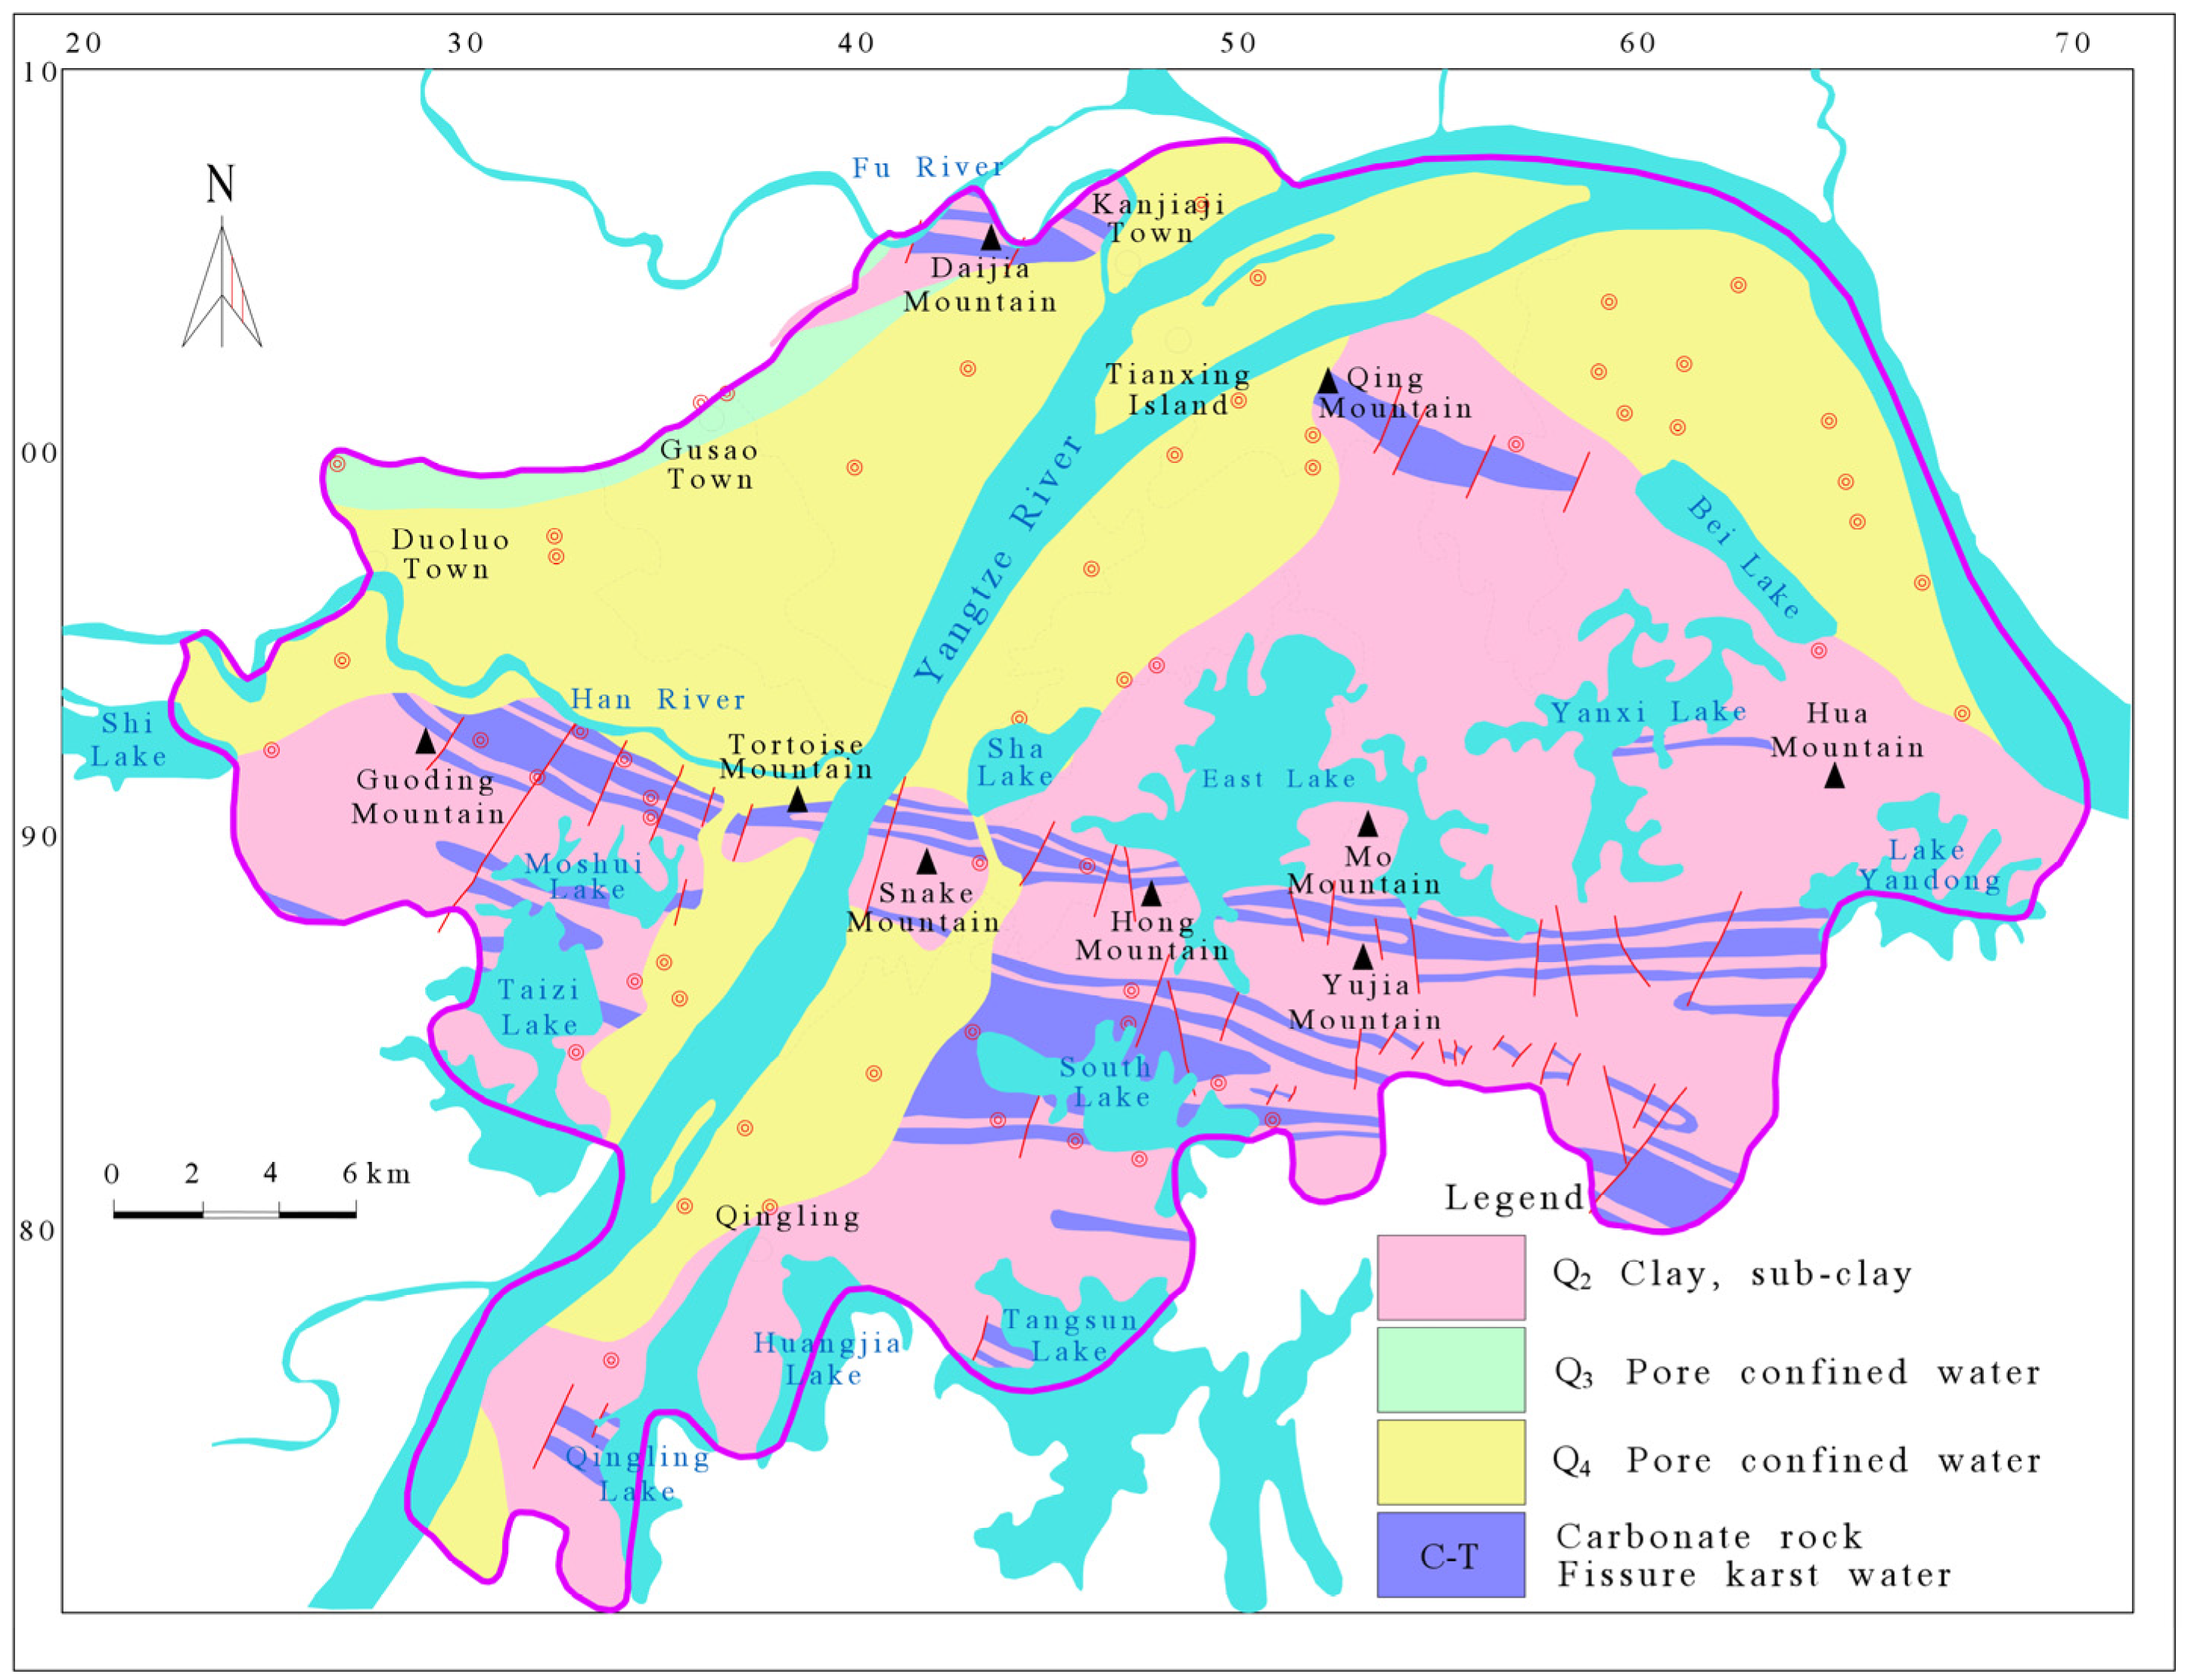
2. Karst Development Conditions
- A.
- Daijia Mountain–Qing Mountain
- B.
- Guoding Mountain–Guishan–Yujia Mountain
- C.
- Moshui Lake–South Lake
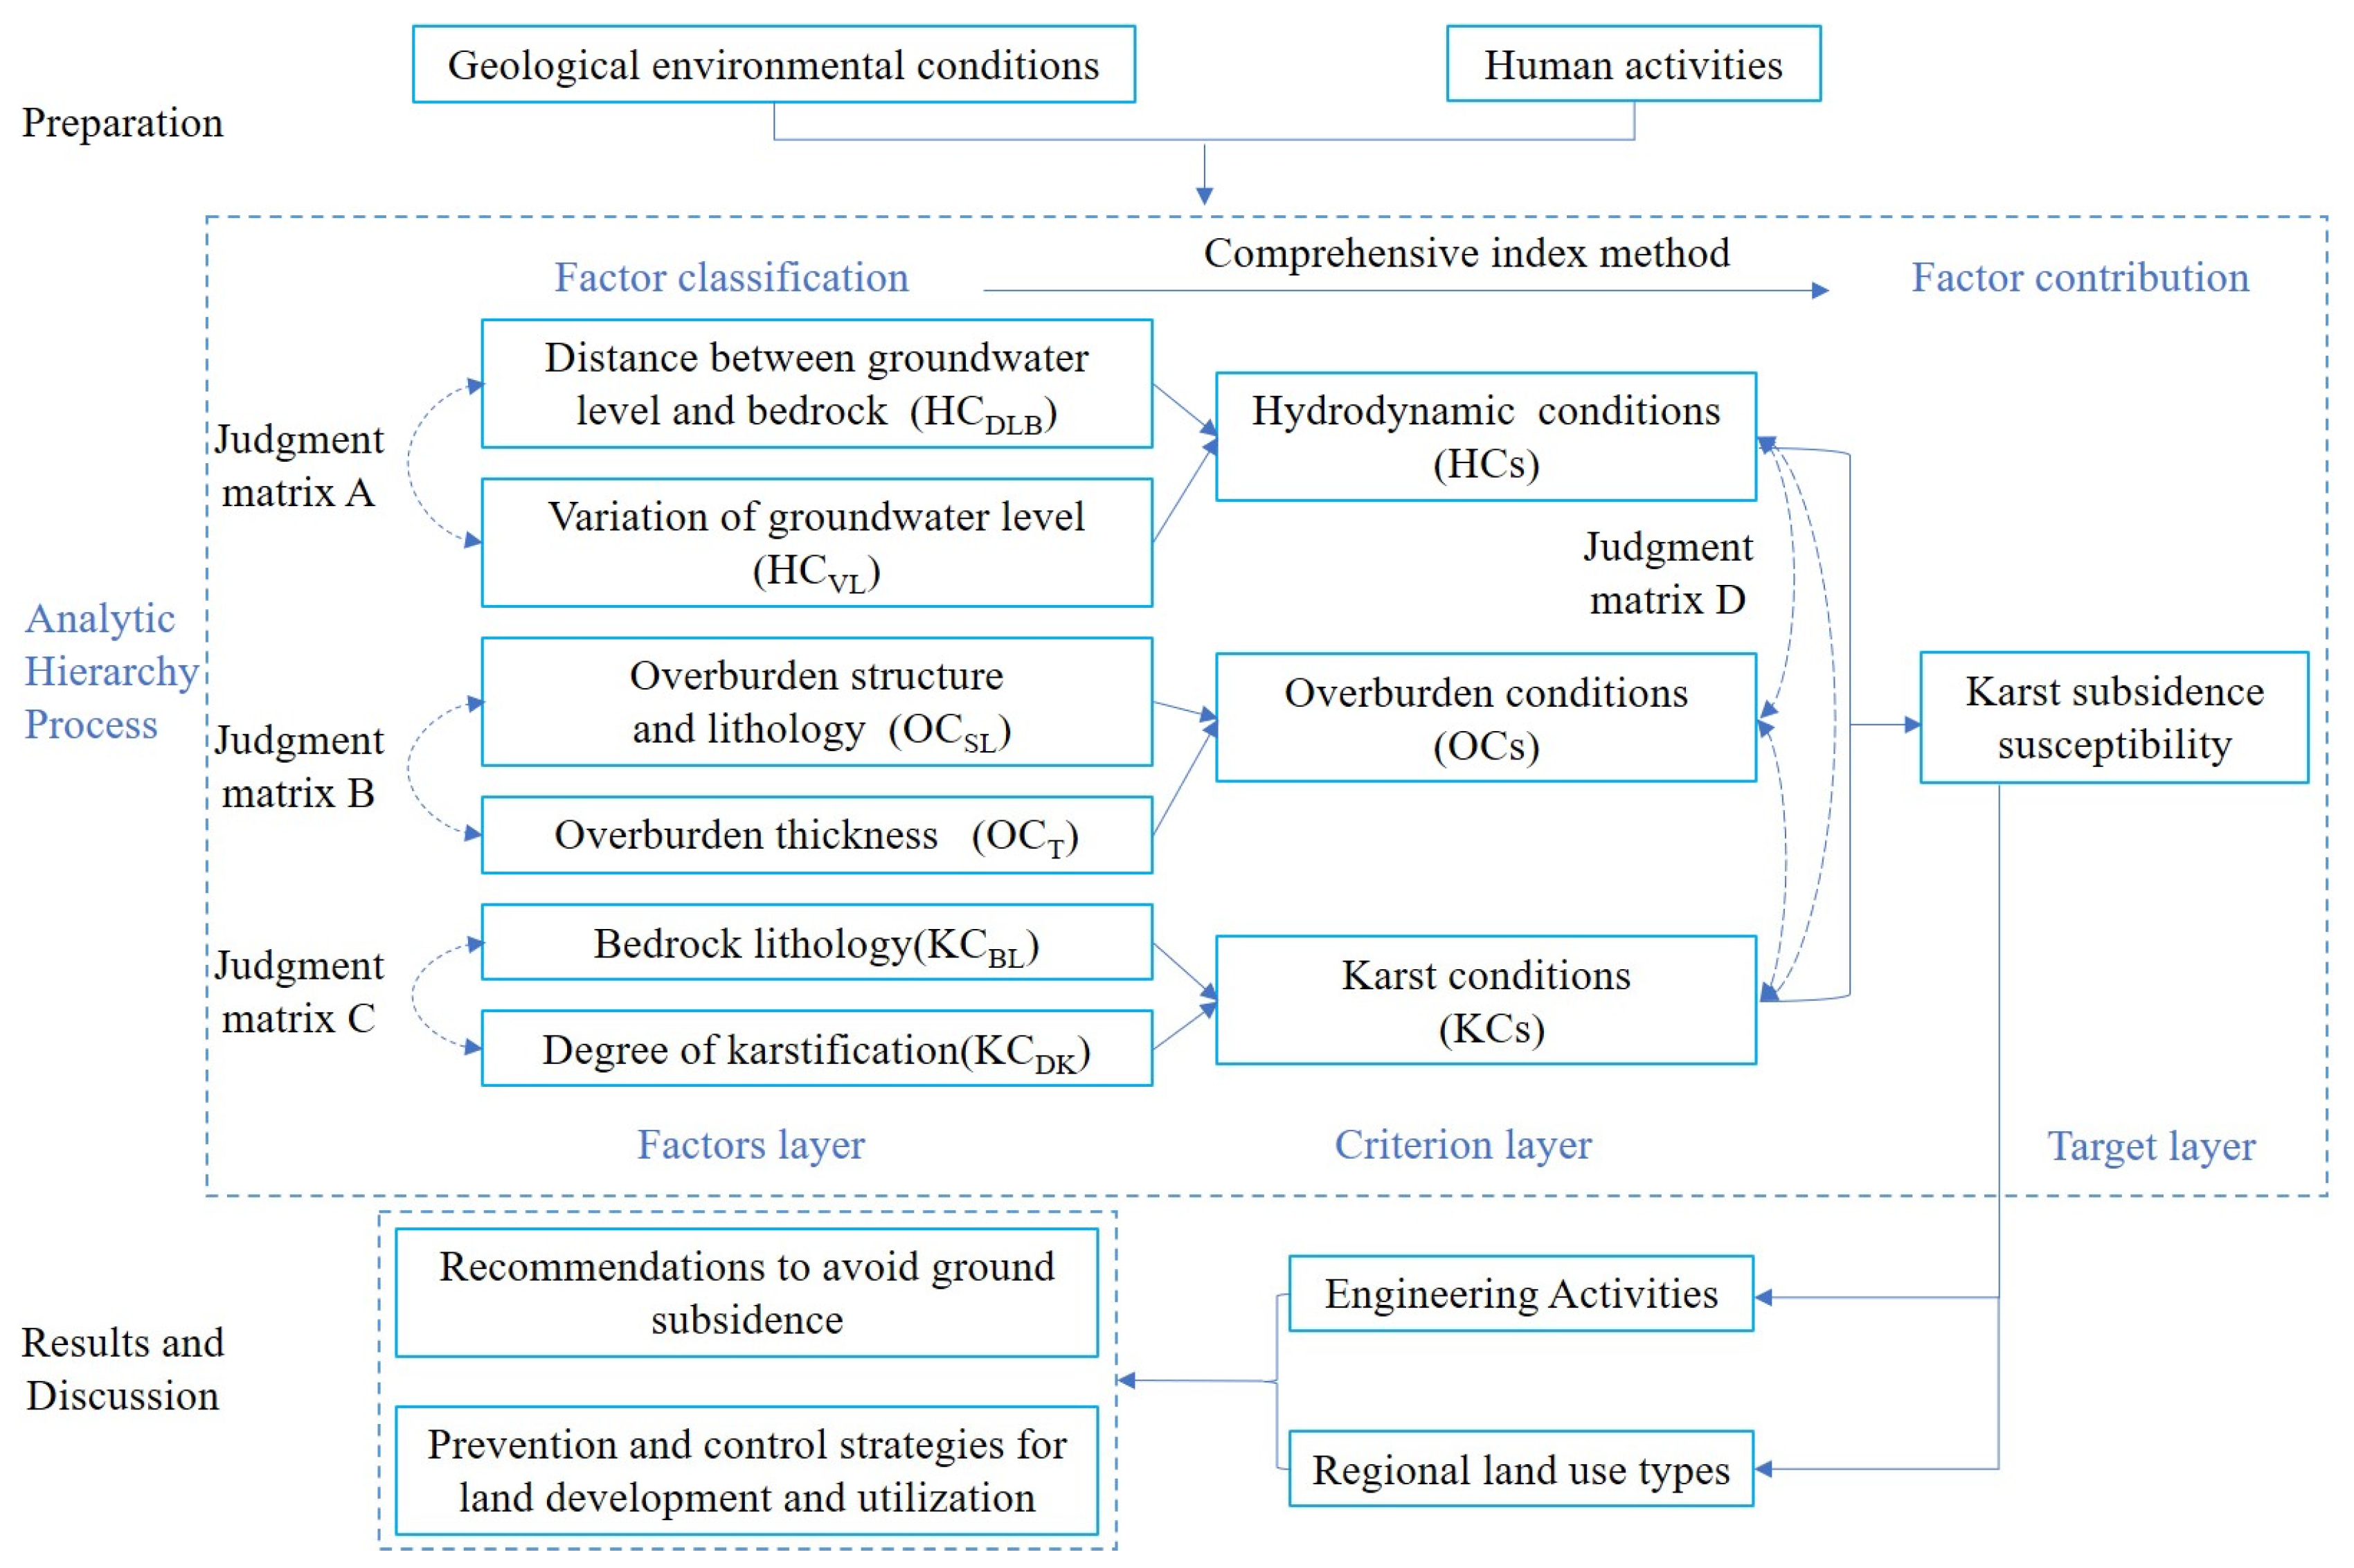
3. Method
3.1. Evaluation Model
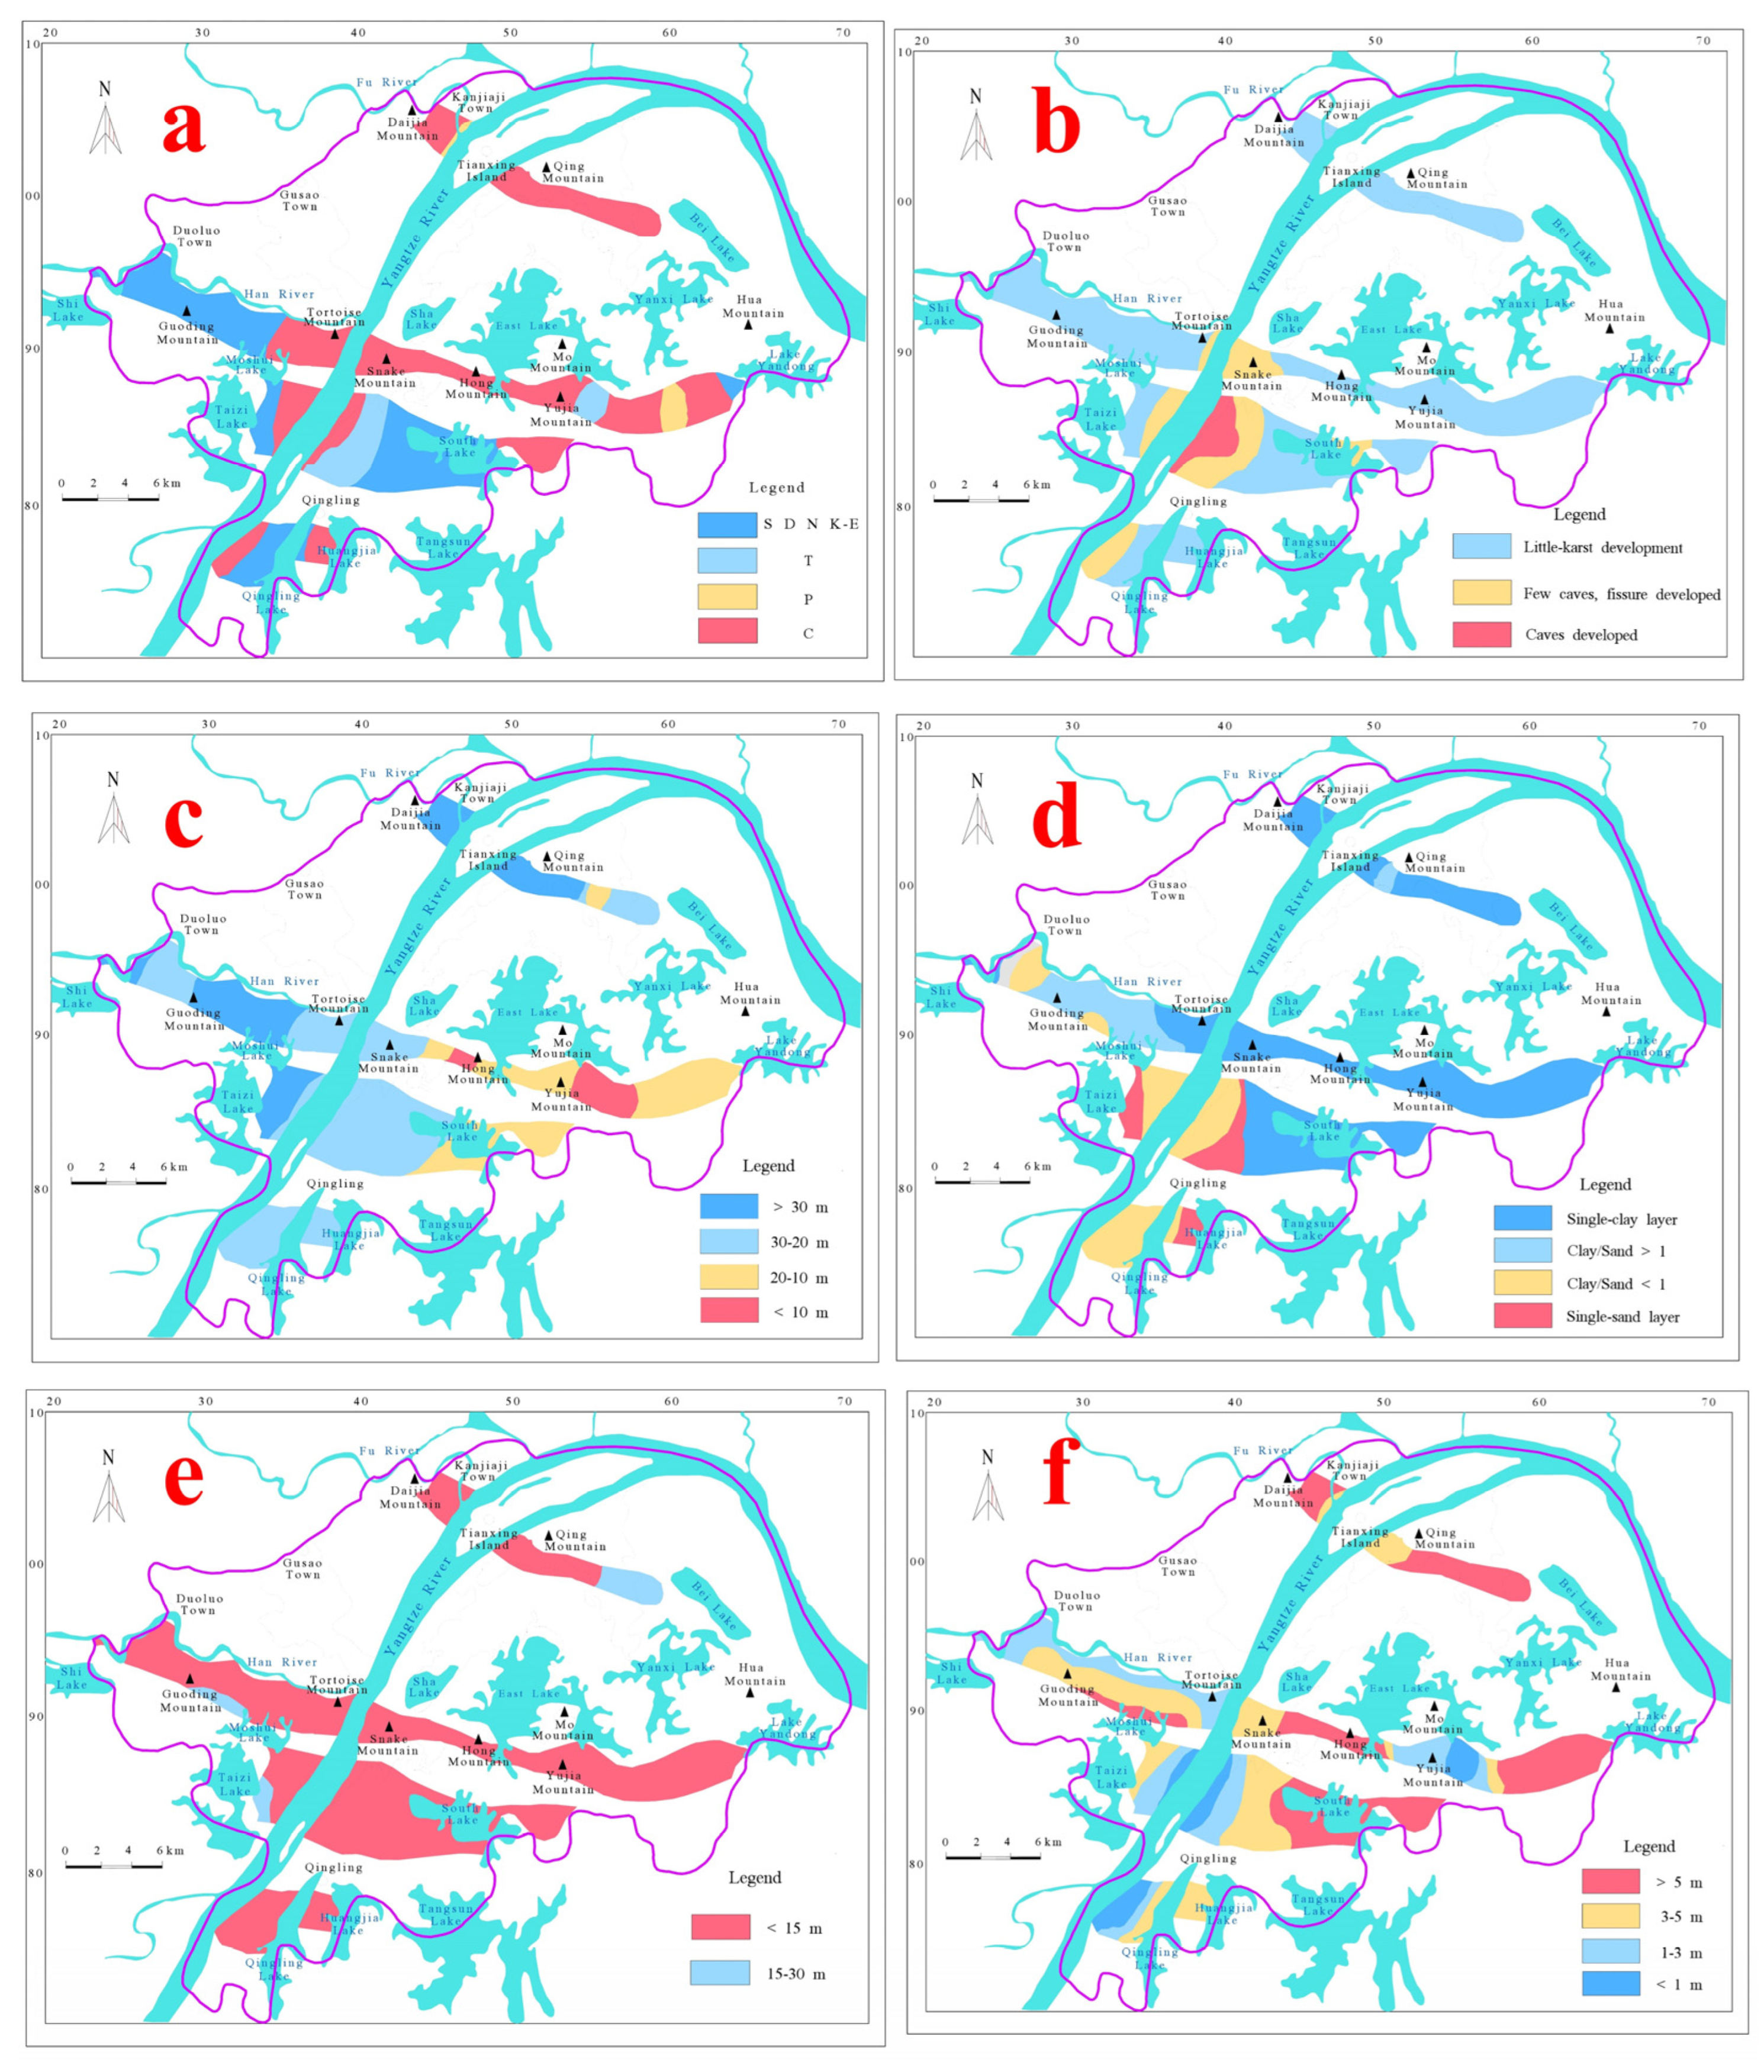
3.2. Factors Affecting Karst Ground Subsidence
- Karst conditions (KCs)
- Bedrock lithology (KCBL)
- Degree of karstification (KCDK)
- Overburden conditions (OCs)
- Overburden thickness (OCT)
- Overburden structure and lithology (OCSL)
- Hydrodynamic conditions (HCs)
- Distance between groundwater level and bedrock (HCDLB)
- Variation in groundwater level (HCVL)
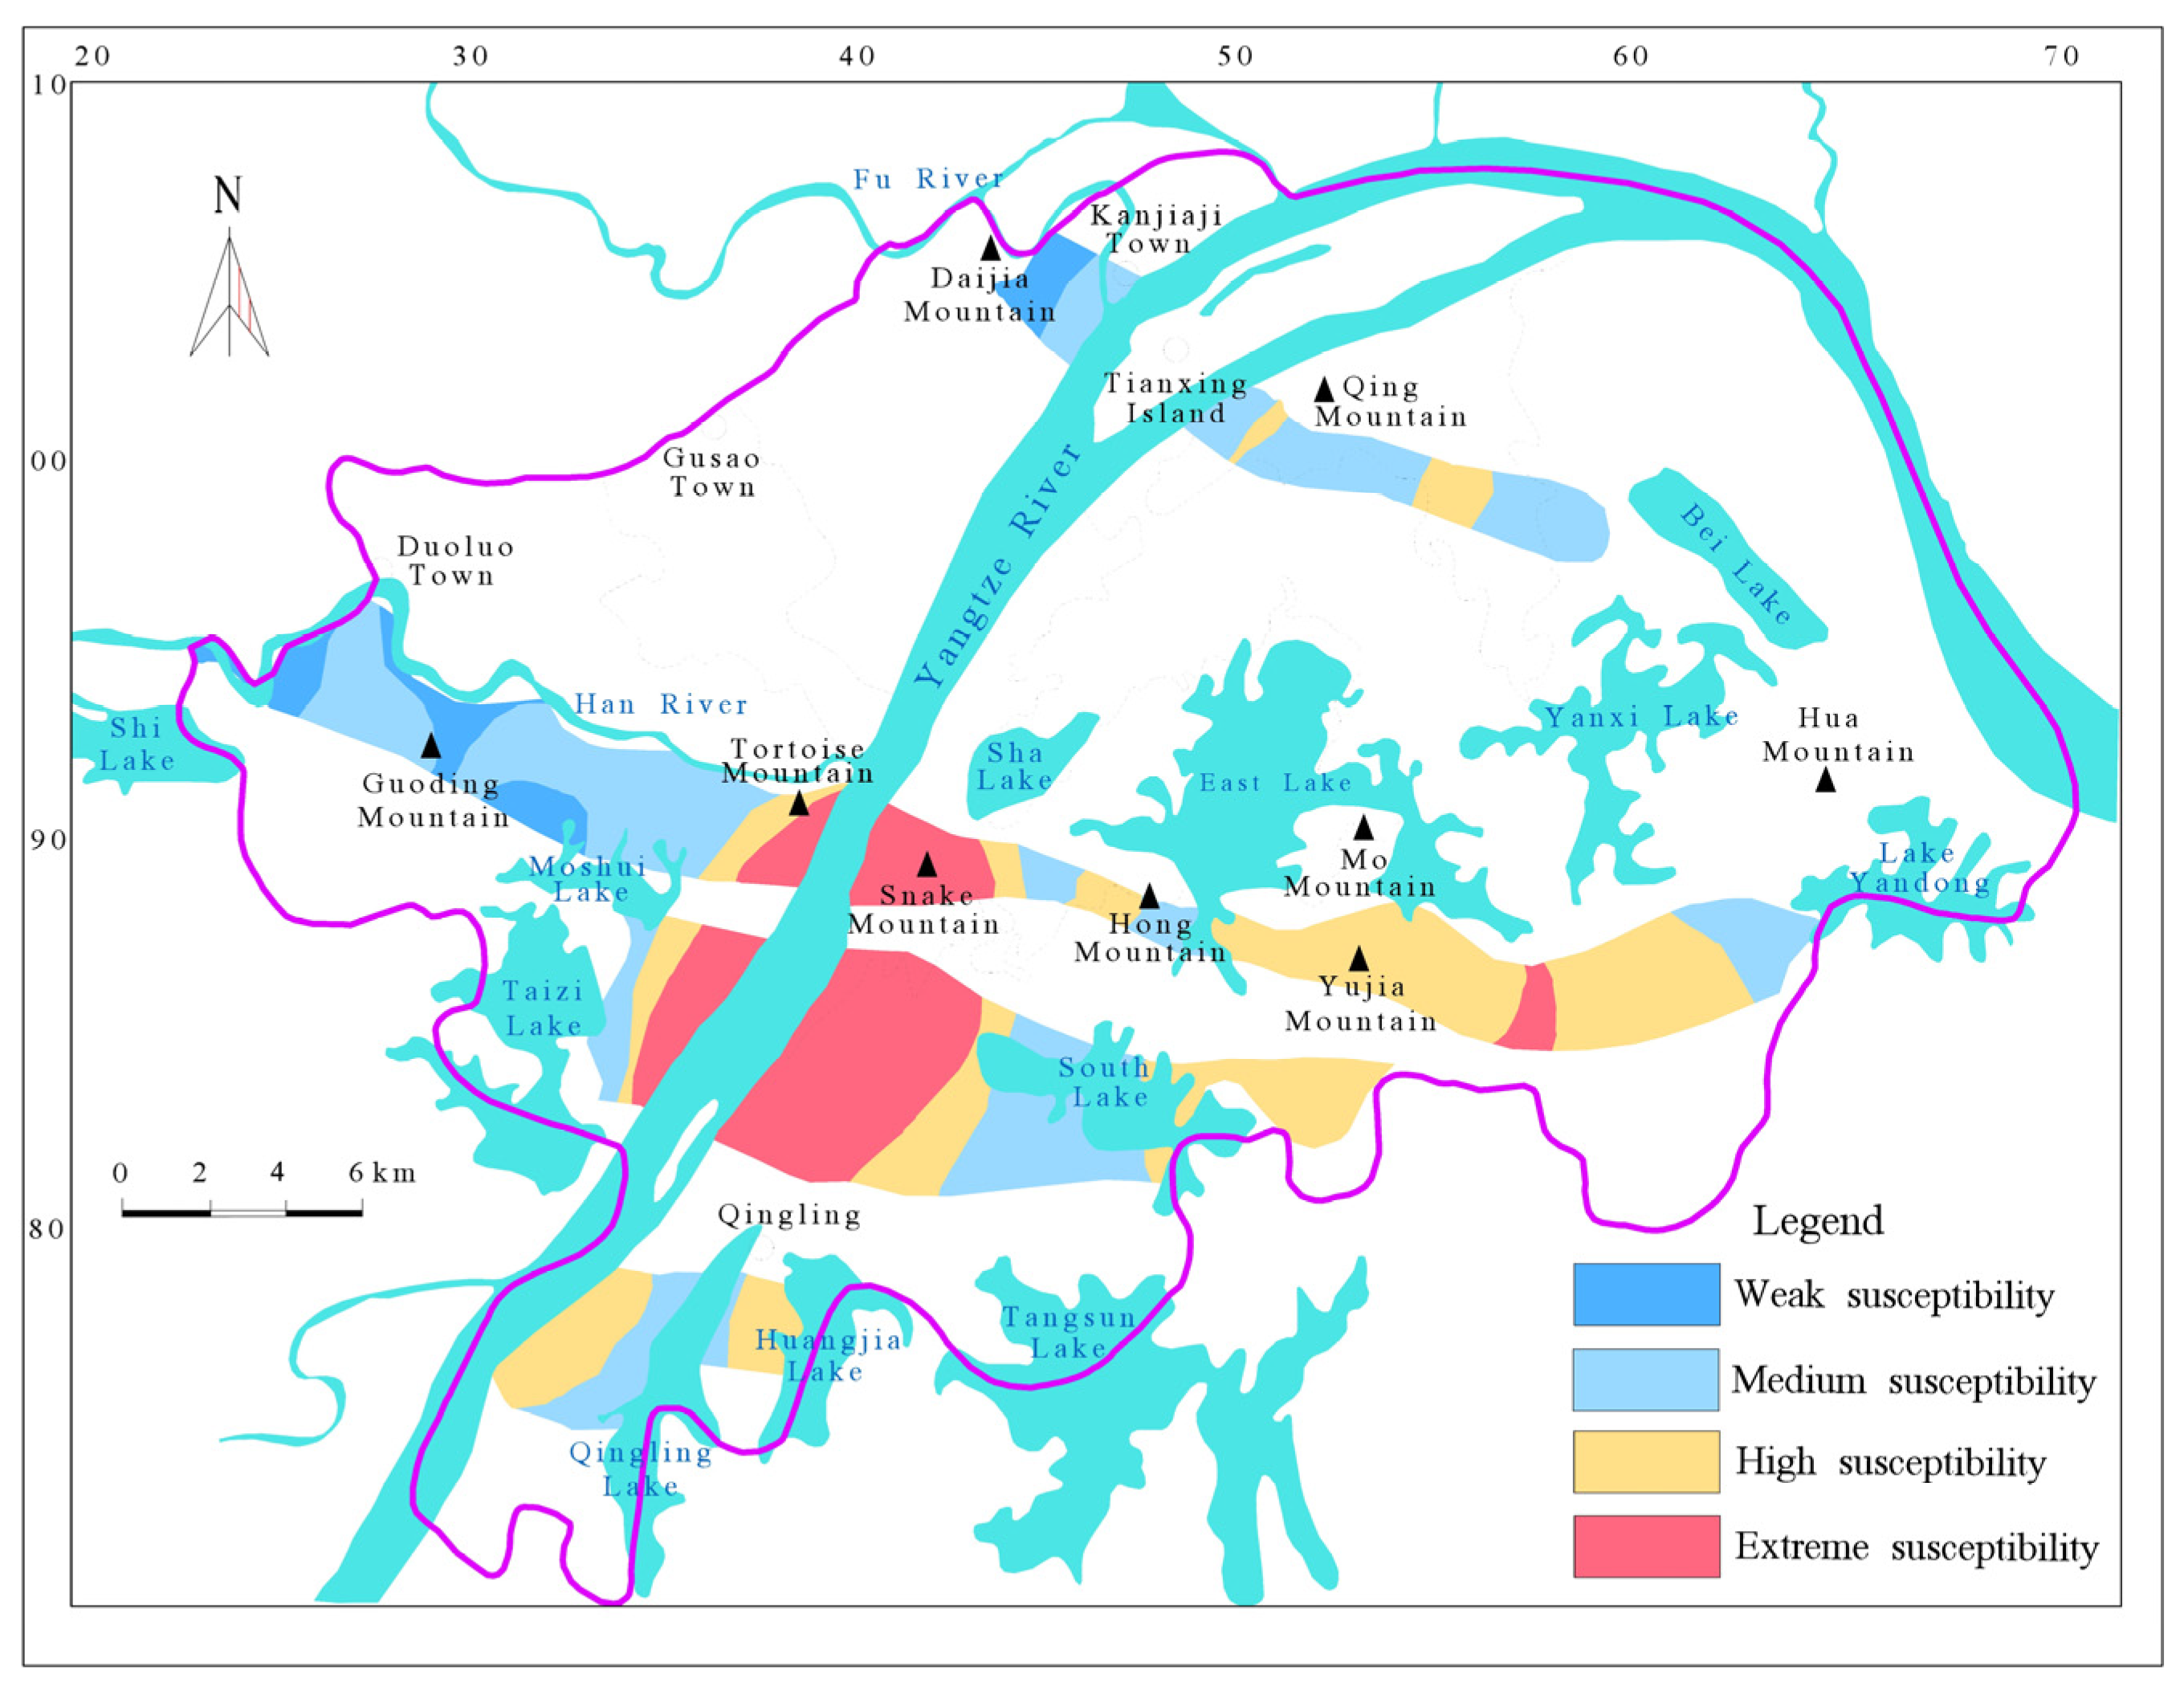
3.3. Evaluation of Susceptibility to Karst Ground Subsidence
4. Discussion
4.1. KGS Susceptibility
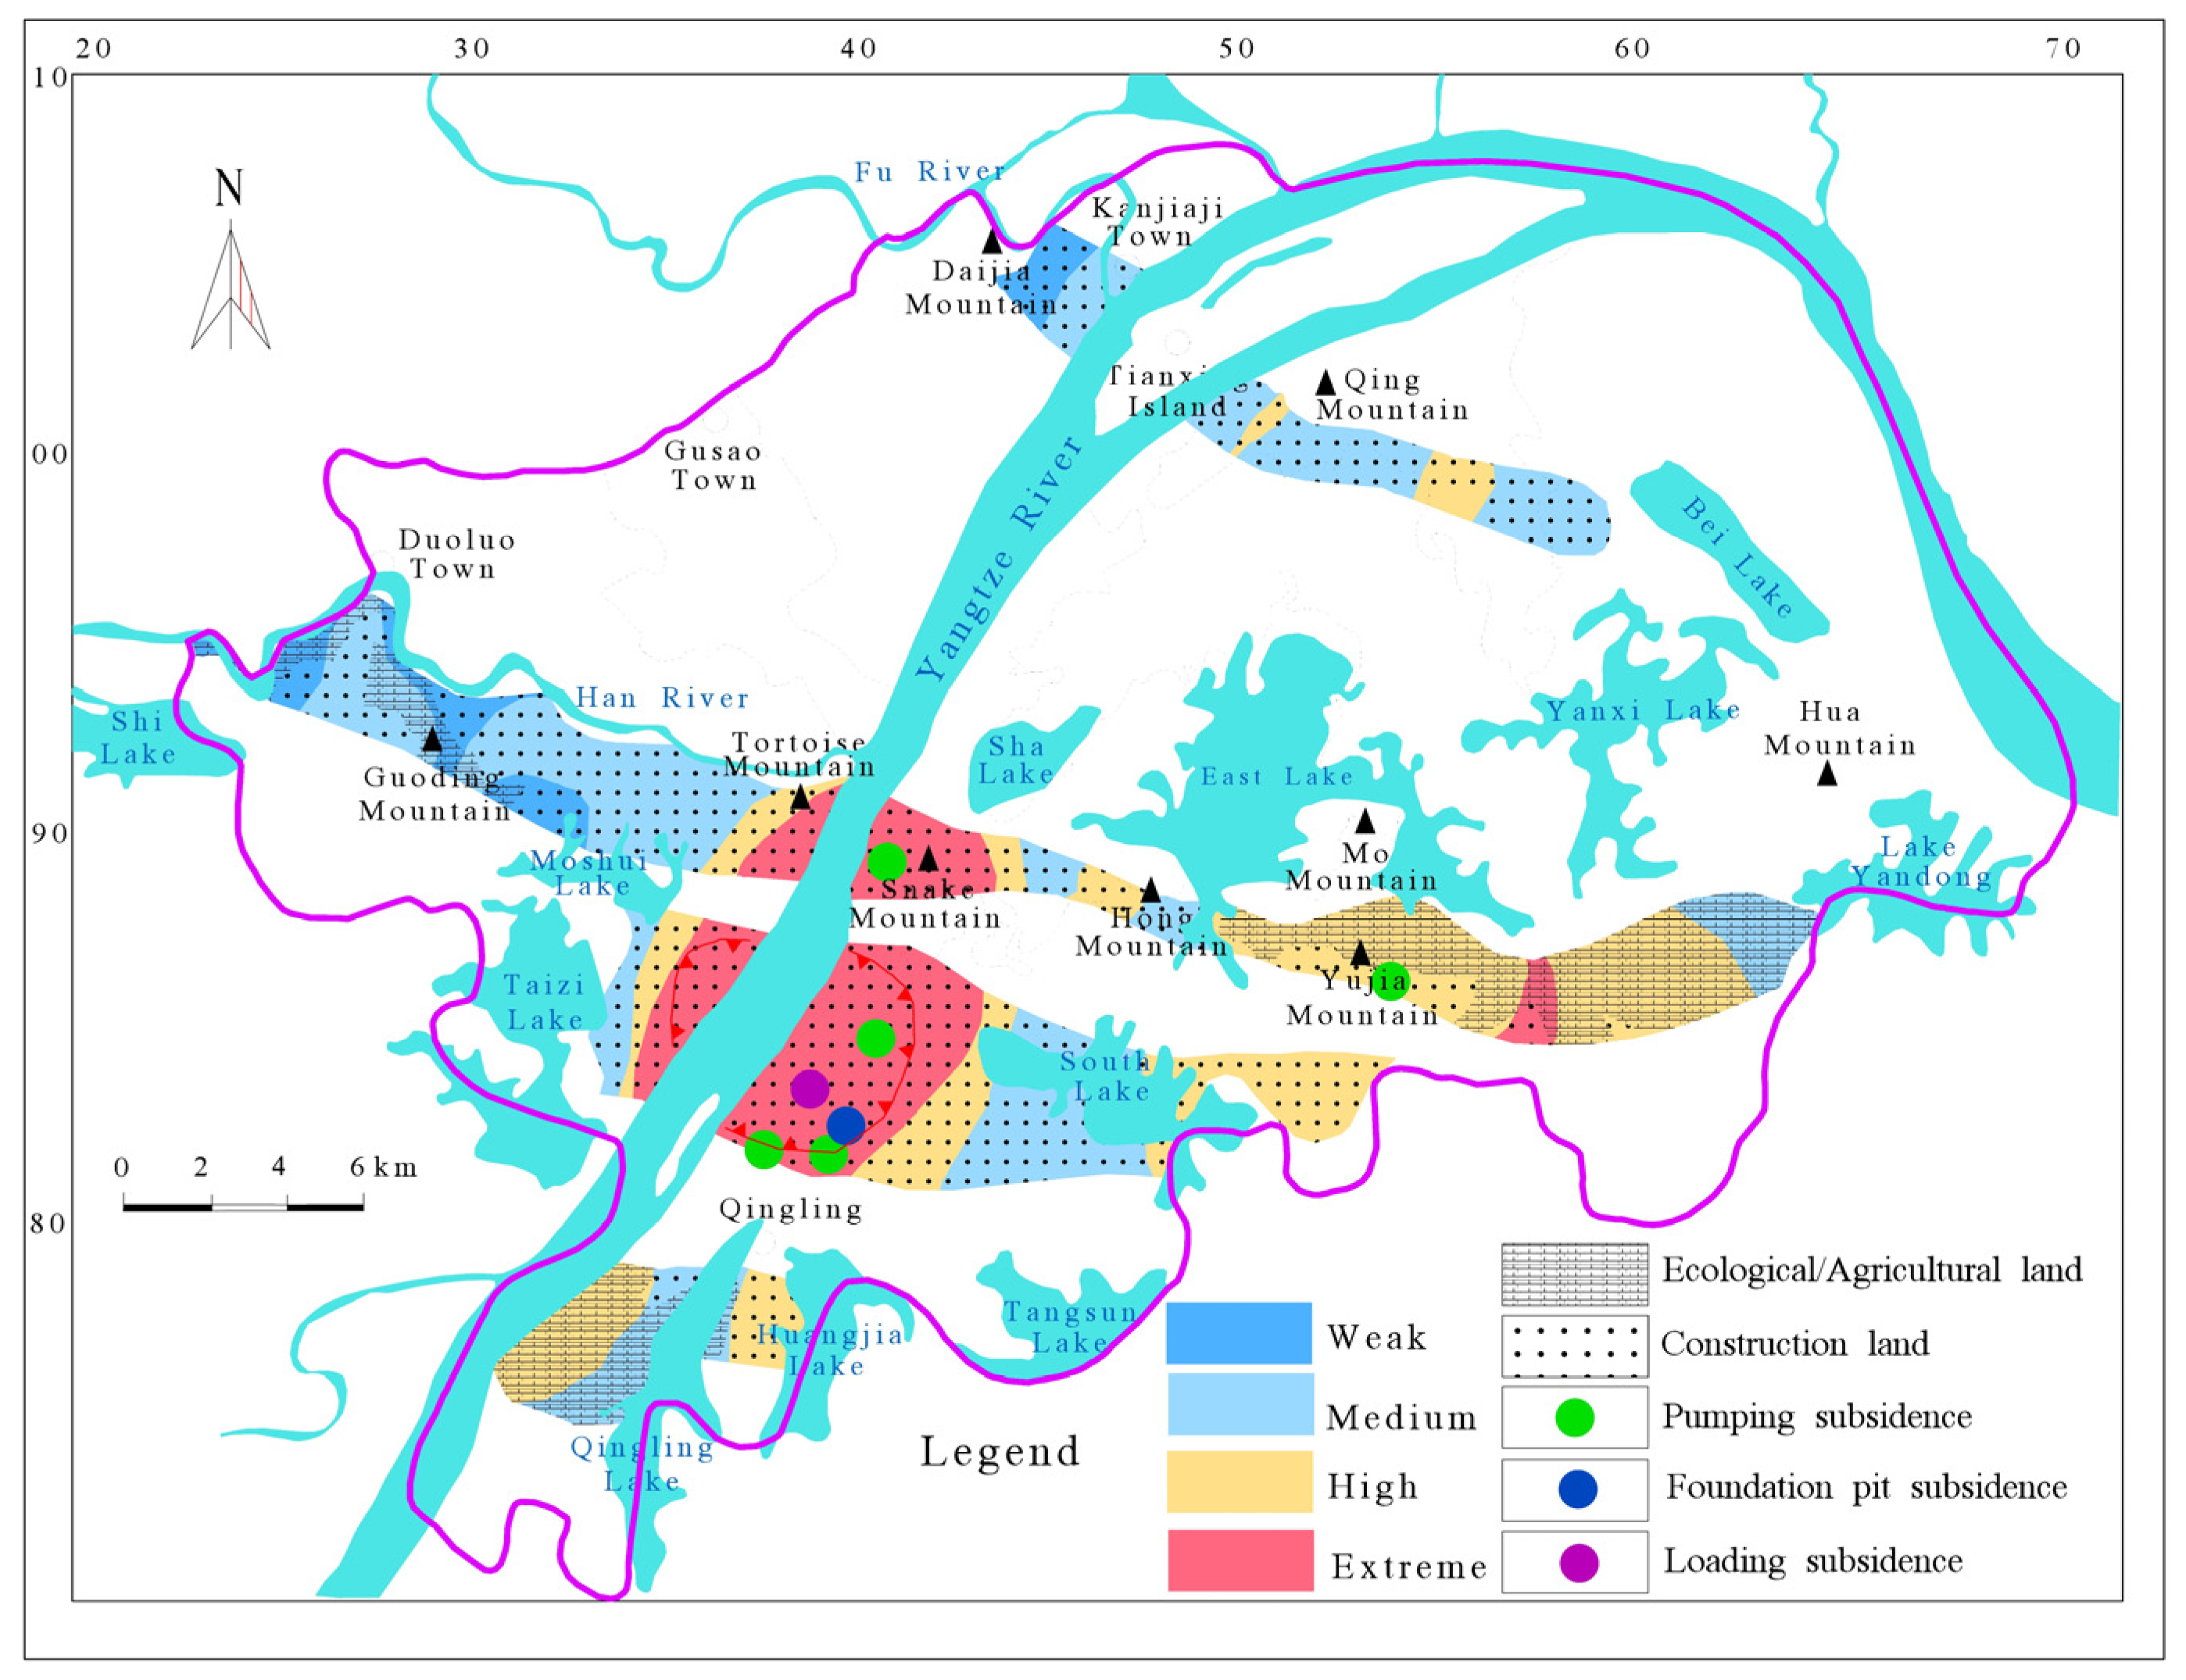
4.2. Impact of Engineering Activities
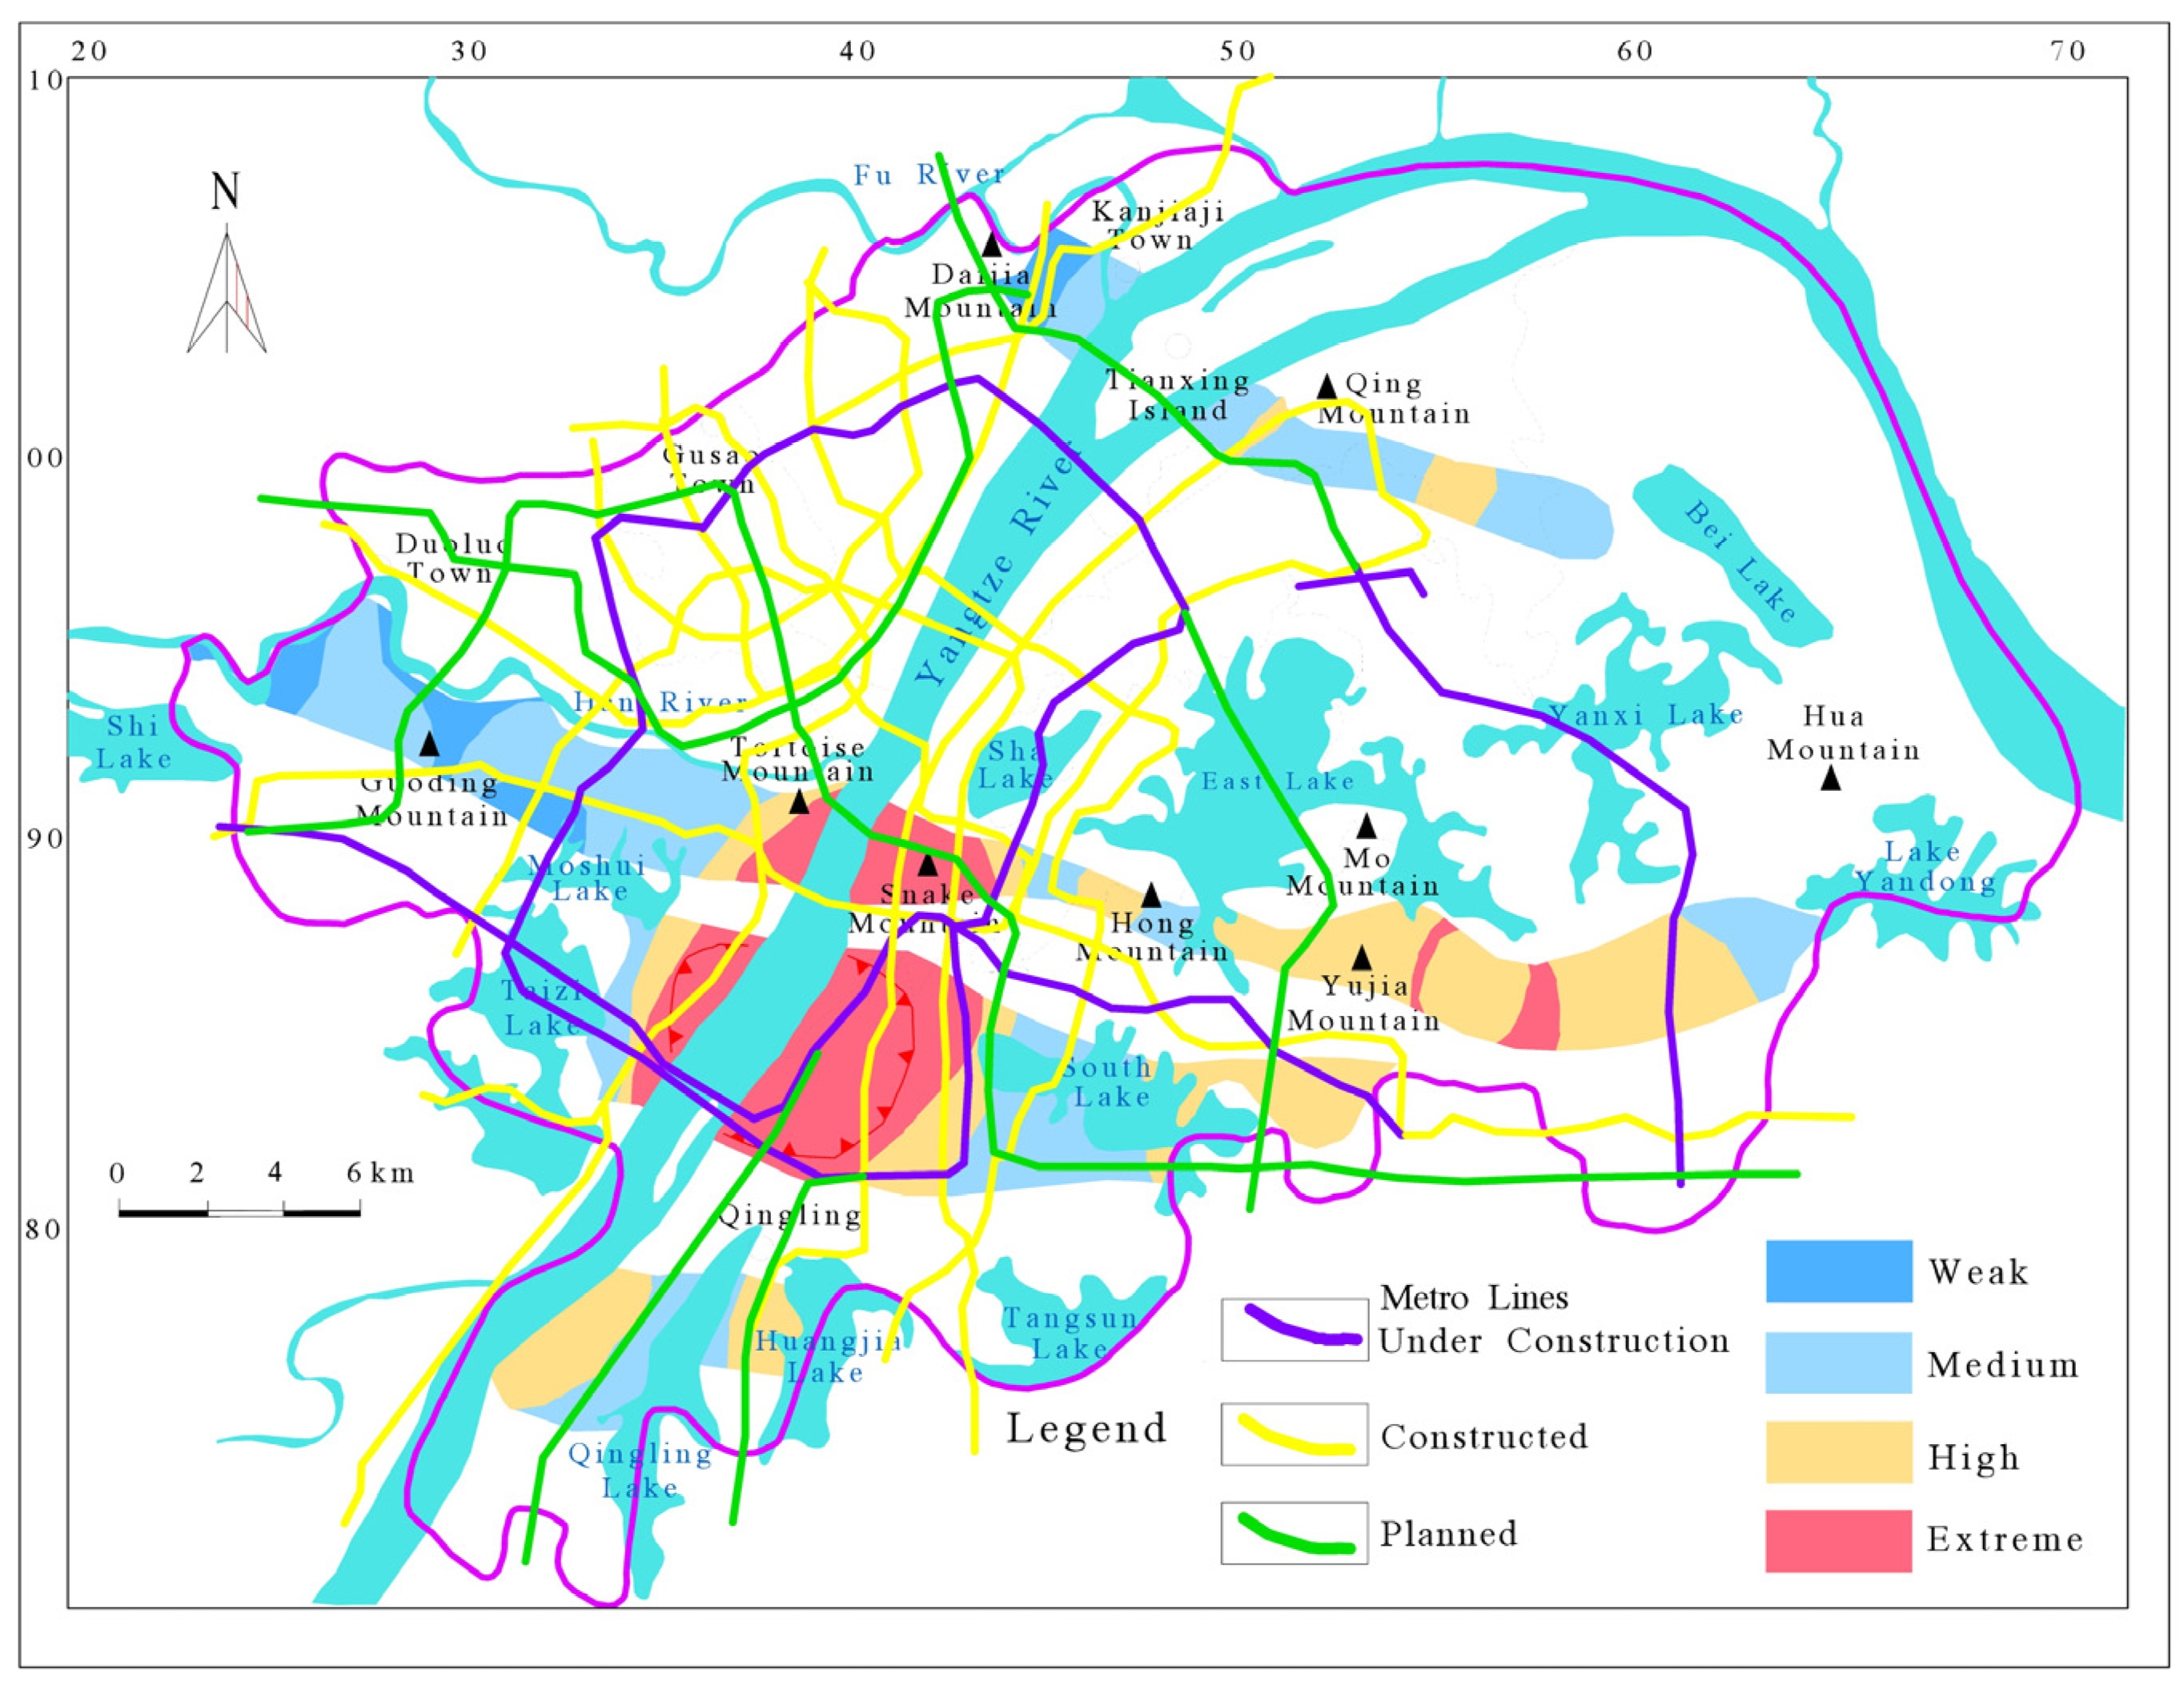
4.3. Suggestions for Partition Control
5. Conclusions
Author Contributions
Funding
Data Availability Statement
Acknowledgments
Conflicts of Interest
References
- Parise, M. Karst Geo-Hazards: Causal Factors and Management Issues Naravne Nesreče Na Krasu: Vzročni Dejavniki in Vprašanja Upravljanja. Acta Carsologica 2015, 3, 44. [Google Scholar]
- Chen, Z.; Auler, A.S.; Bakalowicz, M.; Drew, D.; Griger, F.; Hartmann, J.; Jiang, G.; Moosdorf, N.; Richts, A.; Stevanovic, Z.; et al. The World Karst Aquifer Mapping Project: Concept, Mapping Procedure and Map of Europe. Hydrogeol. J. 2017, 25, 771–785. [Google Scholar] [CrossRef]
- Goldscheider, N.; Chen, Z.; Auler, A.S.; Bakalowicz, M.; Broda, S.; Drew, D.; Hartmann, J.; Jiang, G.; Moosdorf, N.; Stevanovic, Z.; et al. Global Distribution of Carbonate Rocks and Karst Water Resources. Hydrogeol. J. 2020, 28, 1661–1677. [Google Scholar] [CrossRef]
- Murck, B.W.; Skinner, B.J.; Porter, S.C. Encyclopedia of Sustainability Science and Technology Series; Springer: Berlin/Heidelberg, Germany, 1996; Volume i, ISBN 0471303569. [Google Scholar]
- Jiang, Z.; Lian, Y.; Qin, X. Rocky Desertification in Southwest China: Impacts, Causes, and Restoration. Earth-Sci. Rev. 2014, 132, 1–12. [Google Scholar] [CrossRef]
- Tolmachev, V.V.; Neshchetkin, O.B. Evaluation of Karst Hazards for Civil and Industrial Buildings. Acta Geol. Sin.-Engl. Ed. 2010, 75, 269–274. [Google Scholar] [CrossRef]
- Ford, D.; Williams, P. Karst Hydrogeology and Geomorphology; Wiley: Hoboken, NJ, USA, 2013; ISBN 9781118684986. [Google Scholar]
- Perrin, J.; Cartannaz, C.; Noury, G.; Vanoudheusden, E. A Multicriteria Approach to Karst Subsidence Hazard Mapping Supported by Weights-of-Evidence Analysis. Eng. Geol. 2015, 197, 296–305. [Google Scholar] [CrossRef]
- Bees, A.H.; Mites, B. Water-Formed Structures Geothermometry. Science 1988, 243, 1618–1619. [Google Scholar]
- Siska, P.P.; Goovaerts, P.; Hung, I.K. Evaluating Susceptibility of Karst Dolines (Sinkholes) for Collapse in Sango, Tennessee, USA. Prog. Phys. Geogr. 2016, 40, 579–597. [Google Scholar] [CrossRef]
- YongYao, W.; ShuLin, S. Comprehensive Critical Mechanical Model of Covered Karst Collapse under the Effects of Positive and Negative Pressure. Bull. Eng. Geol. Environ. 2018, 77, 177–190. [Google Scholar] [CrossRef]
- Kaufmann, O.; Quinif, Y. Geohazard Map of Cover-Collapse Sinkholes in the “Tournaisis” Area, Southern Belgium. Eng. Geol. 2002, 65, 117–124. [Google Scholar] [CrossRef]
- Zhao, W.; Gan, F.; Meng, Y.; Zheng, Z.; Liu, X. Application of Seismic Velocity Tomography in Investigation of Karst Collapse Hazards, Guangzhou, China. Environ. Earth Sci. 2018, 77, 258. [Google Scholar] [CrossRef]
- Vierrether, C.B. Urban Development in Karst and Collapse-Prone Geologic Environments. Carbonates Evaporites 2013, 28, 23–29. [Google Scholar] [CrossRef]
- Yilmaz, I.; Marschalko, M.; Bednarik, M. An Assessment on the Use of Bivariate, Multivariate and Soft Computing Techniques for Collapse Susceptibility in GIS Environ. J. Earth Syst. Sci. 2013, 122, 371–388. [Google Scholar] [CrossRef]
- Martínez-Moreno, F.J.; Galindo-Zaldívar, J.; González-Castillo, L.; Azañón, J.M. Collapse Susceptibility Map in Abandoned Mining Areas by Microgravity Survey: A Case Study in Candado Hill (Málaga, Southern Spain). J. Appl. Geophys. 2016, 130, 101–109. [Google Scholar] [CrossRef]
- Zhong, R.; He, D.; Hu, J.; Duan, X.; Huang, J.; Cheng, X. Distribution and Susceptibility Assessment of Collapses and Landslides in the Riparian Zone of the Xiaowan Reservoir. Chin. Geogr. Sci. 2019, 29, 70–85. [Google Scholar] [CrossRef]
- Ma, C.-X.; Peng, F.-L. Monetary Evaluation Method of Comprehensive Benefits of Complex Underground Roads for Motor Vehicles Orienting Urban Sustainable Development. Sustain. Cities Soc. 2021, 65, 102569. [Google Scholar] [CrossRef]
- Maltsev, A.; Baranova, M.; Ponomarenko, A. Buildings and Constructions Safety Operation on Karstic Territories of the Samara City. MATEC Web Conf. 2017, 106, 02029. [Google Scholar] [CrossRef]
- Pueyo Anchuela, O.; Casas Sainz, A.M.; Pocoví Juan, A.; Gil Garbí, H. Assessing Karst Hazards in Urbanized Areas. Case Study and Methodological Considerations in the Mantle Karst from Zaragoza City (NE Spain). Eng. Geol. 2015, 184, 29–42. [Google Scholar] [CrossRef]
- Dos Santos, E.S.M.; Silva, R.W.S.; Sampaio, E.E.S. Analysis of the Risk of Karst Collapse in Lapão, Bahia, Brazil. Explor. Geophys. 2012, 43, 198–212. [Google Scholar] [CrossRef]
- Li, X.; Zhou, S.; Xu, G. GIS-Based Risk Assessment to Karst Susceptibility of Shenzhen Universiade Center (China). Procedia Environ. Sci. 2011, 10, 1389–1395. [Google Scholar] [CrossRef]
- Hu, J.; Motagh, M.; Wang, J.; Qin, F.; Zhang, J.; Wu, W.; Han, Y. Karst Collapse Risk Zonation and Evaluation in Wuhan, China Based on Analytic Hierarchy Process, Logistic Regression, and Insar Angular Distortion Approaches. Remote Sens. 2021, 13, 5063. [Google Scholar] [CrossRef]
- Papadopoulou-Vrynioti, K.; Bathrellos, G.D.; Skilodimou, H.D.; Kaviris, G.; Makropoulos, K. Karst Collapse Susceptibility Mapping Considering Peak Ground Acceleration in a Rapidly Growing Urban Area. Eng. Geol. 2013, 158, 77–88. [Google Scholar] [CrossRef]
- Xiong, X.; Zhou, T.; Cai, T.; Huang, W.; Li, J.; Cui, X.; Li, F. Land Use Transition and Effects on Ecosystem Services in Water-Rich Cities under Rapid Urbanization: A Case Study of Wuhan City, China. Land 2022, 11, 1153. [Google Scholar] [CrossRef]
- Liu, S.-C.; Peng, F.-L.; Qiao, Y.-K.; Zhang, J.-B. Evaluating Disaster Prevention Benefits of Underground Space from the Perspective of Urban Resilience. Int. J. Disaster Risk Reduct. 2021, 58, 102206. [Google Scholar] [CrossRef]
- Hao, J.; Lin, Q.; Wu, T.; Chen, J.; Li, W.; Wu, X.; Hu, G.; La, Y. Spatial–Temporal and Driving Factors of Land Use/Cover Change in Mongolia from 1990 to 2021. Remote Sens. 2023, 15, 1813. [Google Scholar] [CrossRef]
- Tan, R.; Liu, Y.; Liu, Y.; He, Q.; Ming, L.; Tang, S. Urban Growth and Its Determinants across the Wuhan Urban Agglomeration, Central China. Habitat Int. 2014, 44, 268–281. [Google Scholar] [CrossRef]
- Lai, W.; Shen, Q.; Wang, H.; Shum, C.K.; Jiang, L.; Yang, B.; Dong, J.; Gao, F.; Zhao, Y.; Liu, T. InSAR-Derived Land Subsidence in Wuhan between 2015 and 2020. All Earth 2022, 34, 224–242. [Google Scholar] [CrossRef]
- Greater London Authority. 2021. Available online: Https://Data.London.Gov.Uk/ (accessed on 19 September 2022).
- United States Census Bureaus. 2021. Available online: Www.Census.Gov (accessed on 19 September 2022).
- Statistical Office of the Prime Minister’s Office of Japan. 2021. Available online: Www.e-Stat.Go.Jp (accessed on 19 September 2022).
- Hu, X.; Gao, L.; Ma, C.; Hu, X. Land Use Zoning of Weifang North Plain Based on Ecological Function and Geo-Environmental Suitability. Bull. Eng. Geol. Environ. 2020, 79, 2697–2719. [Google Scholar] [CrossRef]
- Chen, J.; MA, I. Urban Growth Pattern Modelling: A Case Study of Wuhan City, PR China. Landsc. Urban Plan. 2015, 62, 199–217. [Google Scholar] [CrossRef]
- Qiu, Y.; Zhou, A.; Li, M.; Guo, Y.; Cui, H.; Ma, C. Territorial Spatial Usage Regulation Based on Resources Endowment and Sustainable Development: A Case of Wuhan, China. J. Clean. Prod. 2023, 385, 135771. [Google Scholar] [CrossRef]
- Guo, Z.; Guo, H. The Impact of Metro Construction on Regional Economy-Wuhan as an Example. Financ. Econ. 2014, 2, 86–87. (In Chinese) [Google Scholar] [CrossRef]
- Zheng, S.; Hu, X.; Wang, J.; Wang, R. Subways near the Subway: Rail Transit and Neighborhood Catering Businesses in Beijing. Transp. Policy 2016, 51, 81–92. [Google Scholar] [CrossRef]
- Ting, Y. The Research of the Post Evaluation of Socio-Economic Impacts on Tianjin Subway Construction Project; Hebei University of Technology: Tianjin, China, 2014. [Google Scholar]
- Du, N.; Ottens, H.; Sliuzas, R. Spatial Impact of Urban Expansion on Surface Water Bodies—A Case Study of Wuhan, China. Landsc. Urban Plan. 2010, 94, 175–185. [Google Scholar] [CrossRef]
- Li, G.; Sun, S.; Fang, C. The Varying Driving Forces of Urban Expansion in China: Insights from a Spatial-Temporal Analysis. Landsc. Urban Plan. 2018, 174, 63–77. [Google Scholar] [CrossRef]
- Song, Y.; Yeung, G.; Zhu, D.; Xu, Y.; Zhang, L. Efficiency of Urban Land Use in China’s Resource-Based Cities, 2000–2018. Land Use Policy 2022, 115, 106009. [Google Scholar] [CrossRef]
- Li, X.; Yin, K.; Chen, B.; Li, Y.; Chao, J.; Li, J. Evaluation of Susceptibility to Karst Collapse on Both Sides of the Yangtze River in Baishazhou, Wuhan and Preventive Measures in the Process of Metro Construction. Bull. Geol. Sci. Technol. 2020, 39, 121–130. [Google Scholar] [CrossRef]
- Bollinger, C.R.; Ihlanfeldt, K.R. The Impact of Rapid Rail Transit on Economic Development: The Case of Atlanta’s MARTA. J. Urban Econ. 1997, 42, 179–204. [Google Scholar] [CrossRef]
- Adolphson, M.; Fröidh, O. Impact on Urban Form by the Localization of Railway Stations: Evidence from Sweden. Cities 2019, 95, 102362. [Google Scholar] [CrossRef]
- Keqiang, H.; Changli, L.; Sijing, W. Karst Collapse Mechanism and Criterion for Its Stability. Acta Geol. Sin.-Engl. Ed. 2001, 75, 330–335. [Google Scholar] [CrossRef]
- Liao, L.; Zhang, J.; Wu, K.; Yiping, G. Development Law and Risk Assessment of Karst Ground Collapse in the Third Ring Road Area of Wuhan, Hubei Province. Chin. J. Geol. Hazard Control 2018, 29, 78–86. (In Chinese) [Google Scholar] [CrossRef]
- Hu, S.; Tong, L.; Frazier, A.E.; Liu, Y. Urban Boundary Extraction and Sprawl Analysis Using Landsat Images: A Case Study in Wuhan, China. Habitat Int. 2015, 47, 183–195. [Google Scholar] [CrossRef]
- Li, Z.G.; Xiao, S.D.; Pan, Y.H.; Lu, S.W. The Hazard Assessment of Karst Surface Collapse Risk Zoning Based on BP Neural Network in Wuhan City. Appl. Mech. Mater. 2013, 405–408, 2376–2379. [Google Scholar] [CrossRef]
- Wang, X.; Lai, J.; He, S.; Garnes, R.S.; Zhang, Y. Karst Geology and Mitigation Measures for Hazards during Metro System Construction in Wuhan, China. Nat. Hazards 2020, 103, 2905–2927. [Google Scholar] [CrossRef]
- Yu, L.; Yu, T. Analysis of Collapse-Causing Model of Karst Collapse in Wuhan. Resour. Environ. Eng. 2015, 29, 887–891. (In Chinese) [Google Scholar]
- Wu, Y.; Jiang, X.; Guan, Z.; Luo, W.; Wang, Y. AHP-Based Evaluation of the Karst Collapse Susceptibility in Tailai Basin, Shandong Province, China. Environ. Earth Sci. 2018, 77, 436. [Google Scholar] [CrossRef]
- Dan, L. Comparison of Indicators for the Assessment of Saltwater Intrusion in Coastal Aquifers—Taking Aquifers in Pearl River Estuary as an Example. Mar. Environ. Sci. 2020, 39, 16–23. (In Chinese) [Google Scholar] [CrossRef]
- Xiao, X.; Li, Z.; Cai, G.; Yang, H. Effects of Declining Water Levels on Water-Air Interactions in Cover Collapse Sinkhole. Bull. Eng. Geol. Environ. 2021, 80, 2545–2556. [Google Scholar] [CrossRef]
- Saaty, T.L. The Modern Science of Multicriteria Decision Making and Its Practical Applications: The AHP/ANP Approach. Oper. Res. 2013, 61, 1101–1118. [Google Scholar] [CrossRef]
- Saaty, T.L. Decision-Making with the AHP: Why Is the Principal Eigenvector Necessary. Eur. J. Oper. Res. 2003, 145, 85–91. [Google Scholar] [CrossRef]
- Masuda, T. Hierarchical Sensitivity Analysis of Priority Used in Analytic Hierarchy Process. Int. J. Syst. Sci. 1990, 21, 415–427. [Google Scholar] [CrossRef]
- Gao, L.; Hu, X.; Ma, C.; Kuang, H.; Qi, H.; He, Z. Geoenvironmental Risk Evaluation of High-Efficiency Eco-Economic Zone in Weifang City, China. Nat. Hazards Rev. 2020, 21, 05020005. [Google Scholar] [CrossRef]
- Xu, G. Mechanism and Hazard Assessment of Covered Karst Sinkholes in Wuhan City, China; China University of Geosciences: Wuhan, China, 2016. (In Chinese) [Google Scholar]
- Yu, J.; Zhu, Y.; Yao, W.; Liu, X.; Ren, C.; Cai, Y.; Tang, X. Stress Relaxation Behaviour of Marble under Cyclic Weak Disturbance and Confining Pressures. Meas. J. Int. Meas. Confed. 2021, 182, 109777. [Google Scholar] [CrossRef]
- He, K.; Jia, Y.; Wang, B.; Wang, R.; Luo, H. Comprehensive Fuzzy Evaluation Model and Evaluation of the Karst Collapse Susceptibility in Zaozhuang Region, China. Nat. Hazards 2013, 68, 613–629. [Google Scholar] [CrossRef]
- Chen, X.; Guo, R.; Tang, L.; Zhang, X. Study on Ground Collapse of Covered Karst Soil Caves by Sudden Drop of Groundwater. Adv. Civ. Eng. 2021, 2021, 7796401. [Google Scholar] [CrossRef]
- Santo, A.; Budetta, P.; Forte, G.; Marino, E.; Pignalosa, A. Karst Collapse Susceptibility Assessment: A Case Study on the Amalfi Coast (Southern Italy). Geomorphology 2017, 285, 247–259. [Google Scholar] [CrossRef]
- Liu, Y.; Luo, T.; Liu, Z.; Kong, X.; Li, J.; Tan, R. A Comparative Analysis of Urban and Rural Construction Land Use Change and Driving Forces: Implications for Urban-Rural Coordination Development in Wuhan, Central China. Habitat Int. 2015, 47, 113–125. [Google Scholar] [CrossRef]
- Zhang, Y.; Xie, Z.; Jiang, F.; Xu, T.; Yang, S.; Yin, S.; Zhao, F.; He, J.; Chen, Y.; Hou, Z.; et al. Evaluating the Socioeconomic Value of Urban Underground Space in Kunming, China, Using the Entropy Method and Exponential Smoothing Prediction. J. Urban Plan. Dev. 2023, 149, 1–14. [Google Scholar] [CrossRef]
- Chen, W.F.; Gong, H.L.; Chen, B.B.; Liu, K.S.; Gao, M.; Zhou, C.F. Spatiotemporal Evolution of Land Subsidence around a Subway Using InSAR Time-Series and the Entropy Method. GIScience Remote Sens. 2017, 54, 78–94. [Google Scholar] [CrossRef]
- Pan, Z.; Chen, X.; Yang, X.; Song, Y.; Ban, R.; Zhang, M. Formation Mechanism Analysis of Cover Collapse Sinkholes in Wugaishan Town, Chenzhou City, Hunan Province, China. Environ. Earth Sci. 2022, 81, 48. [Google Scholar] [CrossRef]
- Rodriguez, V.; Gutiérrez, F.; Green, A.G.; Carbonel, D.; Horstmeyer, H.; Schmelzbach, C. Characterizing Sagging and Collapse Sinkholes in a Mantled Karst by Means of Ground Penetrating Radar (GPR). Environ. Eng. Geosci. 2014, 20, 109–132. [Google Scholar] [CrossRef]
- Mochales, T.; Pueyo, E.L.; Casas, A.M.; Soriano, M.A. Magnetic Prospection as an Efficient Tool for Doline Detection: A Case Study in the Central Ebro Basin (Northern Spain). Geol. Soc. Spec. Publ. 2007, 279, 73–84. [Google Scholar] [CrossRef]
- Wei, S.; Luan, Q.; Huang, C.; Gu, X. Review and Prospects on Researches on Soft Measures of Land-Use Planning in Prevention and Control of Geological Disasters. J. Nat. Disasters 2014, 23, 159–165. [Google Scholar] [CrossRef]
- Zacharias, J.; He, J. Hong Kong’s Urban Planning Experiment in Enhancing Pedestrian Movement from Underground Space to the Surface. Tunn. Undergr. Sp. Technol. 2018, 82, 1–8. [Google Scholar] [CrossRef]
- Panno, S.V.; Luman, D.E. Characterization of Cover-Collapse Sinkhole Morphology on a Groundwater Basin-Wide Scale Using Lidar Elevation Data: A New Conceptual Model for Sinkhole Evolution. Geomorphology 2018, 318, 1–17. [Google Scholar] [CrossRef]
- Currens, J.C. Hypothesized Mechanism for the Initiation of Soil Cavities and Subsequent Cover-Collapse in Karst Terrain. J. Cave Karst Stud. 2018, 80, 172–180. [Google Scholar] [CrossRef]
- Zheng, Q.; Zhao, P.; Li, Y.; Wang, H.; Yang, Y. Spectrum Interference-Based Two-Level Data Augmentation Method in Deep Learning for Automatic Modulation Classification. Neural Comput. Appl. 2021, 33, 7723–7745. [Google Scholar] [CrossRef]


| Indicators | Factors | Levels | Data Sources | |||
|---|---|---|---|---|---|---|
| Weak | Medium | High | Extreme | |||
| Karst conditions | Bedrock lithology | S, D, N, K-E | T | P | C | National Geological Archive Data Center http://dc.ngac.org.cn/; accessed on 7 September 2020 |
| Degree of karstification | - | Fissure developed | Few caves, fissure developed | Caves developed | Wuhan Center of China Geological Survey https://zk.cgsi.cn/ accessed on 7 September 2020 | |
| Overburden conditions | Thickness | >30 m | 30–20 m | 20–10 m | <10 m | |
| Lithology and Structure | Single clay layer | Clay–Sand ratio>1 | Clay–Sand ratio<1 | Single sand layer | ||
| Hydrodynamic conditions | Pore water level to bedrock distance | - | 30–15 m | - | <15 m | Geogical Environmental Center of Hubei https://geocloud.hubgs.com/metadata/ accessed on 7 September 2020 |
| Ground level variation | <1 m | 1–3 m | 3–5 m | >5 m | ||
| Factors | Bedrock Lithology | Karst Development Degree | Weight Value |
|---|---|---|---|
| Bedrock lithology | 1 | 1/3 | 0.2500 |
| Karst development degree | 3 | 1 | 0.7500 |
| Factors | Bedrock Lithology | Lithology and Structure | Weight Value |
|---|---|---|---|
| Thickness | 1 | 2 | 0.6667 |
| Lithology and Structure | 1/2 | 1 | 0.3333 |
| Factors | Distance between Groundwater Level and Bedrock | Variation in Groundwater Level | Weight Value |
|---|---|---|---|
| Distance between groundwater level and bedrock | 1 | 3 | 0.7500 |
| Variation in groundwater level | 1/3 | 1 | 0.2500 |
| Indicators | Karst Conditions | Overburden Conditions | Hydrodynamic Conditions | Weight Value |
|---|---|---|---|---|
| Karst conditions | 1 | 2 | 5 | 0.5813 |
| Overburden conditions | 1/2 | 1 | 3 | 0.3091 |
| Hydrodynamic conditions | 1/5 | 1/2 | 1 | 0.1096 |
| Indicator Layer | Weight Value | Factor Layer | Weight Value | Weight of Factor Unit |
|---|---|---|---|---|
| Karst condition | 0.5813 | Bedrock lithology | 0.2500 | 0.146 |
| Karst development degree | 0.7500 | 0.436 | ||
| Overburden condition | 0.3091 | Thickness | 0.6667 | 0.206 |
| Lithology and Structure | 0.3333 | 0.103 | ||
| Hydrodynamic conditions | 0.1096 | Distance between groundwater level and bedrock | 0.7500 | 0.082 |
| Variation in groundwater level | 0.2500 | 0.027 |
Disclaimer/Publisher’s Note: The statements, opinions and data contained in all publications are solely those of the individual author(s) and contributor(s) and not of MDPI and/or the editor(s). MDPI and/or the editor(s) disclaim responsibility for any injury to people or property resulting from any ideas, methods, instructions or products referred to in the content. |
© 2023 by the authors. Licensee MDPI, Basel, Switzerland. This article is an open access article distributed under the terms and conditions of the Creative Commons Attribution (CC BY) license (https://creativecommons.org/licenses/by/4.0/).
Share and Cite
Gao, L.; Shi, Y.; Qiu, Y.; Ma, C.; Zhou, A. The Analyses of Land Use and Prevention in High-Density Main Urban Areas under the Constraint of Karst Ground Subsidence: Study of Wuhan City, China. ISPRS Int. J. Geo-Inf. 2023, 12, 425. https://doi.org/10.3390/ijgi12100425
Gao L, Shi Y, Qiu Y, Ma C, Zhou A. The Analyses of Land Use and Prevention in High-Density Main Urban Areas under the Constraint of Karst Ground Subsidence: Study of Wuhan City, China. ISPRS International Journal of Geo-Information. 2023; 12(10):425. https://doi.org/10.3390/ijgi12100425
Chicago/Turabian StyleGao, Lin, Yan Shi, Yang Qiu, Chuanming Ma, and Aiguo Zhou. 2023. "The Analyses of Land Use and Prevention in High-Density Main Urban Areas under the Constraint of Karst Ground Subsidence: Study of Wuhan City, China" ISPRS International Journal of Geo-Information 12, no. 10: 425. https://doi.org/10.3390/ijgi12100425