Article

The Spatiotemporal Pattern Evolution and Driving Force of Tourism Information Flow in the Chengdu–Chongqing City Cluster

School of Geoscience and Technology, Southwest Petroleum University, Chengdu 610500, China
*
Author to whom correspondence should be addressed.
ISPRS Int. J. Geo-Inf. 2023, 12(10), 414; https://doi.org/10.3390/ijgi12100414
Submission received: 9 August 2023 / Revised: 15 September 2023 / Accepted: 25 September 2023 / Published: 10 October 2023

Abstract

:
In recent years, the tourism industry has developed rapidly. However, traditional tourism information has the disadvantages of slow response speed and limited information content, which cannot reflect the evolution trend of spatial and temporal patterns of tourism information in time. Here, based on the Baidu Index, we construct an evaluation framework to analyse the spatial and temporal flow of tourism information in the Chengdu–Chongqing urban cluster from 2011 to 2021. Then, we analyse the urban links between different network levels from the evolution pattern. Finally, we use the geodetector model to analyse its driving mechanism. The results show that Chengdu and Chongqing are the most active cities in the study area in terms of tourism information. The unbalanced development of tourism information between Chengdu and Chongqing and other cities in the region gradually deepens during the period 2011–2019 (polarization effect), but the unbalanced development moderates after 2019. On the other hand, cities in the middle of the Chengdu–Chongqing cluster always have weak agglomeration effects of tourism information. Cities with high tourism information outflow rates in the Chengdu–Chongqing city cluster are mainly concentrated around Chengdu. The average outflow rate of Deyang is the highest, at 27.8%. Cities with low tourist information outflow rates are primarily located in the west, central and south. Ya’an is the city with the lowest outflow rate, with an average of −62.2%. Specifically, Chengdu is the dominant and most radiantly influential city. The tourism information of the Chengdu–Chongqing urban cluster shows a radial network with Chengdu and Chongqing as the core. The driving force analysis shows that the push factor of tourist source, such as the number of people buying pension insurance, is the core driving mechanism, while the pull factor of destination, such as the park green area, and resistance factors such as psychological distance, are in the secondary position. In general, this paper uses Internet tourism data to expand the traditional tourism information research of the Chengdu–Chongqing urban cluster, which can better respond to the changes and needs of the tourism market and provide reference for the spatial optimization of tourism destinations.

1. Introduction

In recent years, tourism has gradually become a stable growth point of the regional economy under the new normal, and has become more and more closely linked with the Internet. According to the 50th “Statistical Report on the Development of China ‘s Internet” [1], as of June 2022, the number of online travel booking users in China is as high as 333 million, accounting for 31.6% of all Internet users. In the process of Internet users searching for tourism information, tourism information flow will be formed between tourist sources and tourist destinations [2,3]. The tourism information flow consists of massive amounts of data and knowledge. It is the mapping of the flow process of Internet search data with the characteristics of flow direction, flow rate and spatial difference. To a certain extent, it can express the information exchange caused by tourism information search. The concept of tourism flow is more extensive, which refers to the social and economic development effect caused by the distribution of tourists in the spatial area [4,5]. Tourism flow is the basis for the occurrence of outbound tourism behaviour and the formation of tourism industry, and it is a geographic concept with spatial attributes [6]. There is a difference between the broad sense and the narrow sense of tourism flow. In the broad sense, tourism flow is composed of passenger flow, capital flow, cultural flow, energy flow, information flow and material flow. From a narrow point of view, tourism flow is a kind of extremely complex spatial dynamic flow, with the characteristics of flow quality, flow direction, flow rate, spatial and temporal distribution, and spatial effect. The core of tourism flow is passenger flow, while tourism information flow belongs to one direction of tourism flow. Tourism information flow mainly expresses the phenomenon of information flow that accompanies tourists in the process of travelling [7]. Therefore, it is essential to study tourism information flow. In terms of theoretical significance, the study of tourism information flow can provide an in-depth understanding of the transmission and influence mechanism of information in the tourism process, and promote the integration and development of tourism and geography. In terms of practical significance, the study of tourism information flow can help tourism practitioners to better formulate business and promotional strategies, and promote the rational use and protection of tourism resources, which is of great significance in promoting the digital transformation of tourism and improving the quality of tourism services.
The study of tourism flow theory originated in the 1960s [8], which laid a theoretical foundation for the application of tourism flow to the planning and management of tourism areas. In recent years, research on tourism flow has focused on the spatiotemporal evolution characteristics of tourism flow [9], the flow characteristics of tourism flow [10], and tourism flow drivers [11]. When studying the spatial and temporal evolution characteristics of tourism flow, researchers usually choose a certain research period, and use social network analysis, historical data comparison analysis, GIS spatial analysis and other methods to explore the spatial and temporal distribution characteristics of tourism flow in the study area [12,13]. For instance, Qin et al. examined the spatial characteristics and spatial development patterns of rural tourism flows in Guilin, China, based on digital footprint data from the Ctrip website. The findings suggest that rural tourism flows tend to flow between nodes with superior resource conditions and convenient transportation [12]. In studying the flow characteristics of tourism flows, researchers often use methods such as fractal statistical models to explore the evolutionary trends in the flow direction and the density and trajectory of tourism flows from the perspective of inbound tourism [14,15]. For example, Du et al. used a fractal statistical model to systematically analyse the flow characteristics of tourism flows in the Zhangjiajie Scenic Area, and finally provided suggestions for the problems facing the sustainable development of the ecological surroundings in the Zhangjiajie Scenic Area based on the results of the study [14]. However, most of the previous studies are based on traditional tourism flow data but ignore Internet tourism information data, and most of the traditional tourism flow data come from the real tourism passenger flow data, and there are problems such as the limited size of the sample and the difficulty in obtaining some of the data, which makes it difficult to fully reflect the real flow of regional tourism flow. Furthermore, from an inbound tourism perspective alone, it is difficult to study the outflow and inflow of tourism information. At present, more mature platforms such as the Baidu Index and Google Trends contain huge Internet tourism search data, which provide convenience and support for the study of tourism flow characteristics [16,17,18]. Therefore, based on the Internet tourism flow data between the regions under the study area and each other, the exploration of tourism flow characteristics in two dimensions, outbound and inbound, is an issue that needs further research. In the study of tourism flow’s driving mechanism, researchers often construct index systems based on demand theory, spatial interaction theory, push–pull theory, etc., combined with quantitative data, calculating index correlations or establishing regression models to study the driving force [19,20]. For example, Wang et al. used GIS spatial analysis and social network analysis to systematically study the spatial evolutionary trends of tourism information flows in the Yangtze River Delta city cluster, and finally explored its driving factors based on the quadratic assignment procedure (QAP) [19]. However, most of the existing research is based on short-term surveys and lacks long-term and large-scale follow-up surveys. Therefore, it is necessary to track and analyse the factors influencing regional tourism flows over a longer period of time.
In summary, scholars have performed a lot of research in the field of tourism information flow, which has laid a solid theoretical foundation for this study. As an important political, economic and cultural centre in western China, the Chengdu–Chongqing city cluster has rich tourism resources and a huge tourism market. Therefore, this paper takes the Chengdu–Chongqing city cluster as the research area, and based on the Baidu Index combined with GIS theory, chooses 2011–2021 as the research period. The questions we aim to explore in this paper are as follows: (1) What is the spatiotemporal evolution law of tourism information flow in the Chengdu–Chongqing city cluster? (2) What is the status of tourism information inflow and outflow in the cities under the Chengdu–Chongqing city cluster? (3) What are the tourism information links between cities at different network levels? (4) What are the main driving factors affecting tourism information flow in the Chengdu–Chongqing city cluster?
The framework for the experimental discussion in this paper is as follows: (1) Collecting Baidu Index data, determining the keyword extraction method from existing literature, and establishing a tourism information database of the Chengdu–Chongqing city cluster. (2) Based on the tourism information database, studying the spatiotemporal evolution law and flow characteristics of tourism information flow in the Chengdu–Chongqing city cluster from 2011–2021, exploring the connection between cities at different network levels in depth, and based on the push–pull theory and using the geodetector model, exploring the driving mechanism of tourism information flow in the Chengdu region from three aspects: the push mechanism of the origin, the pull mechanism of the destination, and the resistance mechanism of the origin-destination. (3) The results of each experiment are compared and analysed with previous studies, and conclusions are drawn.

2. Materials and Methods
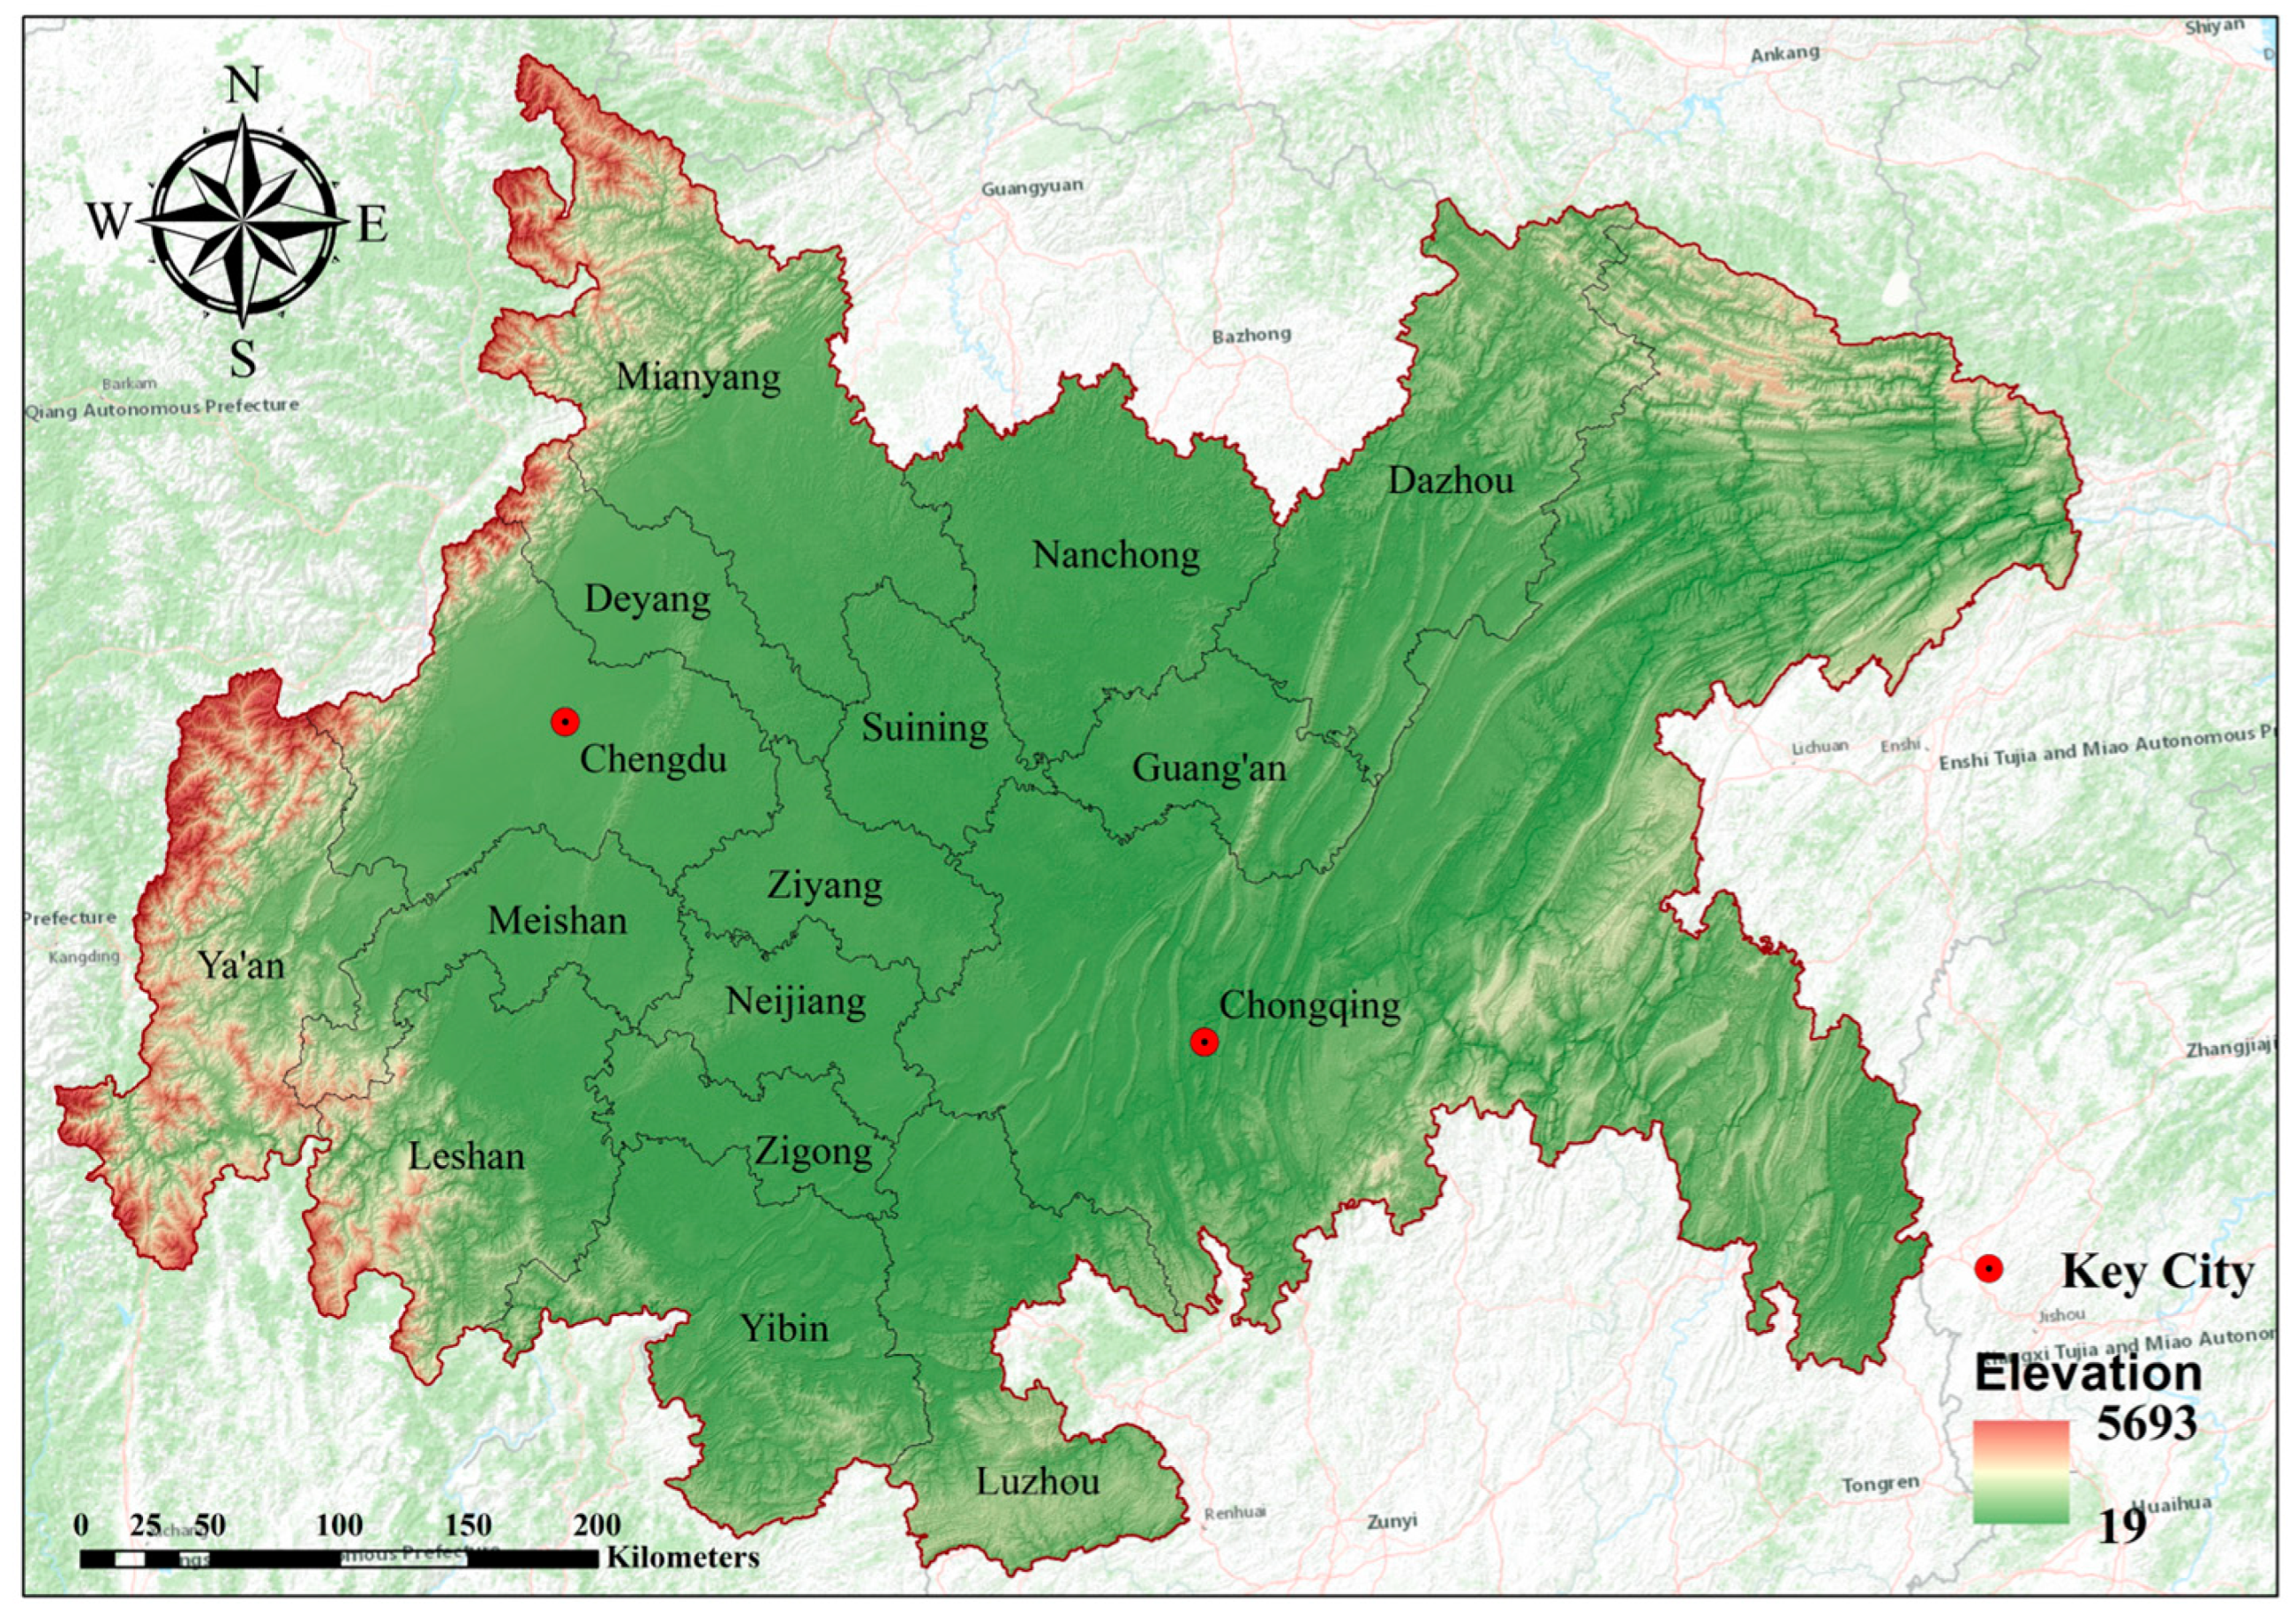
2.1. Study Area

The Chengdu–Chongqing urban cluster is one of the country’s most important demonstration areas for promoting new urbanization. In November 2018, the State Council explicitly asked Chongqing and Chengdu, as the centres of the Chengdu–Chongqing city cluster, to play a dual-core effect and lead urban development in southwest China. From 2014 to 2019, the tourism revenue of the Chengdu–Chongqing city cluster gradually climbed, with the tourism revenue amounting to about CNY 537.4 billion in 2014. By 2019, the tourism revenue reached about CNY 153.39 billion. By 2022, the Chengdu–Chongqing urban cluster had more than 20 5A-level scenic spots. The tourism resources are rich, the tourism development potential is huge and the research value is high. This paper takes 16 cities under the jurisdiction of the Chengdu–Chongqing urban group as the research area, namely Chongqing, Chengdu, Ya’an, Leshan, Meishan, Deyang, Suining, Mianyang, Neijiang, Ziyang, Yibin, Zigong, Nanchong, Luzhou, Guang’an and Dazhou, as shown in Figure 1.

2.2. Data Sources

The Baidu Index “https://index.baidu.com (accessed on 1 March 2023)”is one of the most influential data statistics platforms in China. It reflects the search volume of a certain keyword by Internet users in a city using the Baidu platform. We refer to the keyword selection method of existing studies, and find that it is meaningful to use “city name + tourism” as the keyword to study tourism information flow [21,22,23]. Therefore, on the basis of the 16 cities under the jurisdiction of Chengdu–Chongqing city cluster, we use “city name + travel” as the keyword, and extract the Baidu Index data of 2011, 2013, 2015, 2017, 2019 and 2021 among the cities under the jurisdiction of Chengdu–Chongqing city cluster according to the IP positioning of different cities. As this paper focuses on the spatiotemporal evolutionary characteristics and driving mechanism of tourism information flow between different cities in the Chengdu–Chongqing city cluster, the self-search data of each city are excluded. The socioeconomic data used in this study are taken from the “Sichuan Statistical Yearbook”, “Chongqing Statistical Yearbook”, “China Internet Development Statistics Report” and the statistical yearbook and Internet development statistics reports of the cities under the jurisdiction of Chengdu–Chongqing city cluster from 2011 to 2021. It should be noted that some missing data are replaced by data corresponding to approximate years. In addition, the National Basic Geographic Database of the Ministry of Natural Resources provides the base map data used in this study.

2.3. Research Methods

2.3.1. Tourism Information Flow Calculation Method

The formula for calculating the tourism information flow intensity and the relative information flow intensity between city i and city j under the jurisdiction of the Chengdu–Chongqing urban cluster is as follows:
S i j = R i j + R j i
P i j = R i j / max R i j
In the above two formulas, Rij is the search index from city i to city j, Rji is the search index from city j to city i. Sij is the intensity of tourism information flow between city i and city j. Pij is the relative information flow intensity between city i and city j, which indicates the relative position of the tourism information flow in the whole tourism information flow system. maxRij is the largest tourism information flow intensity in the Chengdu–Chongqing urban cluster.
Each city is both a source and a destination, so the tourism information of each city can be divided into inflow and outflow. According to the inflow and outflow, the total flow and the outflow rate of tourism information of each city can be calculated, respectively. The calculation formula is as follows:
C i n i = j = 1 n R j i
C o u t i = j = 1 n R i j
C i = C i n i + C o u t i
Z i = C o u t i C int i / C i
In the above equations, Cini is the inflow of city i, Couti is the outflow of city i, and Ci is the total flow of city i. Zi is the outflow rate of city i: if Zi > 0, it means net outflow; if Zi < 0, it means net inflow. Rji is the search index of city j to city i, Rij is the search index of city i to city j, and n is the total number of cities.

2.3.2. Push–Pull Theory

Dann, an American tourism scientist, proposed the theory of tourism driving factors, which brought the push and pull theory from the field of population research into the field of tourism discipline for the first time [24,25]. Potential tourists’ willingness to travel is generated by a combination of internal factors at the source and external factors at the destination, in which the push factors that make potential tourists motivated to travel are caused by the imbalance of tourism demand, and the push factors mainly drive tourism demand at the decision-making stage of travelling. The pull factors are influenced by the travelers’ knowledge of the destination, and mainly play a role in the destination selection stage. Destination pull is the embodiment of destination attractiveness. Generally speaking, the main power source of push and pull is the product of the joint action of economic, social, humanistic, environmental and cultural aspects, etc., and it plays a comprehensive role in the whole process of pre-travelling, travelling and post-travelling.

2.3.3. Driving Force Indicator Selection Method

Based on the push–pull theory and taking into account the resistance factor between the source and the destination, the force of tourism information flow in Chengdu–Chongqing urban cluster is divided into the push factor that the tourist source promotes local residents to search for tourism destination information, the pull factor that the destination attracts non-local residents to search for local tourism information, and the resistance factor that impedes the information exchange between the tourist source and the destination. Referring to the selection principle of representative indicators in the existing research on the influencing factors of tourism information flow [19,23], economic development, population size, information technology development level and social security status are selected as the target layer of the tourist source push factors. Economic development, ecological environment quality, public service level, transportation convenience and tourism resource service are selected as the target layer of destination pull factors, and spatial distance, temporal distance and psychological distance are selected as the target layer of source–destination resistance factors. Several representative indicators are selected for each target layer, and the selection index system of push factor, pull factor and resistance factor is established, as shown in Table 1.

2.3.4. Geographical Detector

The geographical detector is derived from the study of the risk degree and influence mechanism of Wang Jinfeng on regional diseases [26]. The geographical detector mainly consists of four detectors, among which the factor detector is mainly used for genetic analysis. Its principle is to test the consistency between dependent and independent variables. If the two variables have significant spatial differentiation, it shows that the independent variable has a decisive significance for the formation of the dependent variable. Since the geodetector does not make any linear assumptions, it is not necessary to consider the collinearity between variables, and the accuracy of the detection results is higher. q Statistics are often used to express the effect of independent variables on dependent variables. The formulas are as follows:
q i = 1 i = 1 L N i σ i 2 N i σ i 2 = 1 S S W S S T
S S W = l = 1 L N i σ i 2 , S S T = N i σ i 2
Among the above formulas, q i is the factor detection result of the independent variable and the dependent variable; L is the number of layers; Ni and N are the number of layers i and the total number of units, respectively; σ i 2 and σ 2 are the variance of layers i and dependent variable, respectively; SSW is the sum of the variance within the layer; and SST is the total variance within the layer.
The range of q is [0, 1], and the larger the q value, the greater the effect of the independent variable on the dependent variable. At present, studies have shown that even q statistics that do not pass the significance test still have physical meaning.

3. Results

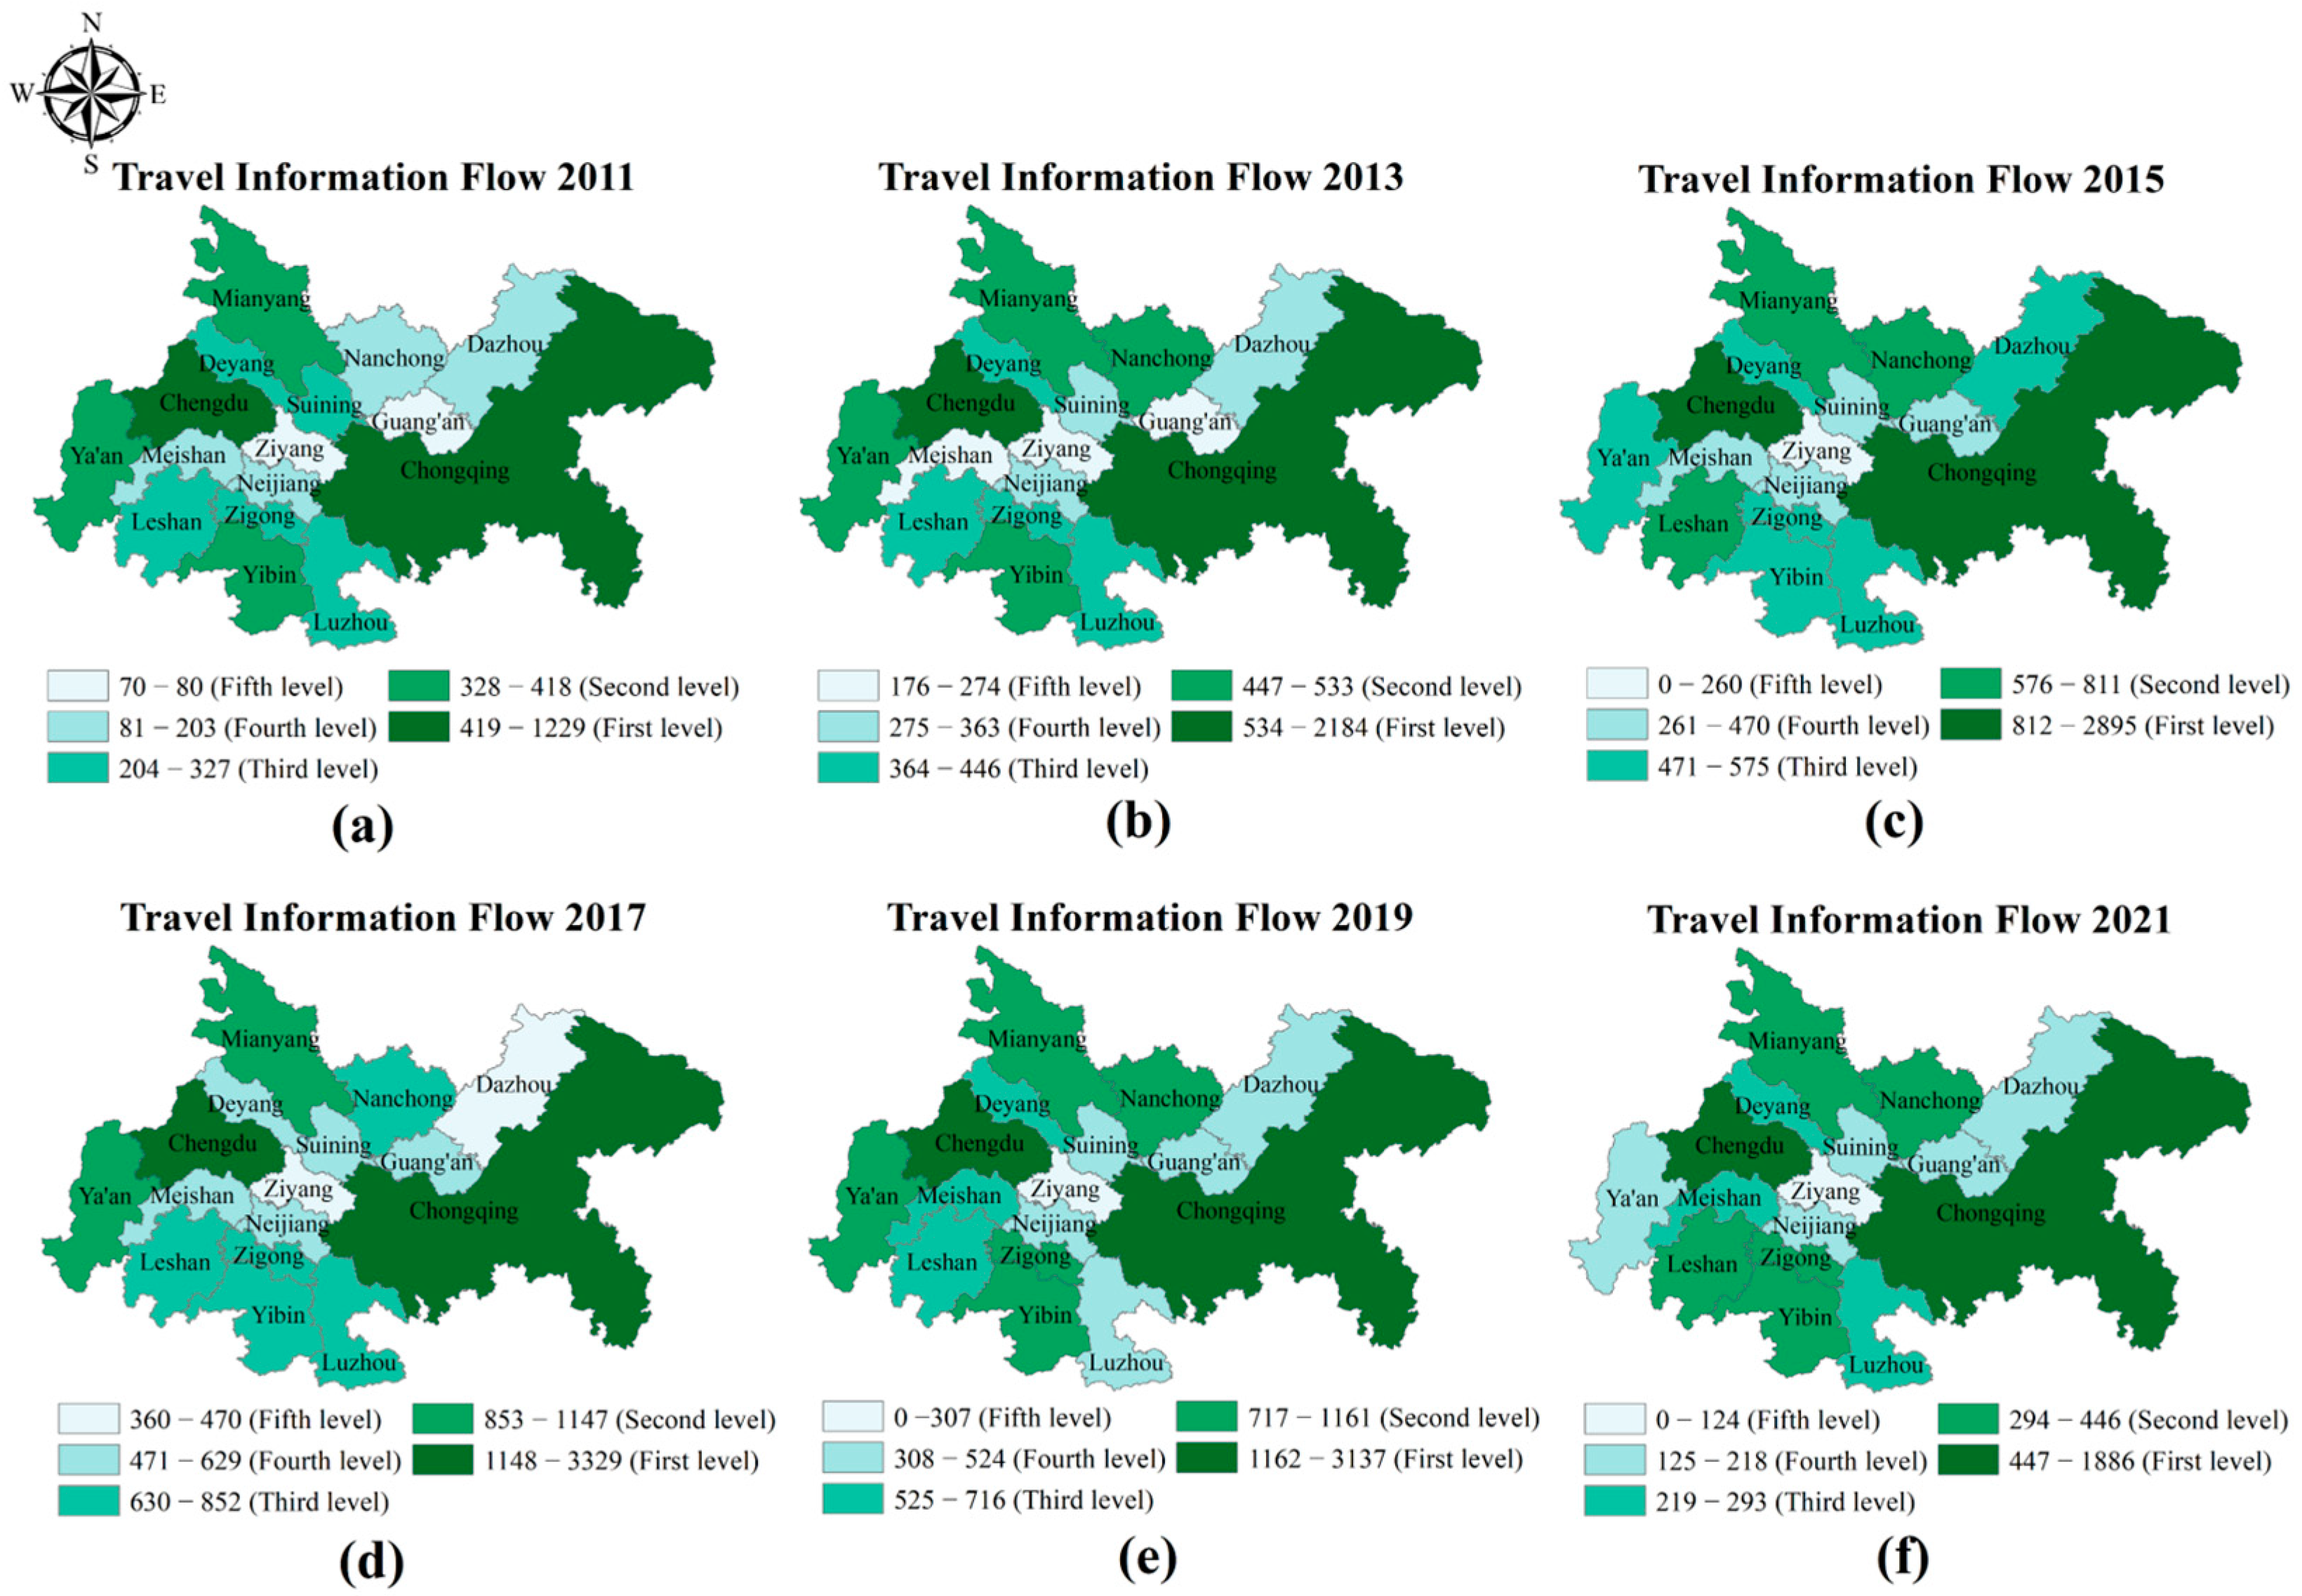
3.1. Evolution Characteristics of Spatiotemporal Pattern of Tourism Information Flow

According to the Formula (5), the total tourism information flow of each city under the jurisdiction of the Chengdu–Chongqing city cluster is calculated. The total flow of tourism information flow of each city in each year is normalized and visualized, as shown in Figure 2. Using the natural breakpoint grading method of ArcGIS10.2, the cities under the jurisdiction of the Chengdu–Chongqing urban agglomeration are divided into five levels and visualized. Figure 3 shows the results.
Chengdu and Chongqing occupy the first and second positions in the study area in terms of total tourist information traffic (Figure 2), much larger than other cities. Looking at the spatiotemporal pattern evolution chart, Chengdu and Chongqing are in the first level in all the years (Figure 3). Before 2019, the Chengdu–Chongqing urban cluster showed a certain polarization effect, and the spatial level changed from “2 + 3 + 5 + 4 + 2” to “2 + 2 + 5 + 5 + 2” (Figure 3a–d). The number of cities in the second level decreased and the number of cities in the fourth level increased. After 2019, the tourism information flow in the Chengdu–Chongqing city cluster always showed a spatial structure of “2 + 5 + 3 + 5 + 1” (Figure 3e,f). The number of cities in the second level has increased significantly, and the number of cities in the third, fourth and fifth levels has decreased. It shows that the polarizing effect of tourism information flow is weakening. Based on the two central cities of Chengdu and Chongqing, it gradually formed a sub-central city dominated by Mianyang, Nanchong, Ya’an and other cities. The unbalanced development of the spatial pattern of regional tourism information flow has been alleviated, and the spatial structure has been gradually stabilized. Notably, the agglomeration effect of tourism information was always weak in the cities located in the middle of the Chengdu–Chongqing city cluster. (Figure 3). Ziyang City, which is located in the middle of the Chengdu–Chongqing main axis, is at the fifth level in all years, indicating that there is a “central collapse” phenomenon in the spatiotemporal pattern of tourism information flow in the Chengdu–Chongqing urban cluster during 2011–2021.

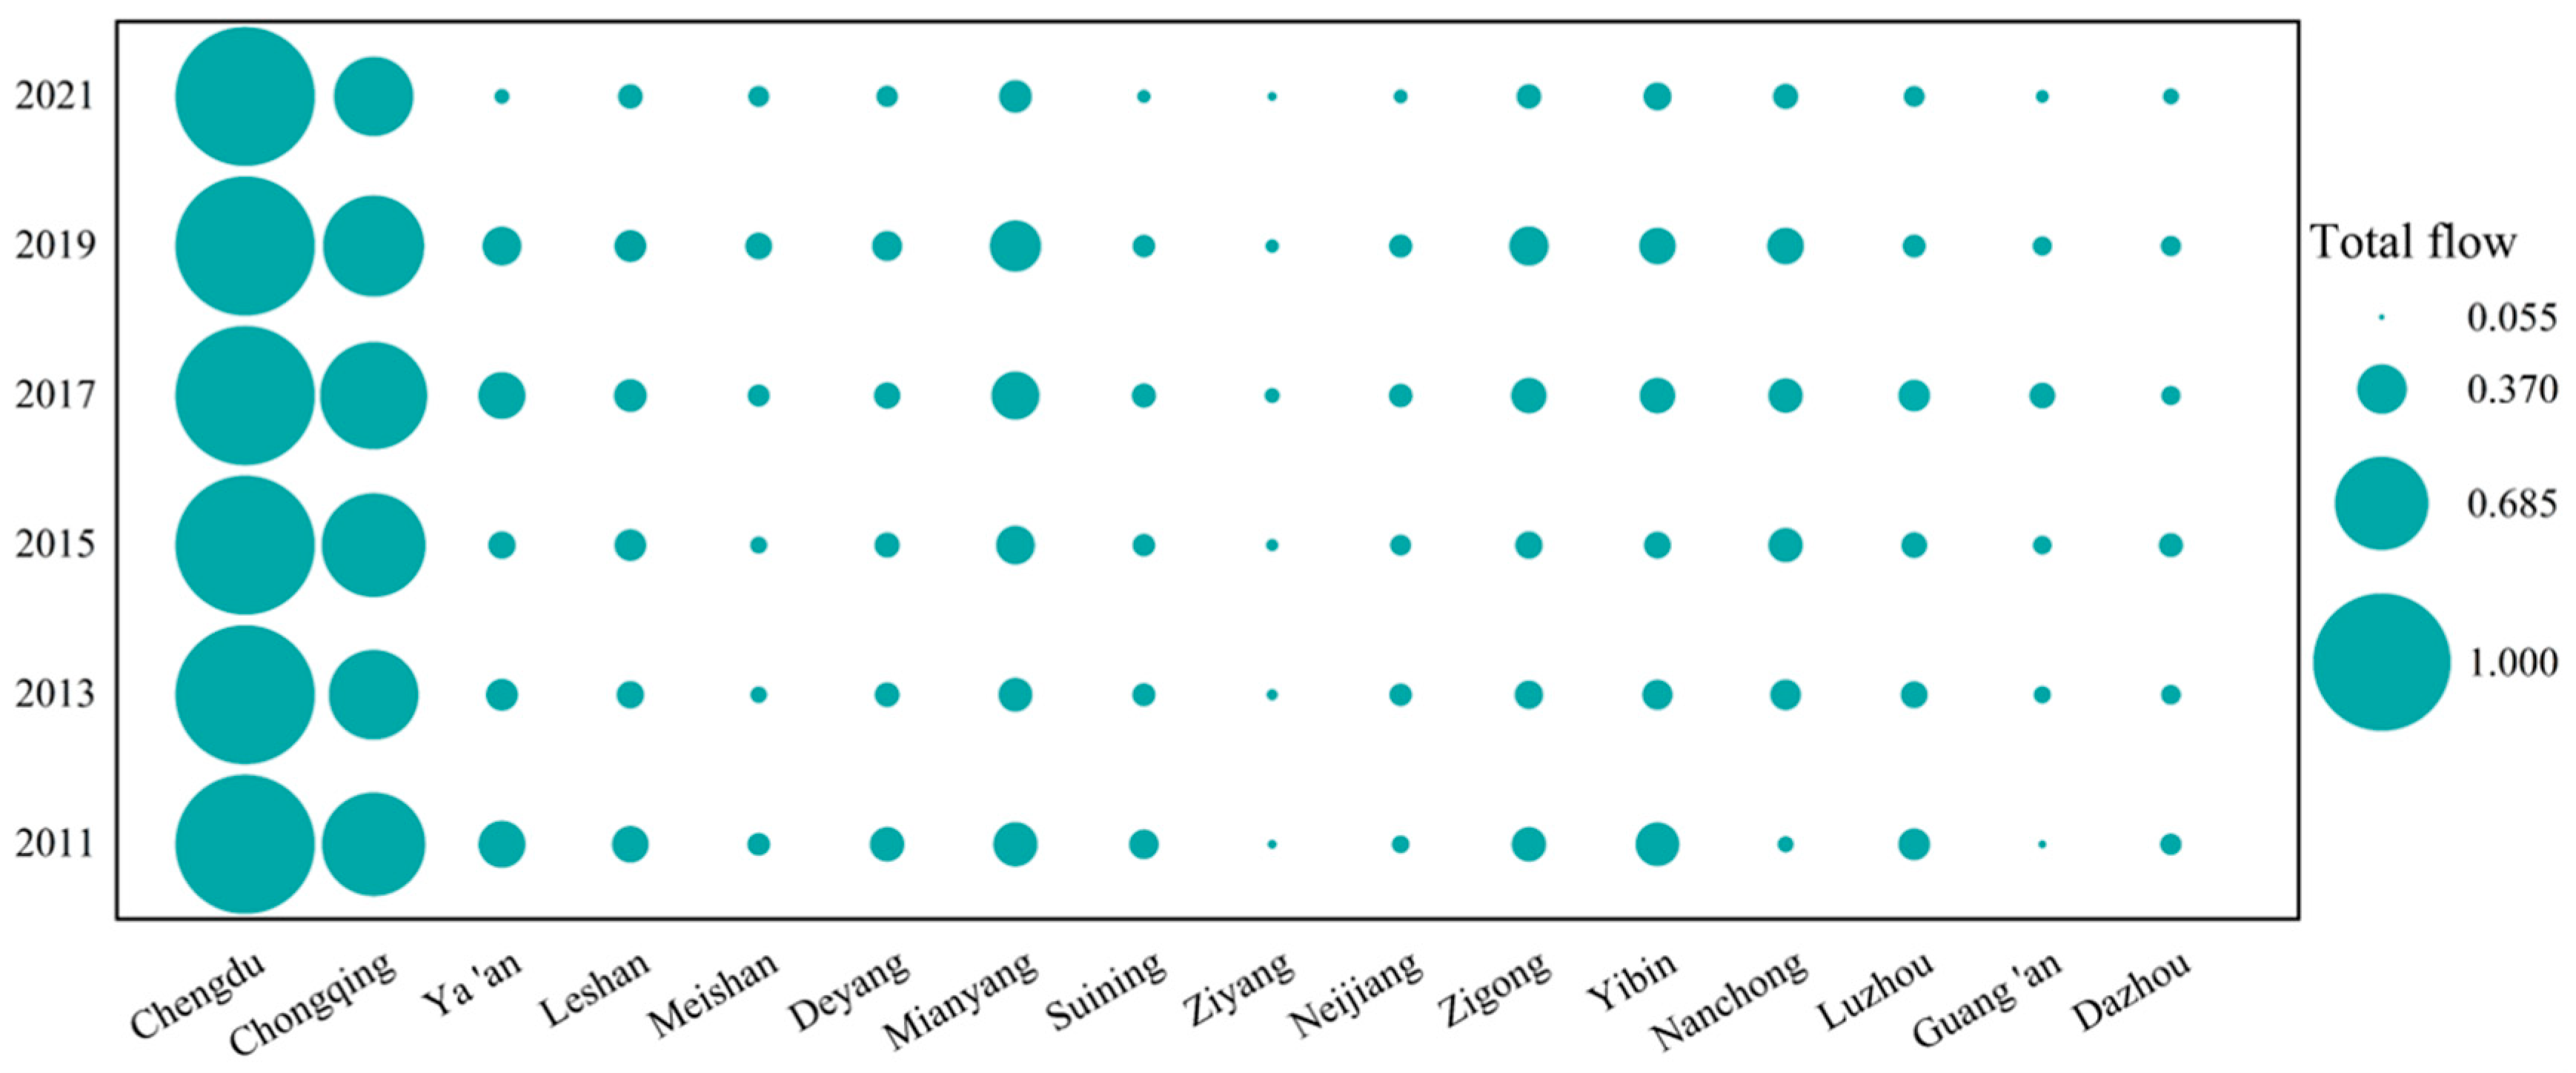
3.2. Tourism Information Flow Characteristics

According to Formula (6), the outflow rates of tourism information of cities under the jurisdiction of the Chengdu–Chongqing urban cluster are calculated, and then divided into four levels according to the size of the outflow rate, as shown in Figure 4.
It can be seen that in all years, the total number of cities with an outflow rate greater than 20% and less than −20% is 8, 6, 8, 5, 9, 9 respectively (Figure 4), indicating that a significant proportion of the city’s tourism information has a high degree of mobility, showing more obvious net outflow or net inflow characteristics. Most of the cities with an outflow rate of more than 20% are concentrated around Chengdu. The average outflow rate of Deyang is 27.8%, which is the highest in the region. However, Deyang’s outflow rate shows a slow downward trend, while Chengdu’s outflow rate is gradually increasing over time. In 2019, Chengdu replaced Deyang as the city with the highest outflow rate in the region (Figure 4e), with an outflow rate of 30.4%. Cities with an outflow rate of less than −20% are primarily concentrated in the western, central and southern parts of the Chengdu–Chongqing cluster. Among them, Ya’an City has the lowest outflow rate, and its outflow rate is less than −20% in all years, with an average of −62.2%.

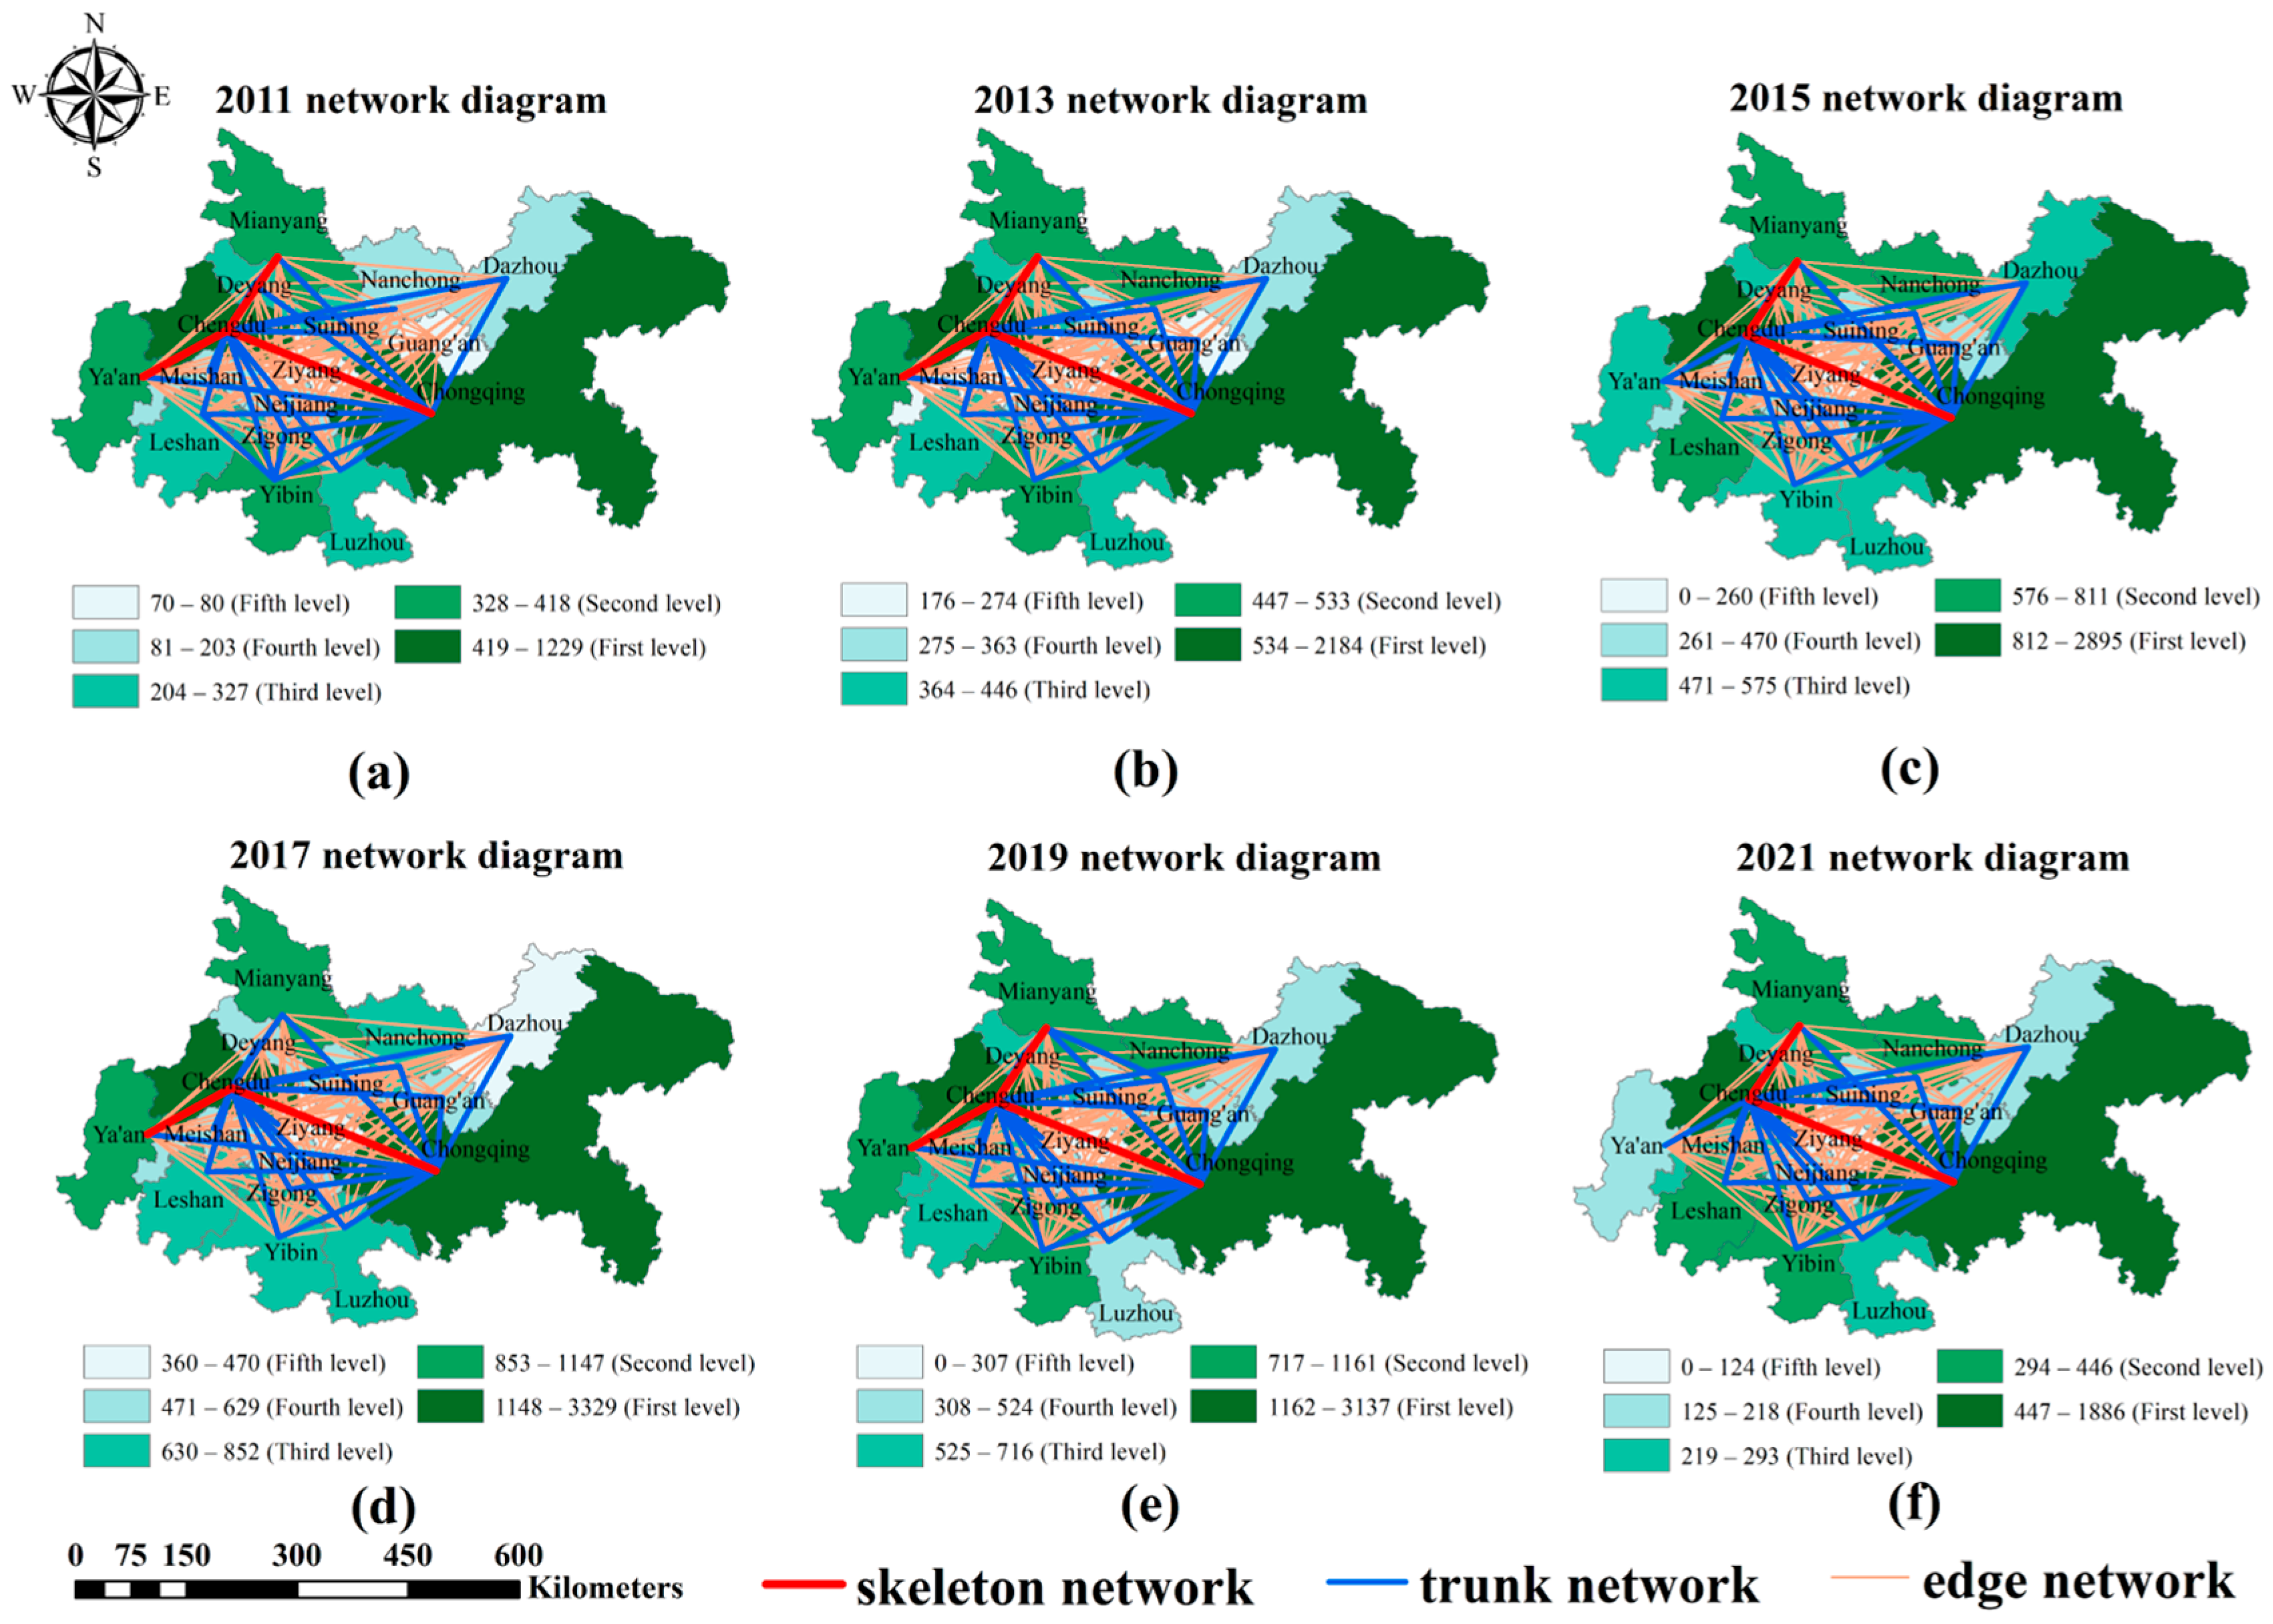
3.3. Evolution of Tourism Information Flow Network Structure

Using Formula (2), the relative information flow intensity of each information flow in Chengyu urban cluster is calculated, and the urban network diagram is constructed. The network structure is divided by referring to the existing literature [27]. The information flow with relative information flow intensity not less than 0.5 is constructed as the skeleton network. The information flow with relative information flow intensity less than 0.5 and not less than 0.2 is constructed as the trunk network. The information flow with relative information flow intensity less than 0.2 is constructed as the edge network. The skeleton, trunk and edge networks of each year are summarized and visualized as shown in Figure 5.
The “double core” refers to Chengdu and Chongqing; the intensity and density of tourism information flow in these two cities is quite high. Comparing the changes of the skeleton network in all years, it can be seen that Chengdu–Chongqing is the core of the whole skeleton network, and Chengdu–Mianyang and Chengdu-Ya’an appear in the skeleton network five and three times, respectively, in all years (Figure 5). Regardless of the change over time, Chengdu has always had information links with non-central cities in the skeleton network, while Chongqing only has information links with Chengdu, indicating that Chengdu has a higher position in the skeleton network than Chongqing, and is the dominant and most radiantly influential city in the region (Figure 5). Comparing the changes in the tourism information trunk network in all years, it can be seen that Chengdu and Chongqing have formed a close relationship with Leshan, Dazhou, Luzhou, Suining and Zigong, respectively, and the trunk network shows a radial shape with Chengdu and Chongqing as the core. In 2011, Mianyang–Deyang, Yibin–Leshan and Yibin–Zigong were also in the trunk network (Figure 5a), indicating that Mianyang, Deyang, Yibin, Leshan and Zigong had a certain dominant type in the trunk network. However, after 2011, there was no tourism information flow between non-central cities at the trunk network level (Figure 5b–f). The edge network mainly consists of tourism information flow between non-central cities. It does not have the core leading ability in the tourism information flow network, and the radiation effect is weak.

3.4. Evaluation of Driving Mechanism

The Spearman rank correlation method was used to test the correlation between the representative index of push factor and outflow, the representative index of pull factor and inflow, and the representative index of resistance factor and total flow. The results are presented in Table 2.
It can be seen that among the representative indicators of push factors, except for population density, there is a positively correlated relationship between other representative indicators and the outflow of tourism information in the Chengdu–Chongqing urban group. Among the representative indicators of pull factors, only park green area and the number of 5A-level scenic spots passed the significance test in most years, which were positively correlated with the inflow of tourism information in the Chengdu–Chongqing urban group. Among the representative indicators of resistance factors, there is a negative correlation between spatial distance, temporal distance, psychological distance and the total flow of tourism information in the Chengdu–Chongqing urban cluster. Therefore, the above representative indicators that pass the Spearman rank correlation test are analysed by geographical detector. Table 3 shows the results of factor detection.

3.4.1. Tourist Source Push Mechanism

It can be seen that the representative indicators of push factors have an important role in promoting the outflow of tourism information in the Chengdu–Chongqing urban agglomeration. Among them, the number of people with pension insurance has the strongest force, and the overall trend is increasing; the average value of q is 0.965. At the secondary level, GDP and the number of Internet users are the main influencing factors, and the overall force shows an upward trend. The representative indicators above have all achieved significance at the 0.01 confidence level for the period 2011–2021, indicating that the spatial stratification between the number of pensioners, GDP, number of Internet users and the number of tourism information outflows are not significant; they are core factors of spatial aggregation of tourism information outflows. From the type of representative indicators, the social security status, economic development and information technology development level are the most important factors to encourage local residents to travel.

3.4.2. Destination Pull Mechanism

The green area of the park and the number of 5A-level scenic spots have a certain role in promoting the inflow of tourism information in the Chengdu–Chongqing urban agglomeration. However, compared with the push factor indicators, the pull factor indicators show weak correlation and strength. Among them, it can be seen that the q value of park green area is generally increasing, and the force is the strongest, the mean value of q is 0.821, which is the core factor influencing the diffusion of tourism information in tourist destinations. On the other hand, the number of 5A scenic spots is a secondary influencing factor, with a relatively weak and decreasing force, and an average q value of 0.568. The spatial heterogeneity between park green areas and tourism information inflow is relatively vague, as it only passes significance tests in certain years. Meanwhile, the number of 5A scenic spots did not pass significance tests in any year, indicating obvious spatial stratification heterogeneity. Ecological environmental quality and tourism resource services are the most important factors influencing destinations’ ability to attract foreign tourists.

3.4.3. The Resistance Mechanism between Source and Destination

From the detection results of the representative indicators of resistance factors, we can see that the flow of tourism information within the Chengdu–Chongqing urban cluster is hindered by spatial distance, temporal distance and psychological distance, and the hindering force shows an overall upward trend. Compared with the push factor and the pull factor, the force of the resistance factor is the lowest. Since the three representative indicators have not passed the significance test, it shows that there is an obvious spatial stratification heterogeneity between the three representative indicators and the overall flow of tourism information. From the perspective of spatial differentiation, the average q-value of psychological distance is 0.605, and the resistance is stronger than spatial distance and temporal distance, which is the strongest factor in the resistance mechanism.

4. Discussion

4.1. Evaluation of the Spatial and Temporal Evolution of Tourism Information Flow in the Chengdu–Chongqing Urban Cluster

The normalized results of total tourism information flow show that Chengdu and Chongqing’s core position in the Chengdu–Chongqing urban cluster tourism information flow system is not easily shaken [27] (Figure 2). Before 2019, the spatiotemporal pattern of tourism information flow in the Chengdu–Chongqing urban cluster shows a strong polarization effect (Figure 3a–d). This is due to the fact that Chengdu and Chongqing, as the central cities of the Chengdu–Chongqing city cluster, have unbalanced development with non-central cities, which makes tourism in non-central cities dependent on Chengdu and Chongqing [8,28]. At the same time, Chengdu and Chongqing have concentrated the most abundant tourism resources in the Chengdu–Chongqing region, combined with their economic, technological, political and other advantages to extract surplus value from non-central cities, thus inhibiting the healthy development of the tourism industry in non-central cities to a certain extent, leading to the gradual deepening of the imbalance in the spatial pattern of regional tourism information flow [29]. However, after 2019, the spatiotemporal evolution characteristics of tourism information flows in the Chengdu–Chongqing urban agglomeration have changed dramatically, and the polarization effect shows clear signs of easing. (Figure 3e,f). This phenomenon of increasing polarization effects before 2019 and decreasing polarization effects after 2019 is closer to the results of previous studies [8]. The reason for this phenomenon may be related to the national outbreak of a new coronavirus in 2019. During the period of epidemic prevention and control, people’s willingness to travel outside the country decreased, which may affect the spatiotemporal evolution trend of tourism information flows [30]. It is worth noting that the distribution of tourism information in the central region of the Chengdu–Chongqing urban agglomeration is weak (Figure 3), indicating that the development of tourism in the central zone of the Chengdu–Chongqing axis needs to be strengthened [28]. This phenomenon shows that in the process of tourism development in the Chengdu–Chongqing urban group, relevant departments cannot only focus on the tourism development of the central city. Rather, the twin-core effect should be used to promote the sustainable development of tourism in neighbouring cities, so as to further promote the exchange and development of tourism information between different cities.

4.2. Evaluation of the Flow Characteristics of Tourism Information Flow in Chengdu–Chongqing Urban Cluster

Overall, the tourism information mobility of the Chengdu–Chongqing urban group is strong during 2011–2021 (Figure 4). The cities with higher outflow rates are mainly concentrated around Chengdu, and the average outflow rate of Deyang is the highest among all cities. This may be due to Deyang’s good economic level but lack of tourism resources [31]. In 2021, Deyang’s GDP ranked fifth in the Chengdu–Chongqing urban cluster, after Chongqing, Chengdu, Mianyang and Yibin. However, Deyang has no 5A-level scenic spots and its tourism resources are relatively weak, which makes Deyang residents think of travelling to other places. In addition, Deyang has a strong tourism culture atmosphere. The government encourages “self-help travel” and “family travel” to improve citizens’ enthusiasm and initiative. Finally, compared with other prefecture-level cities in the Chengdu–Chongqing urban agglomeration, Deyang is less well-known, so tourists are more likely to ignore Deyang when planning their travel itineraries and choose to go to other cities [32]. The above reasons may cause the outflow of tourism information in Deyang City to be much higher than the inflow, resulting in a higher outflow rate. The cities with low outflow rates are mainly distributed in the west, middle and south of the Chengdu–Chongqing urban agglomeration. Among them, the average outflow rate of Ya’an is the lowest among all the cities. This may be due to the existence of world cultural heritage sites in Ya’an, such as Bifeng Gorge Scenic Area, Hanyuan Stone Sea, Panda Park and so on. The unique and beautiful scenery of these attractions has attracted many tourists to come for sightseeing, forming a net inflow of tourism information [33]. In addition, Ya’an City is an important cultural ancient city in western Sichuan. The cultural heritage is very profound, including Western Sichuan Culture and Long March Culture, which has attracted many cultural enthusiasts to visit and communicate [34]. Finally, the population of Ya’an City is relatively small. In 2021, the population size of Ya’an City was only 16th in the Chengdu–Chongqing urban cluster. The smaller population size may lead to lower tourism information outflow in Ya’an City. In summary, Ya’an City has rich tourism resources and profound cultural heritage, but its population size is small, and its tourism information inflow is far greater than its outflow, resulting in a lower outflow rate in Ya’an City.

4.3. Evaluation of Network Structure Analysis Results

In the skeleton network (Figure 5), the tourism information flow between Chengdu and Chongqing is the most frequent in the study area, which is due to the fact that Chengdu and Chongqing, as the two most influential cities in Southwest China, have their own distinctive tourism resources, with Chengdu focusing on cultural tourism, while Chongqing is known for its landscape scenery. The complementary tourism resources of the two regions make residents of the two regions more willing to visit each other’s cities [35], which greatly promotes the development of tourism in both regions. In addition, Mianyang and Ya’an, as sub-central cities of the Chengdu–Chongqing urban cluster, have maintained connections with Chengdu in the skeleton network in some years, but not with Chongqing. This is probably because Mianyang and Ya’an are closer to Chengdu than to Chongqing. Also, the central position of Chengdu is significantly higher than that of Chongqing. This phenomenon of differences in status between dual-core cities is consistent with previous research results [28]. This may be because Chengdu lies at the heart of the Chengdu–Chongqing conurbation. It is not only the political, economic and cultural centre of Sichuan, but is also an important hub between the western region and the central plains. As a mountainous city on the Yangtze River, Chongqing is geographically remote from the main line, and its connections with other cities are not as close as those of Chengdu [36]. Leshan, Dazhou, Luzhou, Suining and Zigong have established a close trunk network with Chengdu and Chongqing, relying on their own advantages in tourism resources and their open and inclusive city image. (Figure 5). It is worth noting that after 2011, there is no tourism information flow at the trunk network level between non-central cities (Figure 5b–f), indicating that the development of tourism information exchange between non-central cities is still slow [35]. The core aggregation of Chengdu and Chongqing has had a certain effect on the development of tourism in non-central cities, and the tourism resources and markets of non-central cities have been limited [37].

4.4. Evaluation of Driving Mechanism

We find that social security status, economic development level and information technology development level are important factors in promoting local residents to travel. Among them, the number of people who buy pension insurance has the strongest promoting effect on the outflow of tourism information among all the representative indicators. This may be due to the fact that the people who buy pension insurance usually have a certain economic foundation and economic security ability [38]. They are more likely to spend some of their financial resources and time on tourism activities, thus increasing the demand for travel. At the same time, GDP and the number of Internet users also play an important part in promoting the outflow of tourism information. This may be because high GDP represents the improvement of urban economic level and residents’ income level, and people’s tourism consumption ability also increases accordingly [39]. The Internet can provide a platform for residents to search for information on tourism resources and optimize the experience of tourism services, thus gradually cultivating their interest and enthusiasm for tourism and further promoting the growth of tourism consumption [40]. Among the driving factors of destination pull, the quality of the ecological environment and the service of tourism resources are the most important factors in attracting foreign tourists. The promotional effect of the park’s green area on the inflow of destination tourism information is the strongest among all the representative indicators, followed by the number of 5A-level scenic spots. This may be because the green area of the park and the number of 5A-level scenic spots can improve the green image and air quality of the city, which can meet the needs of tourists such as viewing, photography and rest, and increase the desire of tourists to come [41]. From the test results of representative indicators of resistance factors, it can be seen that psychological distance is a stronger barrier to the flow of tourism information than spatial and temporal distance. This may be because tourists are finding it easier to travel, thanks to the rapid development of the transport industry [42]. The weight of distance and time costs in the minds of tourists is becoming less and less, and the psychological distance of tourists is often determined by their inner state, attitudes and values, which are more uncertain and subjective than time and spatial distance [43]. At the same time, for unknown things and places, tourists often have some doubts and caution, which restricts their willingness to travel [44]. In some cases, this psychological distance hinders or even exceeds the spatial distance and temporal distance.
In a word, the push mechanism of tourist source is the core driving mechanism in the tourism information flow system of the Chengdu–Chongqing urban cluster. The pull mechanism of destination and the resistance mechanism between tourist source and destination are in the secondary position in the driving mechanism. We guess that in the process of tourism development in Chengdu–Chongqing urban group, the tourism demand of tourist source and the supply of tourism resources in destination are unbalanced for a long time.

4.5. Importance and Limitations

This paper has some important implications and some limitations. For the important implications, We further explore deeper issues such as the spatial evolution pattern and flow characteristics of tourism information flow in the Chengdu–Chongqing city cluster based on Internet tourism data from a more macro perspective. Then, based on the evolution model, we further expand the urban links between different network levels. Finally, from the three dimensions of push factor, pull factor and resistance factor, the driving mechanism is tracked and analysed for a long time. To a certain extent, the research field of tourism information flow in the Chengdu–Chongqing city cluster has been expanded. However, our study has some limitations, which are as follows: (1) This study mainly adopts Baidu, the most used search engine in China, as the data source, and data from other big data platforms are not considered for the time being. In addition, the flow of tourism information may also be disseminated through various forms, such as social media, television broadcasting and WeChat public number. Therefore, the subsequent study should strengthen the comprehensive use of search indexes of each data platform and relevant media network data. (2) In the process of analysing the evolution of the spatiotemporal pattern of tourism information flow, we found that the spatiotemporal pattern of tourism information flow in the Chengdu–Chongqing urban cluster changed more significantly in 2019. This change may be related to the nationwide outbreak of novel coronavirus in 2019, and we did not further explore the causal relationship between the two due to space limitations. Therefore, future studies can further investigate the impact of national outbreak prevention and control on tourism information flow in the Chengdu–Chongqing city cluster.

5. Conclusions

Based on the Baidu Index, this paper discusses the development trend and flow characteristics of the spatial and temporal pattern of tourism information flow in the Chengdu–Chongqing urban cluster from 2011 to 2021, deeply analyses the differences and connections of cities under the jurisdiction of urban agglomeration in different network levels, and further analyses the driving force from three aspects: the push factor of tourist source, the pull factor of destination, and the resistance factor between tourist source and destination. The main conclusions are as follows:
(1)
The year 2019 was a turning point in the spatiotemporal development of tourism information flows in the Chengdu–Chongqing urban agglomeration. There was a strong polarization effect in the aggregation and flow of tourism information flows in the region before 2019. The polarization effect became weaker after 2019.
(2)
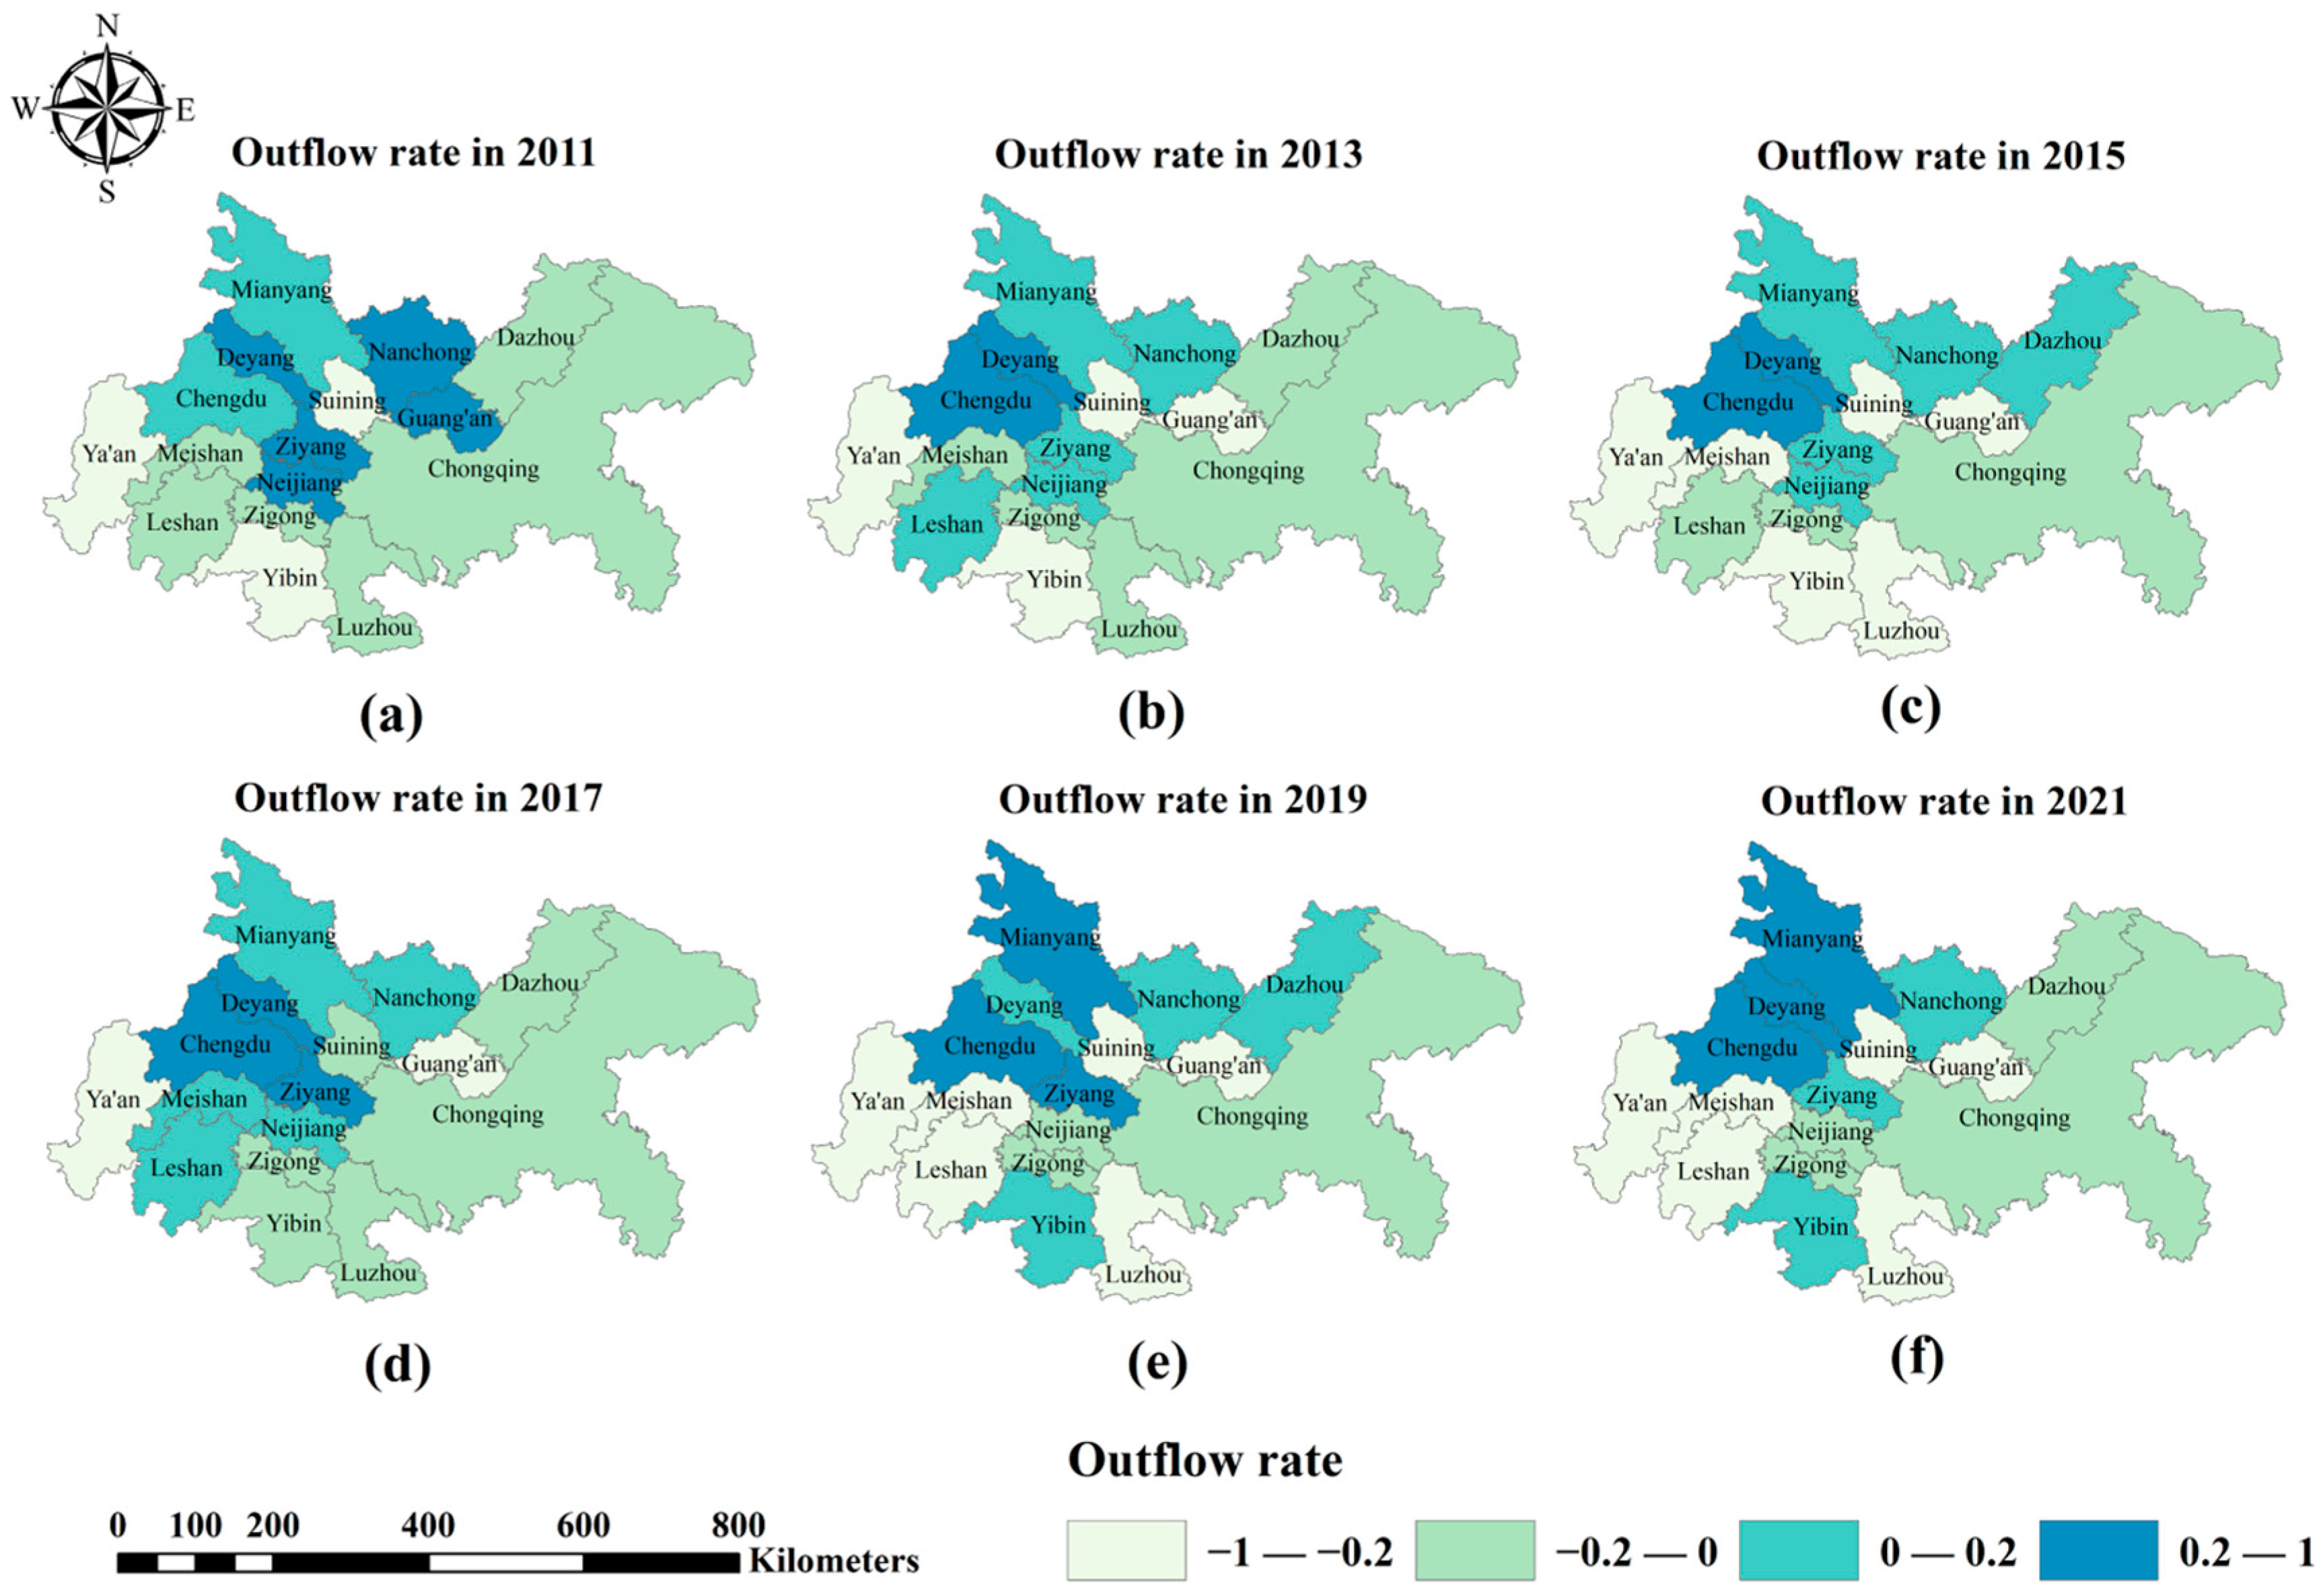
The Chengdu–Chongqing city cluster has a high mobility of tourism information flows. Cities with high outflow rates are mainly located around Chengdu. Cities with low outflow rates are mainly in the west, centre and south. There is a “central collapse” in the agglomeration effect of tourism information in the Chengdu–Chongqing urban group.
(3)
The tourism information flow between Chengdu and Chongqing is the core of the tourism information flow system of the Chengdu–Chongqing urban agglomeration. Chengdu is the most dominant and radiantly influential city, and its core position is higher than that of Chongqing. The tourism information flow network shows a radial shape with Chengdu and Chongqing as the core.
(4)
The push factors such as number of people buying pension insurance are the core driving mechanism in the tourism information flow system of the Chengdu–Chongqing urban cluster. The pull factors such as park green space area and the resistance factors such as psychological distance are secondary in the driving mechanism.
In summary, this study verifies the feasibility of Baidu Index data in the research field of tourism information flow in Chengdu–Chongqing urban agglomeration, and to a certain extent, it makes up for the problems of limited sample size and difficulty in comprehensively reflecting the real flow of tourism information flow that exist in traditional tourism passenger flow data. In addition, this study studies the flow of tourism information flow in the Chengdu–Chongqing city cluster from both outbound and inbound perspectives, which to a certain extent solves the shortcomings of traditional tourism passenger flow data in studying tourism information flow only from the perspective of inbound tourism. It is worth noting that the starting time of the research period of this paper is exactly the year when the Baidu Index platform was officially put into use. Therefore, from the perspective of the Baidu Index data source, we have achieved a long-term tracking analysis of the spatiotemporal evolution characteristics of tourism information flow in the Chengdu–Chongqing city cluster and its main driving factors. In terms of practical significance, this paper can help relevant tourism agencies and government departments to better grasp the demand and dynamics of tourists and formulate targeted tourism promotion strategies and service measures, so as to achieve the effect of optimizing tourism resource allocation and improving the quality of tourism through the study of the evolution of tourism information flow in Chengdu–Chongqing area. In terms of theoretical significance, this paper expands the research field of tourism information flow in the Chengdu–Chongqing city cluster to a certain extent. It helps to provide a more comprehensive and in-depth research perspective for the field of tourism geography, thus promoting the innovation and development of tourism geography. From the perspective of social and academic contributions, this paper can provide a scientific basis for the sustainable development of tourism and socioeconomic development in the Chengdu–Chongqing city cluster, enrich and improve the academic knowledge system in the field of tourism geography, and promote the in-depth development and cross-fertilization of tourism and geography.

Author Contributions

Yang Zhao and Zegen Wang were responsible for the design of the study. Peng Xu, Qian Wang and Xuemei Du collected the data. Yang Zhao and Zhiwei Yong analysed the data and wrote the manuscript. All authors have read and agreed to the published version of the manuscript.

Funding

This work was financially supported by the Science and Technology Cooperation Project of CNPC-SWPU Innovation Alliance (Grant No.2020CX020000).

Data Availability Statement

Data for this study were obtained from the Baidu Index website “https://index.baidu.com (accessed on 1 March 2023)”, Sichuan Provincial Bureau of Statistics “http://tjj.sc.gov.cn/ (accessed on 1 March 2023)”, Chongqing Municipal Bureau of Statistics “http://tjj.cq.gov.cn/index.html (accessed on 1 March 2023)”, China Internet Network Information Center “https://www.cnnic.net.cn/ (accessed on 1 March 2023)”, and the websites of the statistical bureaus of the cities in the Chengdu–Chongqing urban agglomeration.

Acknowledgments

Thank you to all the participants in this study. To the Sichuan Provincial Bureau of Statistics, the Chongqing Municipal Bureau of Statistics, the China Internet Network Information Centre and the statistical bureaus of the cities in the Chengdu–Chongqing urban agglomeration who provided data support for this study.

Conflicts of Interest

The authors declare no conflict of interest.

References

  1. China Internet Network Information Center. The 50th ‘Statistical Report on Internet Development in China’; China Internet Network Information Center: Beijing, China, 2022; Volume 31, p. 12. (In Chinese)
  2. Lee, C.; Hong, J.H. The Value of Information at each stage of the Tourism Flow: Application of TAM. Event Conv. Res. 2022, 18, 255–275. [Google Scholar] [CrossRef]
  3. Ruan, W.Q.; Zhang, S.N. Can tourism information flow enhance regional tourism economic linkages? J. Hosp. Tour. Manag. 2021, 49, 614–623. [Google Scholar] [CrossRef]
  4. Kim, D.-S.; Eun-Gyo, C. The Effect of Tourism SNS Service Quality on Perceived Usefulness, Tourism Flow and Tourism Experience. J. Tour. Leis. Res. 2021, 33, 41–66. [Google Scholar] [CrossRef]
  5. Li, A.J.; Mou, N.X.; Zhang, L.X.; Yang, T.F.; Liu, W.B.; Liu, F. Tourism Flow Between Major Cities During China’s National Day Holiday: A Social Network Analysis Using Weibo Check-in Data. IEEE Access 2020, 8, 225675–225691. [Google Scholar] [CrossRef]
  6. Li, S.W.; Du, S.Y. An Empirical Study on the Coupling Coordination Relationship between Cultural Tourism Industry Competitiveness and Tourism Flow. Sustainability 2021, 13, 5525. [Google Scholar] [CrossRef]
  7. Wei, S.; Guo, C.L. Study on Regional Control of Tourism Flow Based on Fuzzy Theory. Wirel. Commun. Mob. Comput. 2021, 2021, 9648879. [Google Scholar] [CrossRef]
  8. Chen, X.J.; Huang, Y.; Chen, Y.S. Spatial Pattern Evolution and Influencing Factors of Tourism Flow in the Chengdu-Chongqing Economic Circle in China. ISPRS Int. J. Geo-Inf. 2023, 12, 121. [Google Scholar] [CrossRef]
  9. Gao, H.J. A study on the spatio-temporal evolution of Tibetan inbound tourism flow network based on social networks. In Proceedings of the International Conference on Environmental Remote Sensing and Big Data (ERSBD), Wuhan, China, 29–31 October 2021. (In Chinese). [Google Scholar]
  10. Liu, Y.W.; Liao, W. Spatial Characteristics of the Tourism Flows in China: A Study Based on the Baidu Index. ISPRS Int. J. Geo-Inf. 2021, 10, 378. [Google Scholar] [CrossRef]
  11. Wu, L.P.; Zhang, J. A study on the supply factors and mechanism of the inter-regional diffusion and transfer of inbound tourism flow. Curr. Issues Tour. 2022, 26, 392–406. [Google Scholar] [CrossRef]
  12. Qin, X.H.; Li, X.M.; Chen, W.; Tan, H.L.; Luo, L.; Xu, X.H. Tourists’ digital footprint: The spatial patterns and development models of rural tourism flows network in Guilin, China. Asia Pac. J. Tour. Res. 2022, 27, 1336–1354. [Google Scholar] [CrossRef]
  13. Shao, Y.H.; Huang, S.S.; Wang, Y.Y.; Li, Z.Y.; Luo, M.Z. Evolution of international tourist flows from 1995 to 2018: A network analysis perspective. Tour. Manag. Perspect. 2020, 36, 100752. [Google Scholar] [CrossRef] [PubMed]
  14. Du, S.Y.; Bahaddad, A.A.; Jin, M.Z.; Zhang, Q. Research on the tourist flow feature of scenic area based on fractal statistical model—A case of zhangjiajie. Fractals-Complex Geom. Patterns Scaling Nat. Soc. 2022, 30, 2240103. [Google Scholar] [CrossRef]
  15. Zhao, J.Y.; Destech Publicat, I. Research on City Inbound Tourism Network System Characteristics of Henan Province-Based on Space of Flows. In Proceedings of the 2017 2nd International Conference on Humanities Science, Management and Education Technology (HSMET), Zhuhai, China, 23–24 September 2017; pp. 262–269. [Google Scholar]
  16. Aslanidis, N.; Bariviera, A.F.; Lopez, O.G. The link between cryptocurrencies and Google Trends attention. Financ. Res. Lett. 2022, 47, 102654. [Google Scholar] [CrossRef]
  17. Coupe, T. Who is the most sought-after economist? Ranking economists using Google Trends. South. Econ. J. 2022, 89, 611–642. [Google Scholar] [CrossRef]
  18. Zhu, X.Y.; Xia, C.Y. Visual network analysis of the Baidu-index data on greenhouse gas. Int. J. Mod. Phys. B 2021, 35, 2150115. [Google Scholar] [CrossRef]
  19. Wang, Y.W.; Xi, M.M.; Chen, H.; Lu, C. Evolution and Driving Mechanism of Tourism Flow Networks in the Yangtze River Delta Urban Agglomeration Based on Social Network Analysis and Geographic Information System: A Double-Network Perspective. Sustainability 2022, 14, 7656. [Google Scholar] [CrossRef]
  20. Liu, F.J.; Zhang, J.; Cheng, D.D. The Characteristics and Dynamical Factors of Chinese Inbound Tourist Flow Network. Acta Geogr. Sin. 2010, 65, 1013–1024. (In Chinese) [Google Scholar]
  21. Han, J.L.; Ming, Q.Z.; Shi, P.F.; Luo, D.S. The structural characteristics and influencing factors of tourism information flow network in China based on Baidu index. J. Shaanxi Norm. Univ. Nat. Sci. Ed. 2021, 49, 43–53. (In Chinese) [Google Scholar]
  22. Liu, S.H. Study on Spatial-Temporal Evolution and Dynamic Mechanism of Urban Tourism Information Flow in the Yellow River Basin Based on Baidu Index. Master’s Thesis, Ludong University, Yantai, China, 2021. (In Chinese). [Google Scholar]
  23. Du, J.Z.; Xu, J.; Jin, C. Regional Virtual Tourism Flow and Its Influencing Factors Based on Baidu Index: A Case Study in Yangtze River Delta. Resour. Environ. Yangtze Basin 2021, 30, 290–301. (In Chinese) [Google Scholar]
  24. Li, H.Y.; Goh, C.; Hung, K.; Chen, J.L. Relative Climate Index and Its Effect on Seasonal Tourism Demand. J. Travel Res. 2018, 57, 178–192. [Google Scholar] [CrossRef]
  25. Jung, J.; Han, H.; Oh, M. Travelers’ switching behavior in the airline industry from the perspective of the push-pull-mooring framework. Tour. Manag. 2017, 59, 139–153. [Google Scholar] [CrossRef]
  26. Wang, J.F.; Xu, C.D. Geodetector: Principle and prospective. Acta Geogr. Sin. 2017, 72, 116–134. (In Chinese) [Google Scholar]
  27. Ding, R.; Fu, J.; Zhang, Y.L.; Zhang, T.; Yin, J.; Du, Y.M.; Zhou, T.; Du, L.Y. Research on the Evolution of the Economic Spatial Pattern of Urban Agglomeration and Its Influencing Factors, Evidence from the Chengdu-Chongqing Urban Agglomeration of China. Sustainability 2022, 14, 10969. [Google Scholar] [CrossRef]
  28. Zong, H.M.; Hao, L.S.; Dai, J.C. Study of Urban Network Structure in ChengduChongqing Economic Circle Based on Baidu Index. J. Southwest Univ. Nat. Sci. Ed. 2022, 44, 36–45. (In Chinese) [Google Scholar]
  29. Zhang, Y.; Jin, X.; Wang, Y.W.; Liu, R.T.; Jing, Y. Characterizing Spatial-Temporal Variation of Cultural Tourism Internet Attention in Western Triangle Economic Zone, China. Land 2022, 11, 2221. [Google Scholar] [CrossRef]
  30. Vogler, R. Revenge and catch-up travel or degrowth? Debating tourism Post COVID-19. Ann. Tour. Res. 2022, 93, 103272. [Google Scholar] [CrossRef]
  31. Liu, Y.L. Research on the Problems and Countermeasures in the Implementation of the Integrated Development Policy of Culture and Tourism in Deyang City. Master’s Thesis, Sichuan University, Chengdu, China, 2022. (In Chinese). [Google Scholar]
  32. He, W.; Zheng, S.W.; Zhao, X.Q. Exploring the spatiotemporal changes and influencing factors of urban resilience based on Scale-Density-Morphology-A case study of the Chengdu-Deyang-Mianyang Economic Belt, China. Front. Environ. Sci. 2023, 11, 1042264. [Google Scholar] [CrossRef]
  33. Hong, D.H. Build “Giant Panda Discovery Area” Culture Brand and Develop the Tourism Economy in Baoxing. In Proceedings of the 2nd International Conference on Education and Education Management (EEM 2012), Hong Kong, China, 4–5 September 2012; pp. 553–557. [Google Scholar]
  34. Pu, B.; Du, F. Dilemmas and Solutions on Healthcare Tourism: A Case of Ya’an City in China. In Proceedings of the 3rd International Conference on Education, Management and Social Science (EMSS), Xian, China, 16–17 March 2019; pp. 1–6. [Google Scholar]
  35. Wang, W.; Wang, S.Q.; Li, Y.S.; Feng, C. Assessing the sustainability and competitiveness of tourism economies in China’s Chengdu-Chongqing metropolitan area. Environ. Sci. Pollut. Res. 2022, 29, 66960–66978. [Google Scholar] [CrossRef]
  36. Zhou, Y.; Li, Z.L.; Chen, Y.; Wei, W. Evaluating the corresponding relationship between the characteristics of resource utilization and the level of urbanization: A case study in Chengdu-Chongqing Economic Circle, China. Environ. Sci. Pollut. Res. 2022, 29, 55816–55829. [Google Scholar] [CrossRef]
  37. Yao, Y.; Yang, J. The Top-Level Design and Local Path Differences in Chengdu-Chongqing Economic Zone Urban System: Analysis Based on Urban Positioning and Industrial Layout. In Proceedings of the 12th International Conference on Public Administration/1st International Symposium on West African Studies, Accra, Ghana, 14–17 November 2017; pp. 51–58. [Google Scholar]
  38. Zhi, K.Y.; Tan, Q.R.; Chen, S.; Chen, Y.J.; Wu, X.Q.; Xue, C.K.; Song, A.B. How Does Social Security Fairness Predict Trust in Government? The Serial Mediation Effects of Social Security Satisfaction and Life Satisfaction. Int. J. Environ. Res. Public Health 2022, 19, 6867. [Google Scholar] [CrossRef]
  39. Jeong, K.-M.; Kim, D.K. An Exploratory Study on TSA Methodology on Travel& Tourism GDP Contribution: Focused on WTTC Travel & Tourism Economic Impact 2016 Data. J. Tour. Leis. Res. 2017, 29, 77–94. [Google Scholar]
  40. Lachapelle, U.; Jean-Germain, F. Personal use of the Internet and travel: Evidence from the Canadian General Social Survey’s 2010 time use module. Travel Behav. Soc. 2019, 14, 81–91. [Google Scholar] [CrossRef]
  41. Vasanicova, P.; Jencova, S.; Gavurova, B.; Bacik, R. Cultural and natural resources as determinants of travel and tourism competitiveness. Transform. Bus. Econ. 2021, 20, 300–316. [Google Scholar]
  42. Khan, S.A.R.; Dong, Q.L.; Wei, S.B.; Zaman, K.; Zhang, Y. Travel and tourism competitiveness index: The impact of air transportation, railways transportation, travel and transport services on international inbound and outbound tourism. J. Air Transp. Manag. 2017, 58, 125–134. [Google Scholar] [CrossRef]
  43. Magano, J.; Vidal, D.G.; Sousa, H.F.P.E.; Dinis, M.A.P.; Leite, A. Psychological Factors Explaining Perceived Impact of COVID-19 on Travel. Eur. J. Investig. Health Psychol. Educ. 2021, 11, 1120–1133. [Google Scholar] [CrossRef] [PubMed]
  44. Kang, S.; Pai, C.K.; Kim, D. The Role of Chronological Age, Health, and Basic Psychological Needs for Older Adults’ Travel Intention. Sustainability 2019, 11, 6864. [Google Scholar] [CrossRef]
Figure 1. Chengdu–Chongqing urban cluster.
Ijgi 12 00414 g001
Figure 2. The normalized diagram of the total flow of tourism information in Chengdu–Chongqing urban cluster. The size of each bubble in the figure represents the normalized value of the total flow of tourism information in a city in a certain year.
Ijgi 12 00414 g002
Figure 3. Evolution map of spatial and temporal pattern of tourism information flow. (af) show a diagram for each of the six years. The map divides the total flow of tourism information of each city into five levels according to ArcGIS10.2 natural discontinuity point classification method. Different years are classified separately. Different levels are distinguished by the depth of color, and cities with the same color are at the same level.
Ijgi 12 00414 g003
Figure 4. Evolution of tourism information flow characteristics. (af) show a diagram for each of the six years.
Ijgi 12 00414 g004
Figure 5. Chengdu–Chongqing urban agglomeration tourism information flow network structure diagram. (af) show a diagram for each of the six years. The red lines are the skeleton network and the blue lines are the trunk network. The orange lines are the edge networks. The base map uses the natural discontinuity point classification method of ArcGIS10.2 to divide the total tourism information flow of each city into five levels. Different years are classified separately. Different levels are represented by the depth of color.
Ijgi 12 00414 g005
Table 1. Index system of driving force factors.
Target LayerRepresentative Indicators
push factorseconomic developmentGDP
population sizetotal population at the year-end
population density
information technology development leveltotal number of postal services
mobile phone access situation
number of Internet users
social security statusnumber of people buying pension insurance
pull factorseconomic developmentGDP
ecological environment qualitypark green space area
public service levelnumber of catering enterprises
bed number in health institutions
transportation conveniencehighway mileage
tourism resources servicenumber of 5A-level scenic spots
number of tertiary industry employees
resistance factorsspatial distancethe spatial distance between cities
temporal distanceminimum driving time between cities
psychological distancethe psychological distance between adjacent cities is 0
the psychological distance of all bordering cities is 1
Table 2. Spearman rank correlation test.
201120132015201720192021Mean Value
GDP(push factor)0.821 ***0.815 ***0.826 ***0.885 ***0.906 ***0.959 ***0.869
total population at the year-end0.4120.579 **0.706 ***0.715 ***0.771 ***0.791 ***0.662
population density0.1060.1060.0820.1470.1030.1260.112
total number of postal services0.514 **0.4240.3850.476 *0.615 **0.594 **0.501
mobile phone access situation0.653 ***0.585 **0.791 ***0.841 ***0.782 ***0.768 ***0.737
number of Internet users0.611 **0.682 ***0.647 ***0.644 ***0.791 ***0.682 ***0.676
number of people buying pension insurance0.817 ***0.897 ***0.926 ***0.897 ***0.868 ***0.891 ***0.883
GDP(pull factor)0.3200.2740.3240.3620.3380.4030.337
park green space area0.501 **0.614 **0.456 *0.543 **0.3590.526 **0.500
number of catering enterprises0.0650.2240.1560.3270.2250.3970.232
bed number in health institutions0.3400.3710.3530.3610.2940.2940.336
highway mileage−0.1390.2820.3380.2520.0910.2880.185
number of 5A-level scenic spots0.587 **0.3750.5170.436 *0.607 **0.465 *0.498
number of tertiary industry employees0.2460.3260.2820.2650.1880.2440.259
spatial distance−0.190 **−0.296 ***−0.282 ***−0.253 ***−0.274 ***−0.284 ***−0.263
temporal distance−0.122−0.261 ***−0.216 **−0.213 **−0.198 **−0.208 **−0.203
psychological distance−0.237 ***−0.298 ***−0.291 ***−0.310 ***−0.250 ***−0.241 ***−0.271
Note: ***, ** and * represent 1%, 5% and 10% significance levels, respectively.
Table 3. Geodetector factor detection results.
201120132015201720192021Mean Value
GDP(push factor)0.949 ***0.978 ***0.970 ***0.962 ***0.933 ***0.974 ***0.961
total population at the year-end 0.918 ***0.973 ***0.965 ***0.951 ***0.937 ***0.970 ***0.952
total number of postal services0.934 ***0.971 ***0.953 ***0.944 ***0.899 ***0.958 ***0.943
mobile phone access situation0.836 ***0.827 ***0.978 ***0.958 ***0.937 ***0.953 ***0.915
number of Internet users0.940 ***0.979 ***0.956 ***0.943 ***0.944 ***0.969 ***0.955
number of people buying pension insurance0.946 ***0.982 ***0.988 ***0.964 ***0.933 ***0.974 ***0.965
park green space area0.7120.909 ***0.940 ***0.6650.7660.936 ***0.821
number of 5A-level scenic spots0.710.4690.6510.4520.6250.4990.568
spatial distance0.4110.5370.5470.6730.6250.4550.541
temporal distance0.4520.4510.5490.6170.5410.5020.519
psychological distance0.4570.5870.6340.8080.6240.5210.605
Note: *** represent 1% significance levels, respectively.
Disclaimer/Publisher’s Note: The statements, opinions and data contained in all publications are solely those of the individual author(s) and contributor(s) and not of MDPI and/or the editor(s). MDPI and/or the editor(s) disclaim responsibility for any injury to people or property resulting from any ideas, methods, instructions or products referred to in the content.

