1. Introduction
Many cities create and operate 3D semantic models to ensure comprehensive planning and maintenance processes [
1]. A digital 3D representation of a building is a vital component of the digital city model. CityGML plays a key role in developing these models by providing not only a geometry representation, which is needed for various spatial analyses, but a semantic description of city objects with different features. It supports different Levels of Detail (LOD). It is an open XML-based standard published by the Open Geospatial Consortium (OGC). This is an application-independent Geospatial Information Model designed for semantic representation of city objects and landscapes in three-dimensional space. The CityGML standard is also a reference model in the European INSPIRE initiative [
2] (p. xv).
The building model is the most developed thematic concept [
2]. A lot of work is performed on the development of 3D building models in LOD1, comprising prismatic buildings with flat roof structures. This type of LOD can be considered as a starting point when information about rooftop geometry is unavailable. Although LOD1 building models are simple, they are widely used in various applications [
3]. However, there is a lack of detailed information on how to generate a valid CityGML model in LOD1 with a precise representation of building parts, addresses, and the terrain intersection curve (TIC), and what challenges can occur while modeling these features. In the standard case, the buildings have vertical walls and their roofs exactly overlap the footprints or overhang them [
4]. In such a trivial case, the projected roof area is the same as or greater than the built-up area. In reality, the correlation between the building footprint and the projected roof area is more complex. They can partially overlap due to the availability of overbuilt entrance areas, arcades, overbuild terraces, building parts with differentiated rooftops, etc. This, in turn, leads to different modeling approaches of buildings in LOD1, considering the complex relations between the footprints and the projected roof areas.
Another challenge in 3D modeling is the integration of the buildings and the terrain, since the buildings could float over or sink into the terrain [
2]. To address this issue, the CityGML standard defines the TIC of a 3D object, which can be applied both to a building and a building part. Most of the existing 3D models neglect to represent the intersection of the buildings and the terrain due to existing issues related to the unknown depth of the underground parts, different accuracy of datasets, irregular and uneven terrain, etc. [
5]. Considering that the buildings are designed and constructed on the terrain, the 3D model should not only contain the geometry of the objects themselves but also their intersection with the terrain.
Including information about the addresses is an additional challenging task in 3D modeling. The addresses are represented as a separate feature in the CityGML standard, having one
xalAddress property and an optional
multiPoint property [
2]. Issues related to the modeling of addresses arise when they are not unified and georeferenced in the original dataset, different building parts have different addresses, or address points are outside the building footprints.
Although a wide adoption of the standard, the practices related to the creation of CityGML models do not follow a uniform approach, especially when a particular feature needs to be modeled, such as the TIC, addresses, or the building part. This paper aims to tackle the challenges relating to the development of 3D building models in LOD1 by modeling a single neighborhood in the Bulgarian city of Sofia, following the good practices of the existing 3D city models. The proposed 3D building model resolves issues relating to the representation of building parts, addresses, and TIC in CityGML 2.0 standard. Two methods for dealing with buildings that have differentiated rooftops are examined: the modeling of a building as a single solid and the modeling of a building with separate building parts. In addition, a new method of modeling the TIC is proposed where duplicating and overlapping lines are removed. Finally, an address feature as a point object is implemented. Thus, the paper appraises the existing modeling guidelines and explores possible alternative approaches, which could facilitate visualization in web applications.
The remainder of the paper is structured as follows.
Section 2 presents a state-of-the-art analysis from different perspectives such as common practices, differences in LOD1 implementation, and 3D models of various cities worldwide.
Section 3 describes the modeling approach, the study area, and the corresponding data sources.
Section 4 is dedicated to the modeling process of 3D building features implementing improvements in the model structure.
Section 4 shows the visualization of the proposed building model and discusses related issues.
Section 5 discusses the obtained results.
Section 6 concludes the paper and gives directions for future work.
2. State-of-the-Art
This section presents the current work in 3D city modeling, including 3D modeling practices, variations and applications of 3D city models in LOD1, and issues related to modeling building parts, TIC, and addresses. In addition, sample 3D city models available as open data are compared according to the modeling methods used and the covered LOD and features.
2.1. 3D Modeling Practices
Numerous studies address various methods of generation and usage of the 3D city models. The city of Zurich provides a showcase of different applications of the 3D city model, including the planning of high-rise buildings and microclimate studies [
6]. It is worth noticing that CityGML is used in a limited way, according to the authors. The open data portal gives access to 3D building datasets in *.gpkg, *.shp, *.dxf, and *.gdb formats only [
7]. This case is similar to Prague, where the building model in CityGML is derived from the dataset in a proprietary format [
8] and remains publicly unavailable. On the contrary, the Kalasatama Digital Twins Project shows a broader adoption of the CityGML 2.0 standard by developing a city information model, which coexists with the reality mesh model of the territory [
9]. Experimental workflows are developed considering the whole process of the 3D city modeling in detail. Dimitrov and Petrova-Antonova [
10] propose a workflow starting from preparing 2D data to the generation of a CityGML model and finally visualizing it in a web application. The Novi Sad project provides a detailed description of 3D city model generation, including LIDAR data acquisition, 3D processing, and web-based visualization [
11].
Agugiaro describes an experimental case of enriching an existing CityGML model in LOD2 for the city of Vienna [
12]. Semantic data are added and the current CityGML model is regenerated to contain single-part and multi-part buildings. In addition, the model is extended with building models in LOD0 and LOD1. Prominent results of producing and visualizing country-wide official datasets are shown in the Netherlands [
13,
14], Sweden [
15], and Finland [
16], as well as other countries.
2.1.1. 3D Modeling in LOD1
The LOD1 building differs from the LOD2 building as it does not describe roof geometry, walls, and ground surfaces as separate objects. Nevertheless, LOD1 is frequently used due to the easy import procedures [
17].
Biljecki et al. [
4] propose that LOD1 models have differentiated top surfaces without splitting the buildings into their parts. This variation of LOD1 is not part of the CityGML standard. According to the authors, it belongs to LOD1.3. However, this proposal for LOD received high attention from researchers and practitioners. The Dutch Kadaster and the 3D Geoinformation research group at TU Delft produced a 3D city model in LOD1.3 that covered the whole of the Netherlands [
13]. This dataset is available officially [
18]. Sometimes there is a need for a simplification or downscaling from higher LOD to lower LOD [
19].
It is worth noting that selecting an appropriate 3D geometry representation for buildings could be a challenging task. Recent research dedicated to the Digital geoTwin of Vienna considers the methods of creating 2D data from 3D models or generating coarser 3D models from more detailed 3D models [
20]. The authors introduce an addition to the improved LOD specification proposed by Biljecki et al. [
4].
The 3D geometry is an essential base for various types of spatial analysis, e.g., noise propagation, energy modeling, or wind simulation. It is assumed that there is no 3D model suitable for all possible applications [
21,
22]. A coarse model with correct geometry can be more valuable than a more detailed model with geometrical errors. It is easier to conduct an environmental analysis such as a wind simulation if the 3D model is reasonably simplified. For example, edges less than 2 m can be removed [
23] with the help of a sweep-plane algorithm proposed by Piepereit et al. [
24]. This simplification method works with extruded 3D solids, while it will be more efficient to generalize footprints before the extrusion. The LOD0 footprint could play an essential role as a basis for the extrusion of buildings.
A similar case of downgrading details of LOD2 for microclimate simulations is explored by Chen et al. [
25]. LOD1.1 [
4] building models can be used for large areas such as the whole city, while LOD1.3 models are suitable for local districts, where a grid cell can be around 15 m.
The possible integration of cadastral data and 3D city models provides attractive prospects if the cadastral database is continuously used for the model’s update. The footprints used to extrude buildings in LOD1 often come from the cadastral map. The study of the 3D cadaster in China [
26] shows that CityGML is close to another XML-based format ISO19152 LADM [
27] dedicated to land administration. LADM can contain a linkage to 3D models of building structures. In this case, LOD1 models could incorporate cadastral footprints as LOD0 features.
Last but not least, the existing 3D city models often cannot meet all the requirements of different stakeholders: local authorities, urban planners, real estate developers, or architects. Julin et al. [
28] highlight a gap between 3D city models and the initial expectations of the wide range of possible uses (e.g., visualization or any spatial analysis). The large-sized city models imply challenges regarding their storage and update [
29]. To be a valuable resource for the public authorities and other stakeholders, 3D city models need to be constantly updated [
30]. Ledoux et al. [
31] (p. 2) argue that CityGML-based models are difficult to parse and extract information from.
2.1.2. Building Parts, Terrain Intersection Curves, and Address Features
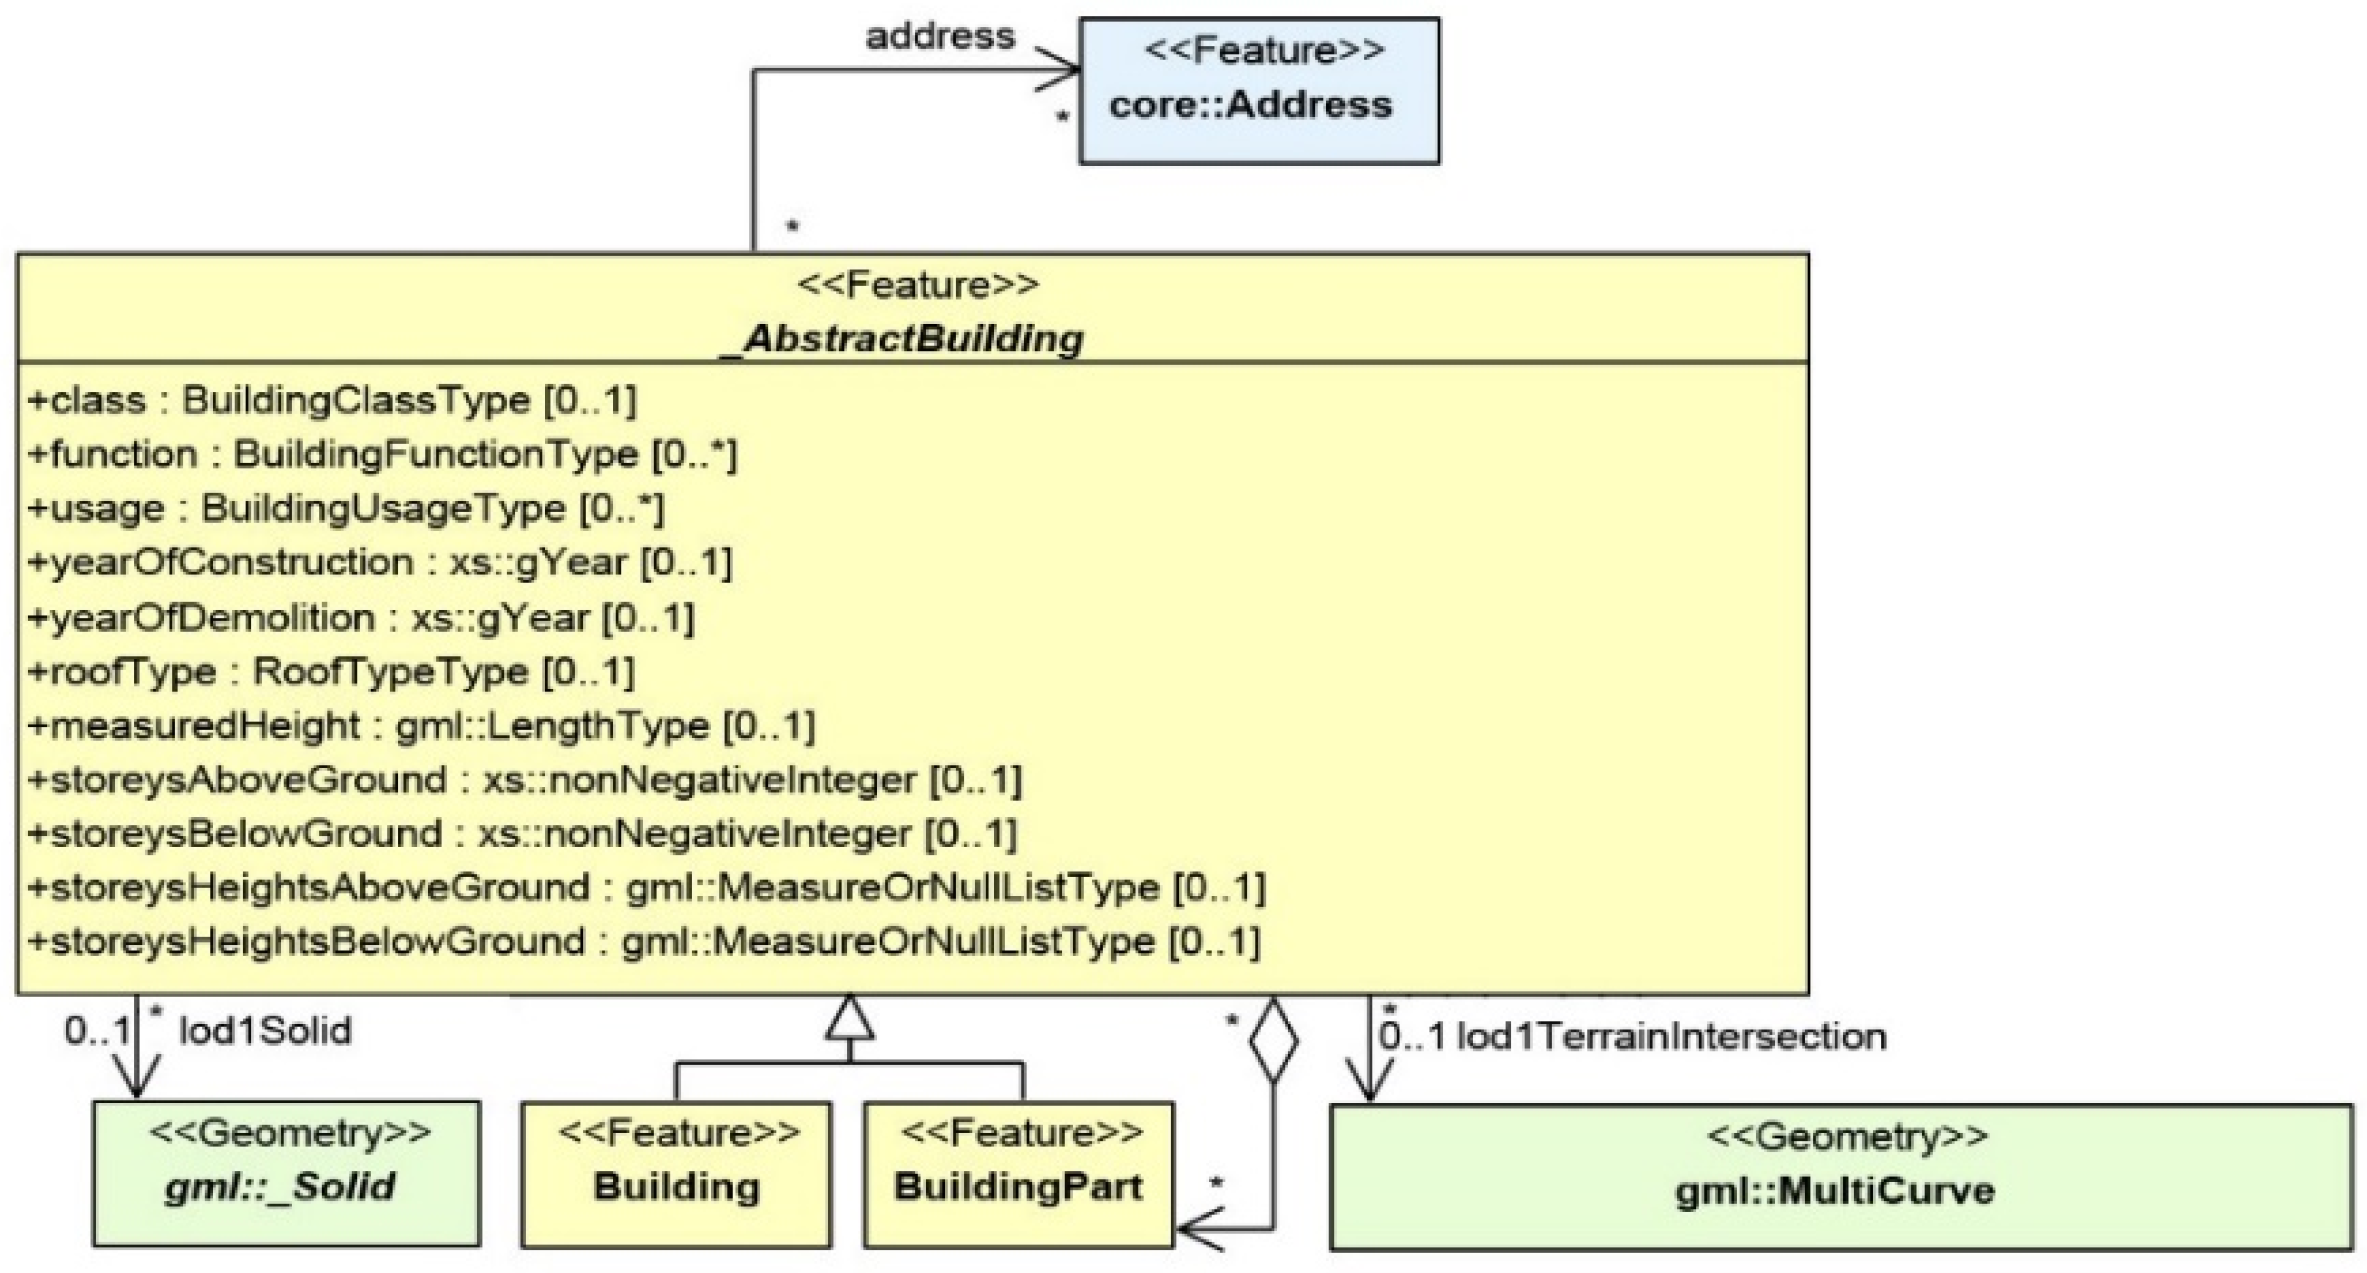
The BuildingPart class is one of the two subclasses of _AbstractBuilding according to CItyGML 2.0 Encoding Standard. If a building only consists of one (homogeneous) part, the Building class shall be used. A building composed of structural segments differing in, for example, the number of stories or the roof type has to be separated into one Building with no geometry having one or more additional BuildingPart [
2].
The discussion on the usage of the building part within CityGML starts when integration of different data sources comes into effect. According to Eriksson et al. [
32], in geodata (CityGML, INSPIRE) and BIM-specifications (IFC) [
33], the building part is not identical. There are no exact requirements for using this type of feature, and this ambiguity can complicate the modeling and the exchange of data between various software packages. In this context, the Swedish building standard (working name CityGML Sve-Test) requires a building feature to consist of building parts only. However, no guidelines on the division of a building into its parts are provided [
34] (p. 124). Finally, the integration between BIM applications and CityGML Sve-Test was explored [
15]. A similar approach of usage of the building part is demonstrated by Visuri et al. [
16].
On the contrary, the case of the Netherlands shows the absence of the building part in the official CityJSON datasets [
18] because of the aforementioned ambiguity of this feature.
Another example of a specific application of the building part is explored by Jang et al. [
35]. CityGML becomes a basis for flood damage simulations. However, in CityGML 2.0, there is no such feature representing a separate floor of a building as a geometrical object, so it was modeled as a building part. As mentioned in the Introduction, the TIC is not modeled in most of the existing 3D models, possibly due to existing issues related to the unknown depth of the underground parts, different accuracy of datasets, irregular and uneven terrain, etc. [
5]. In some cases, underground parts are defined in building datasets (generating, storing), thus the TIC could be used in theory. According to Jang et al. [
35], the TIC can be used in flood simulation. The flooding height of the building was estimated based on the terrain relief, the hydraulic analysis based on the terrain relief, and the building TIC.
Yan et al. [
5] investigate how the terrain intersection curve can be generated and propose five cases of the generation of the TIC depending on the initial datasets. The 2D footprints and the digital terrain model (DTM) are the most used datasets for developing building models in LOD1 [
5]. According to the proposed method, the resulting building model includes a bottom non-planar surface draped onto the ground surface, which is a rare approach.
To the best of our knowledge, there are no research works dedicated to modeling the address feature. Such information can be obtained from the existing 3D city models provided as open data, which is further discussed in the next section.
2.1.3. D City Models as Open Data
This section provides an overview of the open datasets identified by the 3D geoinformation research group (Delft University of Technology) [
36]. The official CityGML datasets of 18 cities available on geoportals of local authorities are selected for exploration. The building models in LOD1 developed within research projects, such as that of Singapore, are excluded from the study. Building models that are not based on the CityGML standard are also not considered.
Table 1 presents a comparison of building models, giving information about the country and city where the model is produced, the year of the last update, and the LOD implemented. The columns “Building part” and “TIC” demonstrate the presence of those features. The column “xAl Address + geometry” shows whether an address is represented as a xAl-based feature, plain text, or if it also contains a point geometry.
Table 1 includes primary LOD1 datasets, except those of Vienna and Linz, which have LOD2. The last row shows the proposed 3D building model. All datasets are visually explored using FZK Viewer.
Table 1.
3D city models in CityGML LOD1.
Table 1.
3D city models in CityGML LOD1.
| Country | City or State | Year of Last Update | LODs within a Dataset | Building Part | xAl Address + Geometry | TIC | Ref. |
|---|
| USA | New York | 2016 | LOD2 | no | Address is missing | no | [37] |
| Germany | North Rhine–Westphalia state | 2020 | LOD1 | yes | xAl Address + geometry | no | [38] |
| Germany | Hamburg | 2021 | LOD1 | yes | xAl Address | yes | [39] |
| Germany | Potsdam | 2012 | LOD1, LOD2 | no | xAl Address | no | [40] |
| Germany | Berlin | 2014 | LOD2 | no | xAl Address | no | [41] |
| France | Lyon | 2018 | LOD1, LOD2 - landmarks | no | Address as a plain attribute | no | [42] |
| Luxembourg | Luxembourg | 2019 | LOD1 | no | Address is missing | no | [43] |
| Belgium | Namur | 2018 | LOD2 - solid | no | Address is missing | no | [44] |
| Finland | Helsinki, Kalasatama | 2019 | LOD1, LOD2 | no | xAl Address | no | [45] |
| Finland | Helsinki | 2019 | LOD1 | no | xAl Address | no | [46] |
| Finland | Espoo | 2021 | LOD2 | no | xAl Address | yes | [47] |
| Estonia | Tallinn | 2021 | LOD1 | no | xAl Address + geometry | no | [48] |
| Austria | Vienna | 2016 | LOD2 | yes | Address is missing | no | [49] |
| Austria | Linz | 2020 | LOD2 | yes | Address is missing | no | [50] |
| Netherlands | Rotterdam | 2020 | LOD1 | yes | xAl Address + geometry | no | [51] |
| Poland | Poznan | 2021 | LOD1 | no | Address is missing | no | [52] |
| Bulgaria | Sofia | 2021 | LOD1 | yes | xAl Address + geometry | yes | |
Regional specifics seem to be quite pronounced. Only one US city model (New York, NY, USA) is examined, since it is delivered as a publicly available CityGML dataset. It dates from 2016 and future plans for any updates are not affirmed. Other US city models rely mainly on ESRI proprietary formats and less semantically rich 3D formats such as 3DS, OBJ, DAE, etc. To the contrary, there is a range of cities in Germany (note that North Rhine–Westphalia state consists of 29 cities) where official CityGML datasets are publicly available. Berlin and Potsdam provide datasets dated back to 2014 and 2012, respectively. Another significant group of cities adopting the CityGML standard can be found in Finland and Estonia. Although a lot of papers on CityGML-related topics have been published by researchers from Delft University of Technology in Netherlands, only Rotterdam has an official CityGML model. In the case of Amsterdam, only models based on DAE and DXF formats are available. It is noteworthy that a large country-wide dataset 3DBAG relies on CityJSON and other 3D formats.
The building part is implemented in 5 of the 18 datasets: Linz, Vienna, North Rhine-Westphalia state (NRW), Hamburg, and Rotterdam. Vienna and Linz are modeled in LOD2. In the case of Vienna, the building part is purely defined by the change of roof form and elevation. The Linz dataset demonstrates detailed structures (even steps in stairs) and fails to meet any requirements of the SIG3D manual regarding building parts [
53] (pp. 18–20). Sometimes, building parts represent tiny elements such as a stair railing, but they do not provide any benefits. NRW and Hamburg implement the building part in a similar way: parts depict the main forms of a building as extruded footprints without the evidence of various usages. The last case of Rotterdam follows the same approach as that of NRW and Hamburg, but the buildings are quite detailed since their parts are extruded separately and have different height attributes.
The address feature is implemented in four different ways: (1) an address feature as a regular xAl feature (7 of 18 datasets); (2) an address feature with xAl structure and point geometry (3 of 18 datasets); (3) an address stored as a plain custom attribute (1 of 18 datasets); (4) a missing address in any form (7 of 18 datasets). The CityGML standard covers the first and the second options for modeling of address feature. The case of Rotterdam shows the address features as geometrical points with limited xAl information. The address point itself is located within the building footprint.
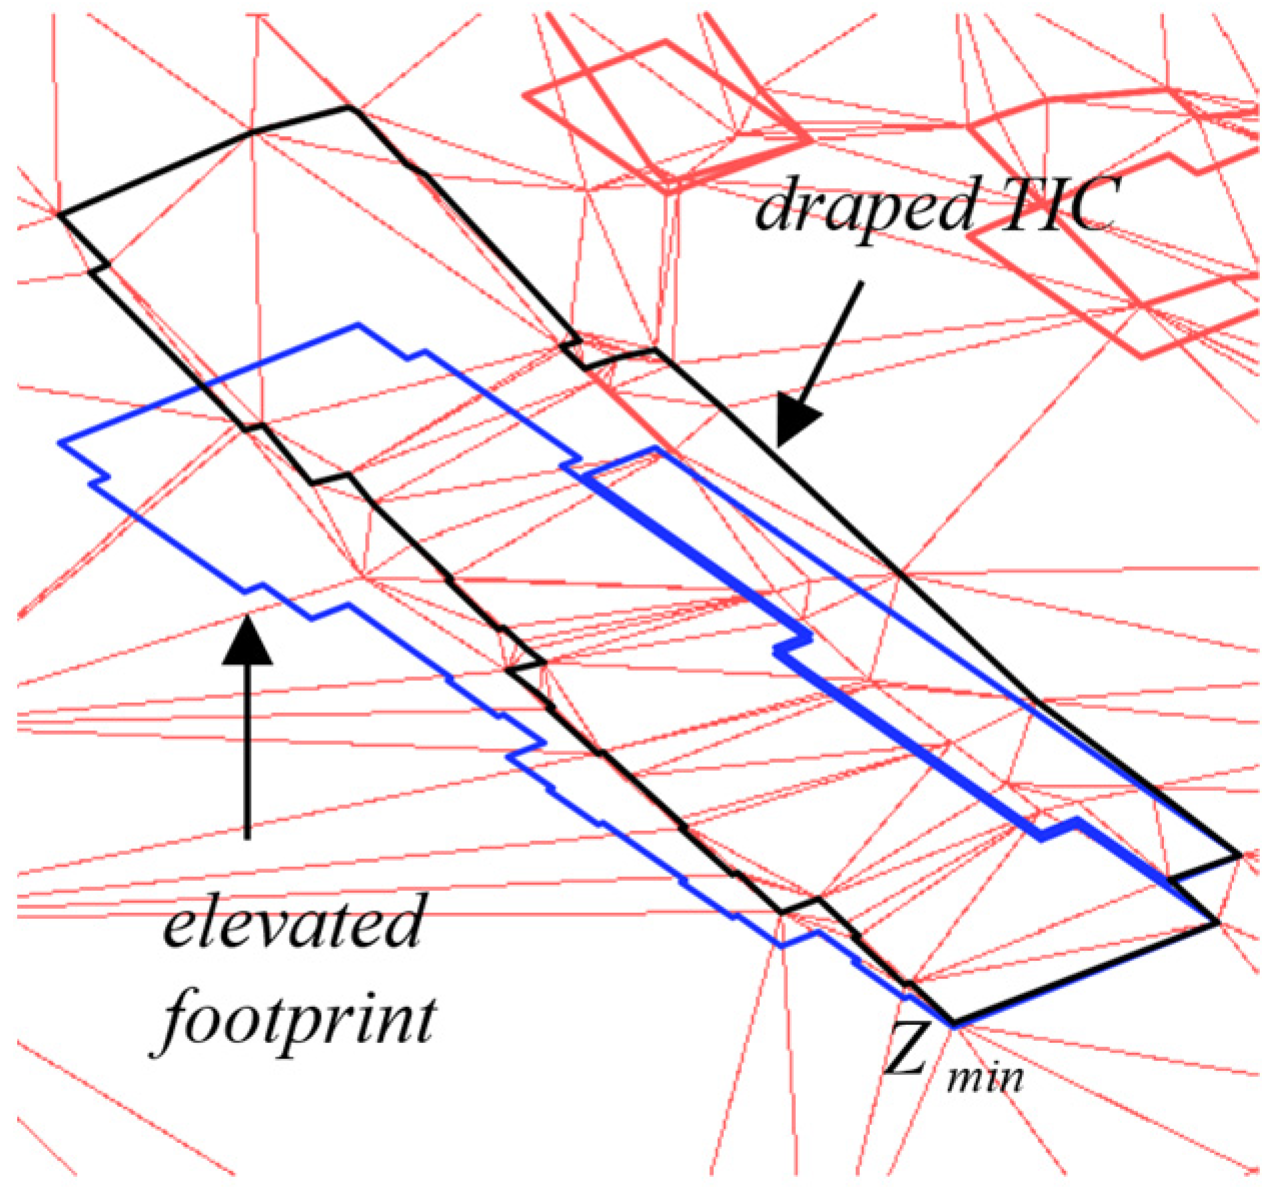
The TIC is implemented in only two city models (Hamburg and Espoo). In both cases, this feature is generated as an intersection line of an extruded building footprint and a terrain surface. A building itself usually is elevated according to a minimum Z-value of its outline draped onto a terrain surface [
5]. This can be considered a purely formal approach, while no underground structures are modeled. Another interesting point in both cases is a TIC surrounding each building in a group of buildings. The adjacent buildings are constructed in a row with no gaps, and logically there should be no terrain intersection lines on adjacent wall surfaces.
Taking into account the above considerations, the following approach is chosen for the development of the proposed 3D city model. The 3D building model includes building parts, although some issues about representing the hierarchy “building—building part” arise in model visualization in other GIS software. The significant variations of the rooftop levels within a single solid are manually modeled. They are considered in the proposed LOD 1.3 by Biljecky et al. [
4] (p. 30). Manual editing is an appropriate method of modeling in the case of landmarks, in which significant variations of rooftops determine the perception of a building. In the proposed 3D model, the address feature is modeled as a geometrical point or points if there are multiple addresses assigned to a single building. Within the case of multiple addresses for a single building, the
multiPoint attribute allows precise specification of the building entrances’ locations [
2] (p. 54). The point coordinates can be 2D or 3D. This could be useful for navigation purposes at any LOD. The TIC is an optional feature when the underground structures are unknown. It represents an intersection with the ground on a façade surface. The implementation of TIC features without unnecessary lines on the adjacent wall surfaces can lead to a more complicated workflow. In this paper, we propose a new approach for modeling the TIC, where intersection curves surround only the external walls of a group of buildings.
3. Materials and Methods
This section describes the specifics of the study area and data sources used for modeling. The modeling workflow for the development of the 3D city model and implementation details about modeling the terrain, building parts, and addresses are explained.
3.1. Modeling Approach
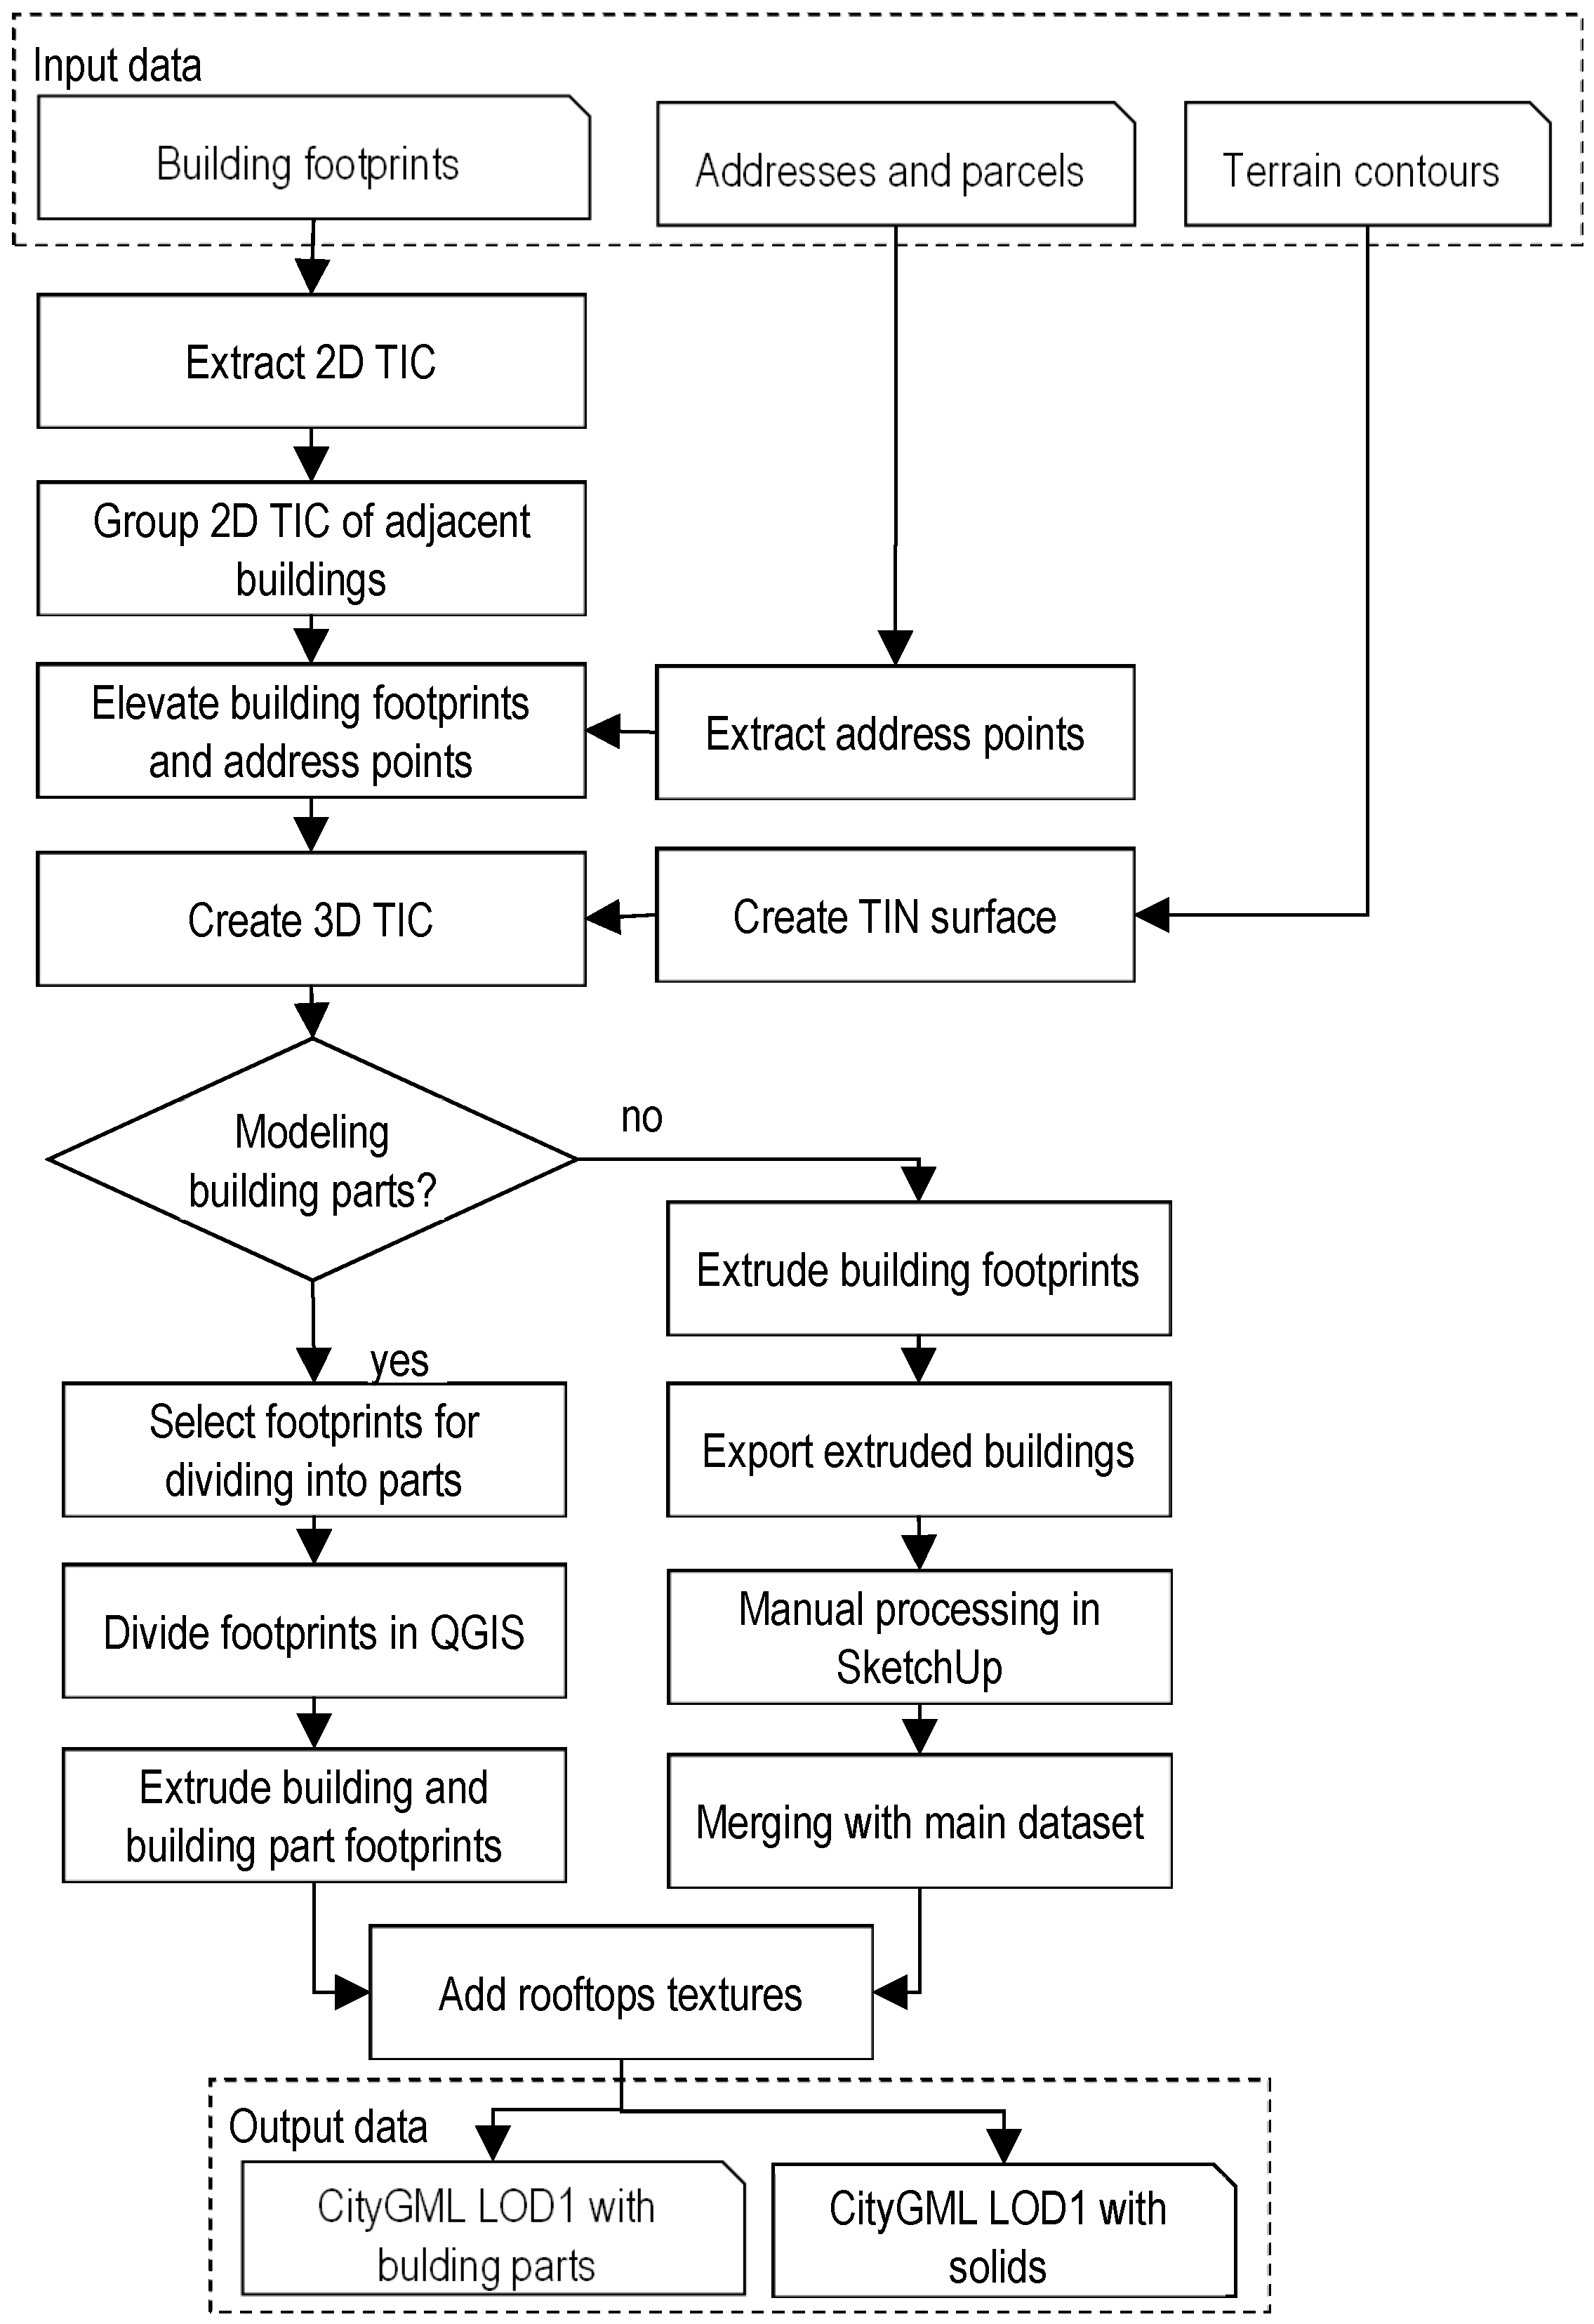
The modeling workflow followed for the development of the 3D city model is shown in
Figure 1.
The building heights are calculated based on their number of floors above the ground and usage, e.g., residential building, school, retail, etc. Buildings with substantial differences in the heights of their parts are selected to be modeled using the building part feature in CityGML. Two modeling approaches are applied: (1) Modeling a solid building with a differentiated rooftop and (2) modeling a building as a group of building parts with different heights. A triangular irregular network (TIN) is generated using the terrain contours. The TIC is generated based on the intersection between the buildings and the terrain. To enrich buildings with address information, those datasets containing building footprints, addresses, and parcels are spatially joined. Since the datasets do not provide an explicit link between the address points and the corresponding buildings, four rules are defined and applied for modeling the addresses. Finally, textures of the rooftops are obtained from orthophoto imagery. FME Workbench 2021.1 is used as a tool for data transformation and modeling.
3.2. Study Area and Data Sources
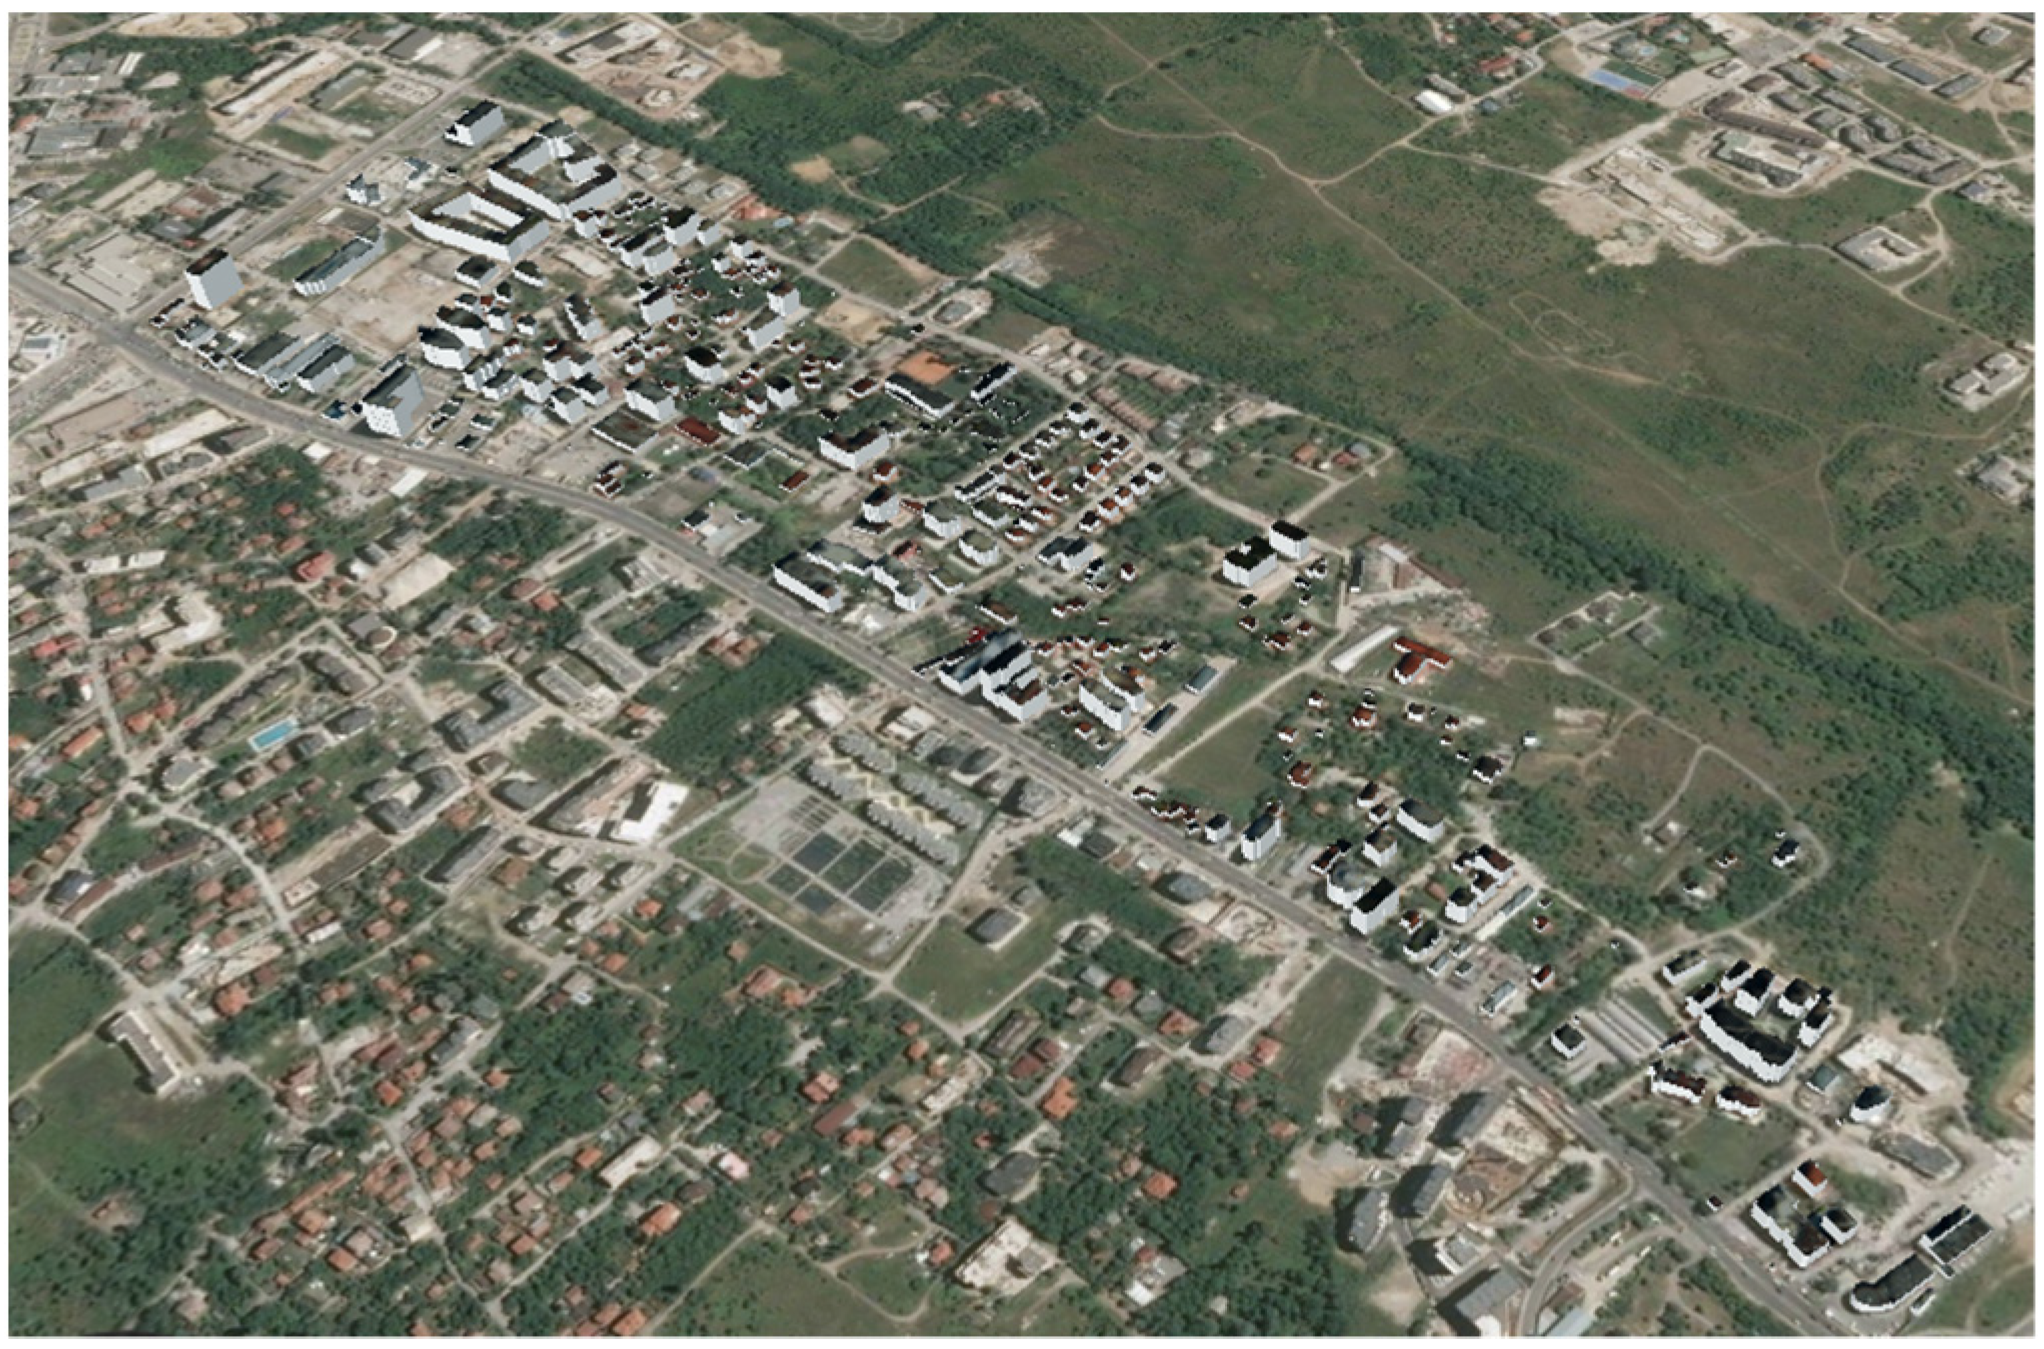
Sofia is the capital and largest city of Bulgaria, with a population of nearly 1.27 million. It consists of 24 districts. Given its heterogeneity in geometry, infrastructure, and environment, district Lozenets of Sofia is chosen as a case study for the development of a 3D city model. A significant part of the district is occupied by low-rise residential buildings among trees and shrubs. At the same time, there are regions with intensive construction such as the Krastova vada neighborhood, where problems with accessibility and availability of the road infrastructure, public spaces, and public services arise. The neighborhood covers an area of 59 hectares.
The datasets for implementation of the city model are primary cadastral data provided by Sofiaplan—a municipal enterprise responsible for the spatial and strategic planning of Sofia Municipality. The coordinate reference system of source data is BGS2005/ CCS2005 (Bulgaria Geodetic System 2005, EPSG: 7801), which is generally used by Sofia city.
Table 2 describes the input datasets.
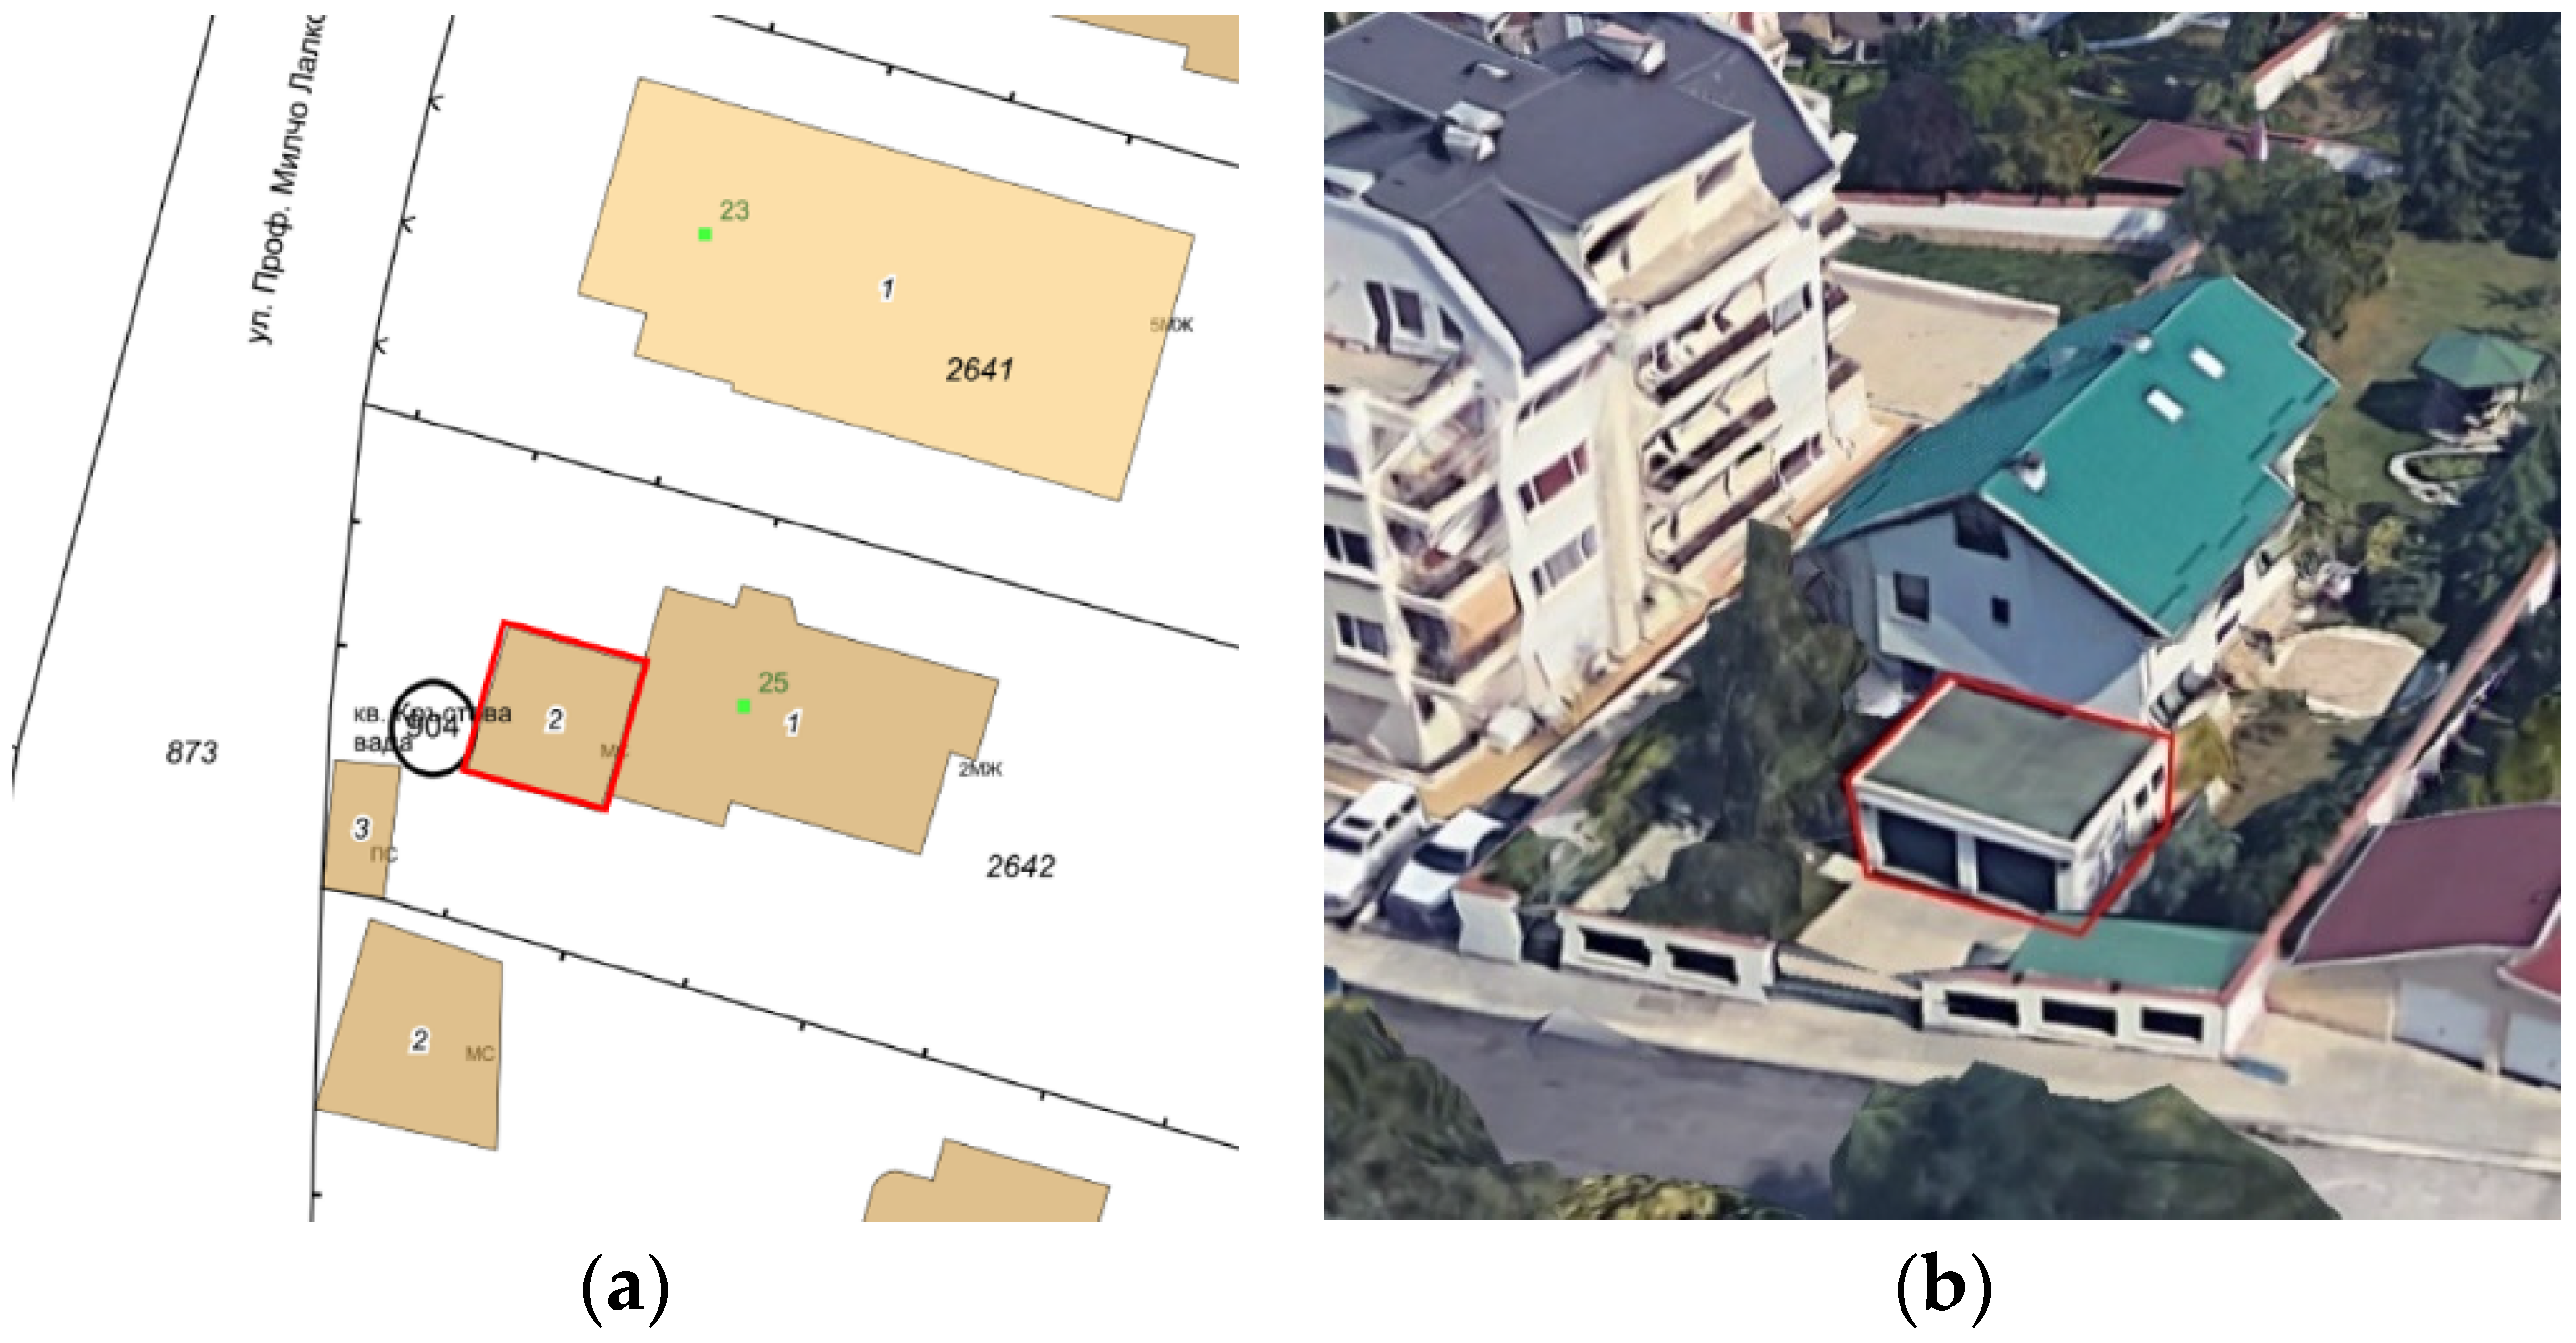
The building footprints originate from the cadastral map and contain various attributes, including the floor count above the ground and codes of usage type. However, there is no link between the buildings and their corresponding addresses. Every footprint represents a single building without separate building parts. Adjacent buildings within the same parcel as garages, warehouses, etc., are treated in the cadaster as different property items. Thus, this information cannot be used as a basis for modeling building parts.
Figure 2 shows the garage as a separate property in the cadastral map and Google Earth view.
To calculate their heights, buildings are grouped into three categories according to their usage type: (1) residential buildings, (2) amenities including schools or retail outlets, and (3) others.
Several buildings with substantial differences in the heights of their parts are selected to be modeled using the building part feature in CityGML. Google Earth imagery and an orthophoto of the study area are used for the visual inspection and selection of the most suitable buildings. Their footprints are extracted to a separate dataset and manually divided into regions with different heights using QGIS.
Since there is no information about the underground structures, the TIC has to be generated automatically based on the intersection between the buildings and the terrain.
Addresses are represented as points. Since some are located outside the building footprints, additional effort to join the buildings and addresses is needed. Certain buildings have more than one address due to the availability of separate entrances. The parcels do not provide any useful information except for spatial linking of addresses and buildings.
Terrain contours with a 1-m interval are used to form a digital terrain model of the neighborhood. City unit geometry represents the administrative boundaries of the Krastova vada neighborhood and clips all the relevant datasets. The satellite imagery has a 0.3-m resolution and three bands containing RGB-values. This dataset is used as a texture for rooftops.
3.3. Modeling of the Terrain Intersection Curve and Buildings in LOD1
This section describes the modeling process of the buildings, including building parts, addresses, and the TIC.
3.3.1. Integration of Buildings and Addresses
There is no explicit link between the address points and the corresponding buildings. Thus, the following rules are applied to merge them:
Link parcels and buildings based on the boundaries of parcels and footprint centroids;
Link addresses and footprints if an address point or points are located within a footprint;
Link addresses and footprints if an address point or points are located within a 2-m distance from a footprint;
Link addresses and footprints if an address point or points share the same parcel with a building.
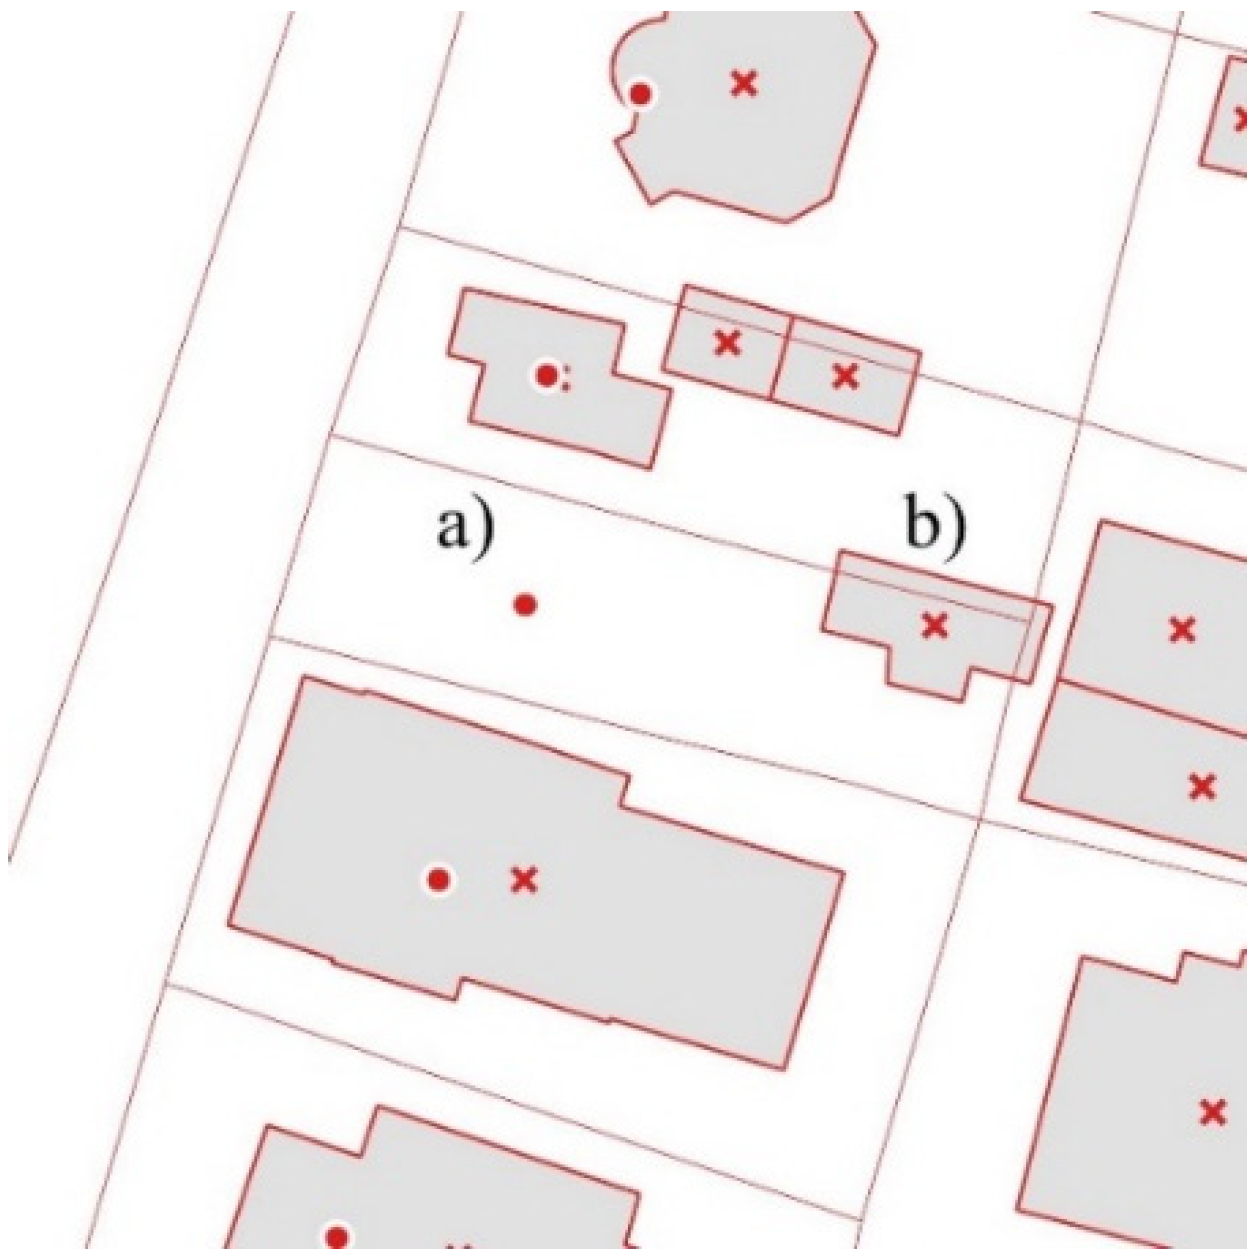
Figure 3 shows the case when the address (a) is quite far from the footprint, but (b) both are in the same parcel. The centroids of the footprints are marked with red crosses, while the address points are represented with red dots. The addresses and buildings are linked via an attribute “gml_parent_id”, which is a unique ID of a building. The processed building footprints and address points are written into a new dataset.
3.3.2. Modeling of the Terrain Intersection Curve
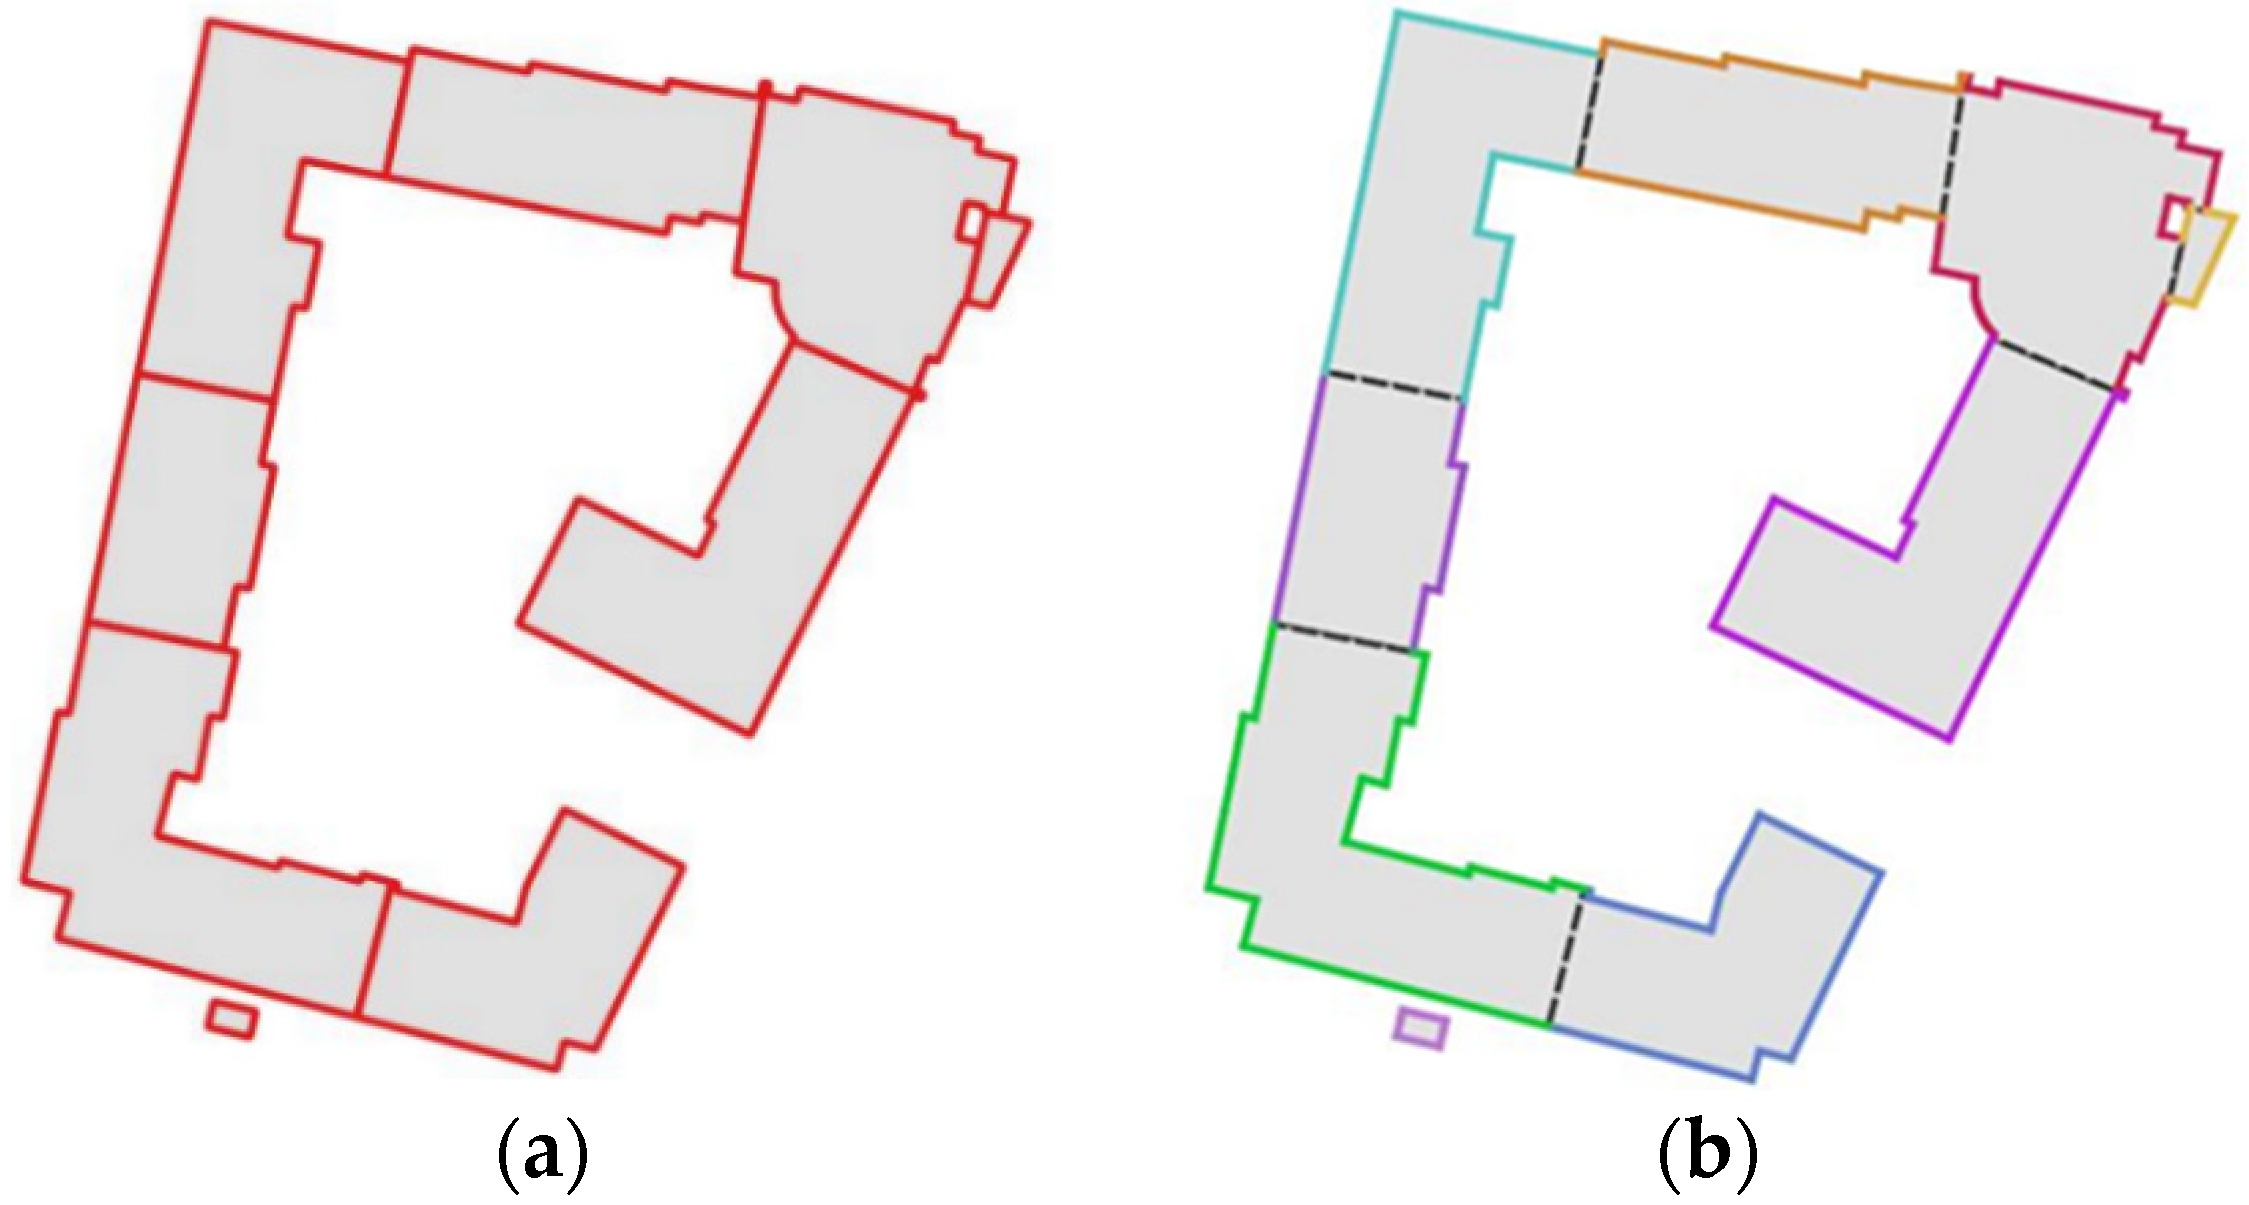
A preliminary 2D version of TICs for every group of adjacent buildings is generated.
Figure 4 shows a case where (a) the TIC outlines every building in a group and one where (b) the proposed method for the removal of the duplicating TIC features is applied. All curves related to the same building are grouped by an ID in both cases.
Finally, the TICs are appended to the dataset with building footprints and address points for further processing.
A TIN of the terrain surface is created based on the contours. Building footprints are draped onto the terrain and form breaklines in it [
5]. The resulting building footprints are elevated to the TIN up to a minimum Z-value of their projections onto the terrain. 2D terrain intersection curves are also draped onto the terrain (
Figure 5). The vertical scale of
Figure 5 is exaggerated.
3.3.3. Modeling of Buildings in LOD1
The modeling of buildings assumes several variations depending on how the building part is treated. First, a Z-offset to the enriched building footprints is applied and an extrusion is performed. The heights are calculated according to the usage types of the buildings. The calculation of heights is performed based on these categories, e.g., the height of residential buildings is calculated as follows (1):
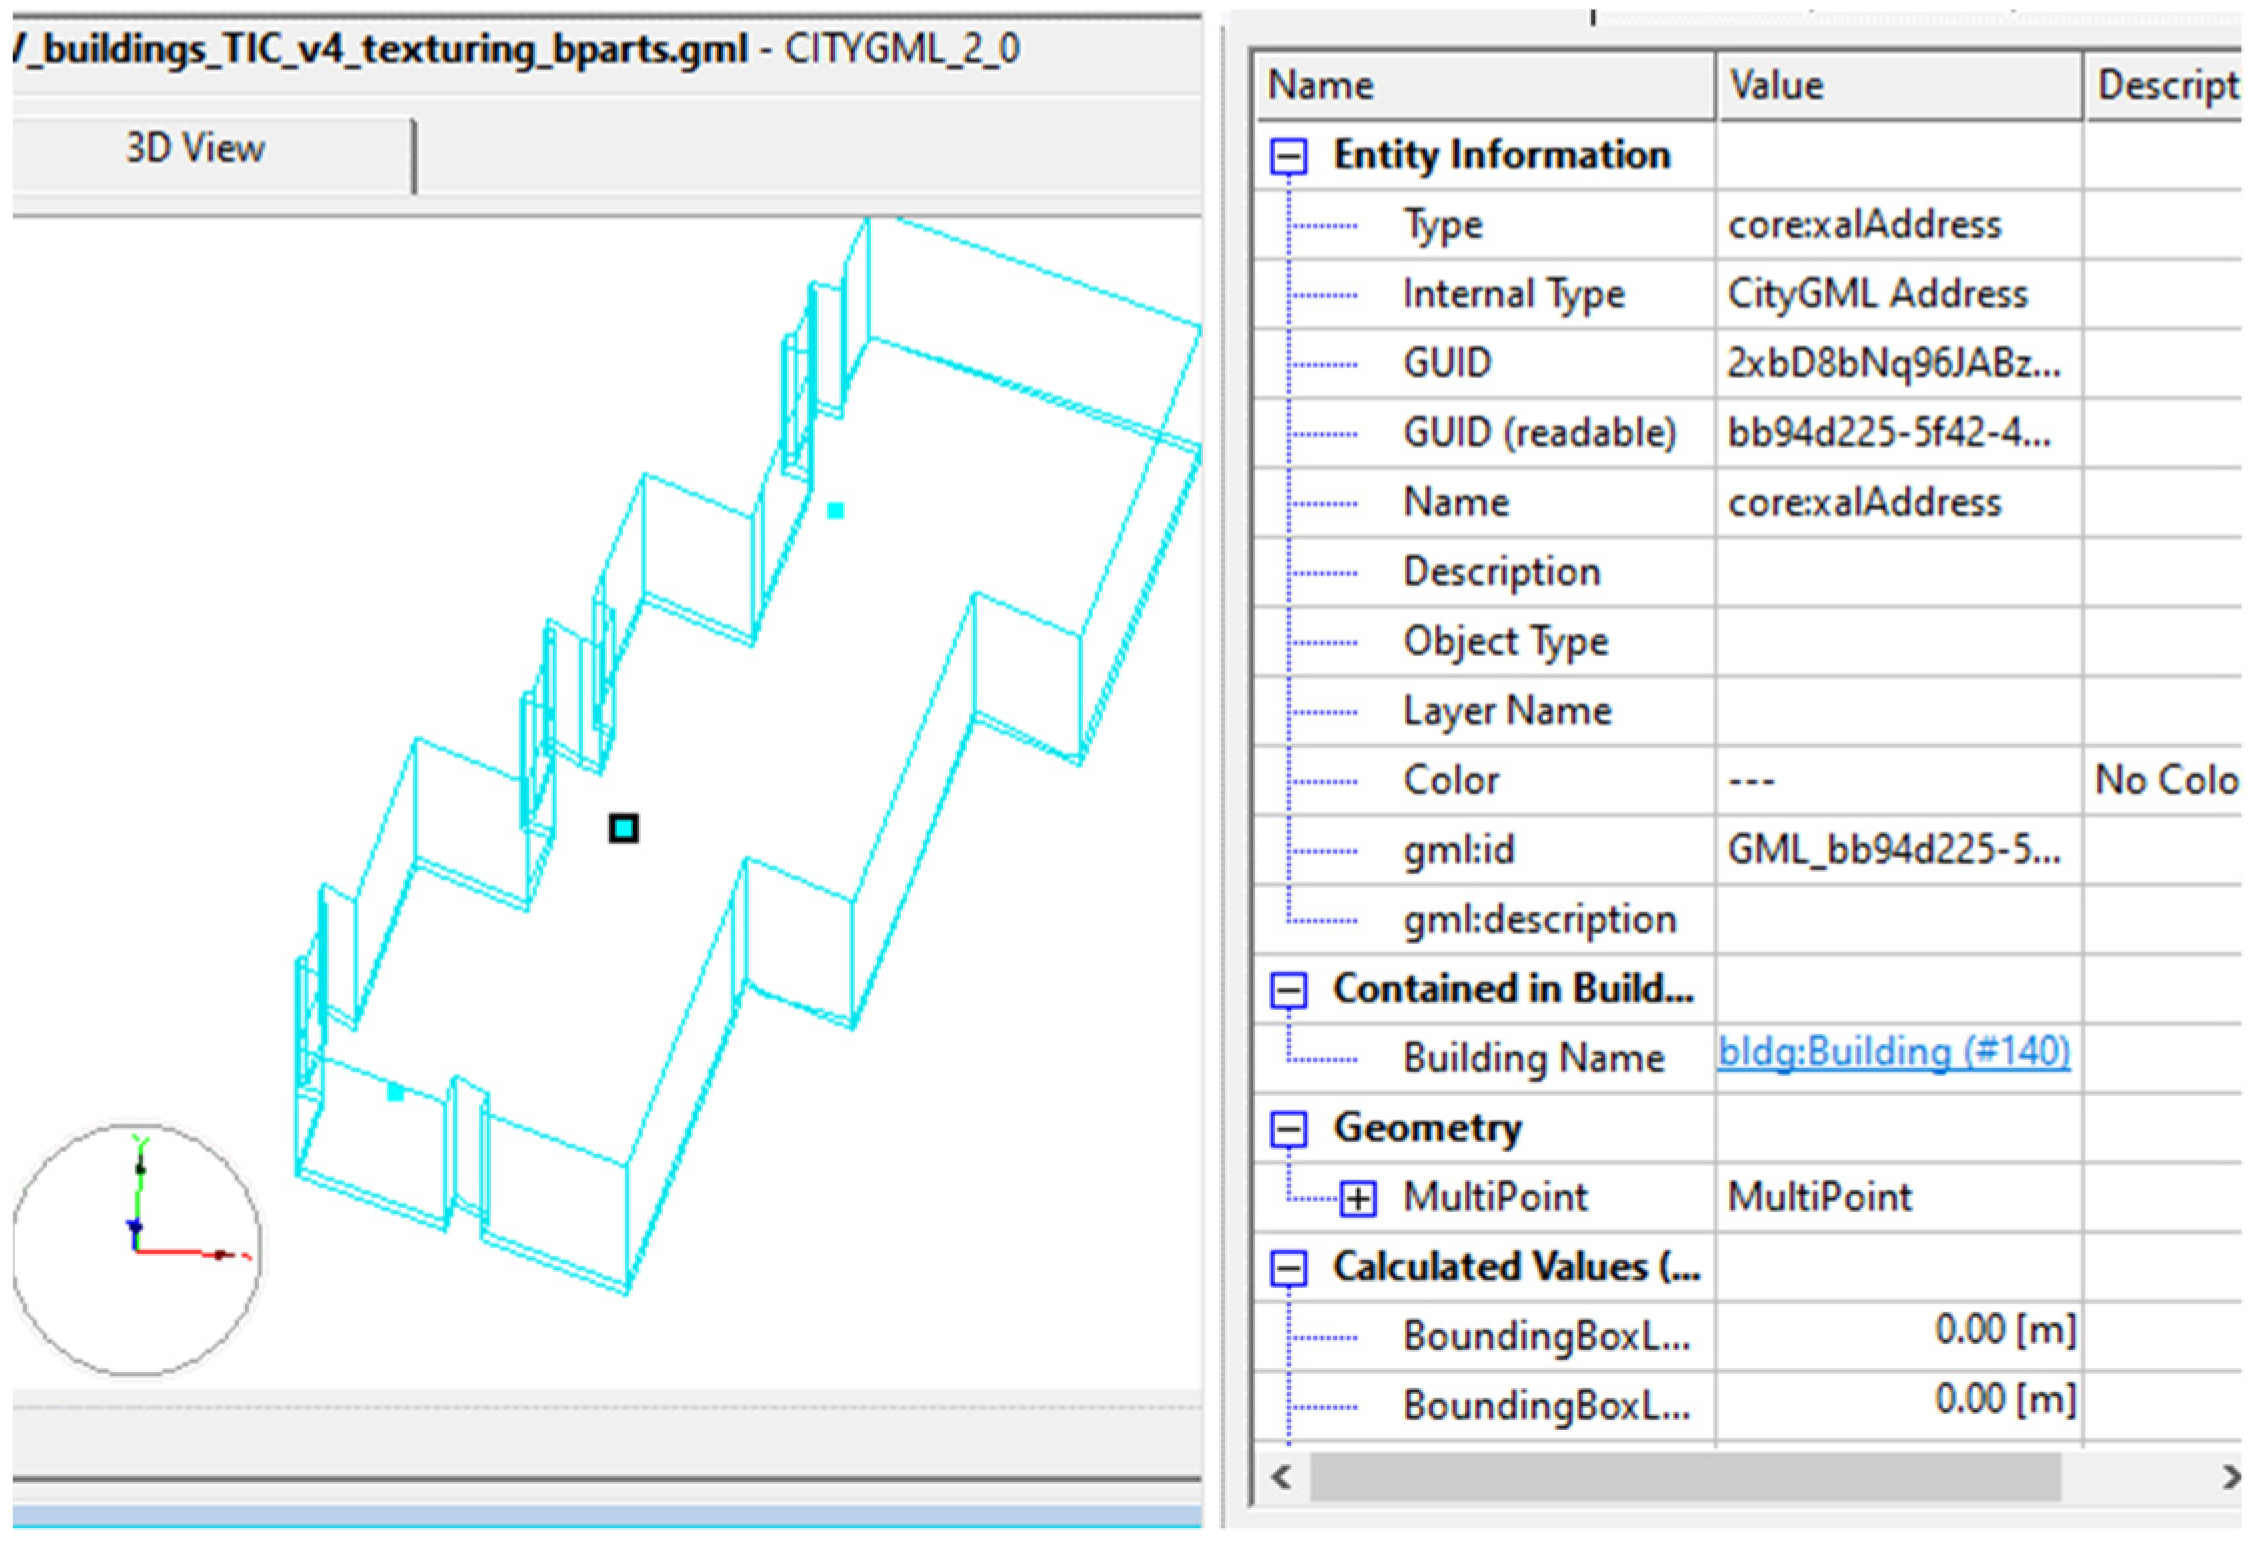
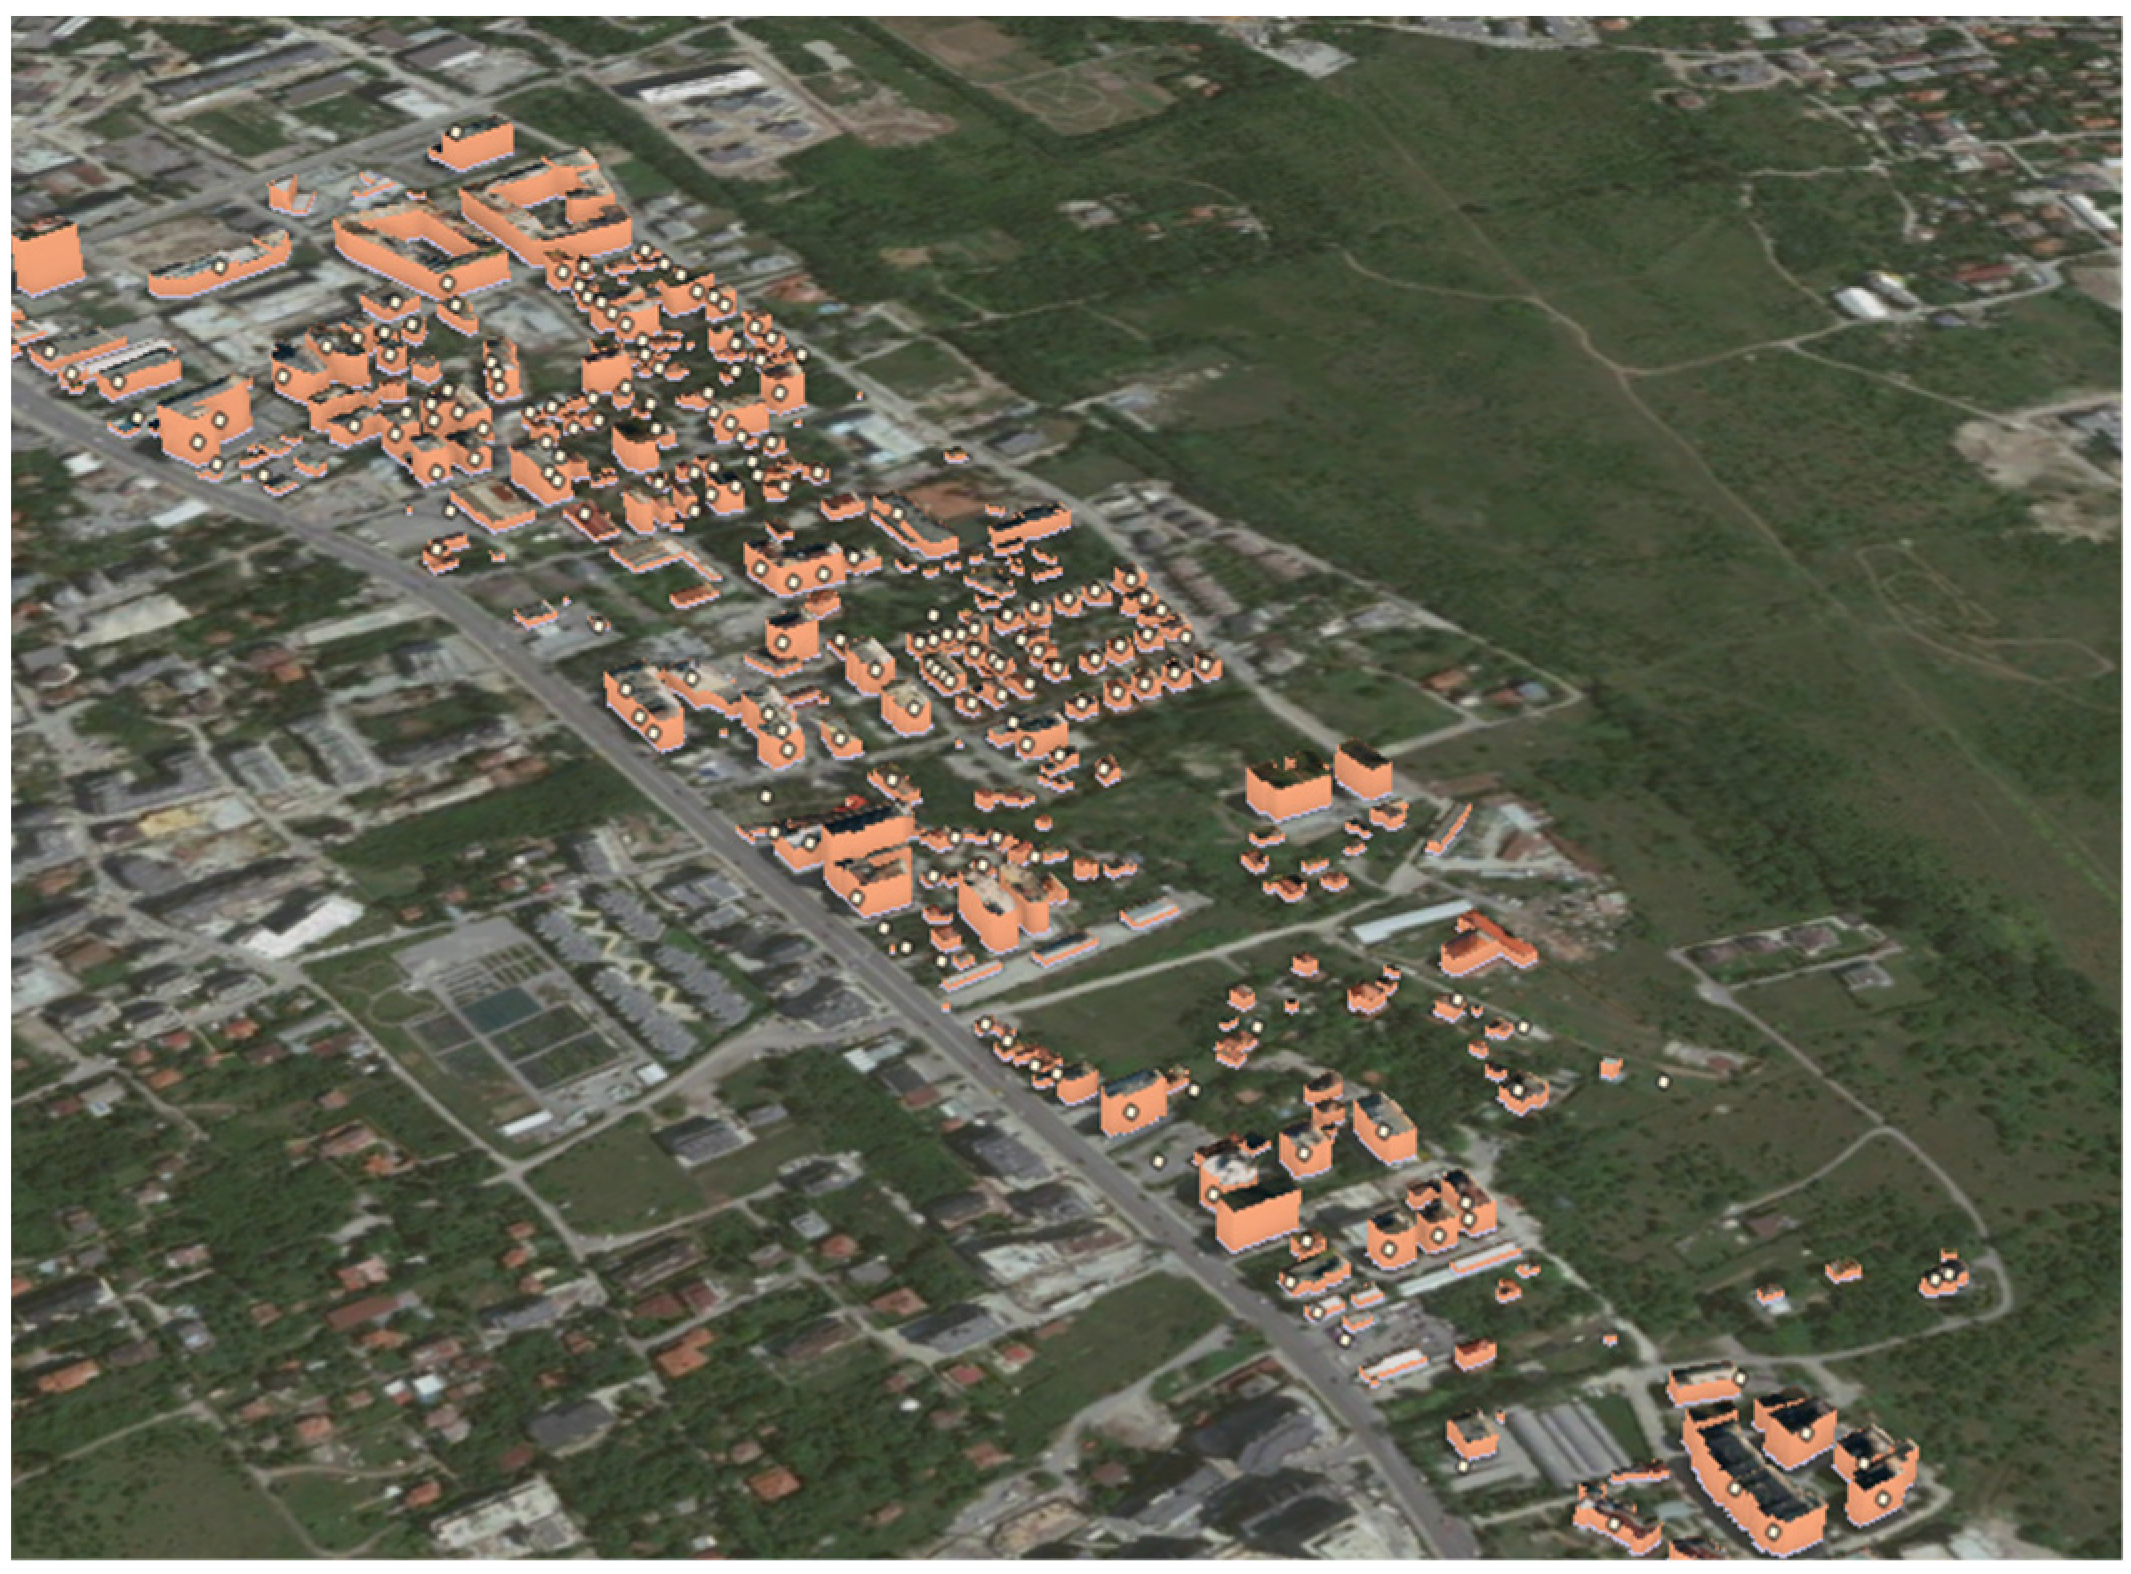
Initially, all buildings are modeled as single solids without buildings parts or rooftop variations. The address features are written as points by setting “citygml_lodname” to “multiPoint” and “citygml_feature_role” to ”address”. The address points are stored as geometrical objects that can be used for navigation purposes, as shown in
Figure 6.
The 3D TICs are added to the building features and linked to them based on the “gml_id” attribute. The final enriched buildings’ dataset is transformed to the CityGML format in LOD1. Two methods of modeling the buildings with uneven roof surfaces are proposed: (1) Modeling a solid building with a differentiated rooftop and (2) modeling a building as a group of building parts with different heights.
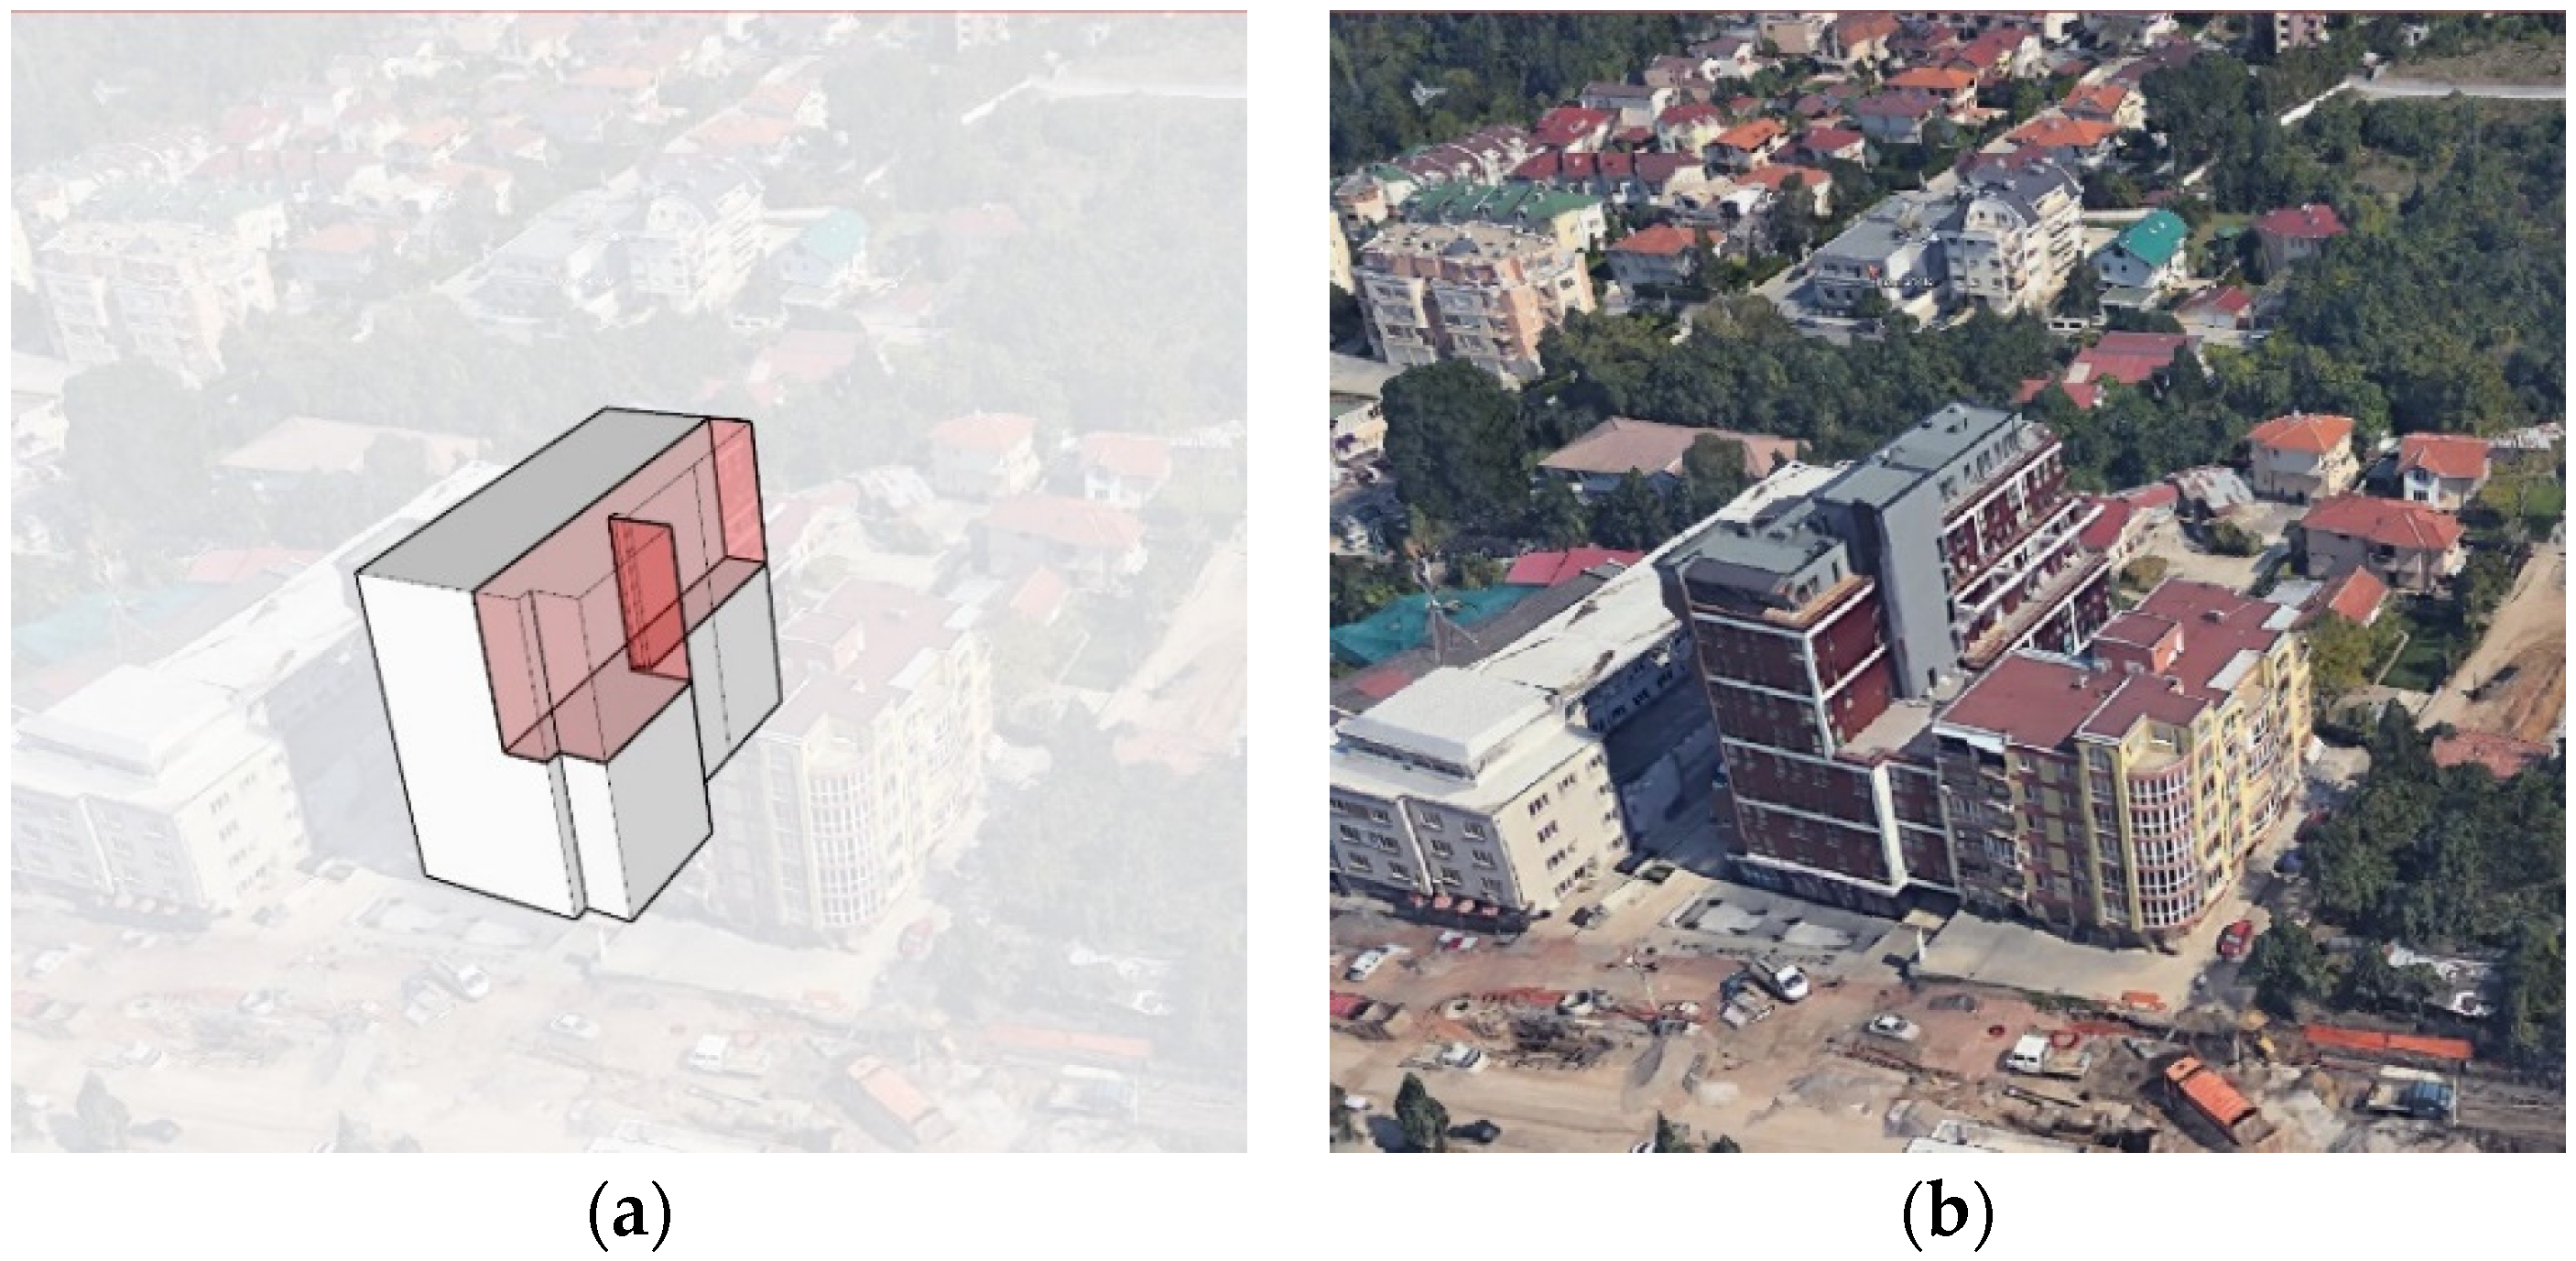
Modeling a Solid Building with a Differentiated Rooftop. This method requires a manual editing of solids without creating the building parts’ features. Two arbitrary buildings with significant variations in height are selected and exported as named groups. SketchUp 2018 is used to divide their rooftops into faces with different heights.
Figure 7 shows the result of the applied processing (a) in comparison with the Google Earth view (b).
The initial buildings selected for refinement are substituted with their manually obtained versions. Finally, the CityGML attributes are reassigned and the new versions of the building are written to a new dataset.
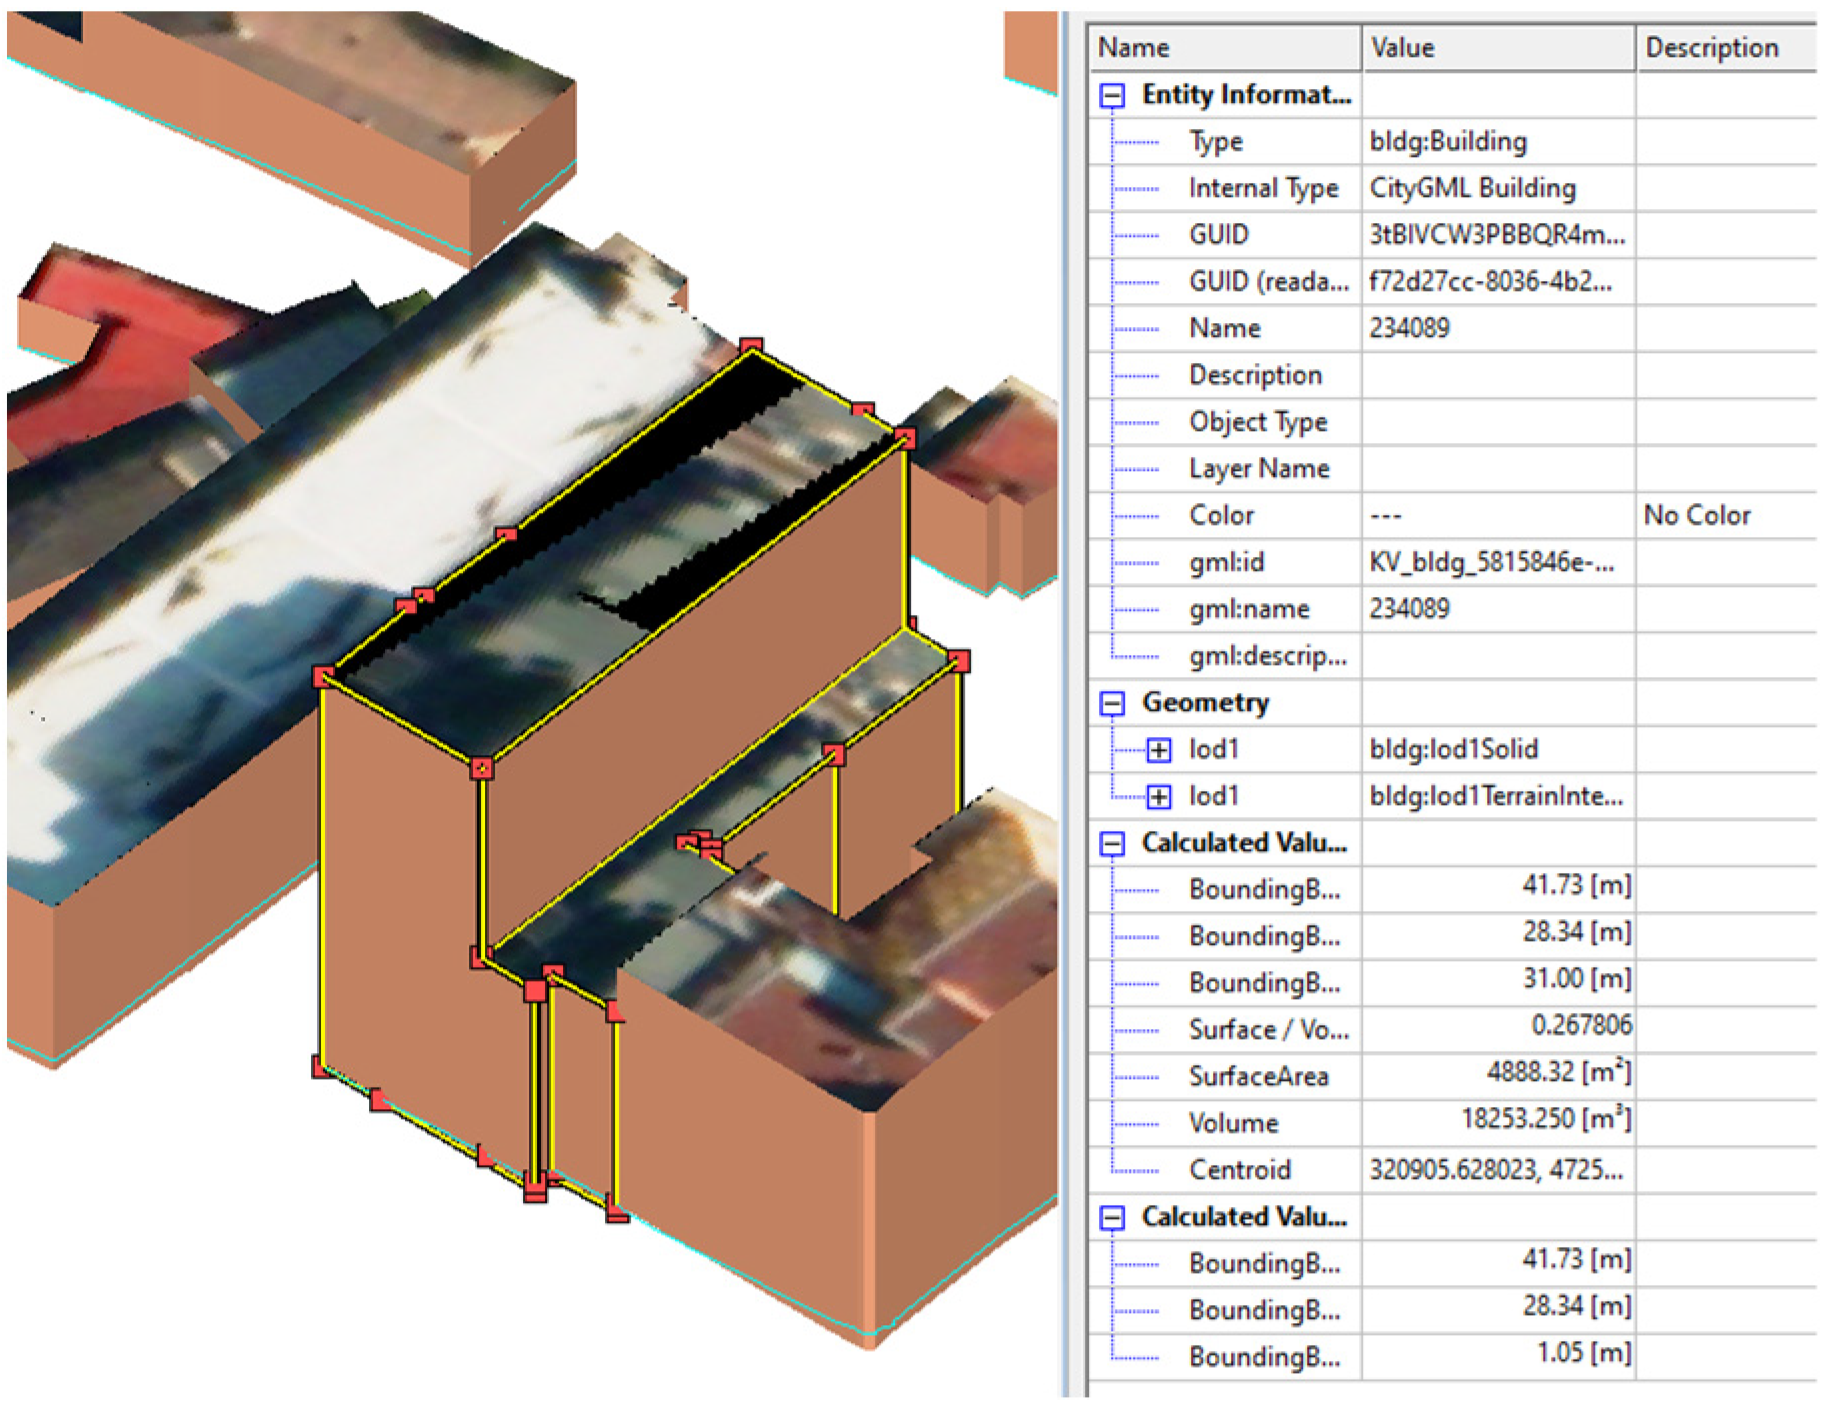
Rooftops are extracted from satellite imagery using a geometry filter. Every planar face with a positive normal vector is treated as a roof. Walls have their own color for visualization purposes. The same principle of reading the CityGML dataset, enriching, and writing building models back to the CityGML format is applied.
Figure 8 shows the resultant building model in FZKViewer.
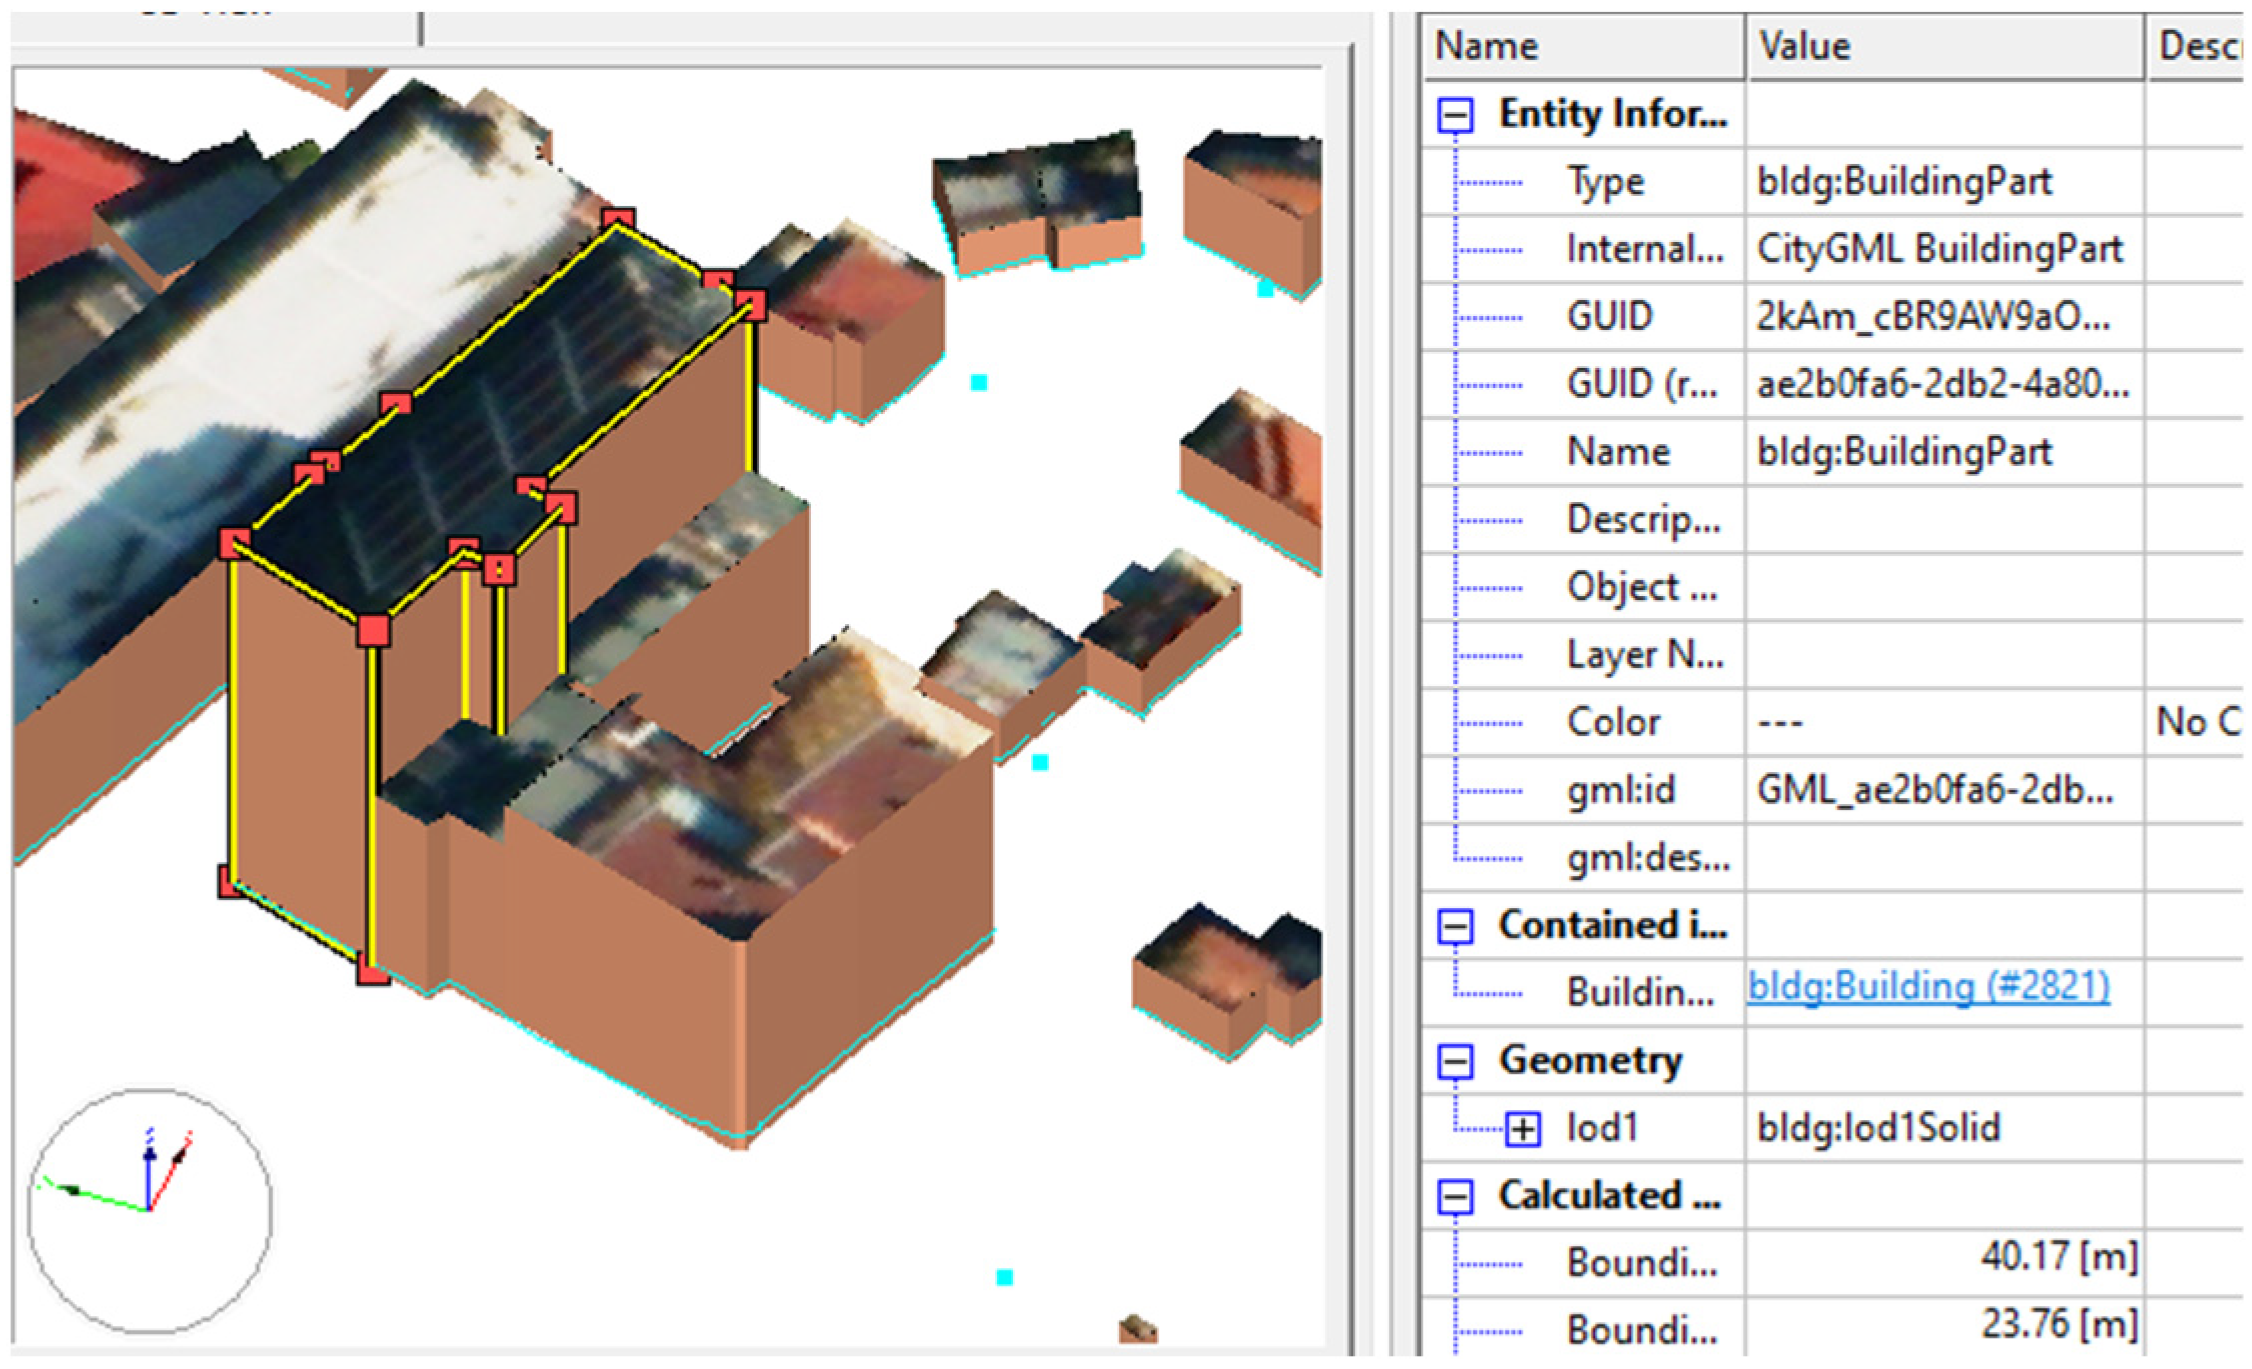
Modeling a Building as a Group of Building Parts with Different Heights. This method follows the building part concept proposed in the CityGML standard. Every building part becomes a child feature to a parent building. The footprints of five buildings are divided manually into parts with different floor counts and stored as a new vector layer in QGIS.
The initial footprints of the buildings from the cadaster are substituted with the polygons of the building parts. All the polygons are extruded. The parent geometry is removed for the buildings with parts, keeping all the geometry as building parts. To establish the hierarchy between the building and its building parts, the attribute “gml_parent_id” of the building part is populated with the value of the corresponding building “gml_id”. The attribute “citygml_feature_role” is set to the ”consistsOfBuildingPart” value. The satellite textures are assigned to the rooftops. A CityGML dataset containing building part features is produced.
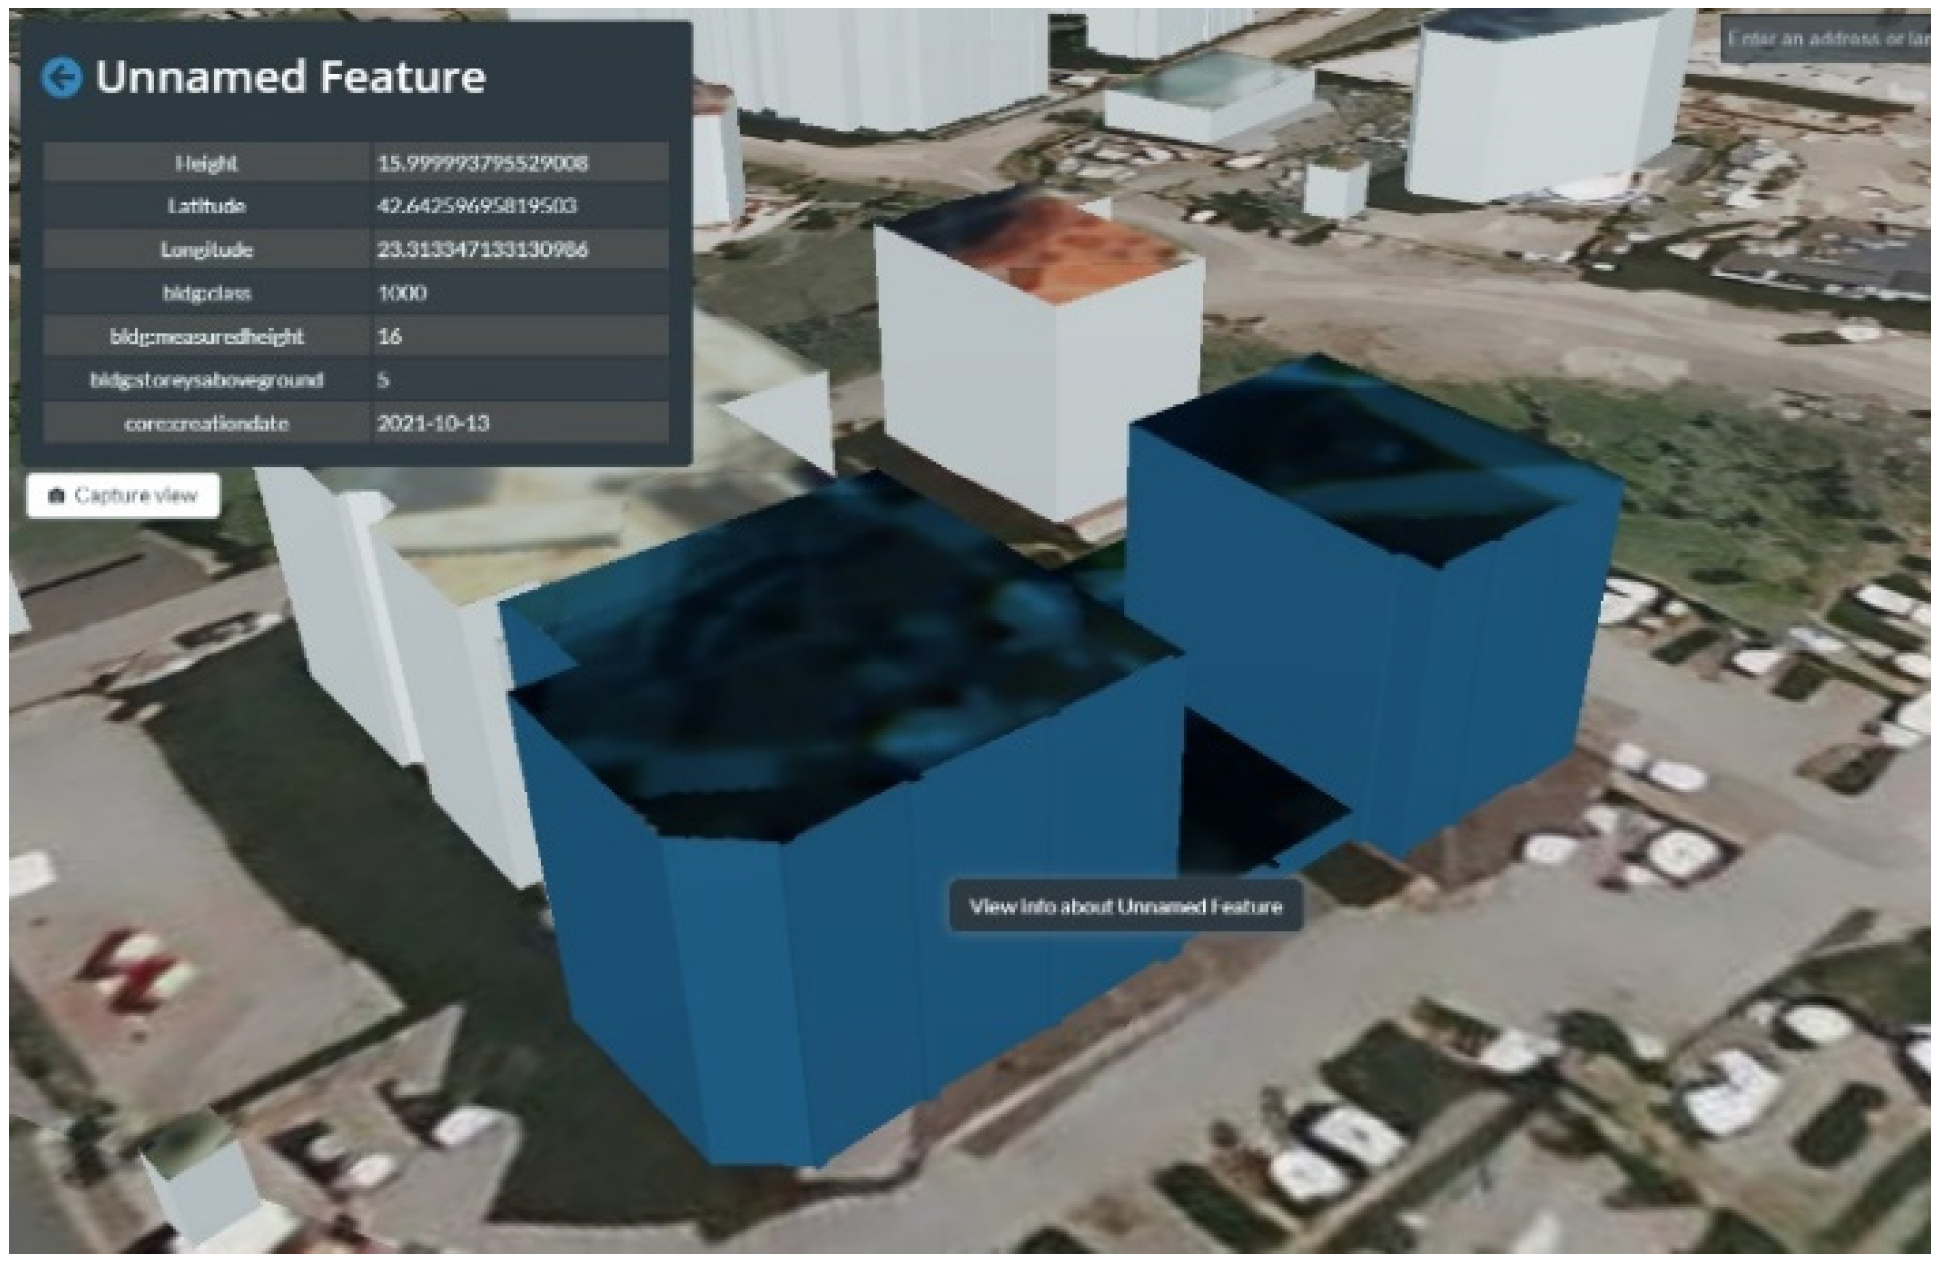
Figure 9 shows the selected building part feature and its attributes in FZKViewer.
In addition, the 3D model is visualized in ArcGIS Pro and Cesium Ion. ArcGIS Pro is a desktop GIS application with a wide range of possibilities. Cesium Ion is a web platform for storing and visualizing various kinds of geodata.
4. Results
The 3D building model contains 471 buildings and 198 addresses in both cases of the building parts modeling. The semantic 3D model’s high quality is essential, especially when further analysis and simulations are performed on it. The 3DCityDB Importer/Exporter tool is used for validation of the 3D building model [
54]. The compliance with CityGML 2.0 XML schemas is checked, showing that the model can be imported into 3DCityDB. The CityGML XML schemas are integrated into the Importer/Exporter and cannot be changed by the user. Both versions of the 3D building models are successfully validated.
Figure 10 shows an UML diagram of the implemented CityGML objects and features.
The first 3D building model described in
Section 3.3.3 represents a far more interesting case for visualization tests due to the availability of the “building–building part” hierarchy.
4.1. 3D Building Model in ArcGIS Pro
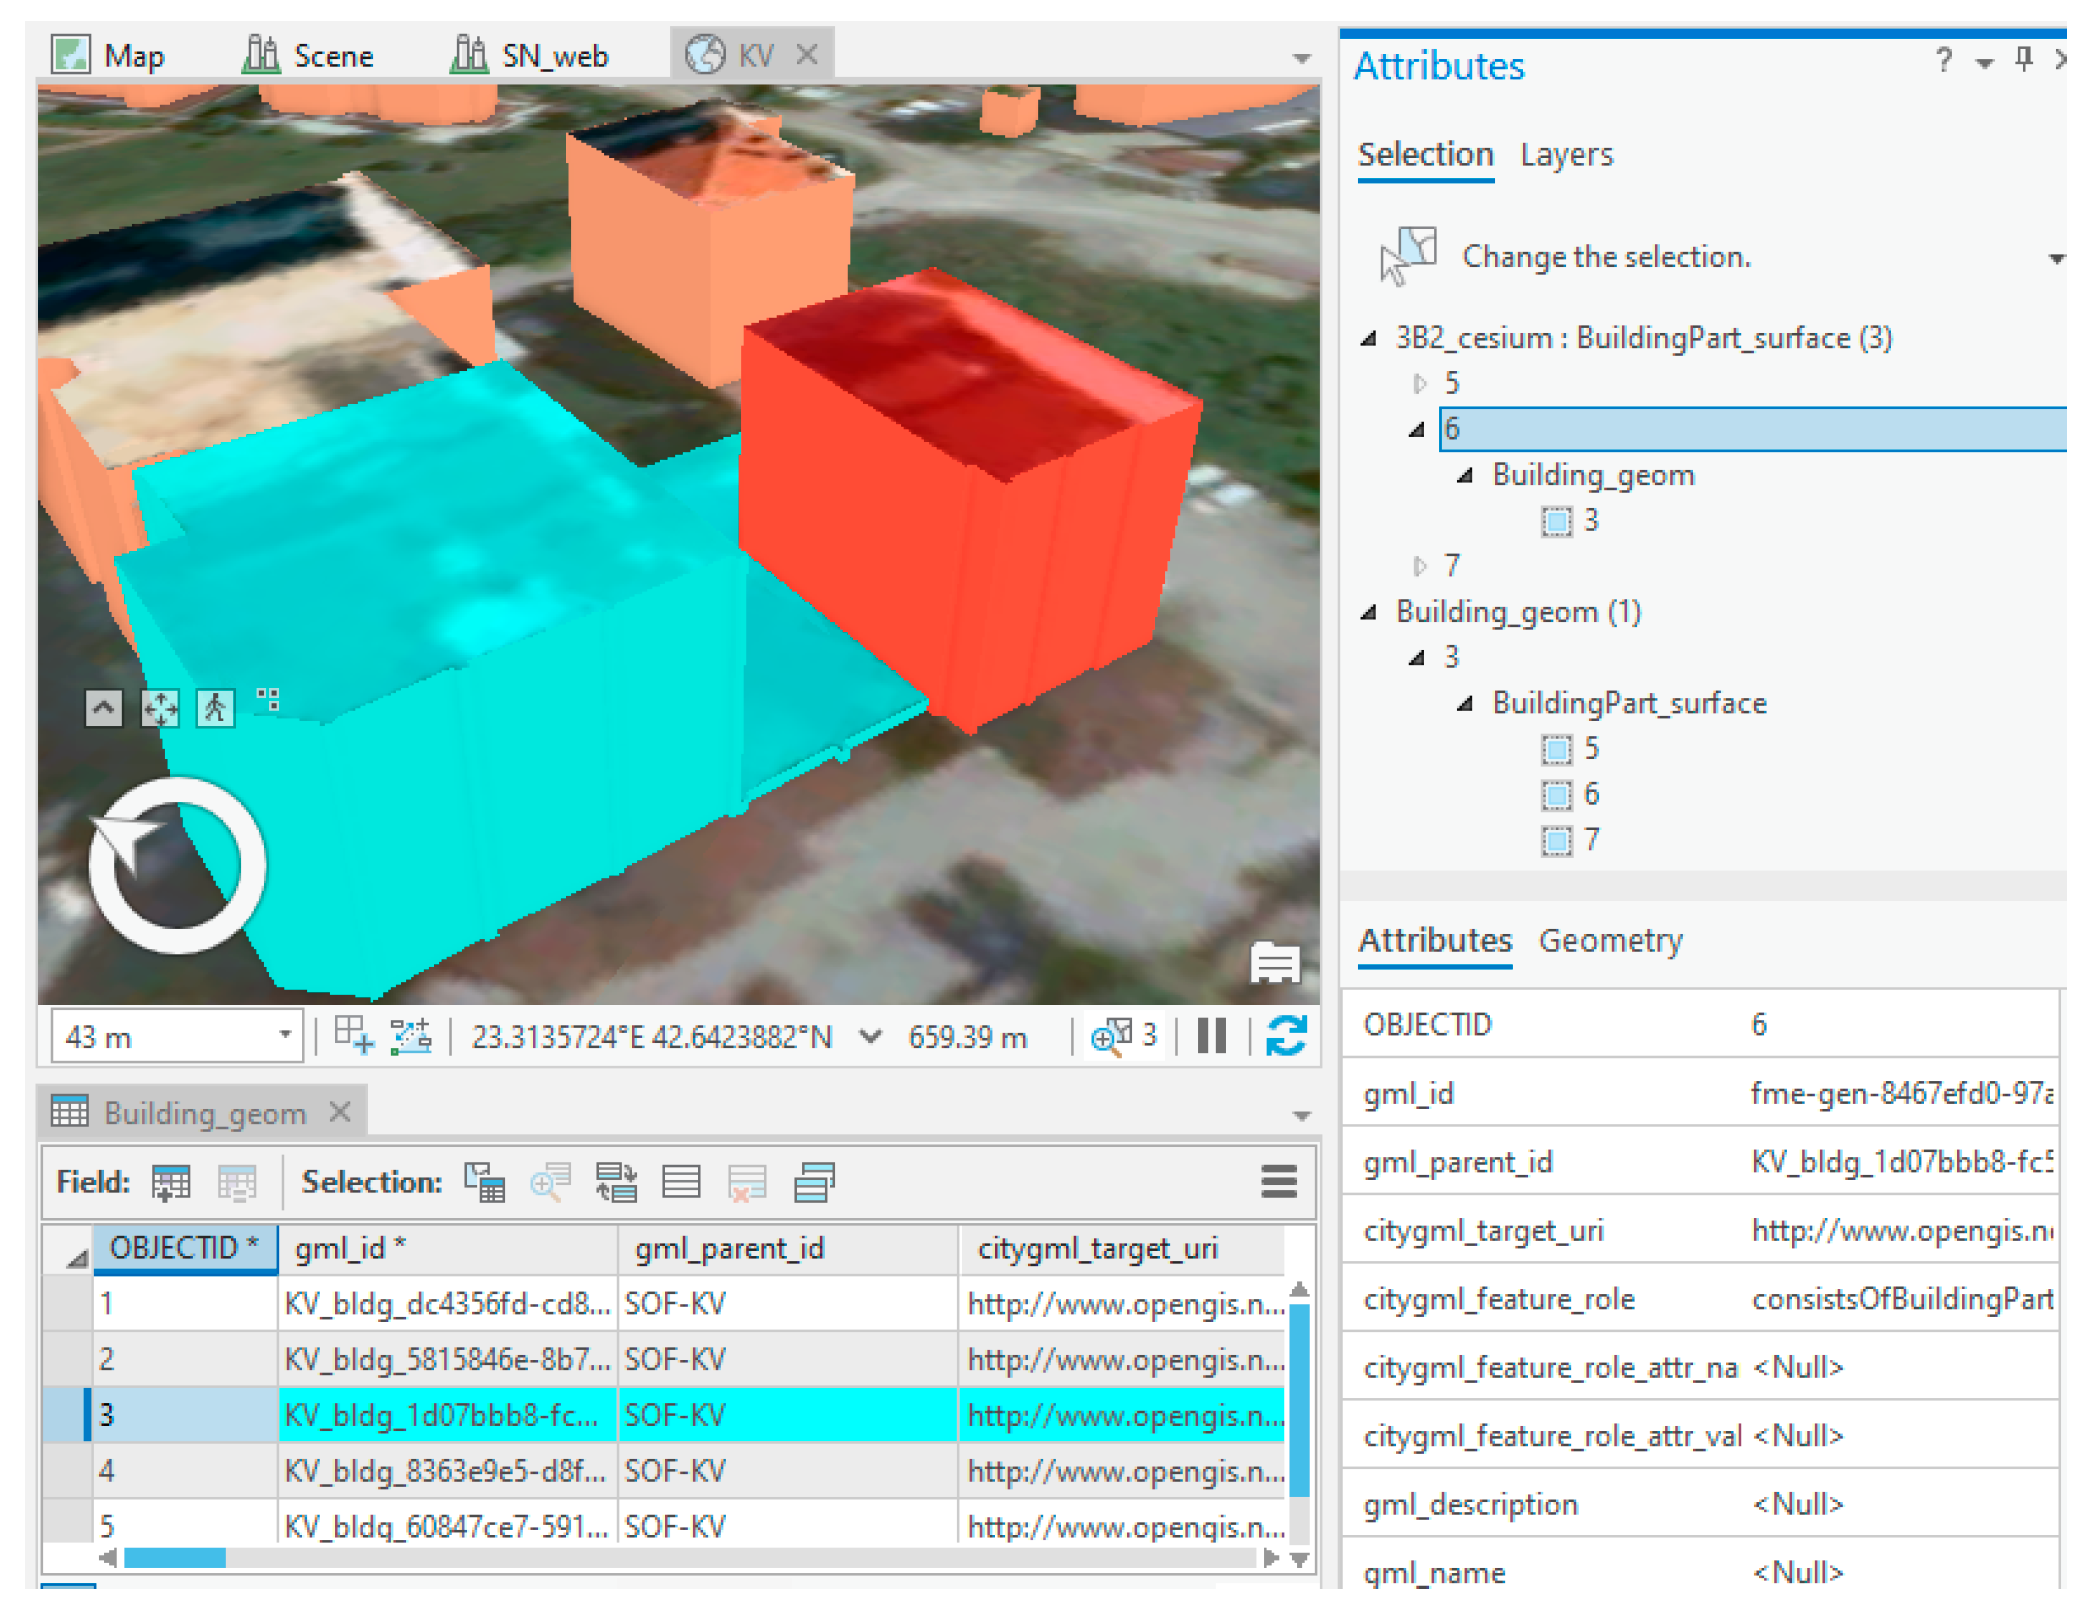
The 3D building model is imported into ArcGIS Pro 2.7 with the help of the Data Interoperability add-on, which is in fact an instance of FME Workbench. The imported CityGML dataset is shown in
Figure 11. ArcGIS Pro divides the features into layers with the same type of geometry during importing. Building and building part features are converted to ESRI multipatch geometry. The TICs are represented by a vector line layer and addresses are converted to a vector point layer. All geometry types, textures, and attributes are preserved. However, buildings with building parts are represented as tabular data without geometry.
The hierarchy of a building and building parts can be restored partially within ArcGIS Pro based on related tables, even in the case of buildings without geometry.
Figure 12 shows the selected hierarchy of “building–building part” in ArcGIS Pro.
4.2. 3D Building Model in Cesium Ion
Figure 13 shows the visualization of the 3D building model with building parts in Cesium Ion.
First, we tried to visualize the initial CityGML model. Second, transformation into Cesium 3D-Tiles format was performed and we again tried to visualize the obtained model. When CityGML and 3D-Tiles datasets contain standalone curves or points, both visualizations failed. This was caused by the inability to store polyline or point geometry in *.gltf format, which lies in the core of 3D-Tiles specification. When a building has building parts and no geometry inside itself, only attributes of the main building feature are displayed, as shown in
Figure 14.
5. Discussion
The principles of generating 3D building models with building parts, addresses, and the TIC in LOD1, and the possibility of assigning different attributes and textures, are explored through a real-use case study of the city of Sofia.
The resulting CityGML models, presented in
Section 3.3.3, consist of a building model (Buildings, Building Parts), a core model (CityModel, Address), and an appearance model. The main difference between them relates to the treatment of buildings with differentiated rooftops. The first 3D building model follows an approach with variations of rooftops within a single solid, while the second one considers multi-part buildings. TICs are added to 3D geometry of the buildings in both cases. After the removal of duplicating features, the overall count of TIC vertices is lowered from 12,112 to 8042. In addition, both cases consider address features and textured rooftops. The situation where multiple addresses correspond to one building is examined. The visualization compatibility of the obtained datasets is explored using ArcGIS Pro 2.7 and Cesium Ion.
Based on both the results from the exploration analysis of the existing 3D city models and the experiments, we can conclude that there are numerous variations even in LOD1 when the building module is the key element of the CityGML standard. Two modeling methods of building with different rooftop levels are applied: (1) building as a single solid with an uneven roof (LOD 1.3 according to Biljecki et al. [
4]) and (2) building consisting of separate building parts. The building part proves to be a feature that generates potential issues during visualization.
The address feature can contain geometrical representation, which is important for precise navigation. There are web services which can show mapped building entrances and propose routes to them, as in the case of Yandex Maps [
55]. A proper reading of the xAl structure can be problematic for certain software packages. Thus, a custom string attribute for address information can be considered for implementation. In addition, there is no possibility of including the points into Cesium 3D tiles for the time being.
To the best of our knowledge, the TIC turns out to be a formally used feature, when the underground structures are not defined. Moreover, it hampers the process of importing CityGML model into other platforms such as Cesium Ion. Nevertheless, the TIC could be a valuable feature, not only in representing the intersection between the terrain surface and the buildings but in defining the difference in thermal properties of the building envelope in case of energy modeling on higher LODs. The TIC could also be useful when documenting a measured height on hilly terrain.
6. Conclusions
The existing research on CityGML 3D modeling is mainly focused on the building representation in LOD1 as a simple solid, while neglecting details in modeling related to TIC, building parts, and addresses. This paper explores such issues by creating a 3D building model in LOD1 of the Krastova vada neighborhood in the city of Sofia. The performed overview of the practices of modeling buildings in LOD1 shows that CityGML is applied in different ways and that there is no consistent approach. Detailed guidelines for the correct application of the standard could help for its wider adoption.
The building part feature remains an important characteristic of the building in the 3D city model. However, variations of rooftops turn out to be a very formal argument for using a building part. From our perspective, a separate property item in the cadaster is the main argument for the decision. A method considering a solid building with various rooftop heights obtained manually is proposed. This provides a possibility for modeling prominent landmark buildings more precisely. In addition, a case of a multi-part building is explored and implemented. The TIC and address points need to be justified before also being used in the 3D model.
As future work, a more precise method for calculating building heights can be implemented, either following the approach proposed by Biljecky et al. [
3] or by using a Digital Surface Model derived by remote sensing. If point clouds data or 3D photogrammetric meshes are available, they can be used to obtain the next level of precision. The LOD0 footprint of a single building could aggregate the geometry of parts as a single contour. Thus, basic types of spatial analysis can be conducted more easily using 2D-contour compared to 3D-solids. The case when there is a 2D outline of a building is similar to the concept of a Simple 3D Building in OpenStreetMap [
56], which is adopted among multiple OpenStreetMap contributors. In future work, enriched LOD0 footprints with building parts are planned to be used. The CityGML 3.0 standard [
57] may be explored and used. It includes new features and revisions of the existing modules, e.g., representation of time-dependent properties and the possibility of querying real-time IoT data, managing multiple versions of cities, and representation of city objects by point clouds. It is planned that IoT data for air pollution, weather conditions, and noise pollution will be integrated into the 3D model to support special and time analysis and simulations of environment quality. One benefit of the new CityGML version is the clear separation of the conceptual model and the data encodings, which allows usage encoding specifications besides GML, including CityJSON [
19].
The CityGML standard appears to be a sophisticated conceptual model with multiple hierarchies and links but, compared to the IFC format, it is yet to be widely adopted by the software vendors in the AEC industry. Nevertheless, the CityGML building model schema provides a bridge between the “horizontal” GIS and “vertical” BIM.
Author Contributions
Conceptualization, Evgeny Shirinyan and Dessislava Petrova-Antonova; methodology, Evgeny Shirinyan; software, Evgeny Shirinyan; validation, Dessislava Petrova-Antonova; formal analysis, Evgeny Shirinyan; investigation, Evgeny Shirinyan; resources, Dessislava Petrova-Antonova; data curation, Evgeny Shirinyan; writing—original draft preparation, Evgeny Shirinyan; writing—review and editing, Dessislava Petrova-Antonova; visualization, Evgeny Shirinyan; supervision, Dessislava Petrova-Antonova; project administration, Dessislava Petrova-Antonova; funding acquisition, Dessislava Petrova-Antonova All authors have read and agreed to the published version of the manuscript.
Funding
This research was funded by the Horizon 2020 WIDESPREAD-2018-2020 TEAMING Phase 2 program under Grant Agreement No. 857155, by Operational Program “Science and Education for Smart Growth” under Grant Agreement No. BG05M2OP001-1.003-0002-C01, and by the Bulgarian National Science fund under Agreement No. DN12/9.
Institutional Review Board Statement
Not applicable.
Informed Consent Statement
Not applicable.
Data Availability Statement
Data was obtained from Sofiaplan, a municipal enterprise responsible for the spatial and strategic planning of Sofia Municipality, and are available at
https://sofiaplan.bg/api/ (accessed on 16 February 2022) with the permission of Sofiaplan.
Acknowledgments
Not applicable.
Conflicts of Interest
The authors declare no conflict of interest.
References
- Biljecki, F.; Stoter, J.; LeDoux, H.; Zlatanova, S.; Çöltekin, A. Applications of 3D City Models: State of the Art Review. ISPRS Int. J. Geo-Inf. 2015, 4, 2842–2889. [Google Scholar] [CrossRef] [Green Version]
- Gröger, G.; Kolbe, T.H.; Nagel, C.; Häfele, K.H. OGC 12-019 OpenGIS City Geography Markup Language (CityGML) Encoding Standard. 2012. Available online: http://www.opengeospatial.org/standards/citygml (accessed on 23 October 2021).
- Biljecki, F.; Ledoux, H.; Stoter, J. Generating 3D city models without elevation data. Comput. Environ. Urban. Syst. 2017, 64, 1–18. [Google Scholar] [CrossRef] [Green Version]
- Biljecki, F.; Ledoux, H.; Stoter, J. An improved LOD specification for 3D building models. Comput. Environ. Urban. Syst. 2016, 59, 25–37. [Google Scholar] [CrossRef] [Green Version]
- Yan, J.; Zlatanova, S.; Aleksandrov, M.; Diakite, A.A.; Pettit, C. Integration of 3D objects and terrain for 3D modelling supporting the digital twin. ISPRS Ann. Photogramm. Remote Sens. Spat. Inf. Sci. 2019, 4, 147–154. [Google Scholar] [CrossRef] [Green Version]
- Schrotter, G.; Hürzeler, C. The digital twin of the city of Zurich for urban planning. PFG J. Photogramm. Remote Sens. Geoinf. Sci. 2020, 88, 99–112. [Google Scholar] [CrossRef] [Green Version]
- 3D-Stadtmodell. Geomatik + Vermessung Stadt Zürich. Available online: https://www.stadt-zuerich.ch/ted/de/index/geoz/geodaten_u_plaene/3d_stadtmodell.html (accessed on 15 October 2021).
- Janecka, K. Transformation of 3D geospatial data into CityGML—A case of Prague. Rep. Geod. Geoinform. 2019, 107, 41–48. [Google Scholar] [CrossRef] [Green Version]
- Helsinki the Kalasatama Digital Twins Project, the Final Report of the KIRA-Digi Pilot Project. Available online: https://www.hel.fi/static/liitteet-2019/Kaupunginkanslia/Helsinki3D_Kalasatama_Digital_Twins.pdf (accessed on 15 October 2021).
- Dimitrov, H.; Petrova-Antonova, D. 3d city model as a first step towards digital twin of Sofia city. Int. Arch. Photogramm. Remote Sens. Spat. Inf. Sci. 2021, XLIII-B4-2021, 23–30. [Google Scholar] [CrossRef]
- Jovanović, D.; Milovanov, S.; Ruskovski, I.; Govedarica, M.; Sladić, D.; Radulović, A.; Pajić, V. Building Virtual 3D City Model for Smart Cities Applications: A Case Study on Campus Area of the University of Novi Sad. ISPRS Int. J. Geo-Inf. 2020, 9, 476. [Google Scholar] [CrossRef]
- Agugiaro, G. First steps towards an integrated CityGML-based 3D model of Vienna. ISPRS Ann. Photogramm. Remote Sens. Spat. Inf. Sci. 2016, III-4, 139–146. [Google Scholar] [CrossRef] [Green Version]
- Dukai, B.; Peters, R.; Wu, T.; Commandeur, T.; Ledoux, H.; Baving, T.; Post, M.; van Altena, V.; van Hinsbergh, W.; Stoter, J. Generating, storing, updating and disseminating a countrywide 3D model. Int. Arch. Photogramm. Remote Sens. Spat. Inf. Sci. 2020, XLIV-4/W1-2020, 27–32. [Google Scholar] [CrossRef]
- Stoter, J.; Ledoux, H.; Penninga, F.; van den Brink, L.; Reuvers, M.; Vermeij, M.; Wiersma, M.G. Towards a generic 3d standardisation approach for the Netherlands supporting different applications and encodings. Int. Arch. Photogramm. Remote Sens. Spat. Inf. Sci. 2019, XLII-4/W15, 89–96. [Google Scholar] [CrossRef] [Green Version]
- Eriksson, H.; Johansson, T.; Olsson, P.-O.; Andersson, M.; Engvall, J.; Hast, I.; Harrie, L. Requirements, Development, and Evaluation of A National Building Standard—A Swedish Case Study. ISPRS Int. J. Geo-Inf. 2020, 9, 78. [Google Scholar] [CrossRef] [Green Version]
- Visuri, H.; Jokela, J.; Mesterton, N.; Latvala, P.; Aarnio, T. Producing and visualizing a country-wide 3D data repository in Finland. Int. Arch. Photogramm. Remote Sens. Spat. Inf. Sci. 2019, XLII-4/W15, 105–110. [Google Scholar] [CrossRef]
- Pepe, M.; Costantino, D.; Alfio, V.S.; Angelini, M.G.; Restuccia Garofalo, A. A CityGML Multiscale Approach for the Conservation and Management of Cultural Heritage: The Case Study of the Old Town of Taranto (Italy). ISPRS Int. J. Geo-Inf. 2020, 9, 449. [Google Scholar] [CrossRef]
- PDOK-3D. 2020. Available online: https://brt.kadaster.nl/basisvoorziening-3d/ (accessed on 15 February 2022).
- Ge, L. Generalization of LOD2 buildings with different roof structures. J. Spat. Sci. 2018, 64, 319–340. [Google Scholar] [CrossRef]
- Lehner, H.; Dorffner, L. Digital geotwin Vienna: Towards a digital twin city as geodata hub. PFG-J. Photogramm. Remote Sens. Geoinf. Sci. 2020, 88, 63–75. [Google Scholar] [CrossRef]
- Biljecki, F.; Ledoux, H.; Stoter, J.; Vosselman, G. The variants of an LOD of a 3D building model and their influence on spatial analyses. ISPRS J. Photogramm. Remote Sens. 2016, 116, 42–54. [Google Scholar] [CrossRef] [Green Version]
- Biljecki, F.; Ledoux, H.; Stoter, J. Does a Finer Level of Detail of a 3D City Model Bring an Improvement for Estimating Shadows? In Advances in 3D Geoinformation, Lecture Notes in Geoinformation and Cartography; Abdul-Rahman, A., Ed.; Springer: Berlin/Heidelberg, Germany, 2017; pp. 31–47. [Google Scholar] [CrossRef] [Green Version]
- Deininger, M.E.; von der Grün, M.; Piepereit, R.; Schneider, S.; Santhanavanich, T.; Coors, V.; Voß, U. A Continuous, Semi-Automated Workflow: From 3D City Models with Geometric Optimization and CFD Simulations to Visualization of Wind in an Urban Environment. ISPRS Int. J. Geo-Inf. 2020, 9, 657. [Google Scholar] [CrossRef]
- Piepereit, R.; Deininger, M.; Kada, M.; Pries, M.; Voß, U. A Sweep-plane Algorithm For The Simplification Of 3d Building Models In The Application Scenario Of Wind Simulations. Int. Arch. Photogramm. Remote Sens. Spat. Inf. Sci. 2018, XLII-4/W10, 151–156. [Google Scholar] [CrossRef] [Green Version]
- Chen, S.; Zhang, W.; Wong, N.H.; Ignatius, M. Combining CityGML files and data-driven models for microclimate simulations in a tropical city. Build. Environ. 2020, 185, 107314. [Google Scholar] [CrossRef]
- Li, L.; Guo, R.; Ying, S.; Zhu, H.; Wu, J.; Liu, C. 3D Modeling of the Cadastre and the Spatial Representation of Property. In Urban Informatics; Shi, W., Goodchild, M.F., Batty, M., Kwan, M.P., Zhang, A., Eds.; Springer: Singapore, 2021; pp. 589–608. [Google Scholar] [CrossRef]
- ISO 19152:2012; Geographic Information–Land Administration Domain Model (LADM). ISO: Geneva, Switzerland, 2012.
- Julin, A.; Jaalama, K.; Virtanen, J.-P.; Pouke, M.; Ylipulli, J.; Vaaja, M.; Hyyppa, J.; Hyyppä, H. Characterizing 3D City Modeling Projects: Towards a Harmonized Interoperable System. ISPRS Int. J. Geo-Inf. 2018, 7, 55. [Google Scholar] [CrossRef] [Green Version]
- Shahat, E.; Hyun, C.T.; Yeom, C. City Digital Twin Potentials: A Review and Research Agenda. Sustainability 2021, 13, 3386. [Google Scholar] [CrossRef]
- Vitalis, S.; Labetski, A.; Arroyo Ohori, K.; Ledoux, H.; Stoter, J. A data structure to incorporate versioning in 3D city models. ISPRS Ann. Photogramm. Remote Sens. Spat. Inf. Sci. 2019, 4, 123–130. [Google Scholar] [CrossRef] [Green Version]
- Ledoux, H.; Arroyo Ohori, K.; Kumar, K.; Dukai, B.; Labetski, A.; Vitalis, S. CityJSON: A compact and easy-to-use encoding of the CityGML data model. Open Geospat. Datasoftw. Stand. 2019, 4, 4. [Google Scholar] [CrossRef]
- Eriksson, H.; Harrie, L.; Paasch, J.M. What is the need for building parts?—A comparison of CityGML, INSPIRE Building and a Swedish building standard. Int. Arch. Photogramm. Remote Sens. Spat. Inf. Sci. 2018, XLII-4/W10, 27–32. [Google Scholar] [CrossRef] [Green Version]
- ISO 16739:2013; Industry Foundation Classes (IFC) for Data Sharing in the Construction and Facility Management Industries. ISO: Geneva, Switzerland, 2013.
- SGP Building. Geodataspecifikation Byggnad, Version 3.2. 2018. Available online: https://www.lantmateriet.se/globalassets/smartare-samhallsbyggnadsprocess/nationella-specifikationer/sgp_matningsanvisningar_v3.2.pdf (accessed on 15 February 2022).
- Jang, J.; Park, S.; Kwon, T.; Lee, S. CityGML urban model generation using national public datasets for flood damage simulations: A case study in Korea. J. Environ. Manag. 2021, 297, 113236. [Google Scholar] [CrossRef]
- Cities/Regions around the World with Open Datasets. Available online: https://3d.bk.tudelft.nl/opendata/opencities/ (accessed on 15 October 2021).
- NYC 3-D Building Model. Available online: https://www1.nyc.gov/site/doitt/initiatives/3d-building.page (accessed on 18 October 2021).
- 3D-Gebäudemodell LoD1-Paketierung: Einzelkacheln. Available online: https://www.opengeodata.nrw.de/produkte/geobasis/3dg/lod1_gml/lod1_gml/ (accessed on 18 October 2021).
- 3D-Stadtmodell LoD1-DE Hamburg. Available online: https://suche.transparenz.hamburg.de/dataset/3d-stadtmodell-lod1-de-hamburg5?forceWeb=true (accessed on 18 October 2021).
- 3D-Gebäudemodell Potsdam 2012. Available online: https://potsdam.opendatasoft.com/explore/dataset/3d-gebaudemodell-lod2-citygml/information/ (accessed on 18 October 2021).
- Berlin 3D-Download Portal. Available online: https://www.businesslocationcenter.de/en/economic-atlas/download-portal/ (accessed on 18 October 2021).
- Maquettes 3D Texturées 2018 Des Communes de la Métropole de Lyon. Available online: https://data.grandlyon.com/jeux-de-donnees/maquettes-3d-texturees-2018-communes-metropole-lyon/donnees (accessed on 18 October 2021).
- Bâtiments 3D (LOD 1—Level of Detail 1). Available online: https://data.public.lu/en/datasets/5cecd25a4384b06ad27e5c58/ (accessed on 18 October 2021).
- Namur 3D—Bâtiments Texturés Par Dalle de 200 m. Available online: https://data.namur.be/explore/dataset/namur-3d-batiments-textures-par-dalle-de-200m/table/ (accessed on 18 October 2021).
- Helsinki Kalasatama CityGML Data. Available online: http://3d.hel.ninja/data/citygml/ (accessed on 18 October 2021).
- Helsinki 3D Portal. Available online: https://kartta.hel.fi/3d/#/ (accessed on 18 October 2021).
- Espoo’s 3D City Model. Interface Services. Available online: https://kartat.espoo.fi/3d/services_en.html (accessed on 18 October 2021).
- Building 3D Model Data: Estonian Land Board 2022. Available online: https://geoportaal.maaamet.ee/eng/Download-3D-data-p837.html (accessed on 18 October 2021).
- Generalisiertes Dachmodell (LOD2.1) Wien. Available online: https://www.data.gv.at/katalog/dataset/86d88cae-ad97-4476-bae5-73488a12776d (accessed on 18 October 2021).
- Linz. 3D Geodaten 2020. Available online: https://geo.data.linz.gv.at/katalog/geodata/3d_geo_daten/2020/ (accessed on 18 October 2021).
- Rotterdam 3D. Available online: https://www.3drotterdam.nl/#/export (accessed on 18 October 2021).
- Model 3D. Model Trójwymiarowy Poznania. Available online: http://sip.poznan.pl/model3d/#/legend (accessed on 18 October 2021).
- SIG3D Quality Working Group. Modeling Guide for 3D Objects Part2: Modeling of Buildings (LoD1, LoD2 and LoD3), Version 2.0.1 EN. 2017. Available online: https://files.sig3d.org/file/ag-qualitaet/201711_SIG3D_Modeling_Guide_for_3D_Objects_Part_2.pdf (accessed on 18 October 2021).
- Yao, Z.; Nagel, C.; Kunde, F. 3DCityDB—A 3D geodatabase solution for the management, analysis, and visualization of semantic 3D city models based on CityGML. Open Geospat. Data Softw. Stand. 2018, 3, 5. [Google Scholar] [CrossRef] [Green Version]
- Yandex Maps. Available online: https://yandex.ru/maps/213/moscow/house/nizhnyaya_syromyatnicheskaya_ulitsa_10s9/Z04YcAFnQEAHQFtvfXt0c3RgYQ==/?ll=37.669257%2C55.752445&z=18.03 (accessed on 27 October 2021).
- OpenStreetMap Wiki. Simple 3D Buildings. Available online: https://wiki.openstreetmap.org/wiki/Simple_3D_Buildings (accessed on 15 October 2021).
- Kolbe, T.H.; Kutzner, T.; Smyth, C.S.; Nagel, C.; Roensdorf, C.; Heazel, C. OGC 20-010 OGC City Geography Markup Language (CityGML) Part 1: Conceptual Model Standard. 2021. Available online: https://docs.ogc.org/is/20-010/20-010.html (accessed on 15 February 2022).
| Publisher’s Note: MDPI stays neutral with regard to jurisdictional claims in published maps and institutional affiliations. |
© 2022 by the authors. Licensee MDPI, Basel, Switzerland. This article is an open access article distributed under the terms and conditions of the Creative Commons Attribution (CC BY) license (https://creativecommons.org/licenses/by/4.0/).


