Article

Land Use/Land Cover Change and Their Driving Factors in the Yellow River Basin of Shandong Province Based on Google Earth Engine from 2000 to 2020

1
School of Surveying and Geo-Informatics, Shandong Jianzhu University, Jinan 250101, China
2
Ji’nan Institute of Survey and Investigation, Jinan 250101, China
3
Department of Assets, Shandong Jianzhu University, Jinan 250101, China
4
College of Geodesy and Geomatics, Shandong University of Science and Technology, Qingdao 266000, China
5
School of Earth and Environmental Sciences, The University of Queensland, Brisbane, QLD 4072, Australia
*
Author to whom correspondence should be addressed.
ISPRS Int. J. Geo-Inf. 2022, 11(3), 163; https://doi.org/10.3390/ijgi11030163
Submission received: 6 January 2022 / Revised: 16 February 2022 / Accepted: 21 February 2022 / Published: 23 February 2022
(This article belongs to the Special Issue Applications of GIScience for Land Administration)

Abstract

:
As the convenient outlet to the Bo Sea and the major region of economic development in the Yellow River Basin, Shandong Province in China has undergone large changes in land use/land cover (LULC) in the past two decades with rapid urbanization and population growth. The analysis of the LULC change patterns and its driving factors in the Shandong section of the Yellow River Basin can provide a scientific basis for rational planning and ecological protection of land resources in the Shandong section of the Yellow River Basin. In this manuscript, we analyzed the spatial pattern of LULC and its spatial and temporal changes in the Shandong section of the Yellow River Basin in 2000, 2010, and 2020 by using the random forest classification algorithm with the Google Earth Engine platform and multi-temporal Landsat TM/OLI data. The driving factors of LULC changes were also quantified by the factor detector and interaction detector in the geodetector. Results show that in the past two decades, the LULC types in the study area are mainly farmland and construction land, among which the proportion of farmland area has decreased and the proportion of construction land area has increased from 19.4% to 29.7%. Based on the results of factor detector, it can be concluded that elevation, slope, and soil type are the key factors affecting LULC change in the study area. The interaction between elevation and slope, slope and soil type, and temperature and precipitation has strong explanatory power for the spatial variation of LULC change in the study area. The research results can provide data support for ecological environmental protection, sustainable, and high-quality development of the Shandong section of the Yellow River Basin, and help local governments take corresponding measures to achieve coordinated and sustainable socioeconomic and environmental development.

1. Introduction

Land is not only the basis for human survival and development, but also an information source to explain the interaction between human activities and ecological environment. Land is the most basic natural resource and material basis for human survival and development [1], and land use/land cover (LULC) change is a process to determine the change in surface land use information according to multiple observation data in different periods [2]. Since the 21st century, the research on LULC change has been gradually strengthened in the field of global environmental change research. The international geosphere biosphere program (IGBP) and the International Human Dimensions Program on Global Environmental Change (IHDP) have released a series of scientific research plans, and the research on LULC change has become one of the hotspots of global environmental change research [3,4,5]. Particularly with the development of global society and economy, LULC change will further intensify. This will produce great pressure on the structure and function of the ecosystem and the provision of ecosystem services [6]. Therefore, studying LULC change and analyzing its driving factors is conducive to the rational planning and utilization of land resources, and can provide a scientific basis for the coordinated and sustainable development of regional economy and natural environment.
Remote sensing technology provides an efficient and fast technical means for LULC information monitoring due to its advantages of wide observation range, fast renewal cycle, and a large amount of information [7,8,9]. Researchers have paid attention to LULC change monitoring based on remote sensing technology. IGBP and the United States Geological Survey (USGS) have produced a global LULC data product with 1 km resolution by using advanced very high resolution radiometer (AVHRR) data [10]; Stefanski et al. used Landsat and ERS SAR data to classify the LULC in western Ukraine from 1986 to 2010 based on the RF method, and explored the law of LULC change in this period [11]; Souza analyzed the change in LULC information in Brazil from 1985 to 2017 based on Landsat [12]; Abdullah analyzed the temporal and spatial pattern changes of LULC in coastal areas of Bangladesh from 1990 to 2017 based on extreme gradient boosting (XGBoost) information feature selection and random forest classification algorithm [13]. The above research confirms the effectiveness of remote sensing technology in LULC information extraction, but traditional remote sensing image processing methods to collect, store, process, and extract surface information will consume a lot of time, and there are high requirements for hardware equipment. This leads to the problems of massive remote sensing data download and low processing efficiency in LULC information extraction using remote sensing data on a large scale.
With the rapid development of cloud storage and cloud computing technology, the emergence of remote sensing cloud platforms provides a new technical method for downloading and processing massive remote sensing data. Among them, GEE is a cloud computing platform for cloud analysis using global scale Earth observation data [14,15]. It integrates more than 200 remote sensing datasets such as Landsat, Sentinel, and MODIS, and provides JavaScript and Python coding environments to facilitate users to process data according to their own needs, realizing the high-performance operation of PB level remote sensing data [16]. The GEE platform can query, visualize, preprocess and extract remote sensing data, reduce the workload of data acquisition and processing, and provide a great convenience for remote sensing workers. Relevant scholars have carried out detailed research and analysis on LULC change [17,18,19], water resource monitoring [20,21], eco-environmental quality evaluation [22,23,24], and agricultural resource monitoring [25,26] based on the GEE platform.
Analyzing the driving factors of LULC change is a further supplement to the re-search in LULC change, which is of great significance to optimize LULC mode and improve the efficiency of LULC. At present, the analysis of influencing factors of LULC change is mainly separated into qualitative and quantitative categories. The qualitative analysis method can only analyze the impact of various influencing factors on LULC change, but cannot quantitatively express the impact degree of various factors on LULC change [27,28]. Although the quantitative method can clarify the influence degree of various influencing factors on land use change, both methods ignore the relationship between influencing factors and land use change in spatial location [29,30], so it is difficult to accurately analyze their internal change potential mechanism. The geographic detector is a statistical method based on the statistical principle to detect spatial differentiation and reveal driving factors [31,32]. Based on the spatial relationship between them, this method can quantitatively analyze the influence degree of each driving factor on the independent variable and express the interaction between two influencing factors [33,34]. In the field of LULC, relevant scholars have utilized geographic detectors to conduct detailed research and analysis on the influencing factors of single LULC type changes such as expansion [33] and vegetation cover change [35,36,37].
The Yellow River Basin, which spans nine provinces in China from west to east, is an important area affecting national ecological protection and high-quality development [38]. As the only coastal province among the nine provinces along the Yellow River, Shandong Province takes a critical responsibility in implementing the outline of ecological protection and high-quality development of the Yellow River Basin. With the growth in population and the rapid expansion of cities, great changes have taken place in the LULC of the Yellow River Basin in Shandong, which seriously threatens the sustainable development of the ecological environment of the Yellow River Basin [39]. However, there are few studies on LULC in the Shandong section, and the long-term LULC change process and its influencing factors are still unclear. Therefore, it is of great significance to analyze the LULC change process and quantitatively analyze the driving factors in the Yellow River Basin of Shandong Province.
In order to further analyze the land use/land cover change process in the Shandong section of the Yellow River Basin and study its long-time series change pattern and driving factors, this manuscript extracts the LULC type information of the Shandong section of the Yellow River Basin from 2000 to 2020 and analyzes its change with the help of the GEE cloud platform and random forest classification algorithm. By calculating the land use intensity, the land use intensity is spatially expressed based on grid elements, and its temporal and spatial variation law can be analyzed. Finally, the factor detector and interactive detector in the geographic detector were introduced to analyze the driving effect of natural and social factors on land use change, in order to provide a reasonable basis for ecological environment planning and protection, and promote the comprehensive optimal allocation of land resources and socioeconomic sustainable development in the study area.

2. Materials and Methods
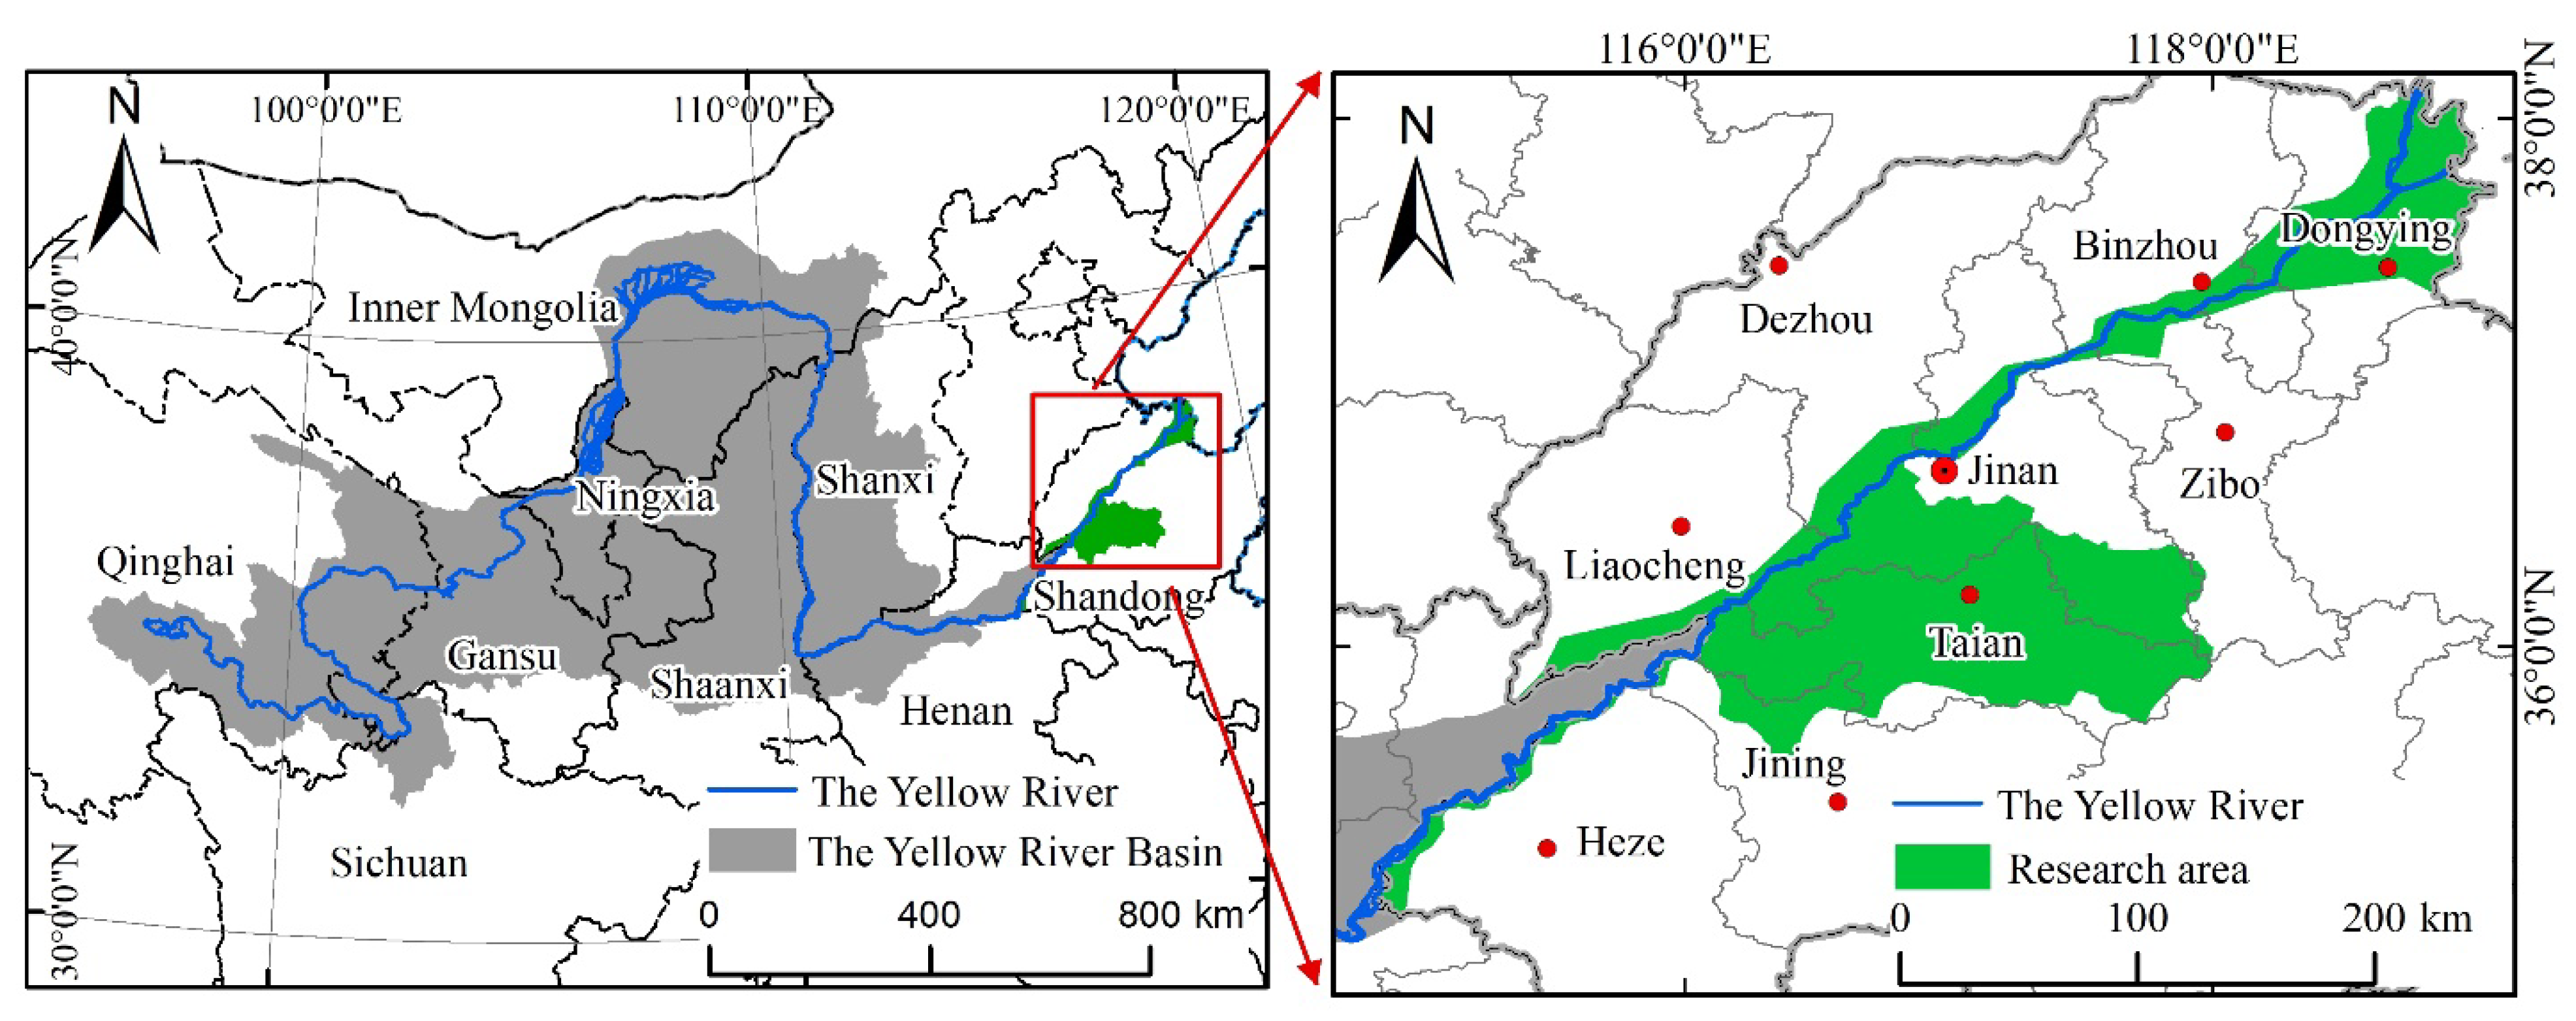
2.1. Study Area

The Yellow River Basin is the second largest basin and is also an important ecological barrier in China. It originates from Bayankala Mountain on the Qinghai Tibet Plateau and flows into the Bohai Sea in Kenli County, Shandong Province, with a drainage area of 7.95 × 10⁵ km2 [40]. The terrain is high in the west and low in the east. From west to east, it crosses the geomorphic units of Qinghai Tibet Plateau, Inner Mongolia Plateau, Loess Plateau, and Huang-Huai-Hai Plain, passing through the nine provinces (autonomous regions) of Qinghai, Sichuan, Gansu, Ningxia, Inner Mongolia, Shaanxi, Shanxi, Henan, and Shandong [41]. Among them, Shandong Province is the province with the most developed economy and the largest permanent population in the provinces of the Yellow River Basin. Since the 21st century, the rapid economic development of the study area and the transformation of urban and rural spatial structure have led to great changes in LULC. Therefore, it is of great significance to analyze the LULC change and its driving forces in the Yellow River Basin of Shandong Province from 2000 to 2020.
The Shandong section of the Yellow River Basin is located between 34°58′ N–38°09′ N and 114°48′ E–119°5′ E (Figure 1). It flows through the nine cities of Jinan, Zibo, Dongying, Jining, Tai’an, Dezhou, Liaocheng, Binzhou, and Heze, with a drainage area of about 2.02 × 10⁴ km2. It belongs to a temperate monsoon climate area with an annual average rainfall of 500~900 mm and an annual average temperature of 12~15 °C. It flows from west to east through the North China Plain, with a small river slope and gentle water flow. In addition, the river channel is wide, shallow, and scattered, the sediment deposition is serious, and the riverbed gradually rises. Both banks are almost protected by levees. The beach surface of the river channel is generally about 2–5 m higher than the ground on both banks, and some are as high as 10 m [42]. It is famous as the “suspended river” in the world.

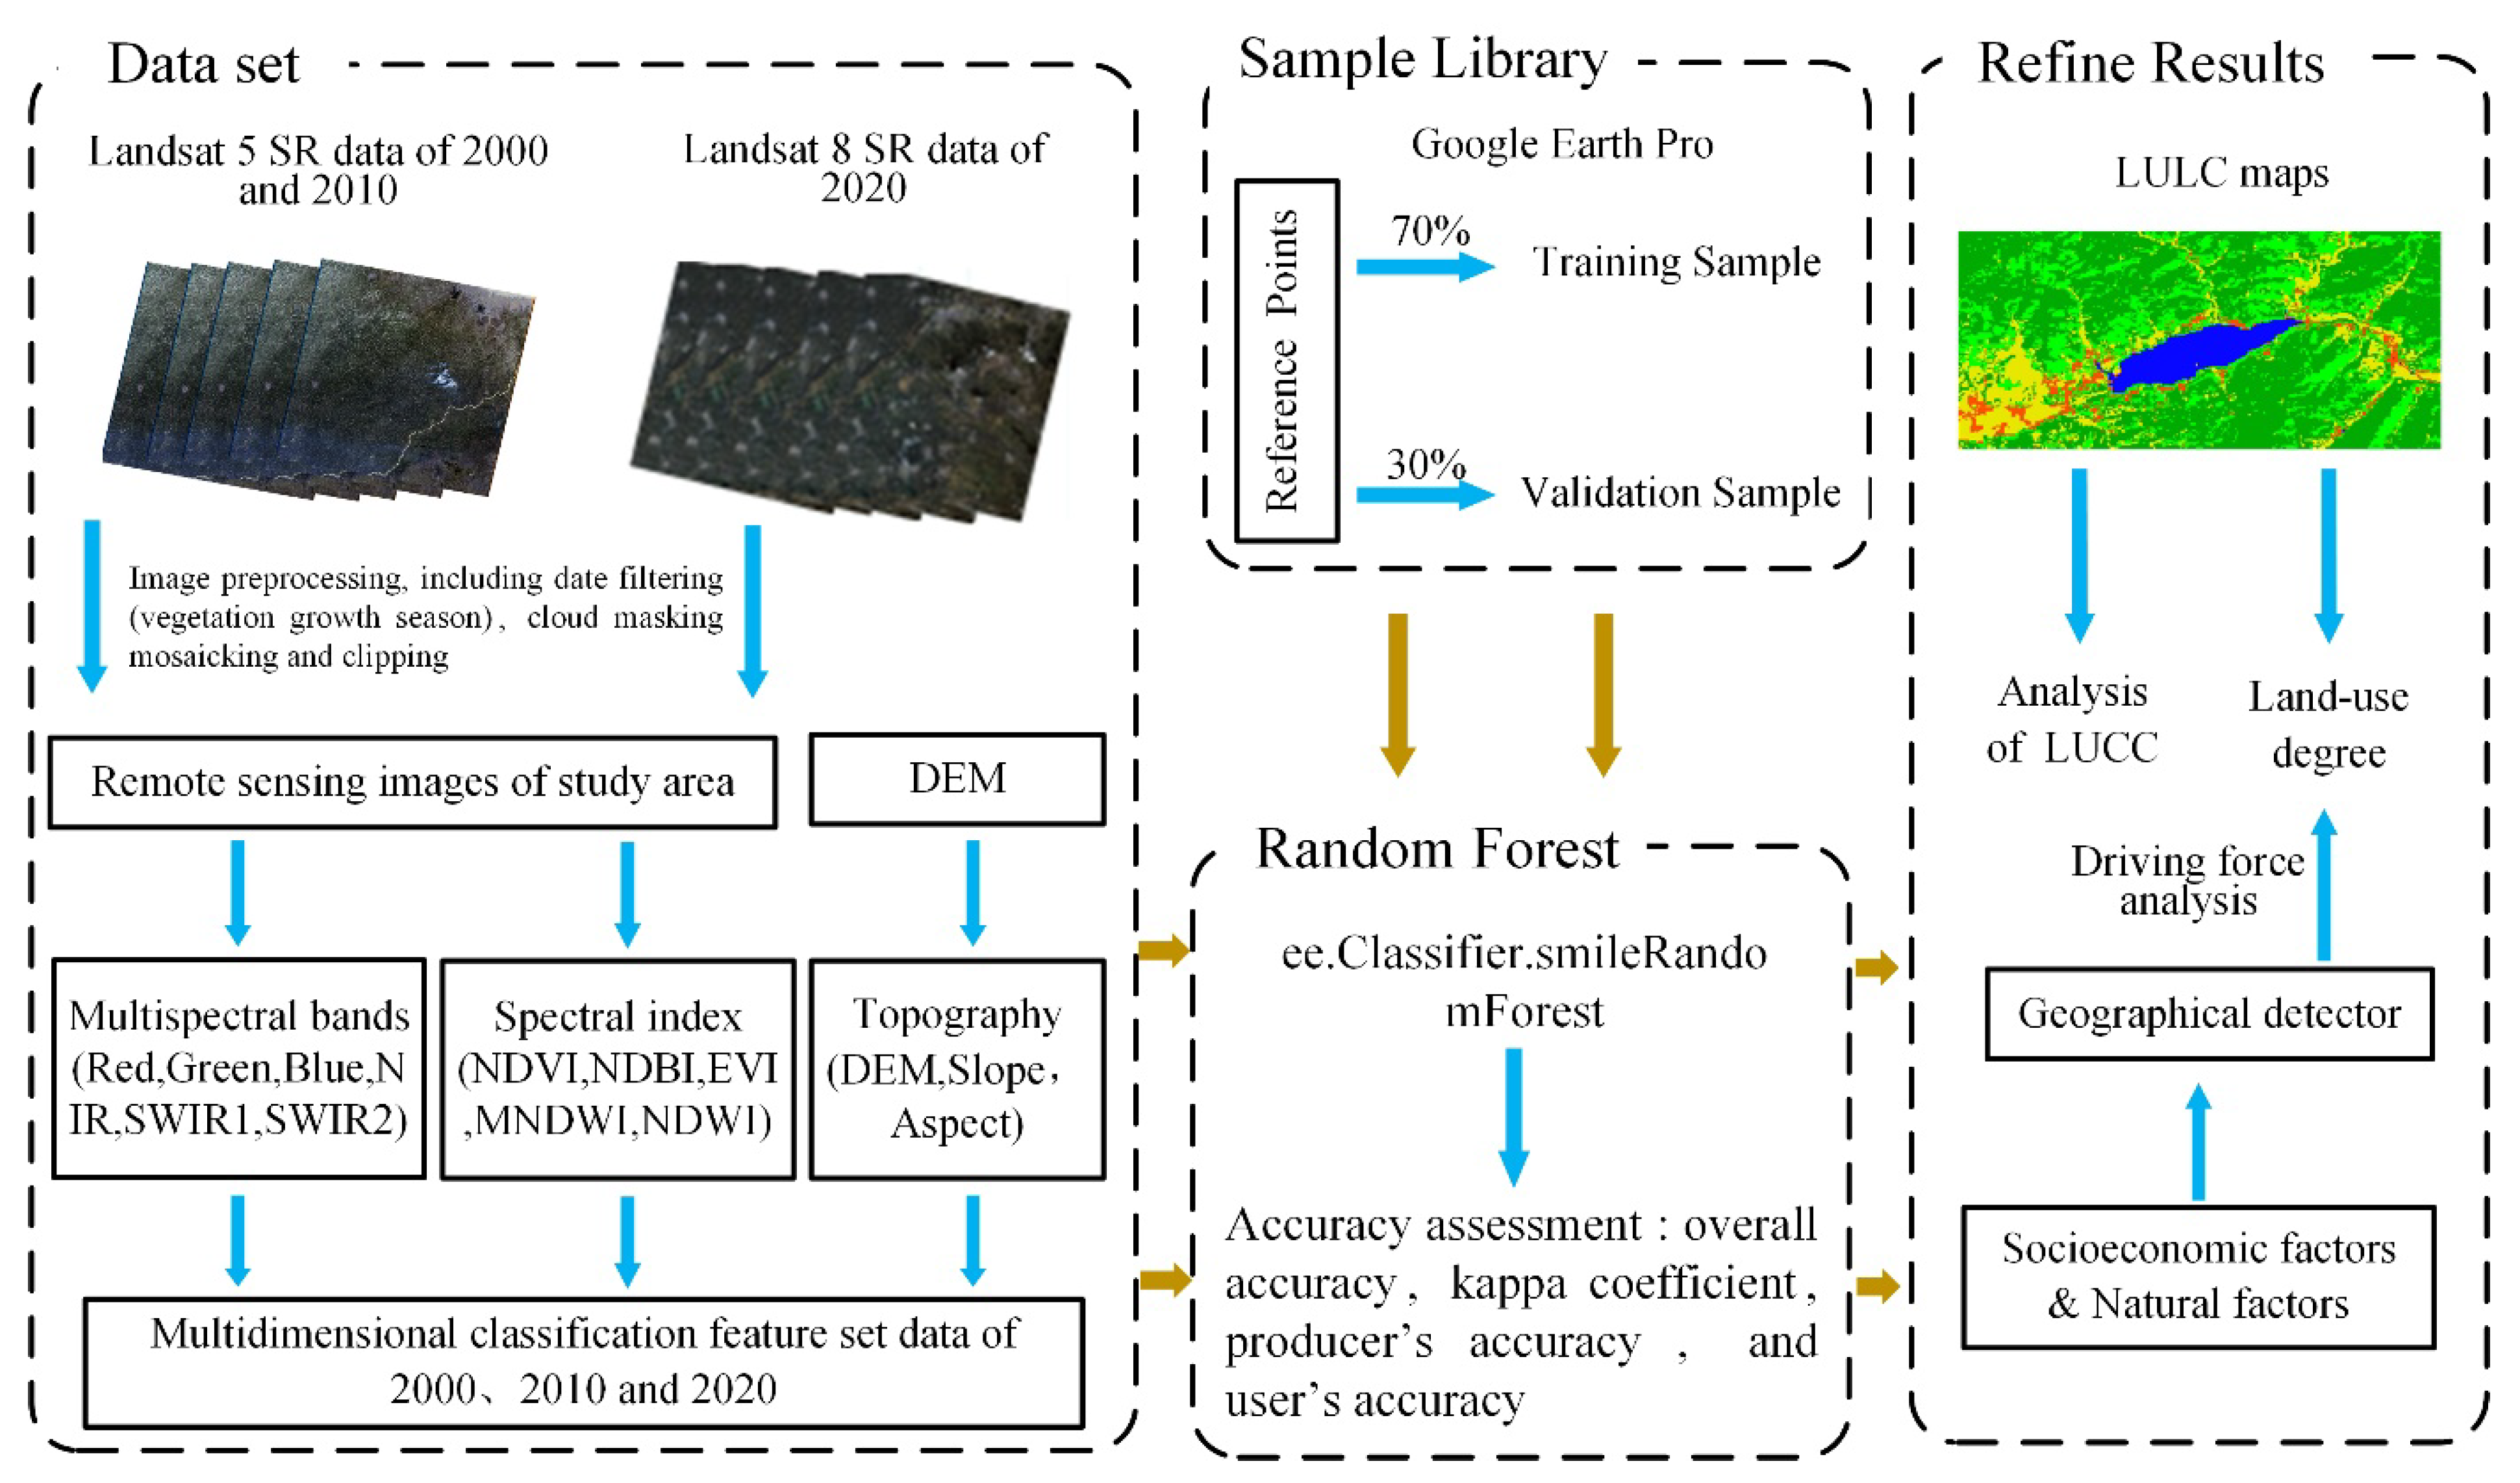
2.2. Data Preparation

The data used in this manuscript mainly included Landsat TM/OLI remote sensing image data, digital elevation model (DEM), basic geographic information data, meteorological data, and socio-economic data. In data preprocessing, this manuscript filters, clouds, mosaics, and cuts the surface reflection (SR) datasets of Landsat 5 TM and Landsat 8 OLI/TIRS in the Shandong section of the Yellow River Basin through the JavaScript application programming interface on the GEE platform. Finally, the elevation, slope, and aspect were extracted according to DEM.
In addition, population density (X1), gross domestic product (GDP) (X2), temperature (X3), precipitation (X4), elevation (X5), slope (X6), aspect (X7), and soil type (X8) were selected as the influencing factors to analyze the spatial differentiation characteristics of LULC change in the study area (presented in Table 1). The data of population density, GDP, temperature, precipitation, and soil type were collected from the resource and environmental science and data center of the Chinese Academy of Sciences (Available online: https://www.resdc.cn/, accessed on 25 August 2021).

2.2.1. Constructing Multidimensional Classification Feature Sets

Based on the GEE platform, this manuscript selected the apparent reflectance datasets of Landsat TM/OLI in the study area in 2000, 2010, and 2020. However, due to the complex climate conditions in the study area, the cloud-free image of the whole area could not be generated by using only the image of a single year, which had a certain negative impact on the study. Therefore, we used all the images from 1999–2001, 2009–2011, and 2019–2021 from April to October to synthesize the remote sensing image dataset of the target year and to achieve the best classification effect. The normalized difference vegetation indices—normalized difference vegetation index (NDVI) [43], normalized difference build and soil index (NDBI) [44], enhanced vegetation index (EVI) [45], normalized difference water index (NDWI) [46], modified normalized difference water index (MNDWI) [47]—and other indices were calculated, and factors such as elevation, slope, and aspect were obtained by importing DEM data to improve the classification accuracy. Finally, a high-quality multidimensional classification feature set for RF classification was obtained.

2.2.2. Training and Validation Sample Selection

The classification was determined based on the existing LULC in the study area and regarding the relevant previous studies [48,49]. The LULC types in the study area were classified into six categories: farmland, forest land, grassland, waterbody, construction land, and unused land.
High-quality training samples and verification samples are required when using the RF for feature classification. The samples in the three-time periods of the study area were obtained through visual interpretation based on the high-resolution historical images from Google Earth Pro. The number of sample points in 2000, 2010, and 2020 was 1370, 1351, and 1301, respectively. Seventy percent of the sample points were used as training samples for training classifiers and 30% as verification samples for accuracy verification [50].

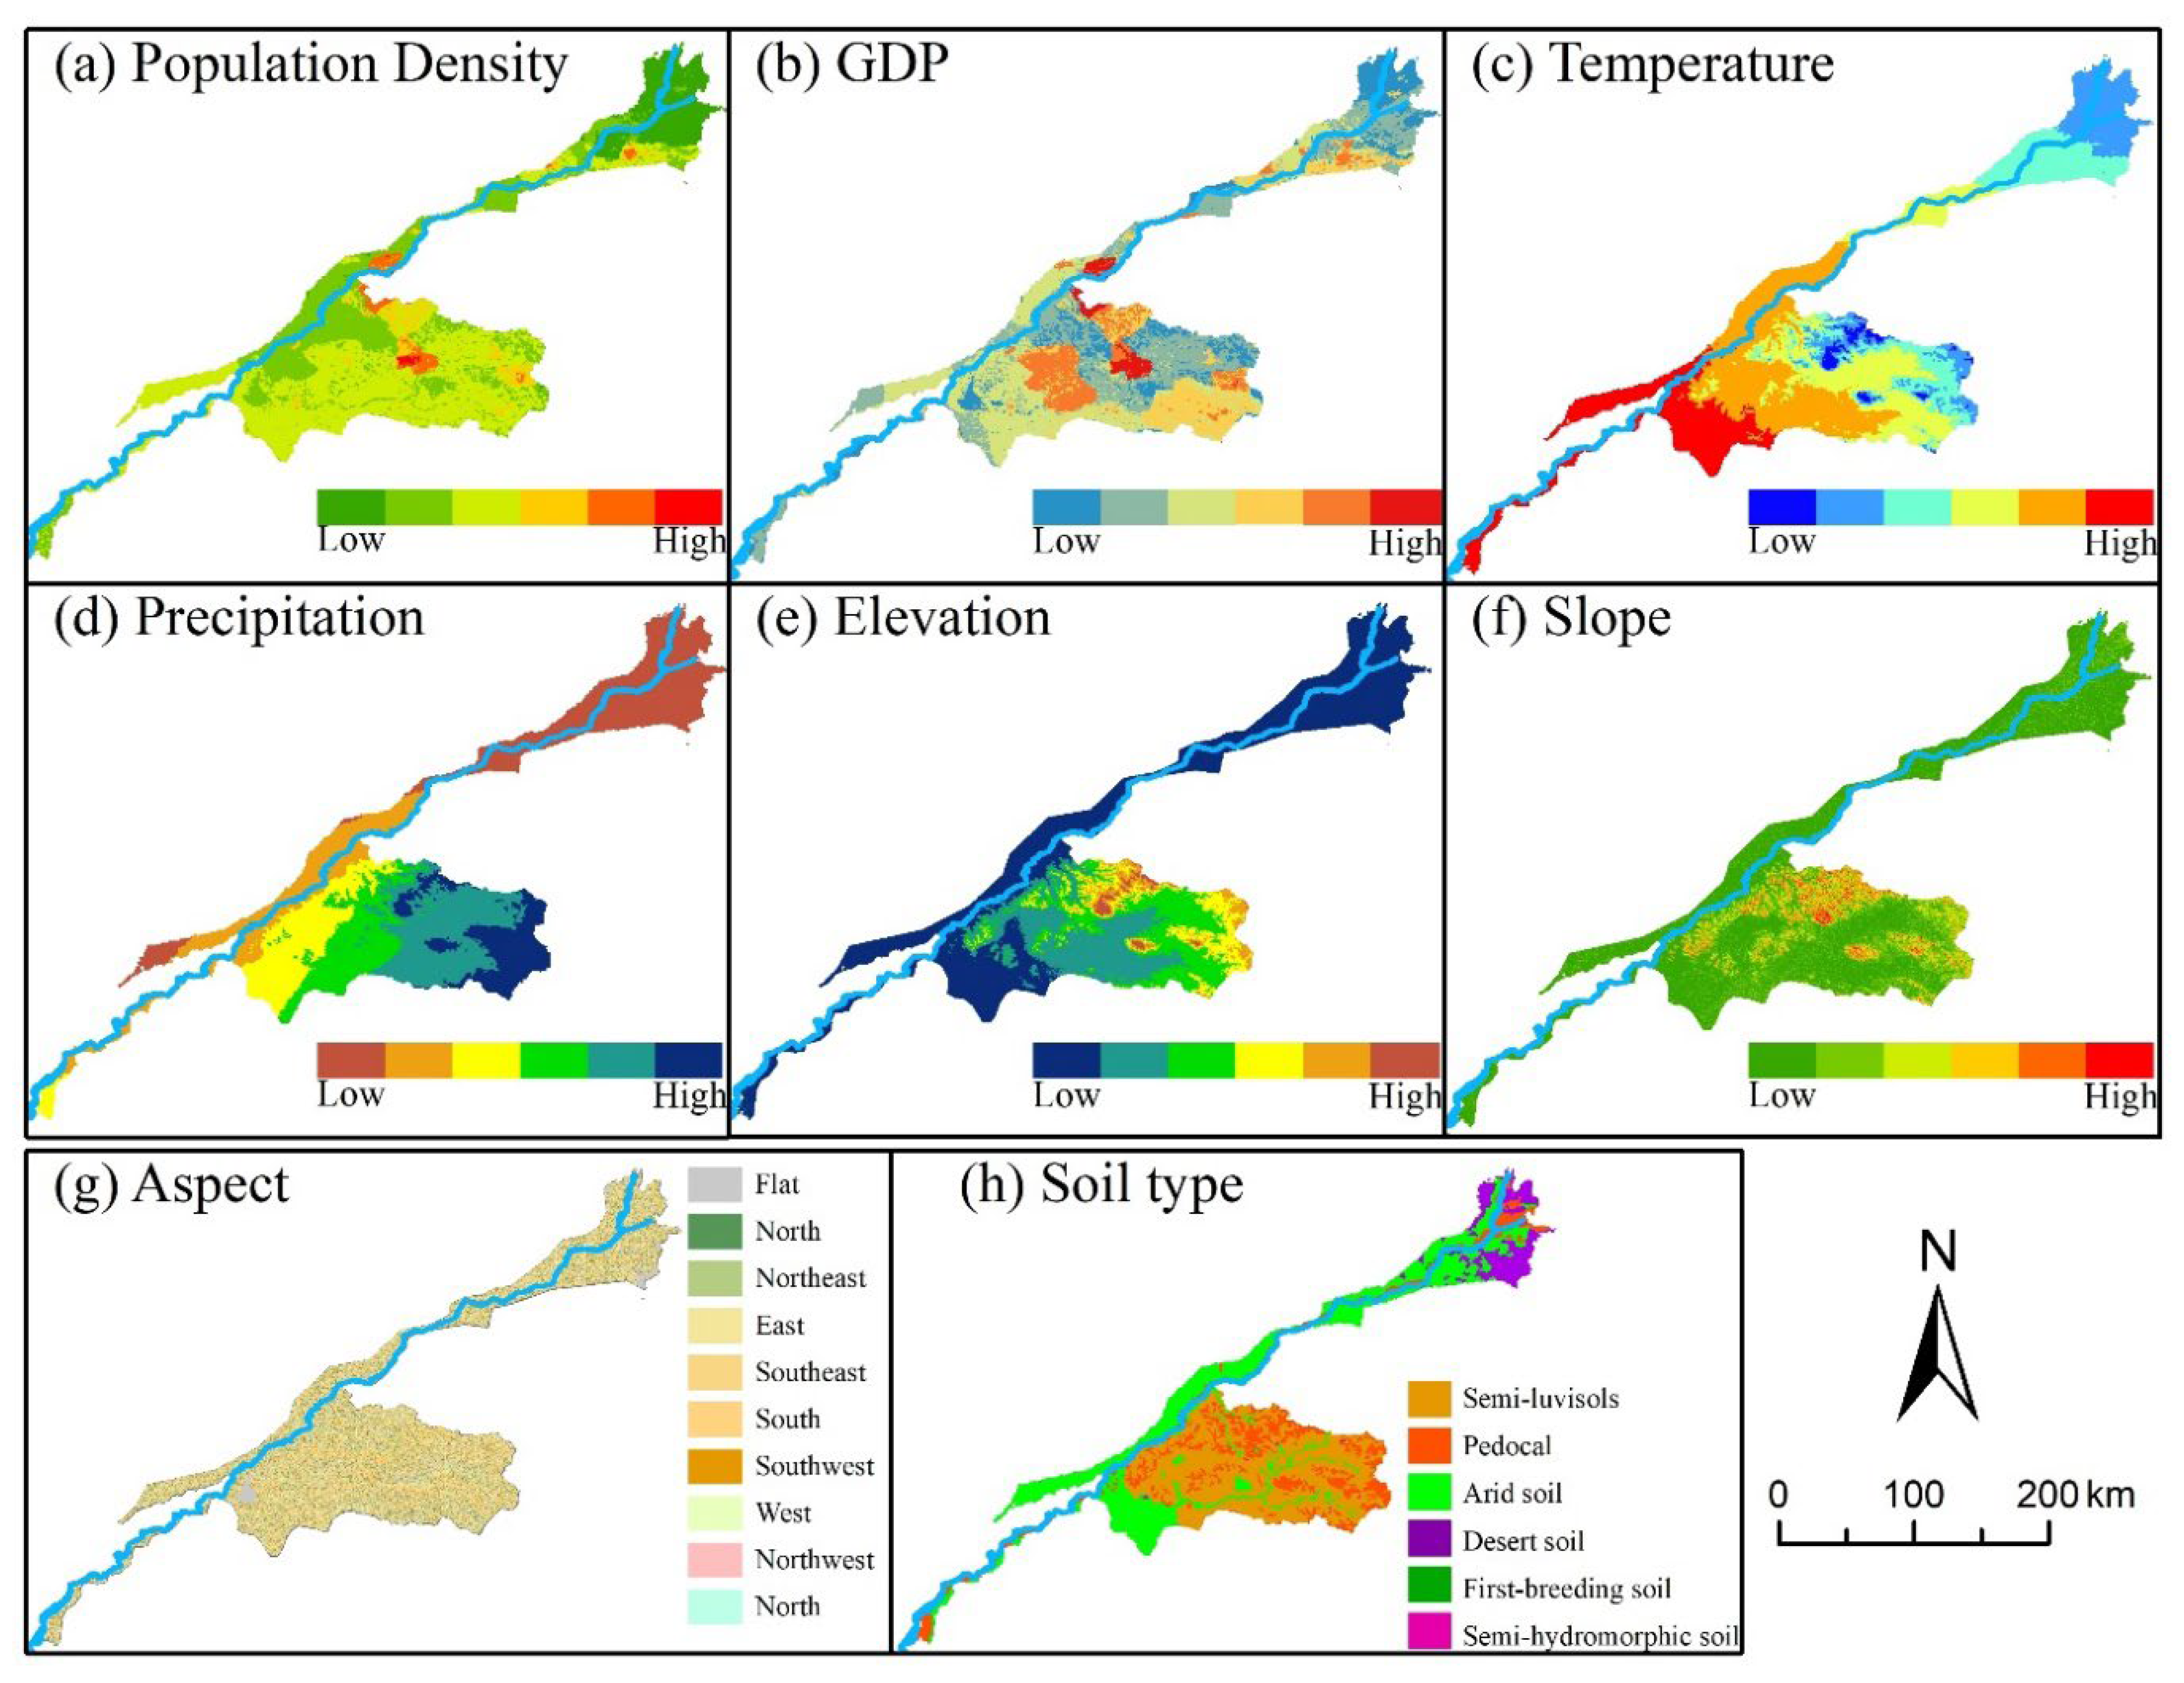
2.2.3. Anthropogenic and Natural Data

To analyze the driving factors of LULC change, we used geographic detectors to analyze the impact of various influencing factors on LULC change in the study area. Among them, the influencing factors such as population density, GDP, elevation, aspect, temperature, and precipitation were divided into six grades by using the natural breakpoint method. The soil types included semi-luvisols, pedocal, arid soil, desert soil, first-breeding soil, and semi-hydromorphic soil. The spatial distribution map of all influencing factors is presented in Figure 2.

2.3. Methods

This manuscript analyzed the extraction of LULC types and drivers of LULC change in the study area based on the multi-temporal Landsat series remote sensing image data on the GEE platform, and the flowchart is displayed in Figure 3. First, we preprocessed Landsat TM/OLI data into data filtering, cloud masking, mosaicking, and clipping on the GEE platform, and calculated the corresponding feature parameters to obtain the multidimensional classification feature dataset. The RF machine learning algorithm was then implemented to the LULC classification, and the results were validated using a confusion matrix. We obtained three LULC classification products for the study area in 2000, 2010, and 2020 and used the transfer matrix to analyze the changes in each LULC type. Finally, we analyzed the LULC change in the study area from two perspectives of natural and social factors through geographic probes for driving force analysis.

2.3.1. Random Forest

The random forest algorithm was implemented to the LULC classification, which is a combinatorial classification method based on categorical regression trees proposed by Leo Breiman in 2001 [51]. The basic principle of this algorithm is to construct a collection of decision tree classifiers, each decision tree would give a classification choice by using the mechanism of multiple decision tree voting to improve the problem of easy overfitting of decision trees as well as the use of majority voting mechanism strategy to obtain the final output [52,53]. Compared with other machine learning methods, RF classification algorithm has better robustness and can run effectively on large datasets [54,55,56]. Some scholars have carried out relevant research on LULC classification by using the RF algorithm on the GEE platform and achieved excellent research results [57,58,59].
The LULC type was performed by directly calling the ee.smileRandomForest function in the GEE API, which only needs to identify two parameters: the number of classification trees and the number of feature variables entered at the time of node splitting [60]. It was found experimentally that the classification results were more accurate when the number of trees was 500, so 500 trees were finally selected for RF classification, and the number of feature variables had the square root of the number of features involved in the classification calculated [61].

2.3.2. Evaluation

In this manuscript, we used a confusion matrix to verify the accuracy of the classification results of the features in the study area and describe the accuracy of the classification results by calculating the overall accuracy, Kappa coefficient, producer’s accuracy, and user’s accuracy.
1. Overall accuracy: The overall accuracy reflects the overall effectiveness of the algorithm and is measured by the proportion of the number of correctly classified samples to the total number of validation samples.
P O A = 1 N i = 1 n p i i
where POA denotes the overall accuracy; N denotes the total number of samples used for accuracy evaluation; n denotes the total number of categories; and pii denotes the number of correct classifications of the ith sample in the confusion matrix.
2. Kappa coefficient: Kappa coefficient indicates the degree of agreement between the ground truth data and predicted values.
K = N k = 1 n p k k k = 1 n ( i = 1 n p k i j = 1 n p k j ) N 2 k = 1 n ( i = 1 n p k i j = 1 n p k j )
where K denotes the kappa coefficient; n denotes the total number of categories; pkk denotes the number of correct classifications of the kth sample in the confusion matrix; and i = 1 n p k i and j = 1 n p k j denote the sample size on the i-th and j-th columns, respectively. N denotes the total number of samples used for accuracy evaluation.
3. Producer’s accuracy: The mapping accuracy indicates the probability that the ground truth reference data (validation sample) of the category is correctly classified.
P P A = p k k j = 1 n p k j
where PPA denotes the mapping accuracy; n denotes the total number of categories; pkk denotes the number of correct classifications of the kth sample in the confusion matrix; and j = 1 n p k j denotes the sample size on the jth column.
4. User’s accuracy: The user accuracy represents the ratio of the number of correctly classified pixels in a category to the total number of pixels in that category in the subcategory.
P U A = p k k i = 1 n p k i
where PUA denotes user accuracy; n denotes the total number of categories; pkk denotes the number of correct classifications of the kth sample in the confusion matrix; and i = 1 n p k i with denotes the sample size on the ith row.

2.3.3. Land Use Degree Index

In this manuscript, we evaluated the land use degree index in the study area using the composite land use index, which is a reflection of the actual degree of human use of land and is essentially explained by the level of land use and development in the region. A higher value indicates a stronger degree of land use and the more complex the social and economic activities in the area [62]. The degree of land use in the study area is calculated as follows:
l a = 100 × i = 1 n A i × C i
where La is the land use degree index value; Ai is the land use degree grading index; and Ci is the percentage of the graded area of the i-th type of land use degree. According to relevant studies [63], the types were divided into four classes and assigned different grading indices, as shown in Table 2.

2.3.4. Geographical Detector

The geographical detector method was proposed by combining geographic information system (GIS), spatial superposition, and set theory techniques based on the theory of spatial differentiation [64,65]. The geographical detector is a new method to reveal its driving factors by detecting spatial differentiation, which overcomes the disadvantages of traditional mathematical-statistical models with many assumptions and large data requirements [66]. The geographic detector includes four detectors: factor detector, interaction detector, risk detector, and ecological detector. According to the research aims, this manuscript adopted the factor detector and interaction detector in the geographic detector to reveal the driving factors of LULC change in the study area, and analyzed the interaction between the factors on LULC change, and conducted driving force analysis and quantitative attribution of LULC change in the study area from multiple perspectives.
The factor detector is mainly used to detect the spatial heterogeneity of the dependent variable and the explanatory power of the independent variable on the dependent variable, the explanatory power of the influence factor Xi on the spatially heterogeneous characteristics of LULC change [67], q can be expressed as:
q = 1 h = 1 L N h σ h 2 N σ 2
where L is the number of layers of the independent variable; N and Nh are the number of samples within the layer and within the region; and σ2 is the overall variance of the sample.
The interaction detector is used to identify the interaction between different risk factors to assess whether the factors together increase or decrease the explanatory power on the dependent variable, or whether the effects of these factors on the dependent variable are independent of each other [68,69]. Assuming that q(x1) and q(x2) are the explanatory power of the influence factors x1 and x2, respectively, on the spatially divergent characteristics of LULC change, q(x1x2) is the explanatory power of the two factors when interacted with each other, and five patterns of influence exist (Table 3).

3. Results

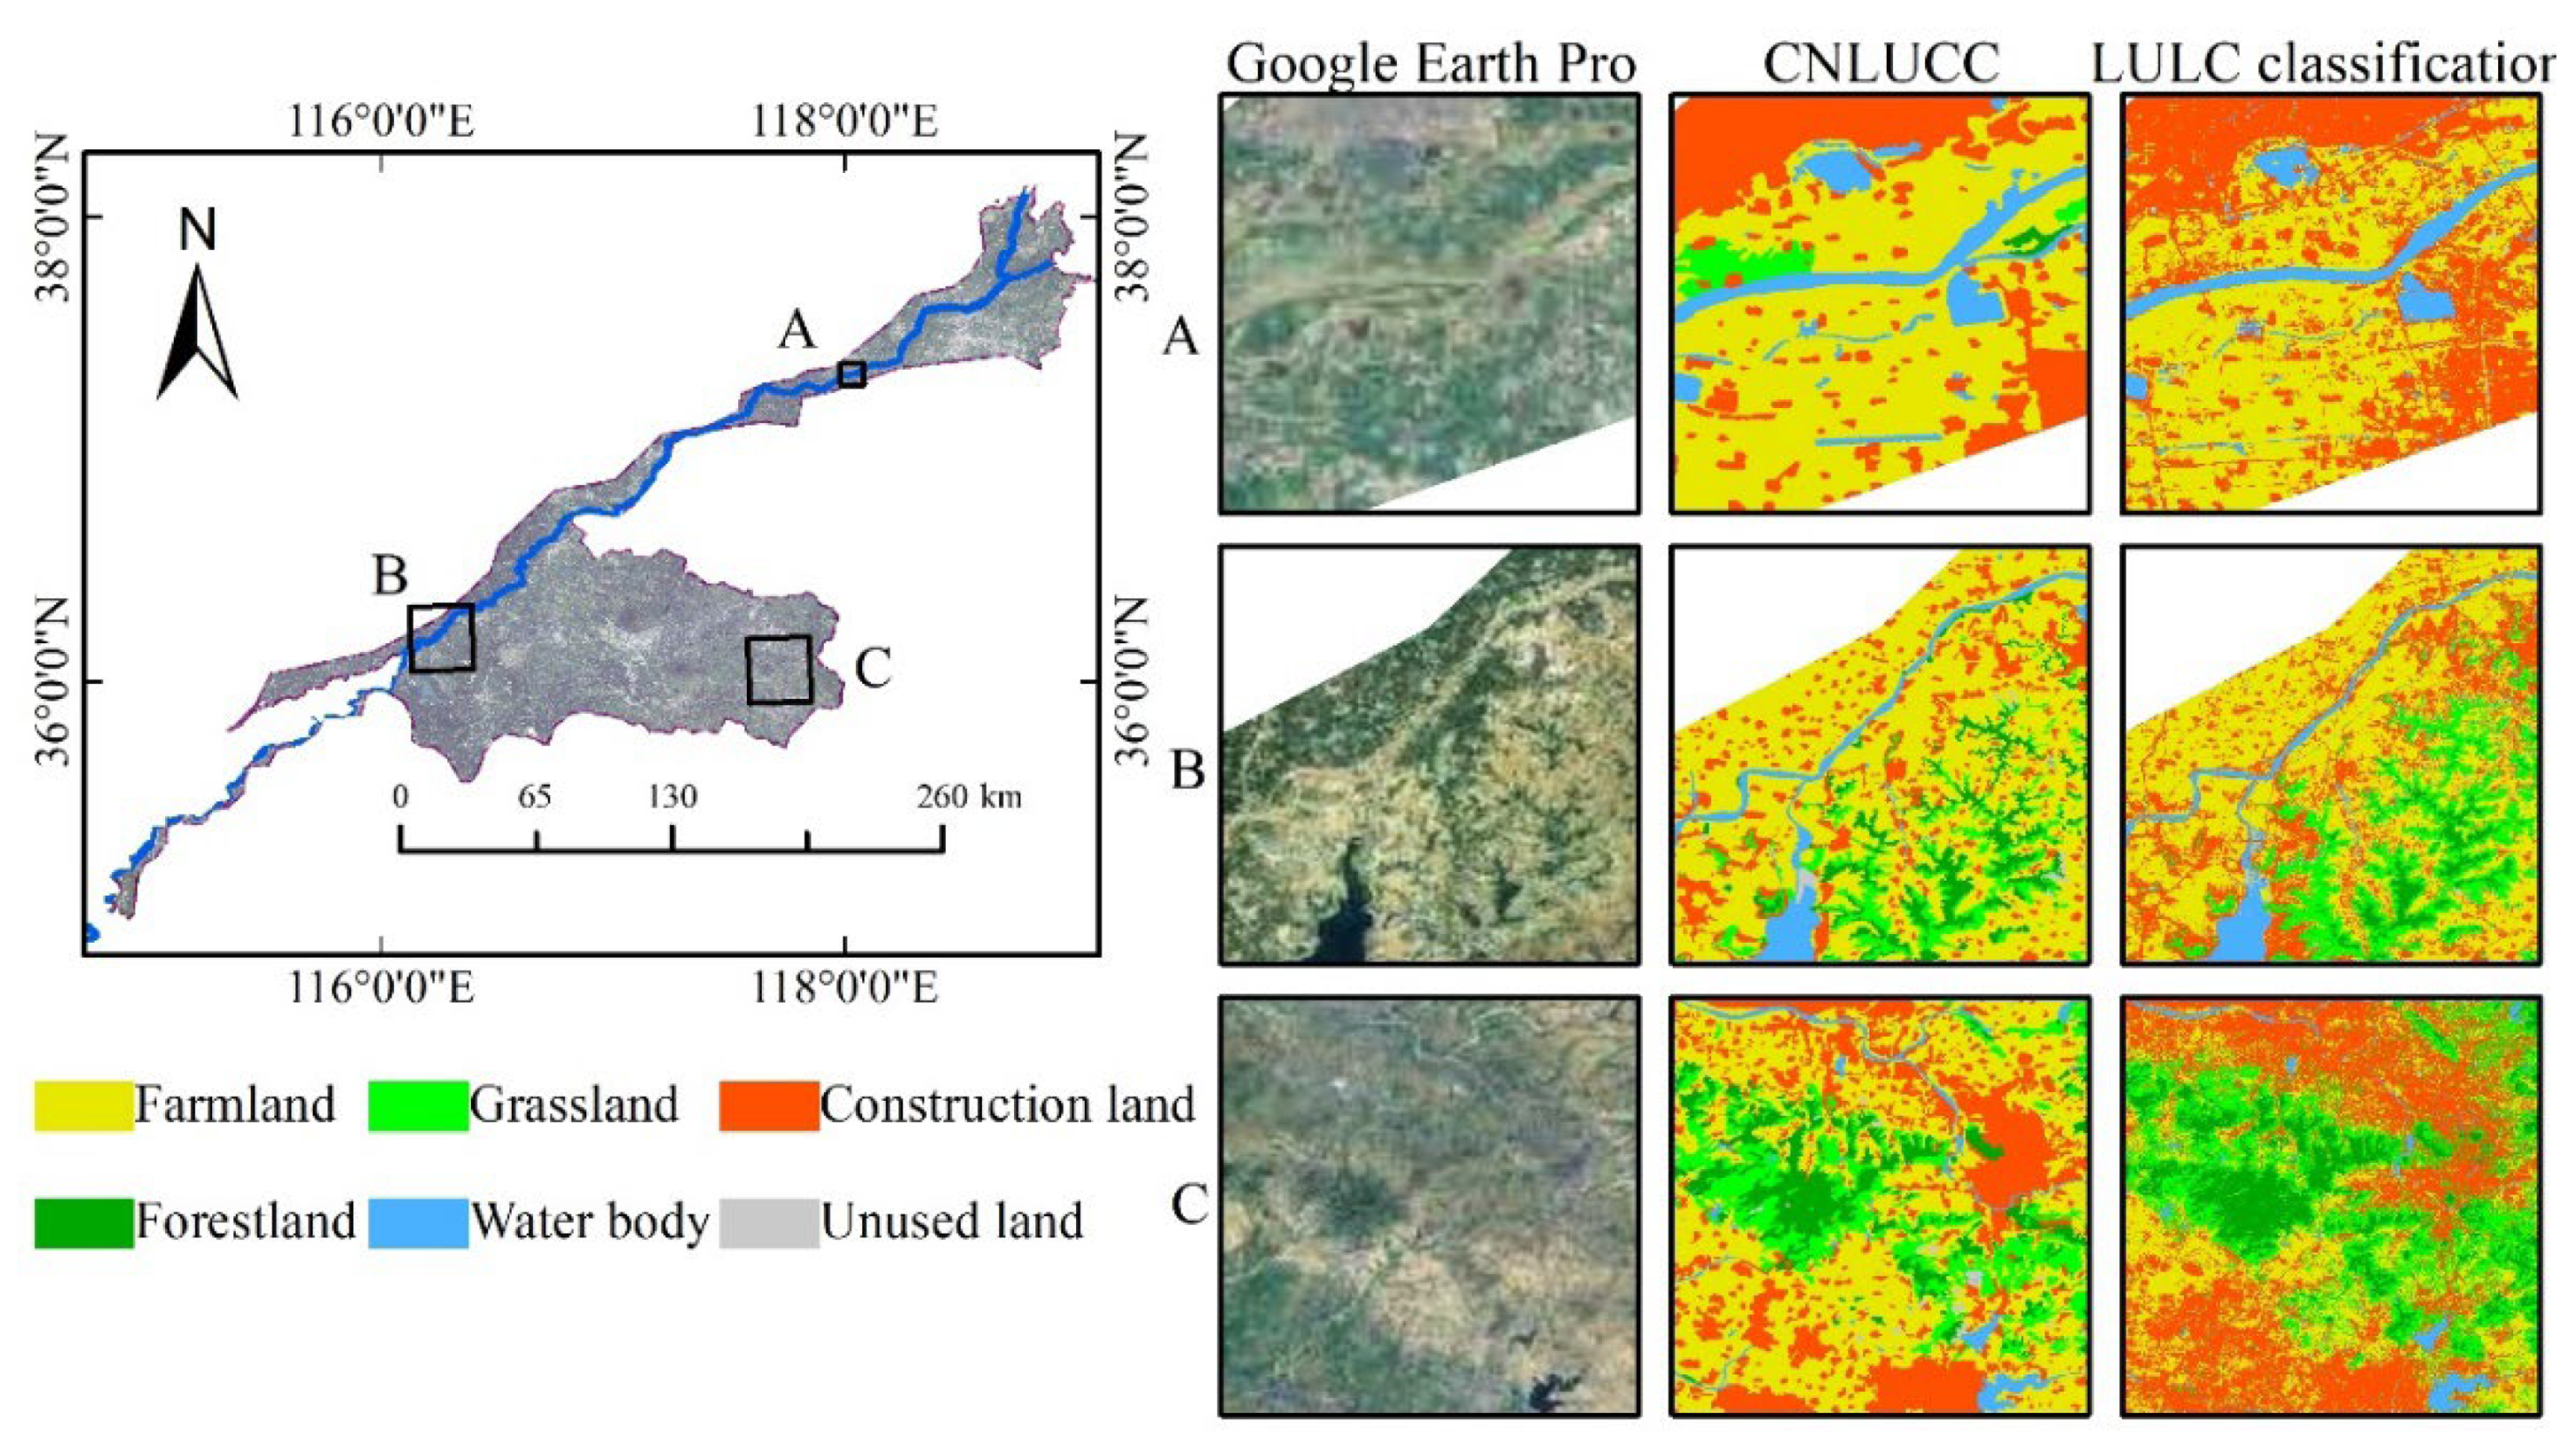
3.1. Accuracy Assessment

The accuracy of the classification results is the fundamental part of LULC change analysis. This manuscript calculated the confusion matrix between the training samples and classification results each year based on the GEE platform. The results are displayed in Table 4. The overall accuracy of the three classification results in 2000, 2010, and 2020 were 87.54%, 88.06%, and 89.85%, respectively, and the kappa coefficient was 0.86, 0.88, and 0.89, respectively. The overall accuracy and kappa coefficient of classification in the three-periods were above 80% and different LULC types had high cartographic accuracy in the classification results of each period. It can be concluded that the overall accuracy of classification reached an acceptable threshold, indicating that the classification results were accurate and reliable.
To further verify the accuracy of the classification results, several parts of the classification results in the study area were randomly selected and the results were then compared with the Google Earth Pro and China multi-period LULC remote sensing monitoring dataset (CNLUCC) [70]. As presented in Figure 4, the classification results of this manuscript could better classify water bodies, construction land, grassland, and some arable land. This had a high correspondence with the features in the Google Earth Pro images. Overall, the results of the LULC type in this manuscript proved the accuracy and reliability.

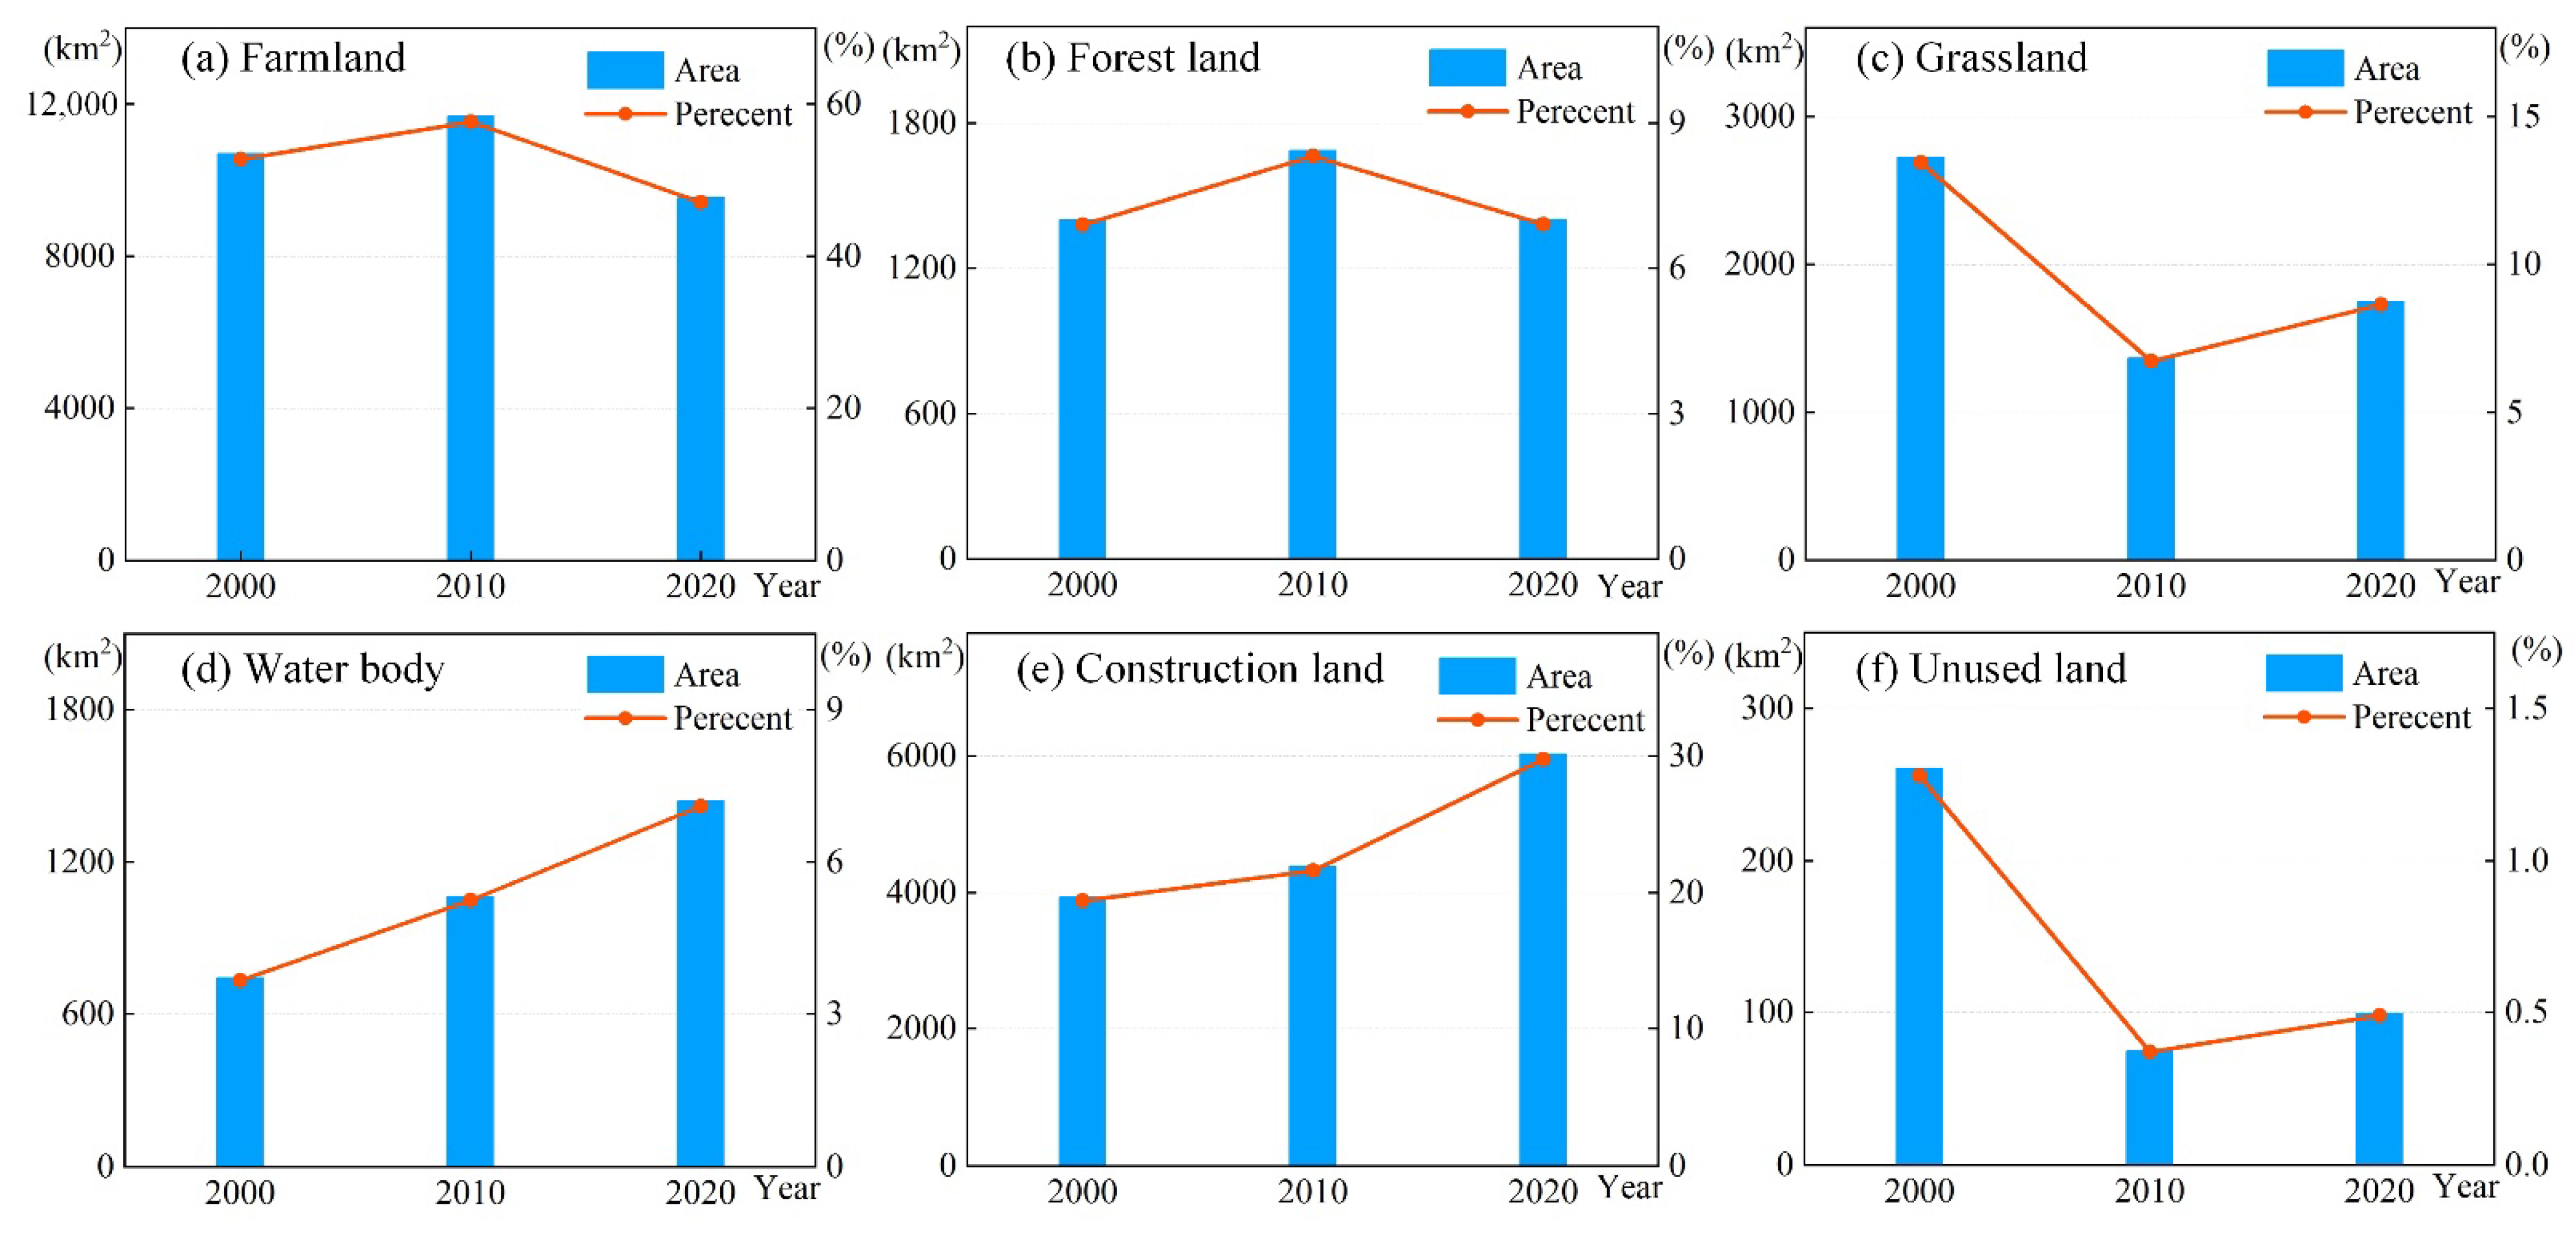
3.2. LULC Structure Change

The spatial distribution of three phases of LULC in the Shandong section of the Yellow River Basin from 2000 to 2020 is displayed in Figure 5 and Figure 6. It can be seen from the figure that farmland is the main LULC type in the study area, accounting for more than 47%, which is mainly distributed along the Yellow River and in the plain area in the south of Mount Tai. The proportion of construction land area has gradually increased from 19.42% in 2000 to 29.77% in 2020 and is mainly distributed on the plain in the form of rural settlement patches, while a large area of construction land patches is mainly distributed in the main urban area of Tai’an City and Laiwu District. The proportion of forest land area is about 7%, mainly concentrated in Mount Tai and surrounding mountainous areas. The overall change of water area was relatively small, which is mainly distributed in the Yellow River, Dongping Lake, and other small reservoirs.

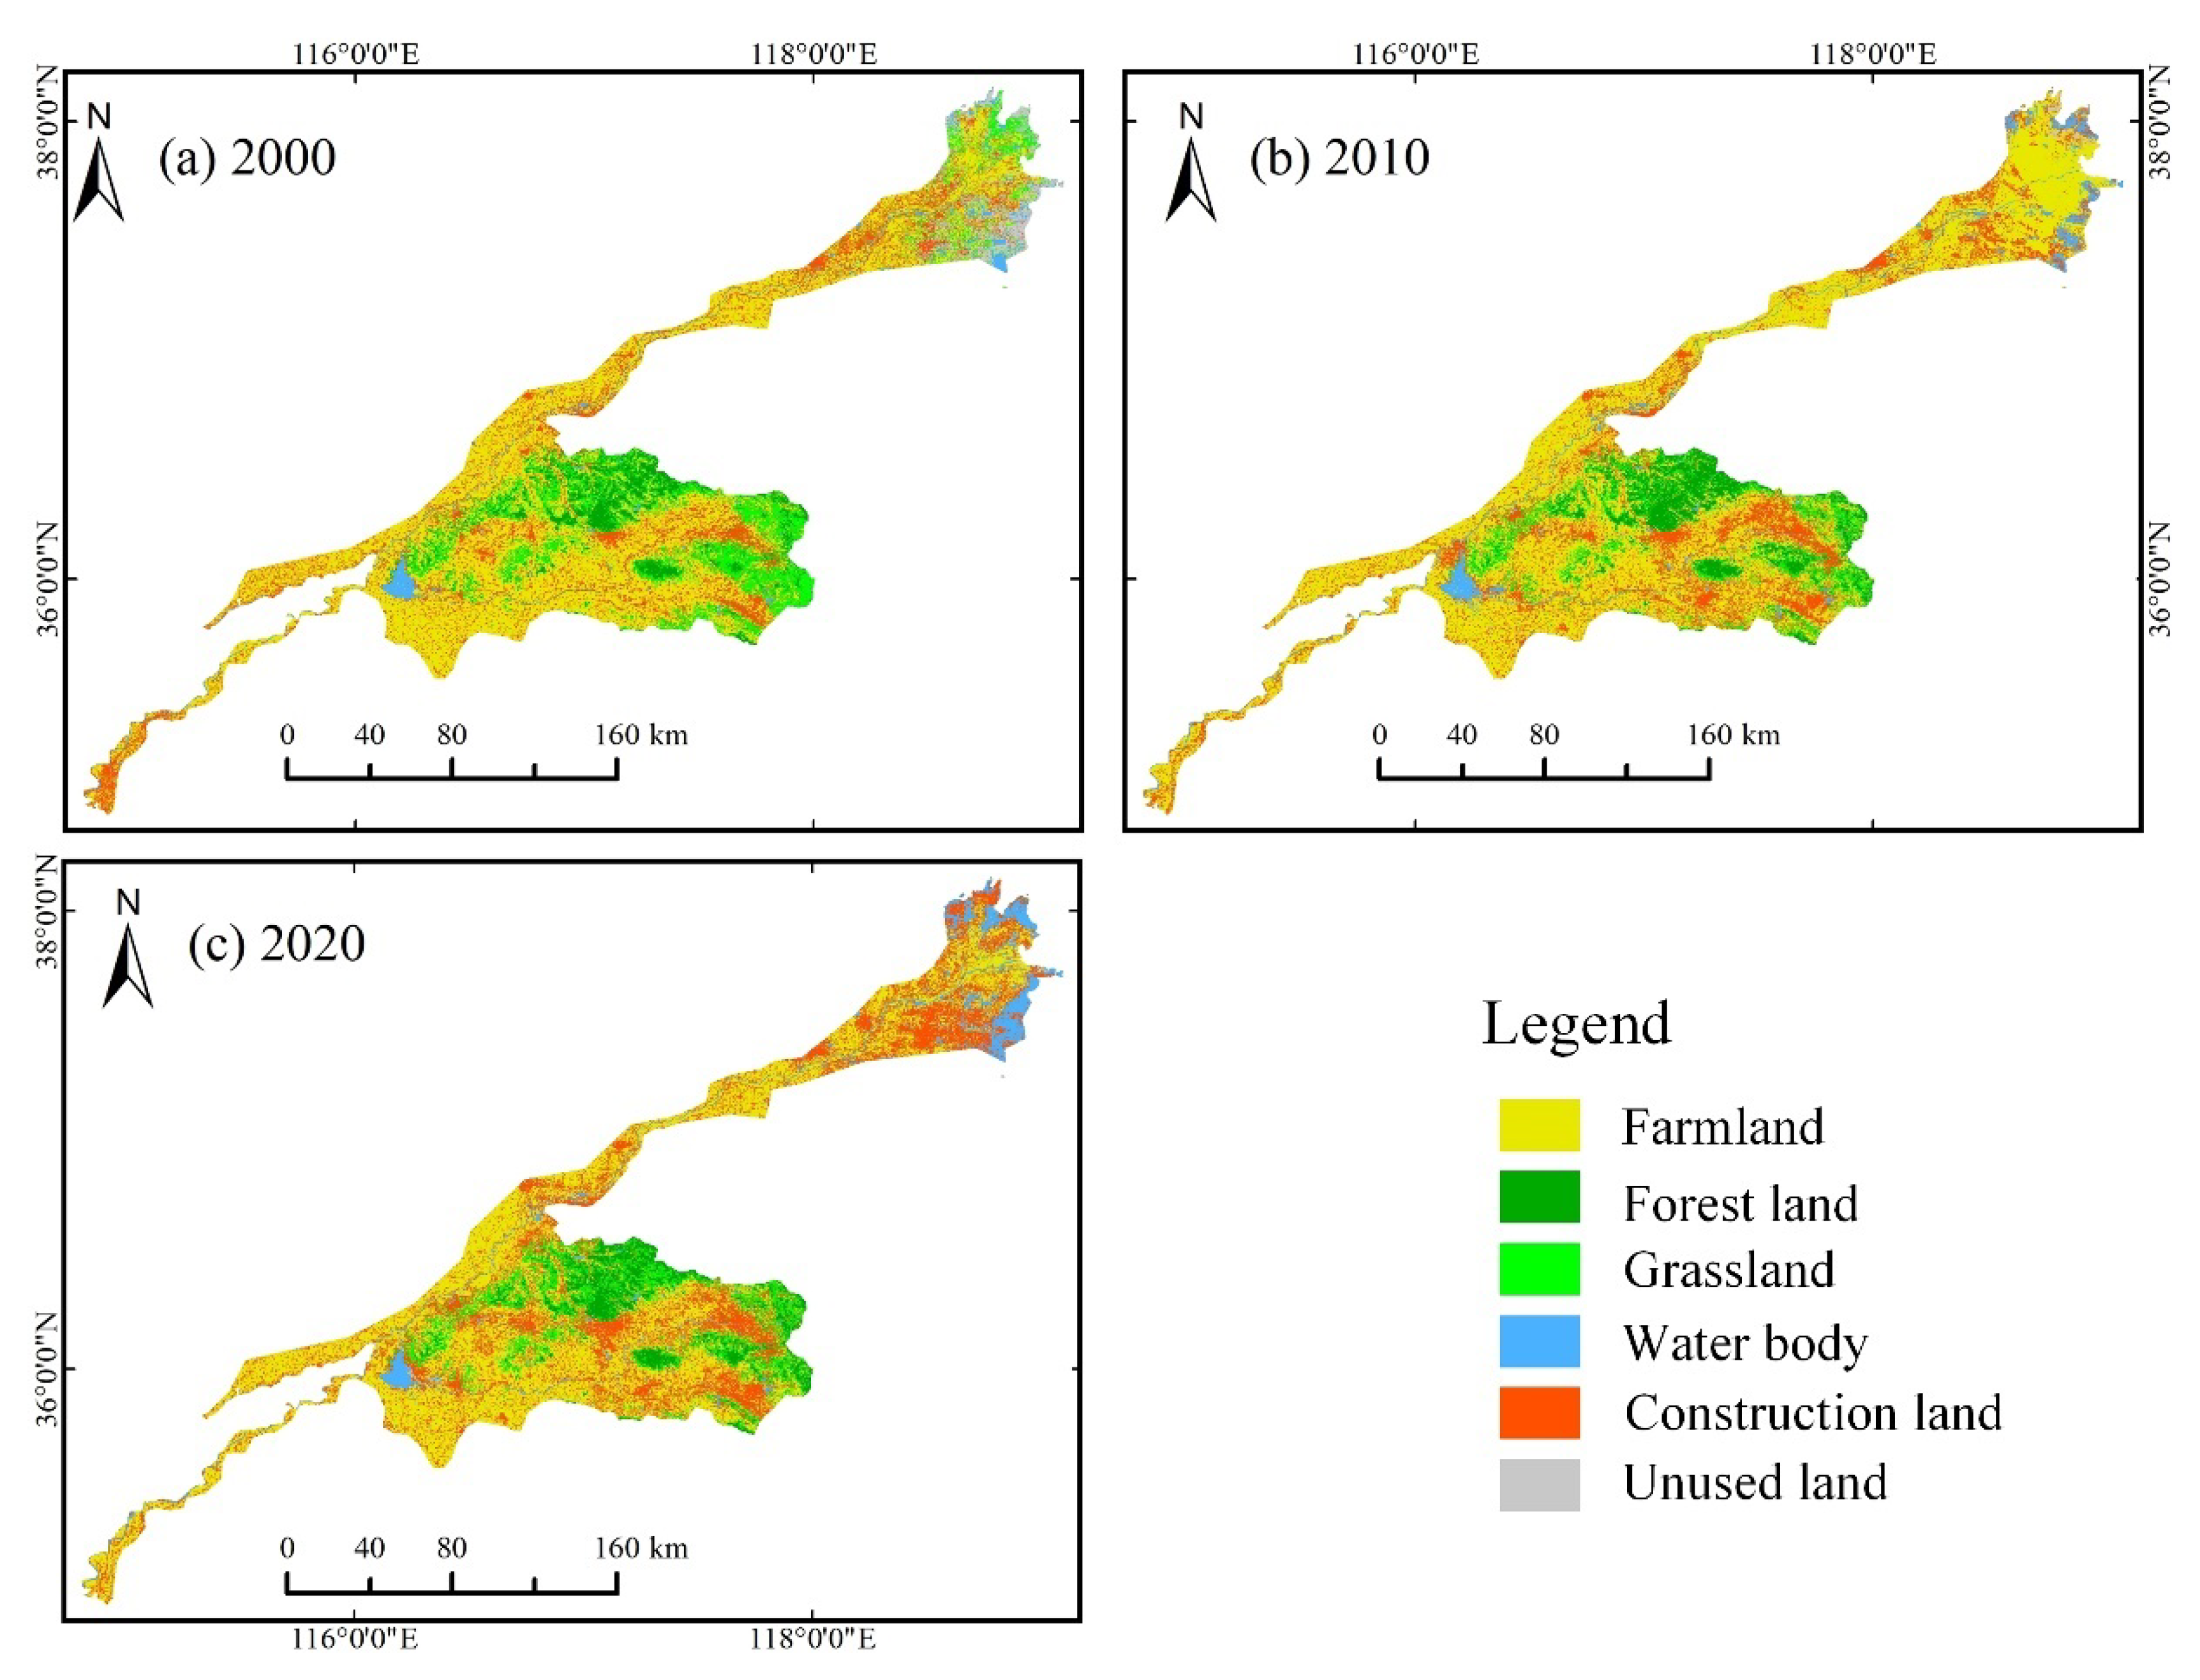
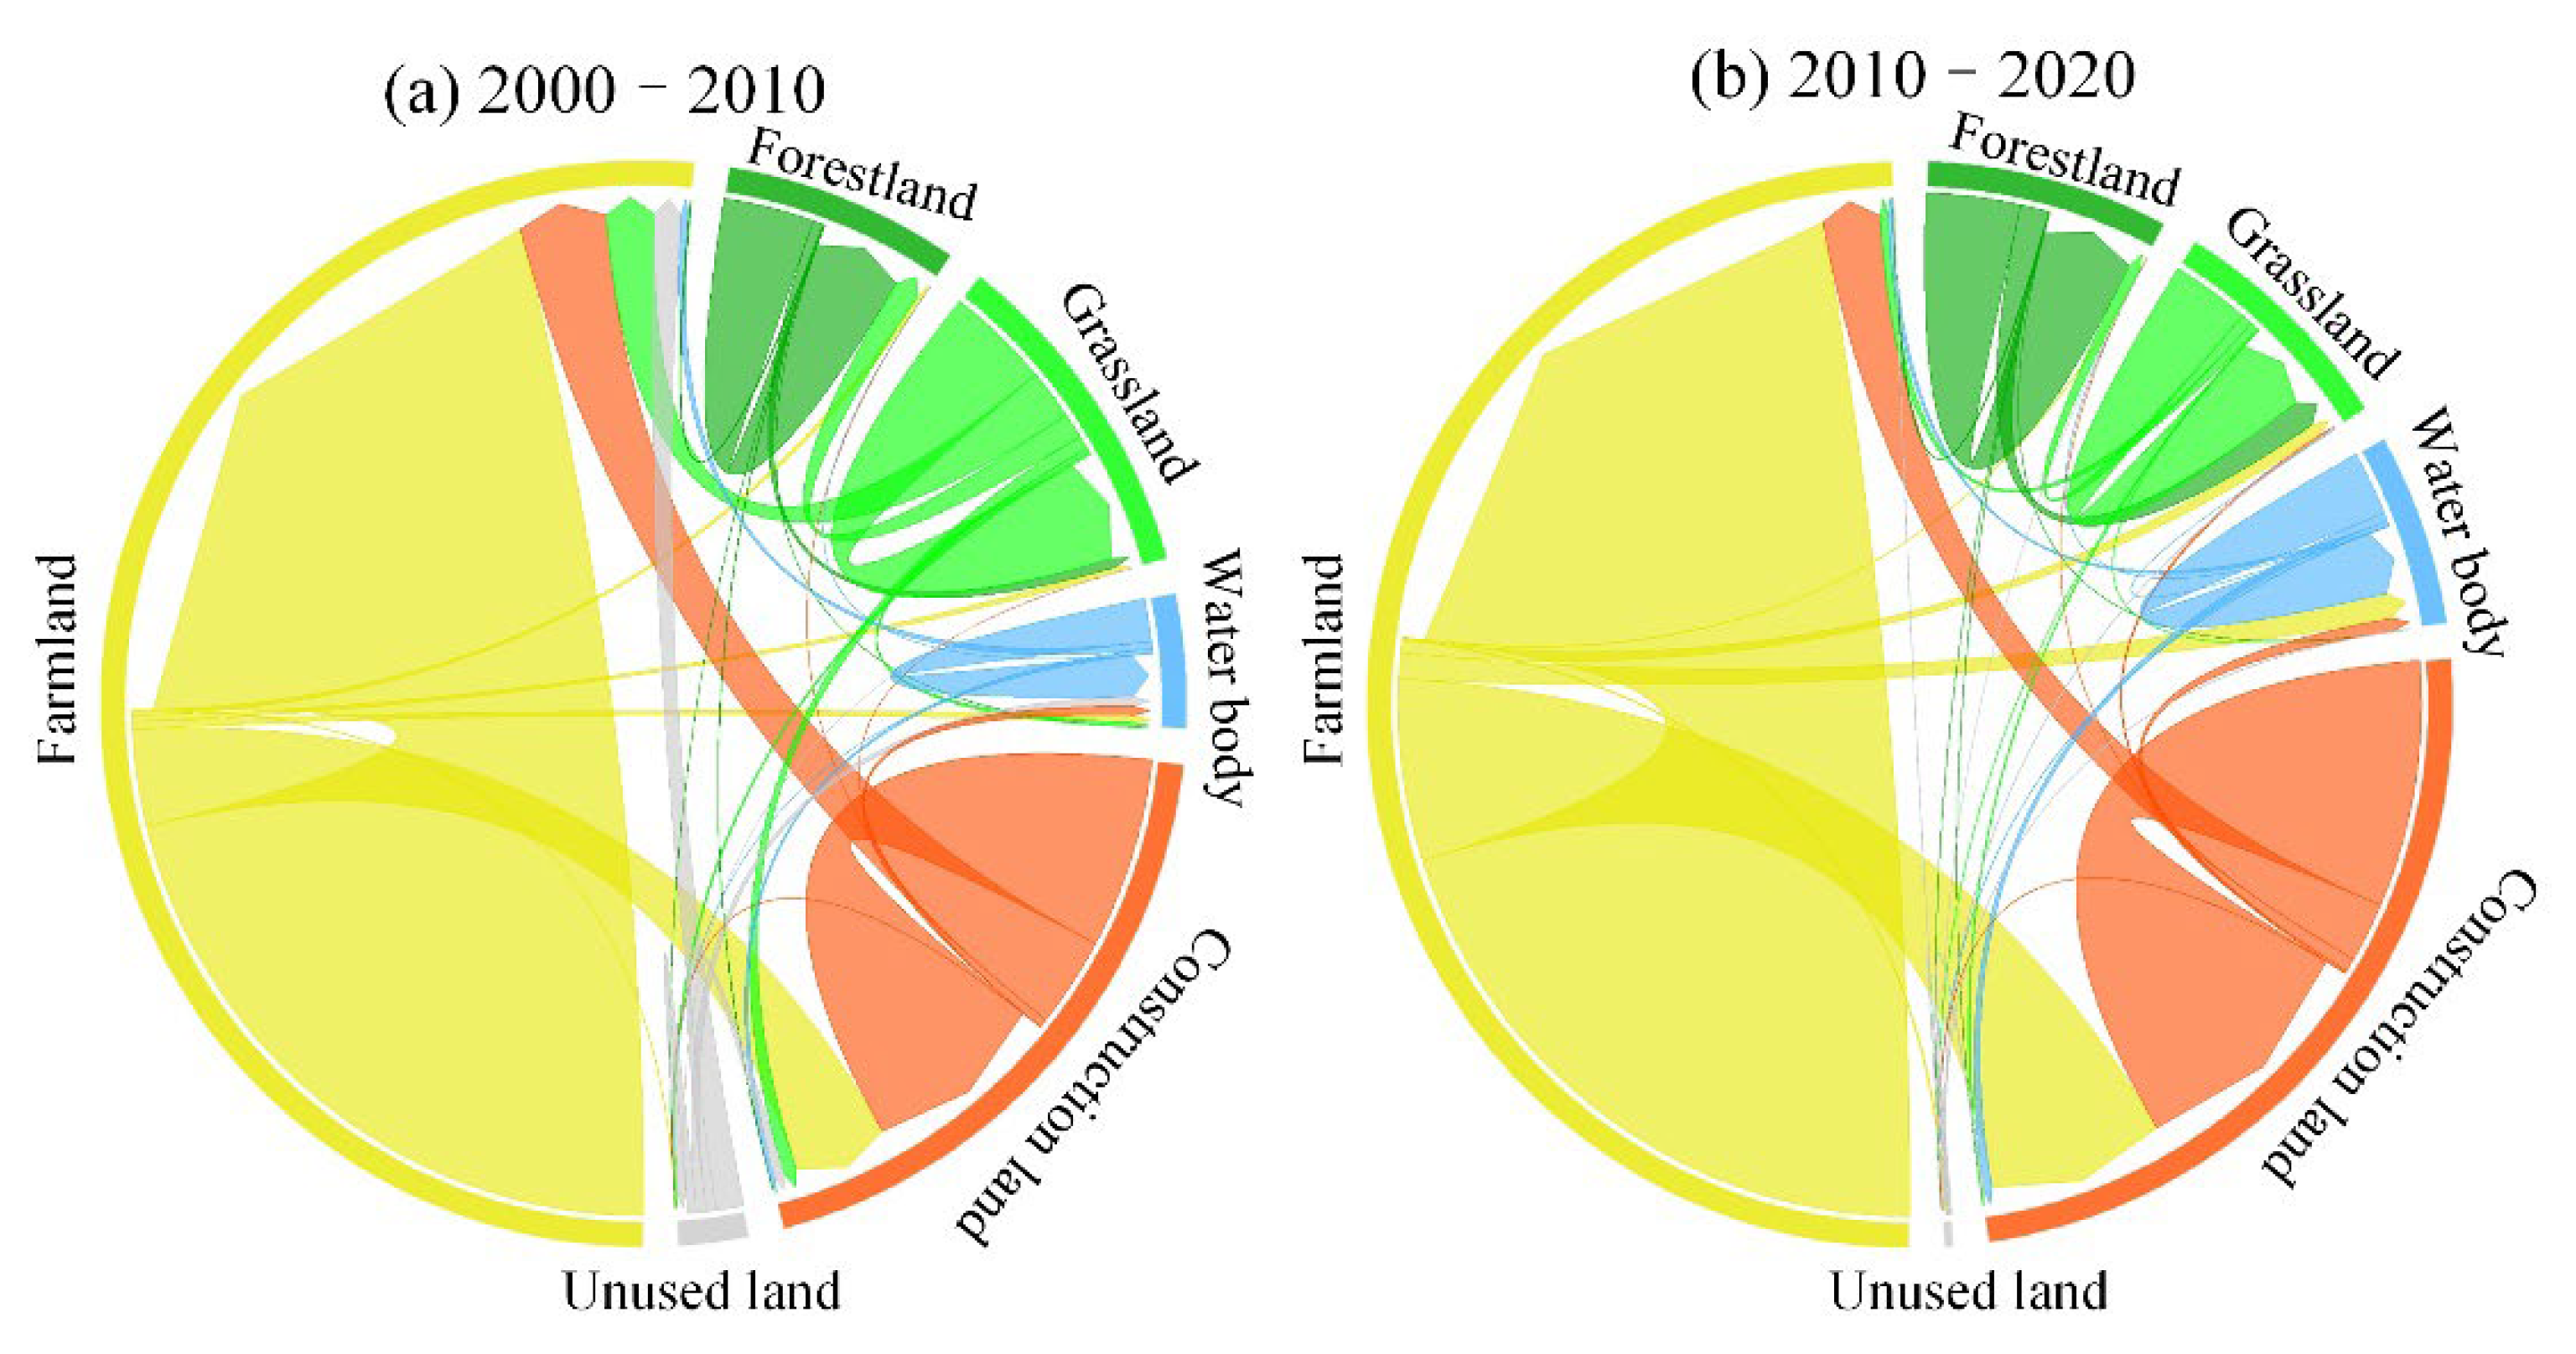
3.3. Spatial-Temporal LULC Changes

To intuitively reflect the quantitative structural characteristics of LULC types and the transfer relation between different LULC types, we calculated the LULC transfer matrix to quantitatively describe the mutual transformation between different LULC types in the study area. The transfer maps of LULC types in the study area from 2000 to 2010 and from 2010 to 2020 were calculated and are presented in Figure 7, respectively. In general, the area of construction land and farmland in the study area increased significantly, the area of grassland decreased, while the area of other LULC types remained basically unchanged. From the perspective of the main LULC type transfer, the expansion of construction land mainly came from farmland, and the reduced grassland mainly flowed to farmland and forest land. From 2010 to 2020, the construction land increased. In contrast, the farmland area showed a downward trend. The reduced farmland was mainly transformed into construction land, while a small amount of construction land was transformed into farmland, and part of the grassland was transformed into forest land. Comparing the LULC change in the study area from 2000 to 2010 and from 2010 to 2020, it can be concluded that the farmland area in the study area increased first and then decreased, and the total area of the farmland has increased gradually during the past twenty years. In conclusion, from 2000 to 2020, the total area of construction land in the study area gradually increased, the area of forest land and water body almost changed, and the area of farmland and grassland decreased.

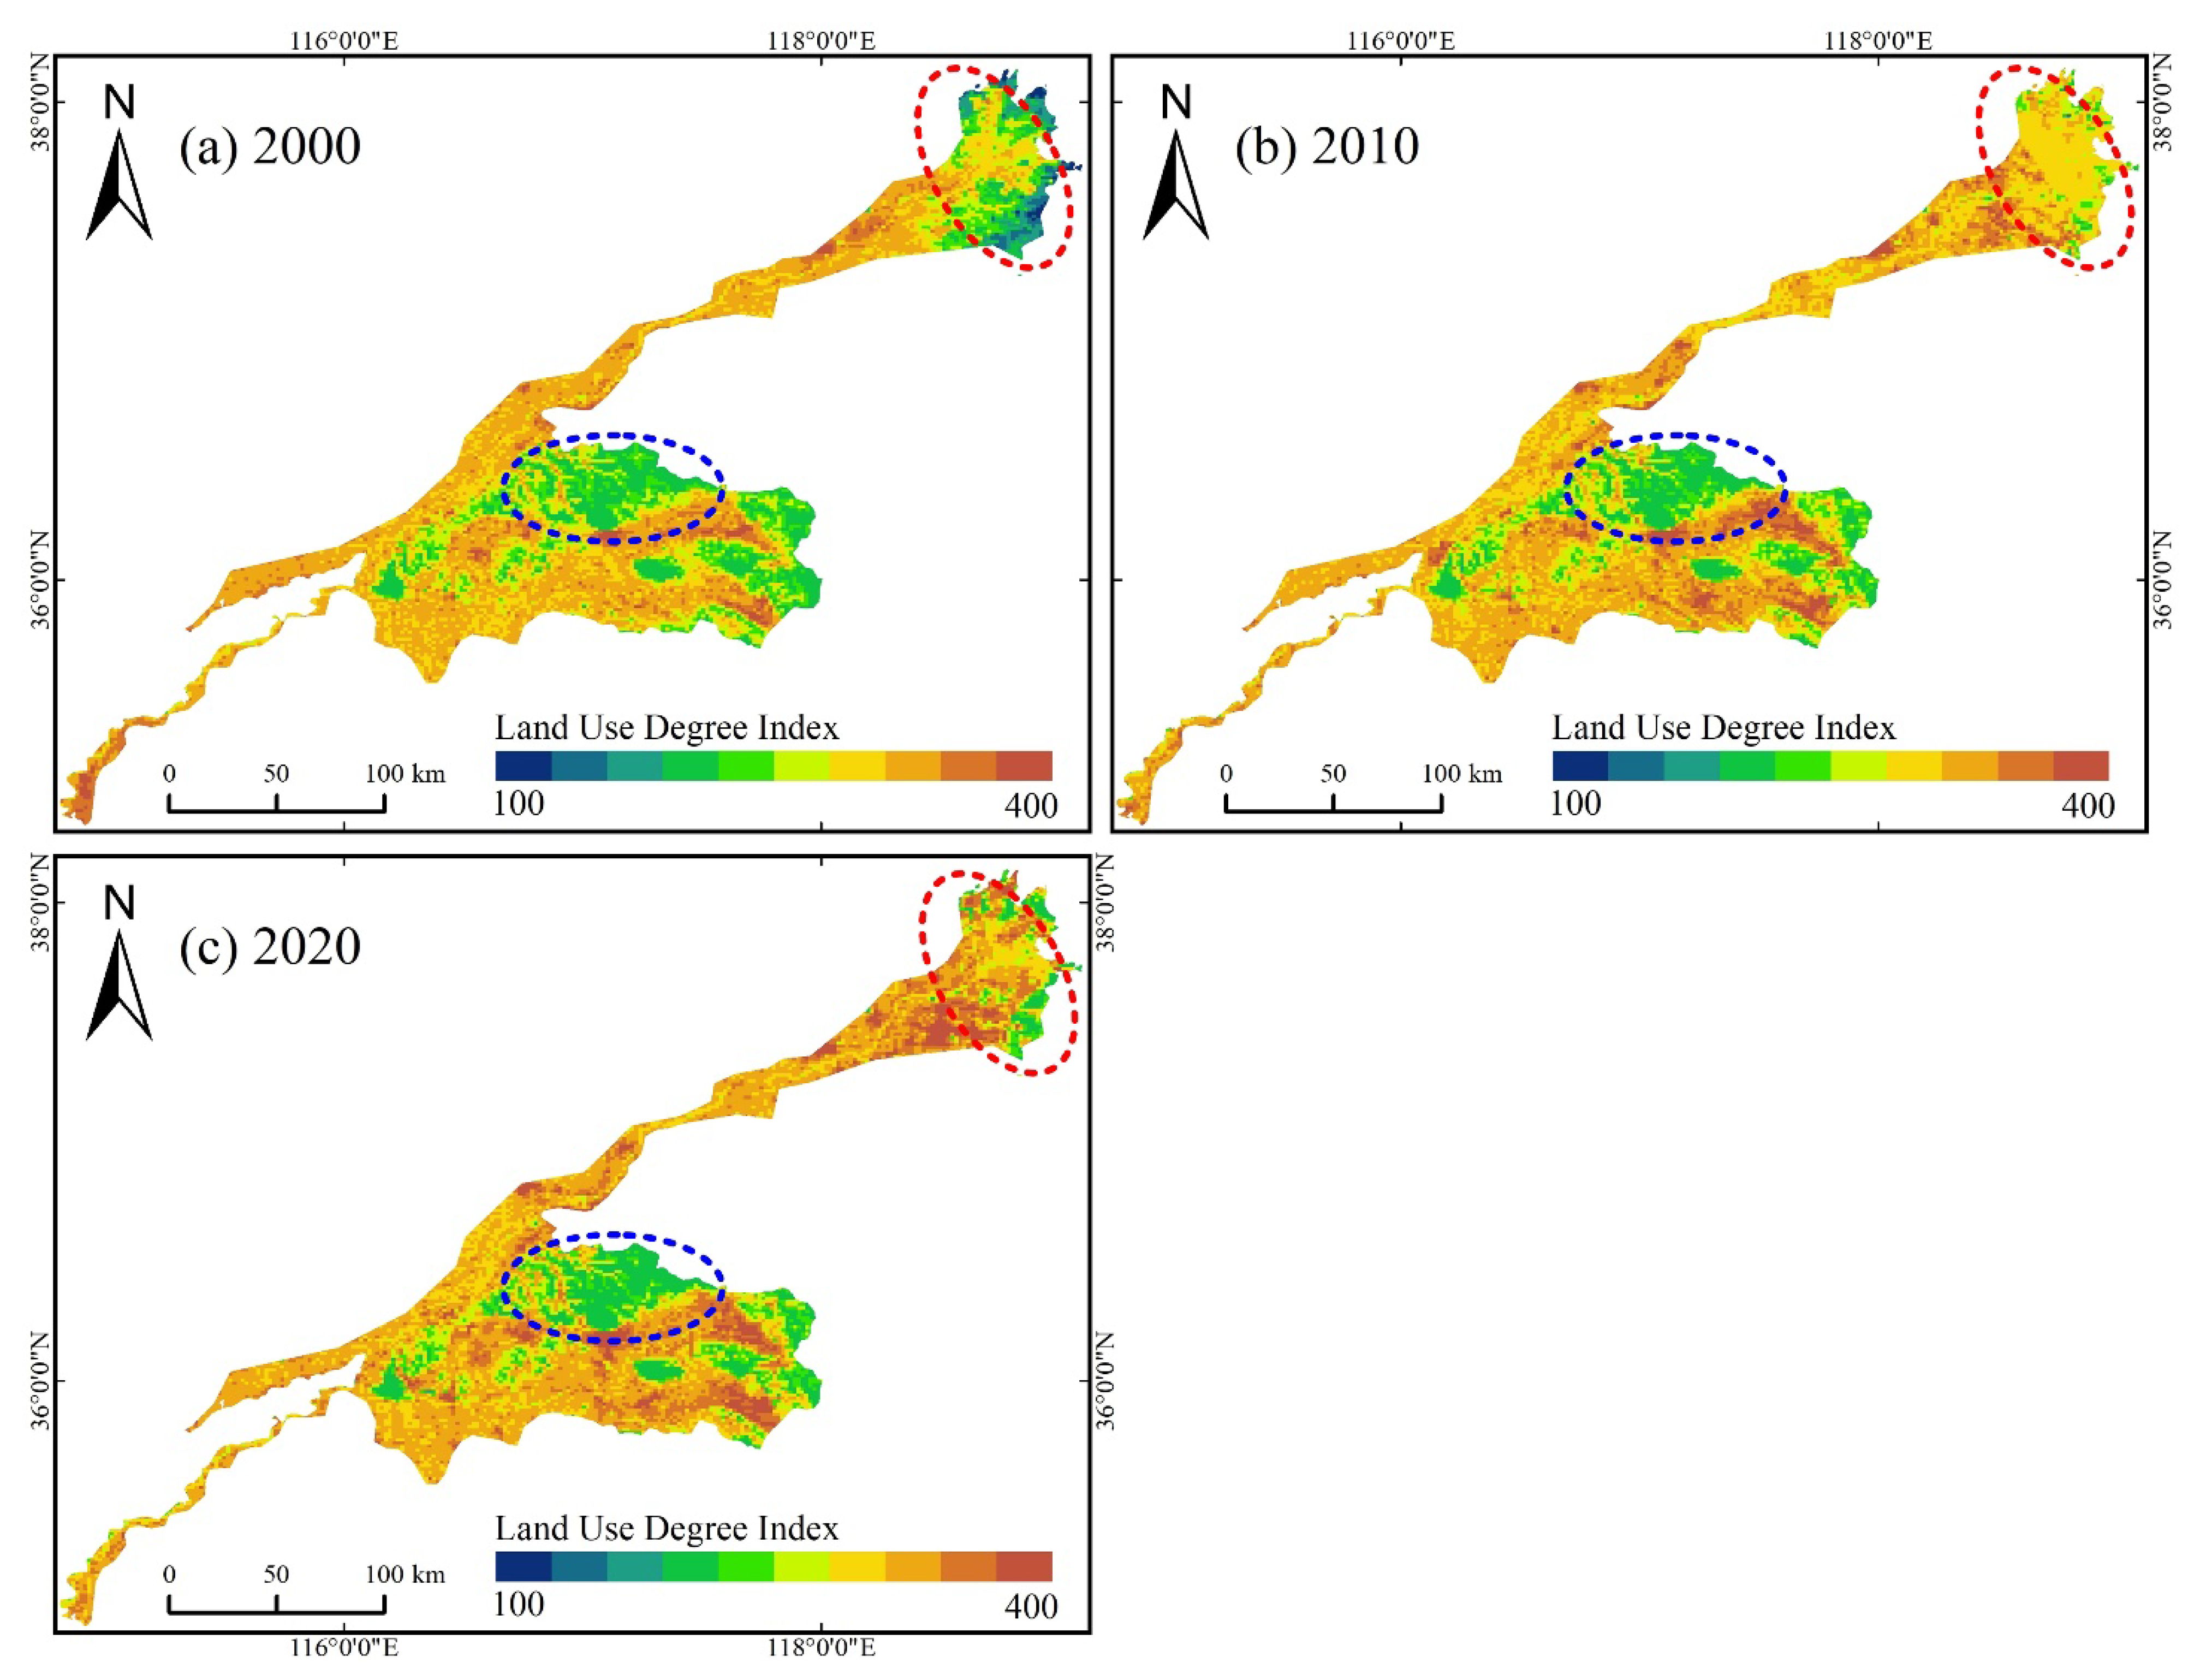
3.4. Land Use Degree Change

The degree of land use can effectively reflect the breadth and depth of land use and development. Based on the LULC data in the study area, this manuscript evaluated different land types, and comprehensively calculated the land use degree index to measure the comprehensive level of land use from 2000 to 2020. The spatial distribution map of land use degree is expressed in Figure 8 as the format of the grid in 1.5 km * 1.5 km. Results show that land-use intensity has obvious spatial differentiation. The land use intensity in plain areas is generally higher than that in hilly areas. The areas with high land use degree were mainly distributed in plain areas, which is due to the high degree of human interference, high level of land development and utilization, and the types of land use/land cover are mostly cultivated land and construction land, which is also the main reason for the improvement of land use degree in this area. The areas with low land use intensity were mainly distributed in hilly areas (shown in the blue circle in Figure 8). In hilly areas, limited by terrain, there were less human interference activities, and the land types were mainly forest land and grassland, so the land use degree in this area was low. In addition, the land use intensity in the study area gradually increased from 2000 to 2020, showing an obvious upward trend year by year, especially in the estuary area of the Yellow River, where the land use degree increased significantly under the influence of human development (shown in the red circle in Figure 8).

3.5. Analysis of Influencing Factors of LULC Change

3.5.1. Analysis of Single Factor Detection Results

The factor detector is used to analyze the explanatory power of various influencing factors on the spatial differentiation characteristics of land-use intensity in the study area. The results are shown in Table 5. The P values of all detection factors were 0, which indicates that the selected detection factors had a significant impact on the spatial differentiation characteristics of land-use intensity. It can further be used as an influencing factor to analyze its differentiation. The q value in Table 5 demonstrates that the greater the explanatory power of each influence factor on the spatial differentiation of land use intensity, the greater its value, indicating the stronger explanatory power of this influence factor on the spatial differentiation of land use intensity.
As presented in Table 5, the q values of population, temperature, and soil type gradually decreased from 2000 to 2020, indicating that the driving effect of these influencing factors decreased; the q value of elevation and slope increased greatly while the change range of other factors was relatively small. In general, the q values of elevation, slope, and soil type were large, showing that elevation, slope, and soil type have strong explanatory power on LULC change, which are the main factors affecting LULC change in the study area. In contrast, the q values of GDP and aspect were always lower than 0.1, showing that GDP and aspect have little impact on LULC change in the study area.

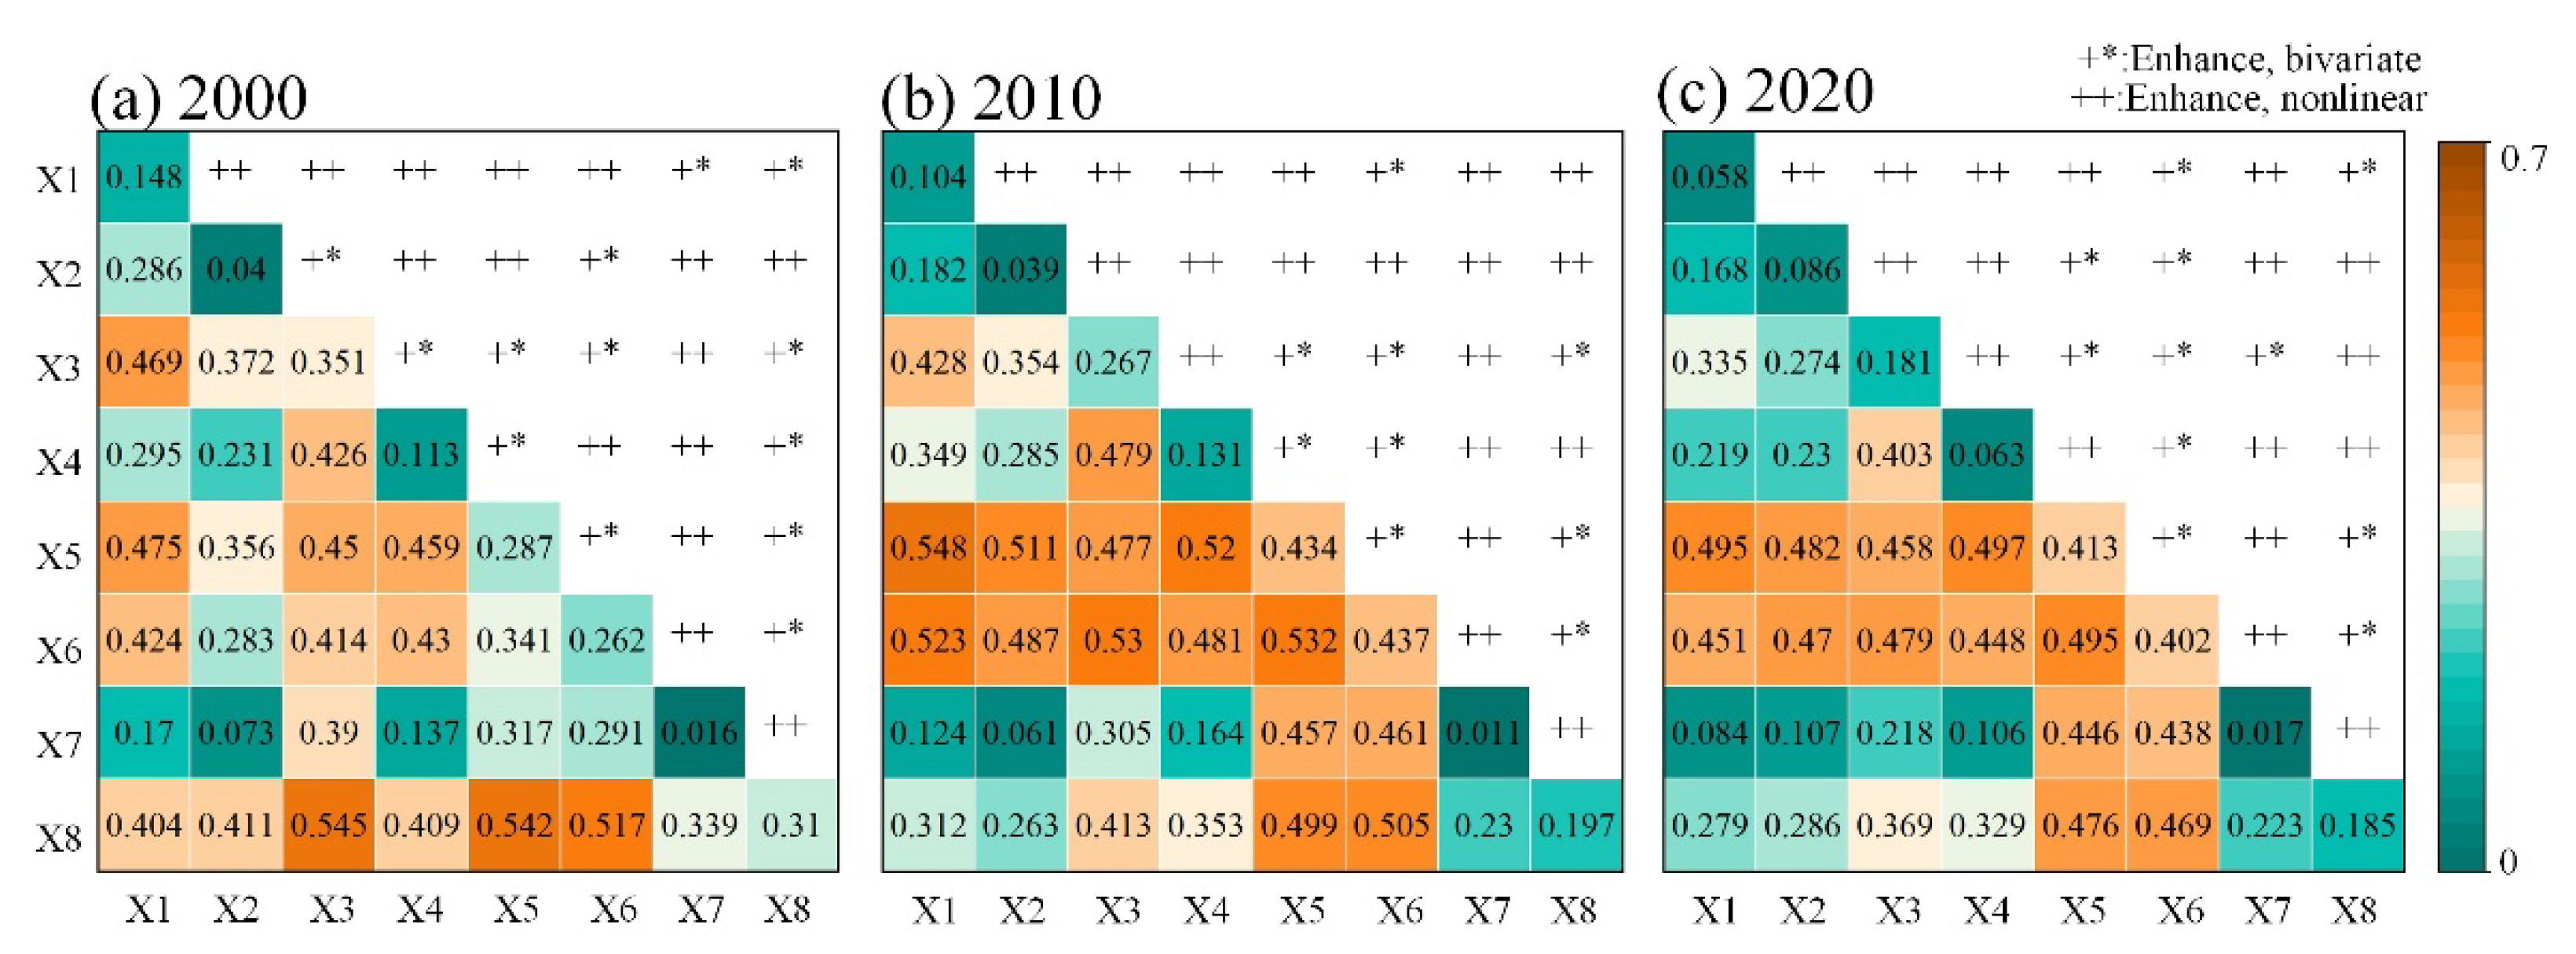
3.5.2. Analysis of Interaction between Factors

The single factor detector can analyze the influence degree of each influencing factor on the land use degree, while the interaction detector is used to identify the interaction of different influencing factors on the spatial differentiation of land use degree, and can analyze whether it will increase or weaken the explanatory power of the spatial differentiation of land use degree. As per the results presented in Figure 9, the interaction among the influencing factors had stronger explanatory power on the spatial differentiation of land use degree than that of a single factor. The types of interaction were mainly double synergy and nonlinear synergy. This shows that the spatial differentiation characteristics of land use degree are not controlled by a single factor or a single category of factors, but are jointly affected by factors such as elevation, slope, population density, temperature, precipitation, and so on. Among them, the interaction between elevation and slope, slope and soil type, altitude and soil type, and temperature and precipitation had the strongest explanatory power. Through the above analysis, it can be concluded that the spatial differentiation characteristics of LULC change are mainly affected by the interaction between elevation, slope, soil type, temperature, and precipitation. The explanatory power of precipitation in the detection of a single factor is relatively weak, but had strong explanatory power in the interaction with the temperature factor. This shows that the influence of precipitation on the spatial differentiation characteristics of LULC change can be effectively displayed under the joint action of the temperature factor.

4. Discussion

Based on the GEE cloud platform, this study used RF classification algorithm to classify the surface land use type information of the Shandong section of the Yellow River Basin from 2000 to 2020. According to the USGS survey and related literature, the overall accuracy and kappa coefficient threshold of 85% was sufficient [71], while the overall accuracy and kappa coefficient of LULC types exceeded 86% in this manuscript, indicating that the classification results were reasonable and reliable. The process and trend of land use changes over 20 years were analyzed using a three-period LULC dataset, and the LULC status changed significantly over the 20 years in the study area; in particular, with rapid urban expansion, the area of built-up land has increased rapidly from 19.42% to 29.77%. The pattern of the LULC change has a significant impact on the study area, leading to a continuous increase in the degree of land use.
LULC change is the result of multiple factors, and this manuscript quantitatively analyzed the driving forces of social and natural factors on LULC change based on geographic probes and found that topography-related factors such as elevation and slope are the main driving factors affecting LULC change in the study area. The topography-related factors contributed the most to LULC change, which may be because the area belongs to the farming area and the plains have mostly been cultivated historically, while the hilly areas are mostly forested and grassland, so the topography factors have significant influencing factors on the LULC classification results. Some research results have likewise shown that topography was also found to have a significant effect on LULC classification [60,72]. This manuscript not only illustrated the intensity of each factor’s influence on LULC change from the single factor aspect, but also further explored the mechanism of LULC change from the perspective of factor interaction, which makes up for the shortcomings of conventional methods that cannot explain the influence mechanism of interaction, and eliminates the influence of covariance among factors, which is of practical significance for a comprehensive understanding of the process of LULC change.
In this manuscript, the GEE cloud platform could quickly and accurately realize the land use classification in the study area and effectively solve the problems of a large amount of data processing and complex workflow in the process of land use classification in a large area. The pixel oriented RF classification method used in this manuscript realizes LULC classification in the study area. The overall accuracy and kappa coefficient of the classification results meet the requirements, but there is no object-oriented thinking in this method, which will produce some salt and pepper noise [73]. Therefore, this method still has some room for improvement in the land use classification method in the study area. The focus of future research should be on the fusion of image segmentation and feature matching.
In addition, based on the factor detection and interactive detection in the geographic detector, the driving factors of LULC change were quantitatively attributed. By analyzing the results of factor detection and interactive detection, it was found that natural factors such as altitude and slope have a huge impact on land use change. LULC change is closely related to the local natural environment and policy documents. In this manuscript, the richness and diversity of selected index factors need to be improved. In future research, it is also necessary to further consult relevant policy documents and relevant materials to enrich the impact factors of the index system to analyze the causes of LULC change more finely and comprehensively.

5. Conclusions

Based on the GEE cloud platform, this manuscript used the RF method to classify the land use in the Shandong section of the Yellow River Basin, obtained the multi temporal land use type distribution map of the study area, then calculated the transfer matrix to analyze the land use change, before finally introducing the geological detector to analyze the potential driving mechanism of land use change of land use intensity in the study area. The results show that from 2000 to 2020, the land type in the study area was mainly cultivated land, followed by construction land, forest land, and grassland. There was a phenomenon of the degradation of cultivated land and grassland, while the area of construction land and forest land increased, and the proportion of water body and unused land basically remained unchanged. From the perspective of land type transfer, it was found that cultivated land was mainly converted to construction land and grassland was mostly converted to forest land. From the analysis of land use intensity, the areas with high land use intensity in the study area were mainly distributed in plain areas, and the main land types were cultivated land and construction land, while the areas with low land use intensity were mainly distributed in hilly areas, and the land types were mainly grassland and forest land. In addition, this manuscript analyzed the influencing factors of land use change through two methods: factor detector and interactive detector. The results showed that altitude, slope, and soil type were the main influencing factors of land use change. By analyzing the land use change and driving factors in the Shandong section of the Yellow River Basin, this manuscript further revealed the law of land use change and the internal mechanism of the region, provides data support for ecological environment governance, and helps the local government to take corresponding measures to realize regional rational planning as well as coordinated and sustainable development of social economy and environment.
In this manuscript, the computing power of the GEE cloud platform was fully utilized to realize the LULC classification in the study area, which provides a working paradigm for large-scale, complex, and diverse feature classification research. However, only using optical remote sensing satellites to carry out LULC classification research still has some shortcomings such as an imperfect classification system and insufficient ground sample points. In future research, we will combine multi-source remote sensing data to give full play to the combination advantages of different data sources. Moreover, more diverse and sufficient ground sample points would be established to improve the remote sensing monitoring accuracy of regional LULC change.

Author Contributions

Conceptualization, Jian Cui and Mingshui Zhu; Methodology, Jian Cui.; Validation, Jian Cui, Yong Liang, and Guangjiu Qin; Formal analysis, Jian Cui; Investigation, Yong Liang; Resources, Jian Li; Data curation, Yong Liang; Writing—original draft preparation, Mingshui Zhu; Writing—review and editing, Yaohui Liu and Jian Cui; Visualization, Mingshui Zhu; Supervision, Yaohui Liu; Project administration, Yaohui Liu and Jian Cui; Funding acquisition, Yong Liang. All authors have read and agreed to the published version of the manuscript.

Funding

This research was funded by the MOE Layout Foundation of Humanities and Social Sciences (grant number 17YJAZH013), the Natural Science Foundation of Shandong Province (grant number ZR2021QD074), the Hebei Key Laboratory of Earthquake Dynamics (grant number FZ212203), and the Open Research Fund of National Earth Observation Data Center (grant number NODAOP2020008).

Data Availability Statement

Not applicable.

Conflicts of Interest

The authors declare no conflict of interest.

References

  1. Pflugmacher, D.; Rabe, A.; Peters, M.; Hostert, P. Mapping pan-European land cover using Landsat spectral-temporal metrics and the European LUCAS survey. Remote Sens. Environ. 2019, 221, 583–595. [Google Scholar] [CrossRef]
  2. Liu, J.Y.; Kuang, W.H.; Zhang, Z.X.; Xu, X.L.; Qin, Y.W.; Ning, J.; Zhou, W.C.; Zhang, S.W.; Li, R.D.; Yan, C.Z.; et al. Spatiotemporal characteristics, patterns, and causes of land-use changes in China since the late 1980s. J. Geogr. Sci. 2014, 24, 195–210. [Google Scholar] [CrossRef]
  3. Moran, E.; Ojima, D.S.; Buchmann, B.; Canadell, J.G.; Coomes, O.; Graumlich, L.; Jackson, R.; Jaramillo, V.; Lavorel, S.; Leadley, P.; et al. Global Land Project: Science Plan and Implementation Strategy; IGBP: Stockholm, Sweden, 2005. [Google Scholar]
  4. Turner, B.L.I.; Skole, D.L.; Sanderson, S.; Fischer, G.; Fresco, L.; Leemans, R. Land-Use and Land-Cover Change. Science/Research Plan; IGBP: Stockholm, Sweden, 1995. [Google Scholar]
  5. Zhang, Z.X.; Wang, X.Y.; Wen, Q.K.; Zhao, X.L.; Liu, F.; Zuo, L.J.; Hu, S.G.; Xu, J.Y.; Yi, L.; Liu, B. Research progress of remote sensing application in land resources. J. Remote Sens. 2016, 20, 1243–1258. [Google Scholar] [CrossRef]
  6. Jones, K.R.; Venter, O.; Fuller, R.A.; Allan, J.R.; Maxwell, S.L.; Negret, P.J.; Watson, J.E.M. One-third of global protected land is under intense human pressure. Science 2018, 360, 788–791. [Google Scholar] [CrossRef] [Green Version]
  7. Homer, C.; Dewitz, J.; Jin, S.M.; Xian, G.; Costello, C.; Danielson, P.; Gass, L.; Funk, M.; Wickham, J.; Stehman, S.; et al. Conterminous United States land cover change patterns 2001–2016 from the 2016 National Land Cover Database. ISPRS J. Photogramm. Remote Sens. 2020, 162, 184–199. [Google Scholar] [CrossRef]
  8. Nguyen, L.H.; Joshi, D.R.; Clay, D.E.; Henebry, G.M. Characterizing land cover/land use from multiple years of Landsat and MODIS time series: A novel approach using land surface phenology modeling and random forest classifier. Remote Sens. Environ. 2020, 238, 111017. [Google Scholar] [CrossRef]
  9. Zhao, Z.M.; Meng, Y.; Yue, A.Z.; Huang, Q.Q.; Kong, Y.L.; Yuan, Y.; Liu, X.Y.; Lin, L.; Zhang, M.M. Review of remotely sensed time series data for change detection. J. Remote Sens. 2016, 20, 1110–1125. [Google Scholar] [CrossRef]
  10. Loveland, T.R.; Reed, B.C.; Brown, J.F.; Ohlen, D.O.; Zhu, Z.; Yang, L.; Merchant, J.W. Development of a global land cover characteristics database and IGBP DISCover from 1 km AVHRR data. Int. J. Remote Sens. 2010, 21, 1303–1330. [Google Scholar] [CrossRef]
  11. Stefanski, J.; Chaskovskyy, O.; Waske, B. Mapping and monitoring of land use changes in post-Soviet western Ukraine using remote sensing data. Appl. Geogr. 2014, 55, 155–164. [Google Scholar] [CrossRef]
  12. Souza, C.M.; Shimbo, J.Z.; Rosa, M.R.; Parente, L.L.; Alencar, A.; Rudorff, B.F.T.; Hasenack, H.; Matsumoto, M.; Ferreira, L.G.; Souza-Filho, P.W.M.; et al. Reconstructing Three Decades of Land Use and Land Cover Changes in Brazilian Biomes with Landsat Archive and Earth Engine. Remote Sens. 2020, 12, 2735. [Google Scholar] [CrossRef]
  13. Abdullah, A.Y.M.; Masrur, A.; Adnan, M.S.G.; Baky, M.A.A.; Hassan, Q.K.; Dewan, A. Spatio-temporal Patterns of Land Use/Land Cover Change in the Heterogeneous Coastal Region of Bangladesh between 1990 and 2017. Remote Sens. 2019, 11, 790. [Google Scholar] [CrossRef] [Green Version]
  14. Gorelick, N.; Hancher, M.; Dixon, M.; Ilyushchenko, S.; Thau, D.; Moore, R. Google Earth Engine: Planetary-scale geospatial analysis for everyone. Remote Sens. Environ. 2017, 202, 18–27. [Google Scholar] [CrossRef]
  15. Kumar, L.; Mutanga, O. Google Earth Engine Applications Since Inception: Usage, Trends, and Potential. Remote Sens. 2018, 10, 1509. [Google Scholar] [CrossRef] [Green Version]
  16. Fu, D.J.; Xiao, H.; Su, F.Z.; Zhou, C.H.; Dong, J.W.; Zeng, Y.L.; Yan, K.; Li, S.W.; Wu, J.; Wu, W.Z.; et al. Remote sensing cloud computing platform development and Earth science application. Natl. Remote Sens. Bull. 2021, 25, 220–230. [Google Scholar] [CrossRef]
  17. Hu, Y.F.; Dong, Y.; Batunacun. An automatic approach for land-change detection and land updates based on integrated NDVI timing analysis and the CVAPS method with GEE support. ISPRS J. Photogramm. Remote Sens. 2018, 146, 347–359. [Google Scholar] [CrossRef]
  18. Huang, H.B.; Chen, Y.L.; Clinton, N.; Wang, J.; Wang, X.Y.; Liu, C.X.; Gong, P.; Yang, J.; Bai, Y.Q.; Zheng, Y.M.; et al. Mapping major land cover dynamics in Beijing using all Landsat images in Google Earth Engine. Remote Sens. Environ. 2017, 202, 166–176. [Google Scholar] [CrossRef]
  19. Mao, L.J.; Li, M.S. Integrating Sentinel Active and Passive Data to Map Land Cover in a National Park from GEE Platform. Geomat. Inf. Sci. Wuhan Univ. 2021. [Google Scholar] [CrossRef]
  20. Li, J.W.; Knapp, D.E.; Lyons, M.; Roelfsema, C.; Phinn, S.; Schill, S.R.; Asner, G.P. Automated Global Shallow Water Bathymetry Mapping Using Google Earth Engine. Remote Sens. 2021, 13, 1469. [Google Scholar] [CrossRef]
  21. Wang, Y.D.; Li, Z.W.; Zeng, C.; Xia, G.S.; Shen, H.F. An Urban Water Extraction Method Combining Deep Learning and Google Earth Engine. IEEE J. Sel. Top. Appl. Earth Obs. Remote Sens. 2020, 13, 769–782. [Google Scholar] [CrossRef]
  22. Ermida, S.L.; Soares, P.; Mantas, V.; Göttsche, F.-M.; Trigo, I.F. Google Earth Engine Open-Source Code for Land Surface Temperature Estimation from the Landsat Series. Remote Sens. 2020, 12, 1471. [Google Scholar] [CrossRef]
  23. Jia, H.W.; Yan, C.Z.; Xing, X.G. Evaluation of Eco-Environmental Quality in Qaidam Basin Based on the Ecological Index (MRSEI) and GEE. Remote Sens. 2021, 13, 4543. [Google Scholar] [CrossRef]
  24. Xiong, Y.; Xu, W.W.; Lu, N.; Huang, S.D.; Wu, C.; Wang, L.G.; Dai, F.; Kou, W.L. Assessment of spatial–temporal changes of ecological environment quality based on RSEI and GEE: A case study in Erhai Lake Basin, Yunnan province, China. Ecol. Indic. 2021, 125, 107518. [Google Scholar] [CrossRef]
  25. Dong, J.; Xiao, X.; Menarguez, M.A.; Zhang, G.; Qin, Y.; Thau, D.; Biradar, C.; Moore, B. Mapping paddy rice planting area in northeastern Asia with Landsat 8 images, phenology-based algorithm and Google Earth Engine. Remote Sens. Environ. 2016, 185, 142–154. [Google Scholar] [CrossRef] [Green Version]
  26. Xiong, J.; Thenkabail, P.S.; Gumma, M.K.; Teluguntla, P.; Poehnelt, J.; Congalton, R.G.; Yadav, K.; Thau, D. Automated cropland mapping of continental Africa using Google Earth Engine cloud computing. ISPRS J. Photogramm. Remote Sens. 2017, 126, 225–244. [Google Scholar] [CrossRef] [Green Version]
  27. Belay, T.; Mengistu, D.A. Land use and land cover dynamics and drivers in the Muga watershed, Upper Blue Nile basin, Ethiopia. Remote Sens. Appl. Soc. Environ. 2019, 15, 100249. [Google Scholar] [CrossRef]
  28. Li, K.; Feng, M.; Biswas, A.; Su, H.; Niu, Y.; Cao, J. Driving Factors and Future Prediction of Land Use and Cover Change Based on Satellite Remote Sensing Data by the LCM Model: A Case Study from Gansu Province, China. Sensors 2020, 20, 2757. [Google Scholar] [CrossRef]
  29. Bekele, B.; Wu, W.; Yirsaw, E. Drivers of Land Use-Land Cover Changes in the Central Rift Valley of Ethiopia. Sains Malays. 2019, 48, 1333–1345. [Google Scholar] [CrossRef]
  30. Berihun, M.L.; Tsunekawa, A.; Haregeweyn, N.; Meshesha, D.T.; Adgo, E.; Tsubo, M.; Masunaga, T.; Fenta, A.A.; Sultan, D.; Yibeltal, M. Exploring land use/land cover changes, drivers and their implications in contrasting agro-ecological environments of Ethiopia. Land Use Policy 2019, 87, 104052. [Google Scholar] [CrossRef]
  31. Fan, H.; Chen, S.; Li, Z.; Liu, P.; Xu, C.; Yang, X. Assessment of heavy metals in water, sediment and shellfish organisms in typical areas of the Yangtze River Estuary, China. Mar. Pollut. Bull. 2019, 151, 110864. [Google Scholar] [CrossRef]
  32. Wang, J.F.; Xu, C.D. Geodetector: Principle and prospective. Acta Geogr. Sin. 2017, 72, 116–134. [Google Scholar] [CrossRef]
  33. Chen, L.; Wang, X.L.; Cai, X.B.; Yang, C.; Lu, X.R. Seasonal Variations of Daytime Land Surface Temperature and Their Underlying Drivers over Wuhan, China. Remote Sens. 2021, 13, 323. [Google Scholar] [CrossRef]
  34. Han, J.J.; Wang, J.P.; Chen, L.; Xiang, J.Y.; Ling, Z.Y.; Li, Q.K.; Wang, E.L. Driving factors of desertification in Qaidam Basin, China: An 18-year analysis using the geographic detector model. Ecol. Indic. 2021, 124, 107404. [Google Scholar] [CrossRef]
  35. Nie, T.; Dong, G.T.; Jiang, X.H.; Lei, Y.X. Spatio-Temporal Changes and Driving Forces of Vegetation Coverage on the Loess Plateau of Northern Shaanxi. Remote Sens. 2021, 13, 613. [Google Scholar] [CrossRef]
  36. Peng, W.F.; Kuang, T.T.; Tao, S. Quantifying influences of natural factors on vegetation NDVI changes based on geographical detector in Sichuan, western China. J. Clean. Prod. 2019, 233, 353–367. [Google Scholar] [CrossRef]
  37. Zhang, J.; Yu, L.; Li, X.C.; Zhang, C.C.; Shi, T.Z.; Wu, X.Y.; Yang, C.; Gao, W.X.; Li, Q.Q.; Wu, G.F. Exploring Annual Urban Expansions in the Guangdong-Hong Kong-Macau Greater Bay Area: Spatiotemporal Features and Driving Factors in 1986–2017. Remote Sens. 2020, 12, 2615. [Google Scholar] [CrossRef]
  38. Li, J.; Yan, X.G.; Yan, X.X.; Guo, W.; Wang, K.W.; Qiao, J. Temporal and spatial variation characteristic of vegetation coverage in the Yellow River Basin based on GEE cloud platform. J. China Coal Soc. 2021, 46, 1439–1450. [Google Scholar] [CrossRef]
  39. Ji, Q.L.; Liang, W.; Fu, B.J.; Zhang, W.B.; Yan, J.W.; Lü, Y.H.; Yue, C.; Jin, Z.; Lan, Z.Y.; Li, S.Y.; et al. Mapping Land Use/Cover Dynamics of the Yellow River Basin from 1986 to 2018 Supported by Google Earth Engine. Remote Sens. 2021, 13, 1299. [Google Scholar] [CrossRef]
  40. Chen, Z.H.; Zhang, Q.X.; Li, F.; Shi, J.L. Comprehensive Evaluation of Land Use Benefit in the Yellow River Basin from 1995 to 2018. Land 2021, 10, 643. [Google Scholar] [CrossRef]
  41. Yang, J.; Xie, B.P.; Zhang, D.G.; Tao, W.Q. Climate and land use change impacts on water yield ecosystem service in the Yellow River Basin, China. Environ. Earth Sci. 2021, 80, 72. [Google Scholar] [CrossRef]
  42. Khan, S.U.; Cui, Y.; Khan, A.A.; Ali, M.A.S.; Khan, A.; Xia, X.; Liu, G.; Zhao, M. Tracking sustainable development efficiency with human-environmental system relationship: An application of DPSIR and super efficiency SBM model. Sci. Total Environ. 2021, 783, 146959. [Google Scholar] [CrossRef]
  43. Pettorelli, N.; Ryan, S.; Mueller, T.; Bunnefeld, N.; Jedrzejewska, B.; Lima, M.; Kausrud, K. The Normalized Difference Vegetation Index (NDVI): Unforeseen successes in animal ecology. Clim. Res. 2011, 46, 15–27. [Google Scholar] [CrossRef]
  44. Guo, G.H.; Wu, Z.F.; Xiao, R.B.; Chen, Y.B.; Liu, X.N.; Zhang, X.S. Impacts of urban biophysical composition on land surface temperature in urban heat island clusters. Landsc. Urban Plan. 2015, 135, 1–10. [Google Scholar] [CrossRef]
  45. Adam, E.; Mutanga, O.; Abdel-Rahman, E.M.; Ismail, R. Estimating standing biomass in papyrus (Cyperus papyrus L.) swamp: Exploratory of in situ hyperspectral indices and random forest regression. Int. J. Remote Sens. 2014, 35, 693–714. [Google Scholar] [CrossRef]
  46. Houborg, R.; McCabe, M.F. A hybrid training approach for leaf area index estimation via Cubist and random forests machine-learning. ISPRS J. Photogramm. Remote Sens. 2018, 135, 173–188. [Google Scholar] [CrossRef]
  47. Chen, B.Q.; Xiao, X.M.; Li, X.P.; Pan, L.H.; Doughty, R.; Ma, J.; Dong, J.W.; Qin, Y.; Zhao, B.; Wu, Z.; et al. A mangrove forest map of China in 2015: Analysis of time series Landsat 7/8 and Sentinel-1A imagery in Google Earth Engine cloud computing platform. ISPRS J. Photogramm. Remote Sens. 2017, 131, 104–120. [Google Scholar] [CrossRef]
  48. Wang, F.; Yuan, X.Z.; Xie, X.P. Dynamic change of land use/land cover patterns and driving factors of Nansihu Lake Basin in Shandong Province, China. Environ. Earth Sci. 2021, 80, 180. [Google Scholar] [CrossRef]
  49. Zhang, P.Y.; Geng, W.L.; Yang, D.; Li, Y.Y.; Zhang, Y.; Qin, M.Z. Spatial-temporal evolution of land use and ecosystem service value in the Lower Reaches of the Yellow River Region. Trans. Chin. Soc. Agric. Eng. 2020, 36, 277–288. [Google Scholar] [CrossRef]
  50. Tassi, A.; Gigante, D.; Modica, G.; Di Martino, L.; Vizzari, M. Pixel- vs. Object-Based Landsat 8 Data Classification in Google Earth Engine Using Random Forest: The Case Study of Maiella National Park. Remote Sens. 2021, 13, 2299. [Google Scholar] [CrossRef]
  51. Breiman, L. Random Forests. Mach. Learn. 2001, 45, 5–32. [Google Scholar] [CrossRef] [Green Version]
  52. Paul, A.; Mukherjee, D.P.; Das, P.; Gangopadhyay, A.; Chintha, A.R.; Kundu, S. Improved Random Forest for Classification. IEEE Trans. Image Process. 2018, 27, 4012–4024. [Google Scholar] [CrossRef]
  53. Wu, Q.; Zhong, R.f.; Zhao, W.j.; Song, K.; Du, L.m. Land-cover classification using GF-2 images and airborne lidar data based on Random Forest. Int. J. Remote Sens. 2018, 40, 2410–2426. [Google Scholar] [CrossRef]
  54. Belgiu, M.; Drăguţ, L. Random forest in remote sensing: A review of applications and future directions. ISPRS J. Photogramm. Remote Sens. 2016, 114, 24–31. [Google Scholar] [CrossRef]
  55. Ghorbanian, A.; Zaghian, S.; Asiyabi, R.M.; Amani, M.; Mohammadzadeh, A.; Jamali, S. Mangrove Ecosystem Mapping Using Sentinel-1 and Sentinel-2 Satellite Images and Random Forest Algorithm in Google Earth Engine. Remote Sens. 2021, 13, 2565. [Google Scholar] [CrossRef]
  56. Liu, C.T.; Feng, Q.L.; Jin, D.J.; Shi, T.G.; Liu, J.T.; Zhu, M.S. Application of random forest and Sentinel-1/2 in the information extraction of impervious layers in Dongying City. Remote Sens. Nat. Resour. 2021, 33, 253–261. [Google Scholar]
  57. Zhang, D.D.; Zhang, L. Land Cover Change in the Central Region of the Lower Yangtze River Based on Landsat Imagery and the Google Earth Engine: A Case Study in Nanjing, China. Sensors 2020, 20, 2091. [Google Scholar] [CrossRef] [Green Version]
  58. Yang, Y.P.; Yang, D.; Wang, X.F.; Zhang, Z.; Nawaz, Z. Testing Accuracy of Land Cover Classification Algorithms in the Qilian Mountains Based on GEE Cloud Platform. Remote Sens. 2021, 13, 5064. [Google Scholar] [CrossRef]
  59. Phan, T.N.; Kuch, V.; Lehnert, L.W. Land Cover Classification using Google Earth Engine and Random Forest Classifier—The Role of Image Composition. Remote Sens. 2020, 12, 2411. [Google Scholar] [CrossRef]
  60. Liu, C.L.; Li, W.L.; Zhu, G.F.; Zhou, H.K.; Yan, H.P.; Xue, P.F. Land Use/Land Cover Changes and Their Driving Factors in the Northeastern Tibetan Plateau Based on Geographical Detectors and Google Earth Engine: A Case Study in Gannan Prefecture. Remote Sens. 2020, 12, 3139. [Google Scholar] [CrossRef]
  61. Guo, L.; Chehata, N.; Mallet, C.; Boukir, S. Relevance of airborne lidar and multispectral image data for urban scene classification using Random Forests. ISPRS J. Photogramm. Remote Sens. 2011, 66, 56–66. [Google Scholar] [CrossRef]
  62. Zhuang, D.F.; Liu, J.Y. Study on the model of regional differentiation of land use degree in China. J. Nat. Resour. 1997, 12, 105–111. [Google Scholar]
  63. Wu, L.N.; Yang, S.T.; Liu, X.Y.; Luo, Y.; Zhou, X.; Zhao, H.H. Response analysis of land use change to the degree of human activities in Beiluo River basin since 1976. Acta Geogr. Sin. 2014, 69, 54–63. [Google Scholar] [CrossRef]
  64. Wang, J.F.; Hu, Y. Environmental health risk detection with GeogDetector. Environ. Model. Softw. 2012, 33, 114–115. [Google Scholar] [CrossRef]
  65. Zhang, R.T.; Lu, J.F. Multiscale spatiotemporal characteristics and influencing factors of intensive cultivated land use in Yangtze River Economic Belt. Trans. Chin. Soc. Agric. Eng. 2019, 35, 271–278. [Google Scholar] [CrossRef]
  66. Wang, H.Y.; Qin, F.; Xu, C.D.; Li, B.; Guo, L.P.; Wang, Z. Evaluating the suitability of urban development land with a Geodetector. Ecol. Indic. 2021, 123, 107339. [Google Scholar] [CrossRef]
  67. Su, Y.; Li, T.X.; Cheng, S.K.; Wang, X. Spatial distribution exploration and driving factor identification for soil salinisation based on geodetector models in coastal area. Ecol. Eng. 2020, 156, 105961. [Google Scholar] [CrossRef]
  68. Liu, C.L.; Li, W.L.; Wang, W.Y.; Zhou, H.K.; Liang, T.G.; Hou, F.J.; Xu, J.; Xue, P.F. Quantitative spatial analysis of vegetation dynamics and potential driving factors in a typical alpine region on the northeastern Tibetan Plateau using the Google Earth Engine. Catena 2021, 206, 105500. [Google Scholar] [CrossRef]
  69. Zhu, L.J.; Meng, J.J.; Zhu, L.K. Applying Geodetector to disentangle the contributions of natural and anthropogenic factors to NDVI variations in the middle reaches of the Heihe River Basin. Ecol. Indic. 2020, 117, 106545. [Google Scholar] [CrossRef]
  70. Xu, X.L.; Liu, J.Y.; Zhang, S.W.; Li, R.D.; Yan, C.Z.; Wu, S.X. China land use and land cover change database (CNLUCC). Resour. Environ. Sci. Data Cent. 2018. [Google Scholar] [CrossRef]
  71. Gashaw, T.; Tulu, T.; Argaw, M.; Worqlul, A.W.; Tolessa, T.; Kindu, M. Estimating the impacts of land use/land cover changes on Ecosystem Service Values: The case of the Andassa watershed in the Upper Blue Nile basin of Ethiopia. Ecosyst. Serv. 2018, 31, 219–228. [Google Scholar] [CrossRef]
  72. Hoshikawa, K.; Umezaki, M. Effects of terrain-induced shade removal using global DEM data sets on land-cover classification. Int. J. Remote Sens. 2014, 35, 1331–1355. [Google Scholar] [CrossRef]
  73. Singha, M.; Wu, B.F.; Zhang, M. An Object-Based Paddy Rice Classification Using Multi-Spectral Data and Crop Phenology in Assam, Northeast India. Remote Sens. 2016, 8, 479. [Google Scholar] [CrossRef] [Green Version]
Figure 1. Geographical location and topography of the study area.
Ijgi 11 00163 g001
Figure 2. Impact factor spatial distribution map. (a) The spatial distribution of population density; (b) the spatial distribution of GDP; (c) the spatial distribution of mean annual temperature; (d) the spatial distribution of precipitation; (e) the spatial distribution of elevation; (f) the spatial distribution of slope; (g) the spatial distribution of aspect; (h) the spatial distribution of soil type.
Ijgi 11 00163 g002
Figure 3. The flowchart of this research.
Ijgi 11 00163 g003
Figure 4. Three typical image subsets (AC) with their classification results.
Ijgi 11 00163 g004
Figure 5. Spatial distribution map of LULC in the study area from 2000 to 2020, (a) 2000; (b) 2010; (c) 2020.
Ijgi 11 00163 g005
Figure 6. Area changes of each land use/land cover type, (a) Framland, (b) Forest land, (c) Grassland, (d) Water body, (e) Construction land, (f) Unused land.
Ijgi 11 00163 g006
Figure 7. Transfer map of LULC types in the study area, (a) transfer map of LULC types from 2000 to 2010, (b) transfer map of LULC types from 2010 to 2020.
Ijgi 11 00163 g007
Figure 8. Spatial distribution map of land use degree index in the study area from 2000 to 2020. (a) Spatial distribution map of land use degree index in 2000; (b) Spatial distribution map of land use degree index in 2010; (c) Spatial distribution map of land use degree index in 2020.
Ijgi 11 00163 g008
Figure 9. Results of the interaction detection, (a) 2000, (b) 2010, (c) 2020.
Ijgi 11 00163 g009
Table 1. Factors influencing the LULC changes.
Factors TypesCodeIndex
Social factorsX1Population density
X2Gross domestic product
Natural factorsX3Temperature
X4Precipitation
X5Elevation
X6Slope
X7Aspect
X8Soil type
Table 2. Land resource use types and grades.
Type of LandUncultivated LandEcological LandAgricultural LandConstruction Land
LULC typesUnused land (sand and bare land)Forest land, grassland, wetland, and water bodyFarmlandUrban, residential area, traffic land, and industrial land
Index of Classification1234
Table 3. The patterns of interaction detector.
Judgment CriteriaInteraction
q(x1x2) < Min(q(x1), q(x2))Weaken, nonlinear
Min(q(x1),q(x2)) < q(x1x2) < Max(q(x1), q(x2))Weaken, univariate
q(x1x2) > Max(q(x1), q(x2))Enhance, bivariate
q(x1x2) = q(x1) + q(x2)Independent
q(x1x2) > q(x1) + q(x2)Enhance, nonlinear
Table 4. The patterns of interaction detector.
LULC Types200020102020
PUA (%)PPA (%)PUA (%)PPA (%)PUA (%)PPA (%)
Farmland90.2389.5692.5690.4891.1790.29
Forestland78.2382.3380.6583.9584.2384.33
Grassland82.6486.6682.3483.5683.4584.45
Water body90.5389.6392.1388.3492.4590.36
Construction land89.5688.6389.6392.3489.5688.63
Unused land76.3377.3577.9281.2382.6585.34
POA (%)87.4588.0689.85
Kappa coefficient0.860.880.89
Table 5. The patterns of interaction detector.
Year X1X2X3X4X5X6X7X8
2000q0.1480.0400.3510.1130.2870.2620.0160.310
p00000000
Sequence57163482
2010q0.1040.0390.2670.1310.4340.4370.0110.197
p00000000
Sequence67352184
2020q0.0580.0860.1810.0630.4130.4020.0170.185
p00000000
Sequence75461283
Publisher’s Note: MDPI stays neutral with regard to jurisdictional claims in published maps and institutional affiliations.

