

Topological Access Methods for Spatial and Spatiotemporal Data

Abstract
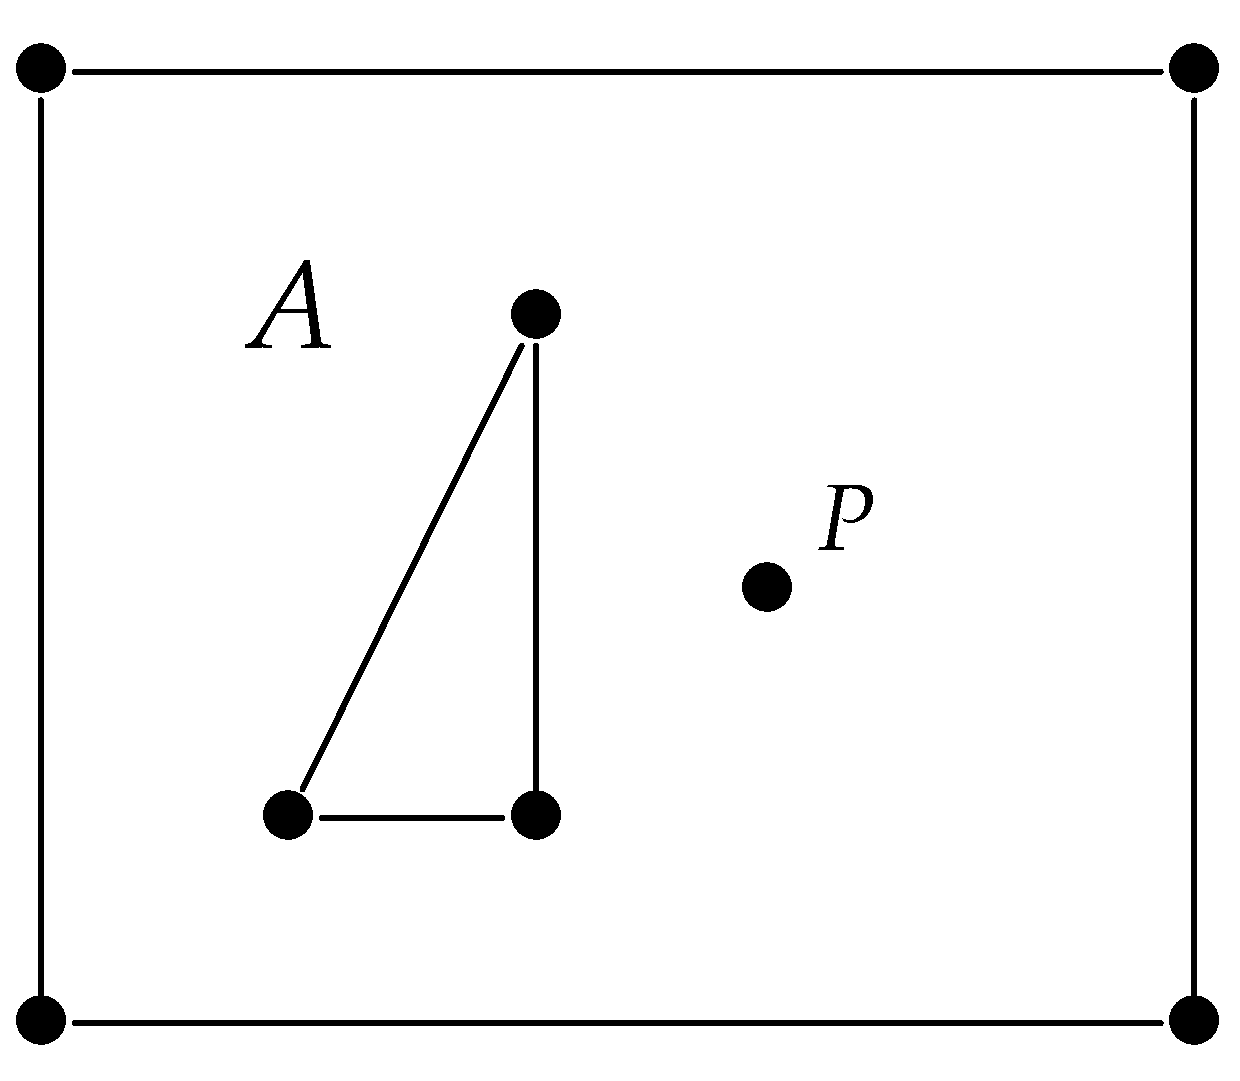
:1. Introduction
- 1
- Create a SAM for each BREP point of solid A.
- 2
- For each boundary triangle b of solid B, use the SAM to retrieve all BREP points C of A which intersect the bounding box of b.
- 3
- For each BREP point c of C, check if b contains c (true: add to the result set).
- 4
- Repeat the last steps to find all BREP points of solid B, respectively.
- The use of topological invariants (here: Euler characteristic) in the initial data validation (pre)process.
- The development of a topological access method (TOAM) for more efficiently querying nodes with topological properties.
- An experimental test of this approach on a small city model.
2. Related Work
2.1. Graph Model
3. Methodology
3.1. Access Method
3.2. Topology Encoding
4. Experiments
- 1
- Zero: .
- 2
- CityGML tree nodes: 22386.
- 3
- Number of groups: 56.
- 4
- Polygons: 925.
- 5
- Distinct polygons: 924.
- 6
- Decimal places: 15.
- 7
- Min. point distance [m]: 6.216820473225959E-6.
- 8
- Segments: 4446.
- 9
- Min. length [m]: 3.0517578125E-5.
- 10
- Average length [m]: 5.0552051851945565.
- 11
- Max. length [m]: 32.06260853268529.
- 1
- TONode ID.
- 2
- TONode dimension.
- 3
- TONode aggregation level.
- 4
- Relation count.
- 5
- Relation count of SPECIALISATION_OF.
- 6
- Relation count of GENERALISATION_OF.
- 7
- Relation count of PART_OF.
- 8
- Relation count of COMPOSITE_OF.
- 9
- Relation count of BORDER_OF.
- 10
- Relation count of INNER_OF.
- 11
- Distance to root.
- 12
- Distance to root by SPECIALISATION_OF.
- 13
- Distance to root by GENERALISATION_OF.
- 14
- Distance to root by PART_OF.
- 15
- Distance to root by COMPOSITE_OF.
- 16
- Distance to root by BORDER_OF.
- 17
- Distance to root by INNER_OF.
- 18
- Accumulated distances.
- 19
- Accumulated distances by SPECIALISATION_OF.
- 20
- Accumulated distances by GENERALISATION_OF.
- 21
- Accumulated distances by PART_OF.
- 22
- Accumulated distances by COMPOSITE_OF.
- 23
- Accumulated distances by BORDER_OF.
- 24
- Accumulated distances by INNER_OF.
5. Discussion
6. Conclusions
Author Contributions
Funding
Data Availability Statement
Acknowledgments
Conflicts of Interest
References
- Giovanella, A.; Bradley, P.; Wursthorn, S. Detection and Evaluation of Topological Consistency in CityGML Datasets. ISPRS Ann. Photogramm. Remote Sens. Spat. Inf. Sci. 2018, IV-4, 59–66. [Google Scholar] [CrossRef] [Green Version]
- Alexandrov, P. Diskrete Räume. Mat. Sb. (N. S.) 1937, 2, 501–518. [Google Scholar]
- Bradley, P.; Paul, N. Using the relational model to capture topological information of spaces. Comput. J. 2010, 53, 69–89. [Google Scholar] [CrossRef]
- Jahn, M.; Bradley, P. Computing watertight volumetric models from boundary representations to ensure consistent topological operations. ISPRS Ann. Photogramm. Remote Sens. Spat. Inf. Sci. 2021, VIII-4/W2-2021, 21–28. [Google Scholar] [CrossRef]
- Meagher, D. Octree Encoding: A New Technique for the Representation, Manipulation and Display of Arbitrary 3-D Objects by Computer; Technical Report IPL-TR-80-111; Rensselaer Polytechnic Institute: Troy, NY, USA, 1980. [Google Scholar]
- Guttman, A. R-Trees: A Dynamic Index Structure for Spatial Searching. In Proceedings of the 1984 ACM SIGMOD International Conference on Management of Data–SIGMOD ’84, Boston, MA, USA, 18–21 June 1984. [Google Scholar]
- Beckmann, N.; Kriegel, H.; Schneider, R.; Seeger, B. The R*-tree: An efficient and robust access method for points and rectangles. In Proceedings of the 1990 ACM SIGMOD International Conference on Management of Data-SIGMOD ’90, Atlantic City, NJ, USA, 23–25 May 1990. [Google Scholar]
- Jahn, M.; Kuper, P.; Breunig, M. Efficient Spatio-Temporal Modelling to Enable Topological Analysis. ISPRS Ann. Photogramm. Remote Sens. Spat. Inf. Sci. 2022; accepted for publication. [Google Scholar] [CrossRef]
- Kolbe, T. Representing and Exchanging 3D City Models with CityGML. In 3D Geo-Information Sciences; Lee, J., Zlatanova, S., Eds.; Lecture Notes in Geoinformation and Cartography; Springer: Berlin/Heidelberg, Germany, 2009. [Google Scholar]
- Li, L.; Luo, F.; Zhua, H.; Ying, S.; Zhao, Z. A two-level topological model for 3D features in CityGML. Comput. Environ. Urban Syst. 2016, 59, 11–24. [Google Scholar] [CrossRef]
- Salleh, S.; Ujang, U. Topological information extraction from buildings in CityGML. IOP Conf. Ser. Earth Environ. Sci. 2018, 169, 012088. [Google Scholar] [CrossRef]
- Salleh, S.; Ujang, U.; Azri, S.; Choon, T. Spatial Adjacency Analysis of CityGML Buildings via 3D Topological Data Structure. Int. Arch. Photogramm. Remote Sens. Spat. Inf. Sci. 2019, XLII-4/W16, 573–579. [Google Scholar] [CrossRef] [Green Version]
- Sun, Q.; Zhou, X.; Hou, D. A Simplified CityGML-Based 3D Indoor Space Model for Indoor Applications. Appl. Sci. 2020, 10, 7218. [Google Scholar] [CrossRef]
- Demian, P.; Ruikar, K.; Sahu, T.; Morris, A. Three-Dimensional Information Retrieval (3DIR): Exploiting 3D Geometry and Model Topology in Information Retrieval from BIM Environments. Int. J.-Inf. Model. (IJ3DIM) 2016, 5, 67–78. [Google Scholar] [CrossRef] [Green Version]
- Jeong, W.; Son, J. An Algorithm to Translate Building Topology in Building Information Modeling into Object-Oriented Physical Modeling-Based Building Energy Modeling. Energies 2016, 9, 50. [Google Scholar] [CrossRef]
- Wu, Y.; Shang, J.; Hu, X.; Zhou, Z. Extended Maptree: A Representation of Fine-Grained Topology and Spatial Hierarchy of Bim. Int. Arch. Photogramm. Remote Sens. Spat. Inf. Sci. 2017, 42, 2/W7, 409–415. [Google Scholar] [CrossRef] [Green Version]
- Pasquale, L.; Ghezzi, C.; Pasi, E.; Tsigkanos, C.; Boubekeur, M.; Florentino-Liano, B.; Hadzic, T.; Nuseibeh, B. Topology-Aware Access Control of Smart Spaces. Computer 2017, 50, 54–63. [Google Scholar] [CrossRef] [Green Version]
- Lienhardt, P. N-Dimensional generalized combinatorial maps and cellular quasi-manifolds. Int. J. Comput. Geom. Appl. 1994, 4, 275–324. [Google Scholar] [CrossRef]
- Breunig, M.; Kuper, P.; Butwilowski, E.; Thomsen, A.; Jahn, M.; Dittrich, A.; Al-Doori, M.; Golovko, D.; Menninghaus, M. The Story of DB4GeO - A Service-Based Geo-Database Architecture to Support Multi-Dimensional Data Analysis and Visualization. ISPRS J. Photogramm. Remote Sens. 2016, 117, 187–205. [Google Scholar] [CrossRef]
- Bradley, P.; Paul, N. Comparing G-maps with other topological data structures. GeoInformatica 2014, 18, 595–620. [Google Scholar] [CrossRef]
- Worboys, M. A unified model for spatial and temporal information. Comput. J. 1994, 37, 26–34. [Google Scholar] [CrossRef] [Green Version]
- van Oosterom, P. Variable-scale topological data structures suitable for progressive data transfer: The GAP-face Tree and GAP-edge Forest. Cart.-Graphy Geogr. Inf. Sci. 2005, 32, 331–346. [Google Scholar] [CrossRef] [Green Version]
- Paul, N.; Bradley, P. Integrating Space, Time, Version, and Scale using Alexandrov Topologies. Int. J.-Inf. Model. (IJ3DIM) 2015, 4, 64–85. [Google Scholar] [CrossRef] [Green Version]
- Krämer, T.; Huhnt, W. Topological Information in Geometrical Models of Buildings; International Workshop on Computing in Civil Engineering: Austin, TX, USA, 2009. [Google Scholar]
- Fellegara, R.; De Floriani, L.; Magillo, P.; Weiss, K. Tetrahedral Trees: A Family of Hierarchical Spatial Indexes for Tetrahedral Meshes. ACM Trans. Spat. Algorithms Syst. 2020, 6, 1–34. [Google Scholar] [CrossRef]
- Jahn, M.; Bradley, P.; Al Doori, M.; Breunig, M. Topologically consistent models for efficient big geo-spatio-temporal data distribution. ISPRS Ann. Photogramm. Remote Sens. Spat. Inf. Sci. 2017, IV-4/W5, 65–72. [Google Scholar] [CrossRef]
- Dušan, J.; Branislav, B. Elements of spatial data quality as information technology support for sustainable development planning. Spatium 2004, 11, 77–83. [Google Scholar]
- Li, S. On topological consistency and realization. Constraints 2006, 11, 3151. [Google Scholar] [CrossRef]
- Kang, H.; Li, K. Assessing topological consistency for collapse operation in generalization of spatial databases. In Perspectives in Conceptual Modeling; Lecture Notes in Computer Science; Akoka, J., Ed.; Springer: Berlin/Heidelberg, Germany, 2005; Volume 3770. [Google Scholar]
- Rodriguez, M.; Brisaboa, N.; Meza, J.; Luaces, M. Measuring consistency with respect to topological dependency constraints. In Proceedings of the 18th SIGSPATIAL International Conference on Advances in Geographic Information Systems, San Jose, CA, USA, 2–5 November 2010; pp. 182–191. [Google Scholar]
- Bradley, P. Supporting Data Analytics for Smart Cities: An Overview of Data Models and Topology. In Statistical Learning and Data Sciences SLDS 2015; Gammerman, A., Vovk, V., Papadopoulos, H., Eds.; Springer: Berlin/Heidelberg, Germany, 2015; LNCS 9047; pp. 406–413. [Google Scholar] [CrossRef]
- Jahn, M.; Bradley, P. A Robustness Study for the Extraction of Watertight Volumetric Models from Boundary Representation Data. ISPRS Int. J.-Geo-Inf. 2022, 11, 224. [Google Scholar] [CrossRef]
- Bradley, P.; Jahn, M. On the Behaviour of p-Adic Scaled Space Filling Curve Indices for High-Dimensional Data. Comput. J. 2020. [Google Scholar] [CrossRef]
- Jahn, M. Distributed & Parallel Data Management to Support Geo-Scientific Simulation Implementations. Ph.D. Thesis, Karlsruhe Institute of Technology, Karlsruhe, Germany, 2022. [Google Scholar]
- Polthier, K.; Rumpf, M. A concept for time-dependent processes. In Visualization in Scientific Computing; Goebel, M., Mueller, H., Urban, B., Eds.; Springer: Vienna, Austria, 1994; pp. 137–153. [Google Scholar]
- TinkerPop Gremlin. 2022. Available online: https://tinkerpop.apache.org/gremlin.html (accessed on 18 October 2022).


| Euler | 0 | 1 | 2 | 3 |
| Count | 1 | 51 | 7 | 3 |
| Euler | 1 | 2 |
| Count | 21 | 4 |
| Euler | 3 | 4 | 6 | 7 | 8 | 12 | 15 | 19 |
| Count | 1 | 1 | 2 | 2 | 2 | 2 | 1 | 1 |
Publisher’s Note: MDPI stays neutral with regard to jurisdictional claims in published maps and institutional affiliations. |
© 2022 by the authors. Licensee MDPI, Basel, Switzerland. This article is an open access article distributed under the terms and conditions of the Creative Commons Attribution (CC BY) license (https://creativecommons.org/licenses/by/4.0/).
Share and Cite
Jahn, M.W.; Bradley, P.E. Topological Access Methods for Spatial and Spatiotemporal Data. ISPRS Int. J. Geo-Inf. 2022, 11, 533. https://doi.org/10.3390/ijgi11100533
Jahn MW, Bradley PE. Topological Access Methods for Spatial and Spatiotemporal Data. ISPRS International Journal of Geo-Information. 2022; 11(10):533. https://doi.org/10.3390/ijgi11100533
Chicago/Turabian StyleJahn, Markus Wilhelm, and Patrick Erik Bradley. 2022. "Topological Access Methods for Spatial and Spatiotemporal Data" ISPRS International Journal of Geo-Information 11, no. 10: 533. https://doi.org/10.3390/ijgi11100533