

Data-Driven Approach to Assess Street Safety: Large-Scale Analysis of the Microscopic Design
Abstract
:1. Introduction
2. Related Work
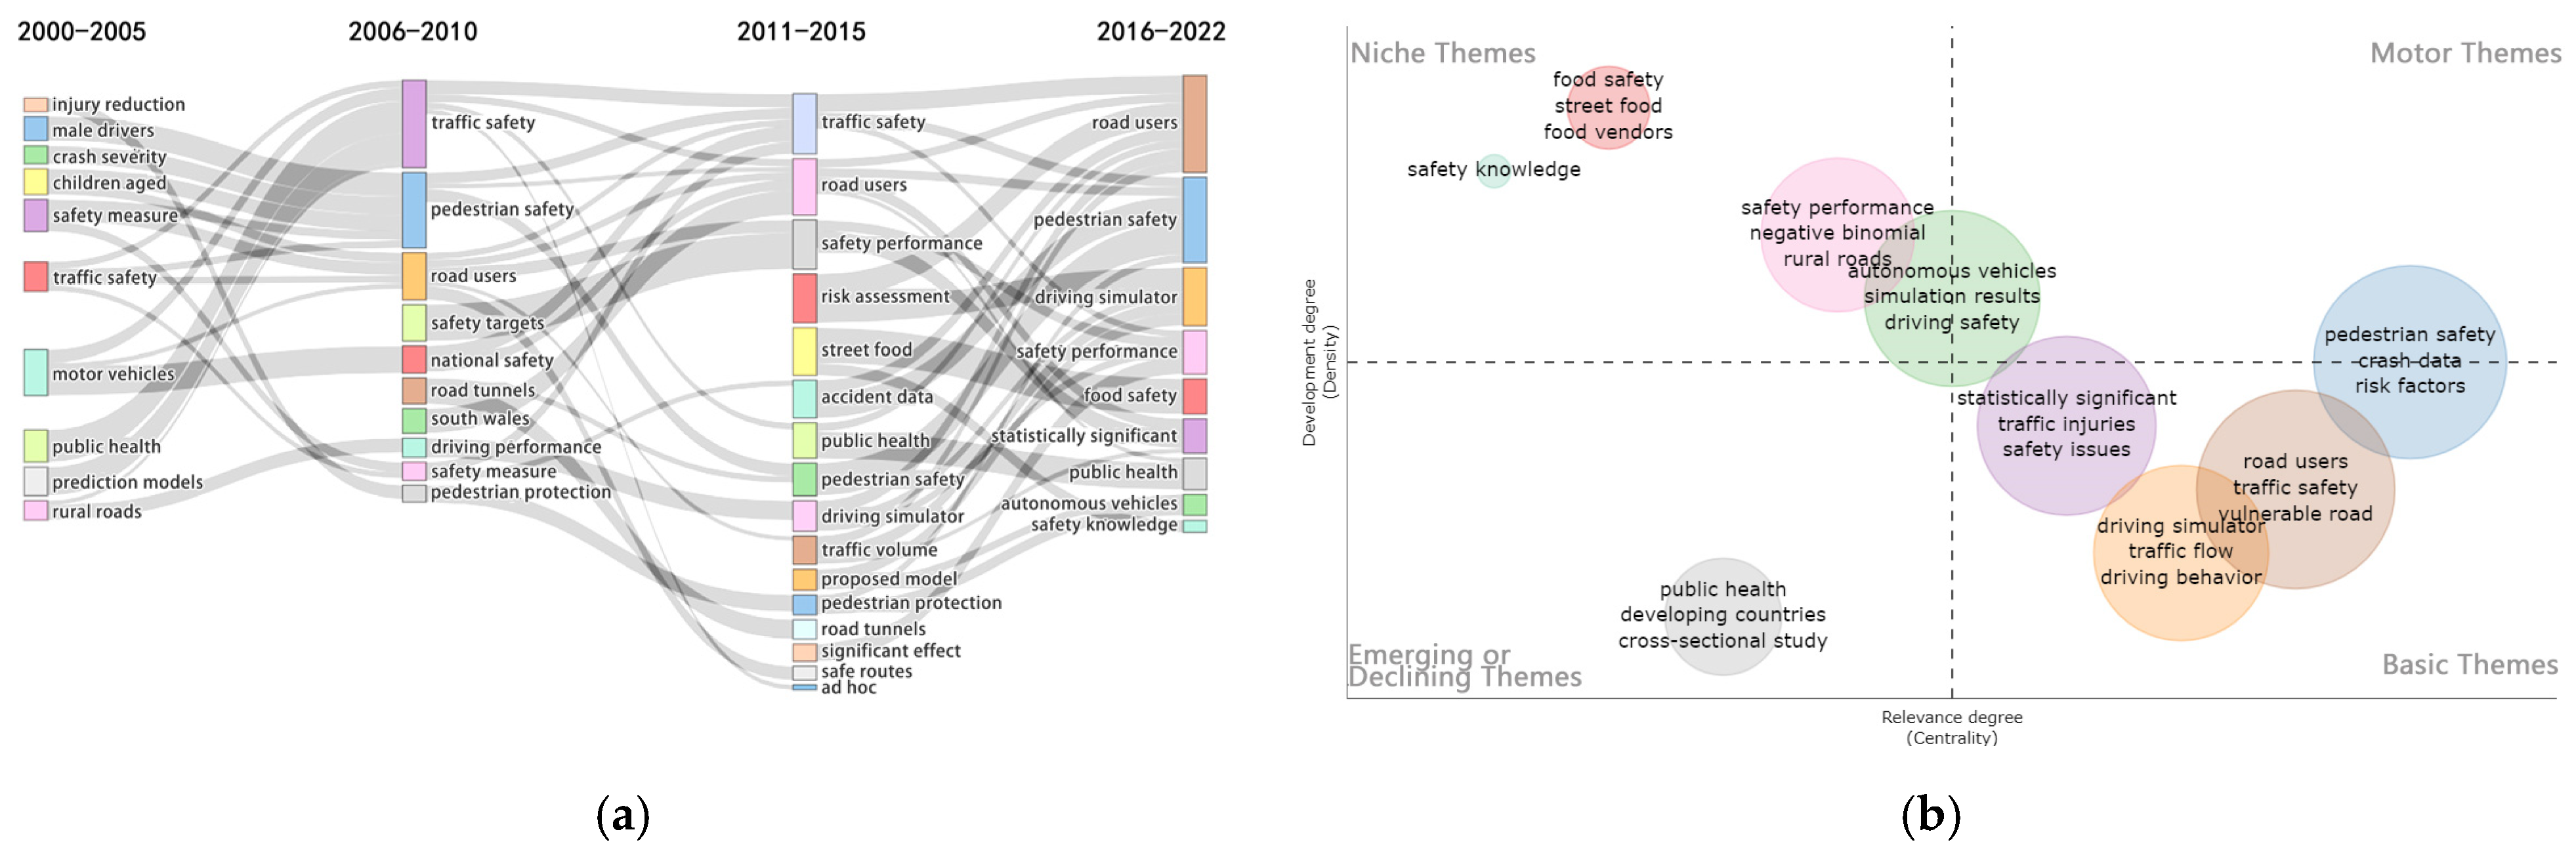
2.1. Knowledge Structure of Street Safety Research
2.1.1. Research Focus
2.1.2. Research Trend
2.2. The Meaning of Street Safety
2.3. Overview of Street Safety Assessment Methods
2.3.1. Traditional Methods of Street Safety Assessment
2.3.2. Street Safety Assessment Methods Based on New Data
3. Data and Methods
3.1. Data
3.2. Assessment Dimensions and Indicators
3.3. Indicator Weighting
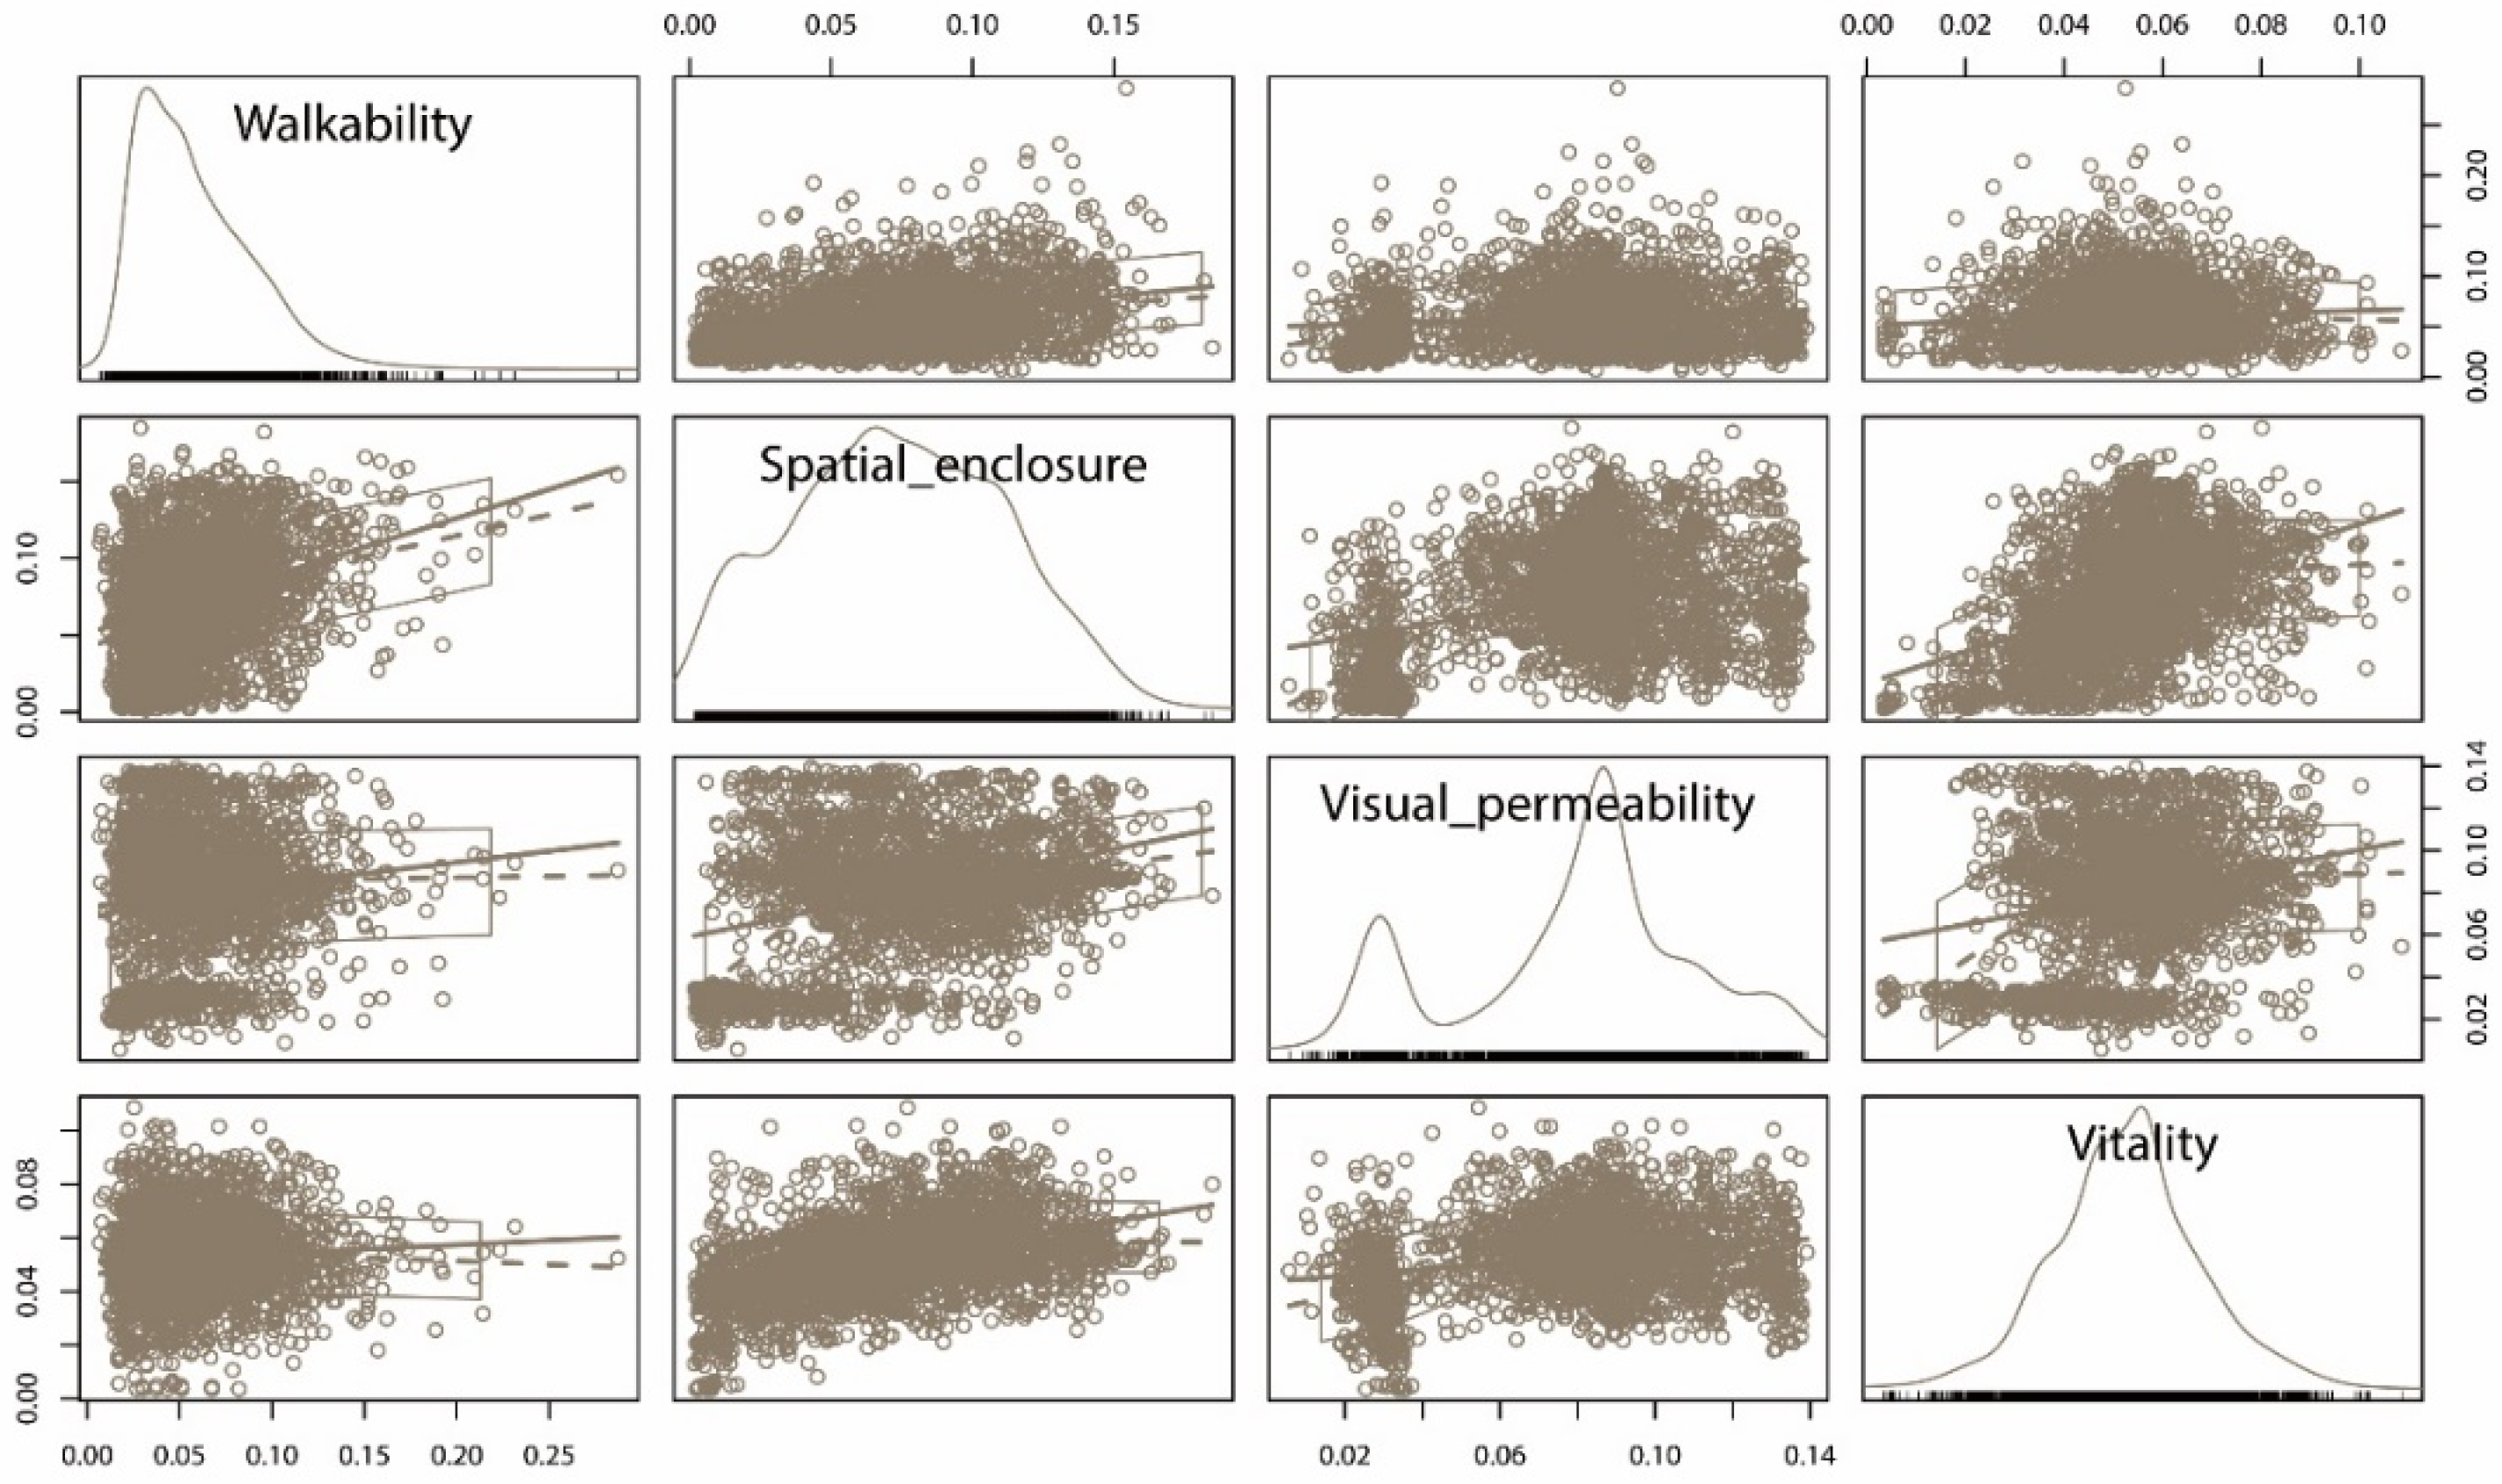
3.4. Validity Test of the Assessment System
4. Results
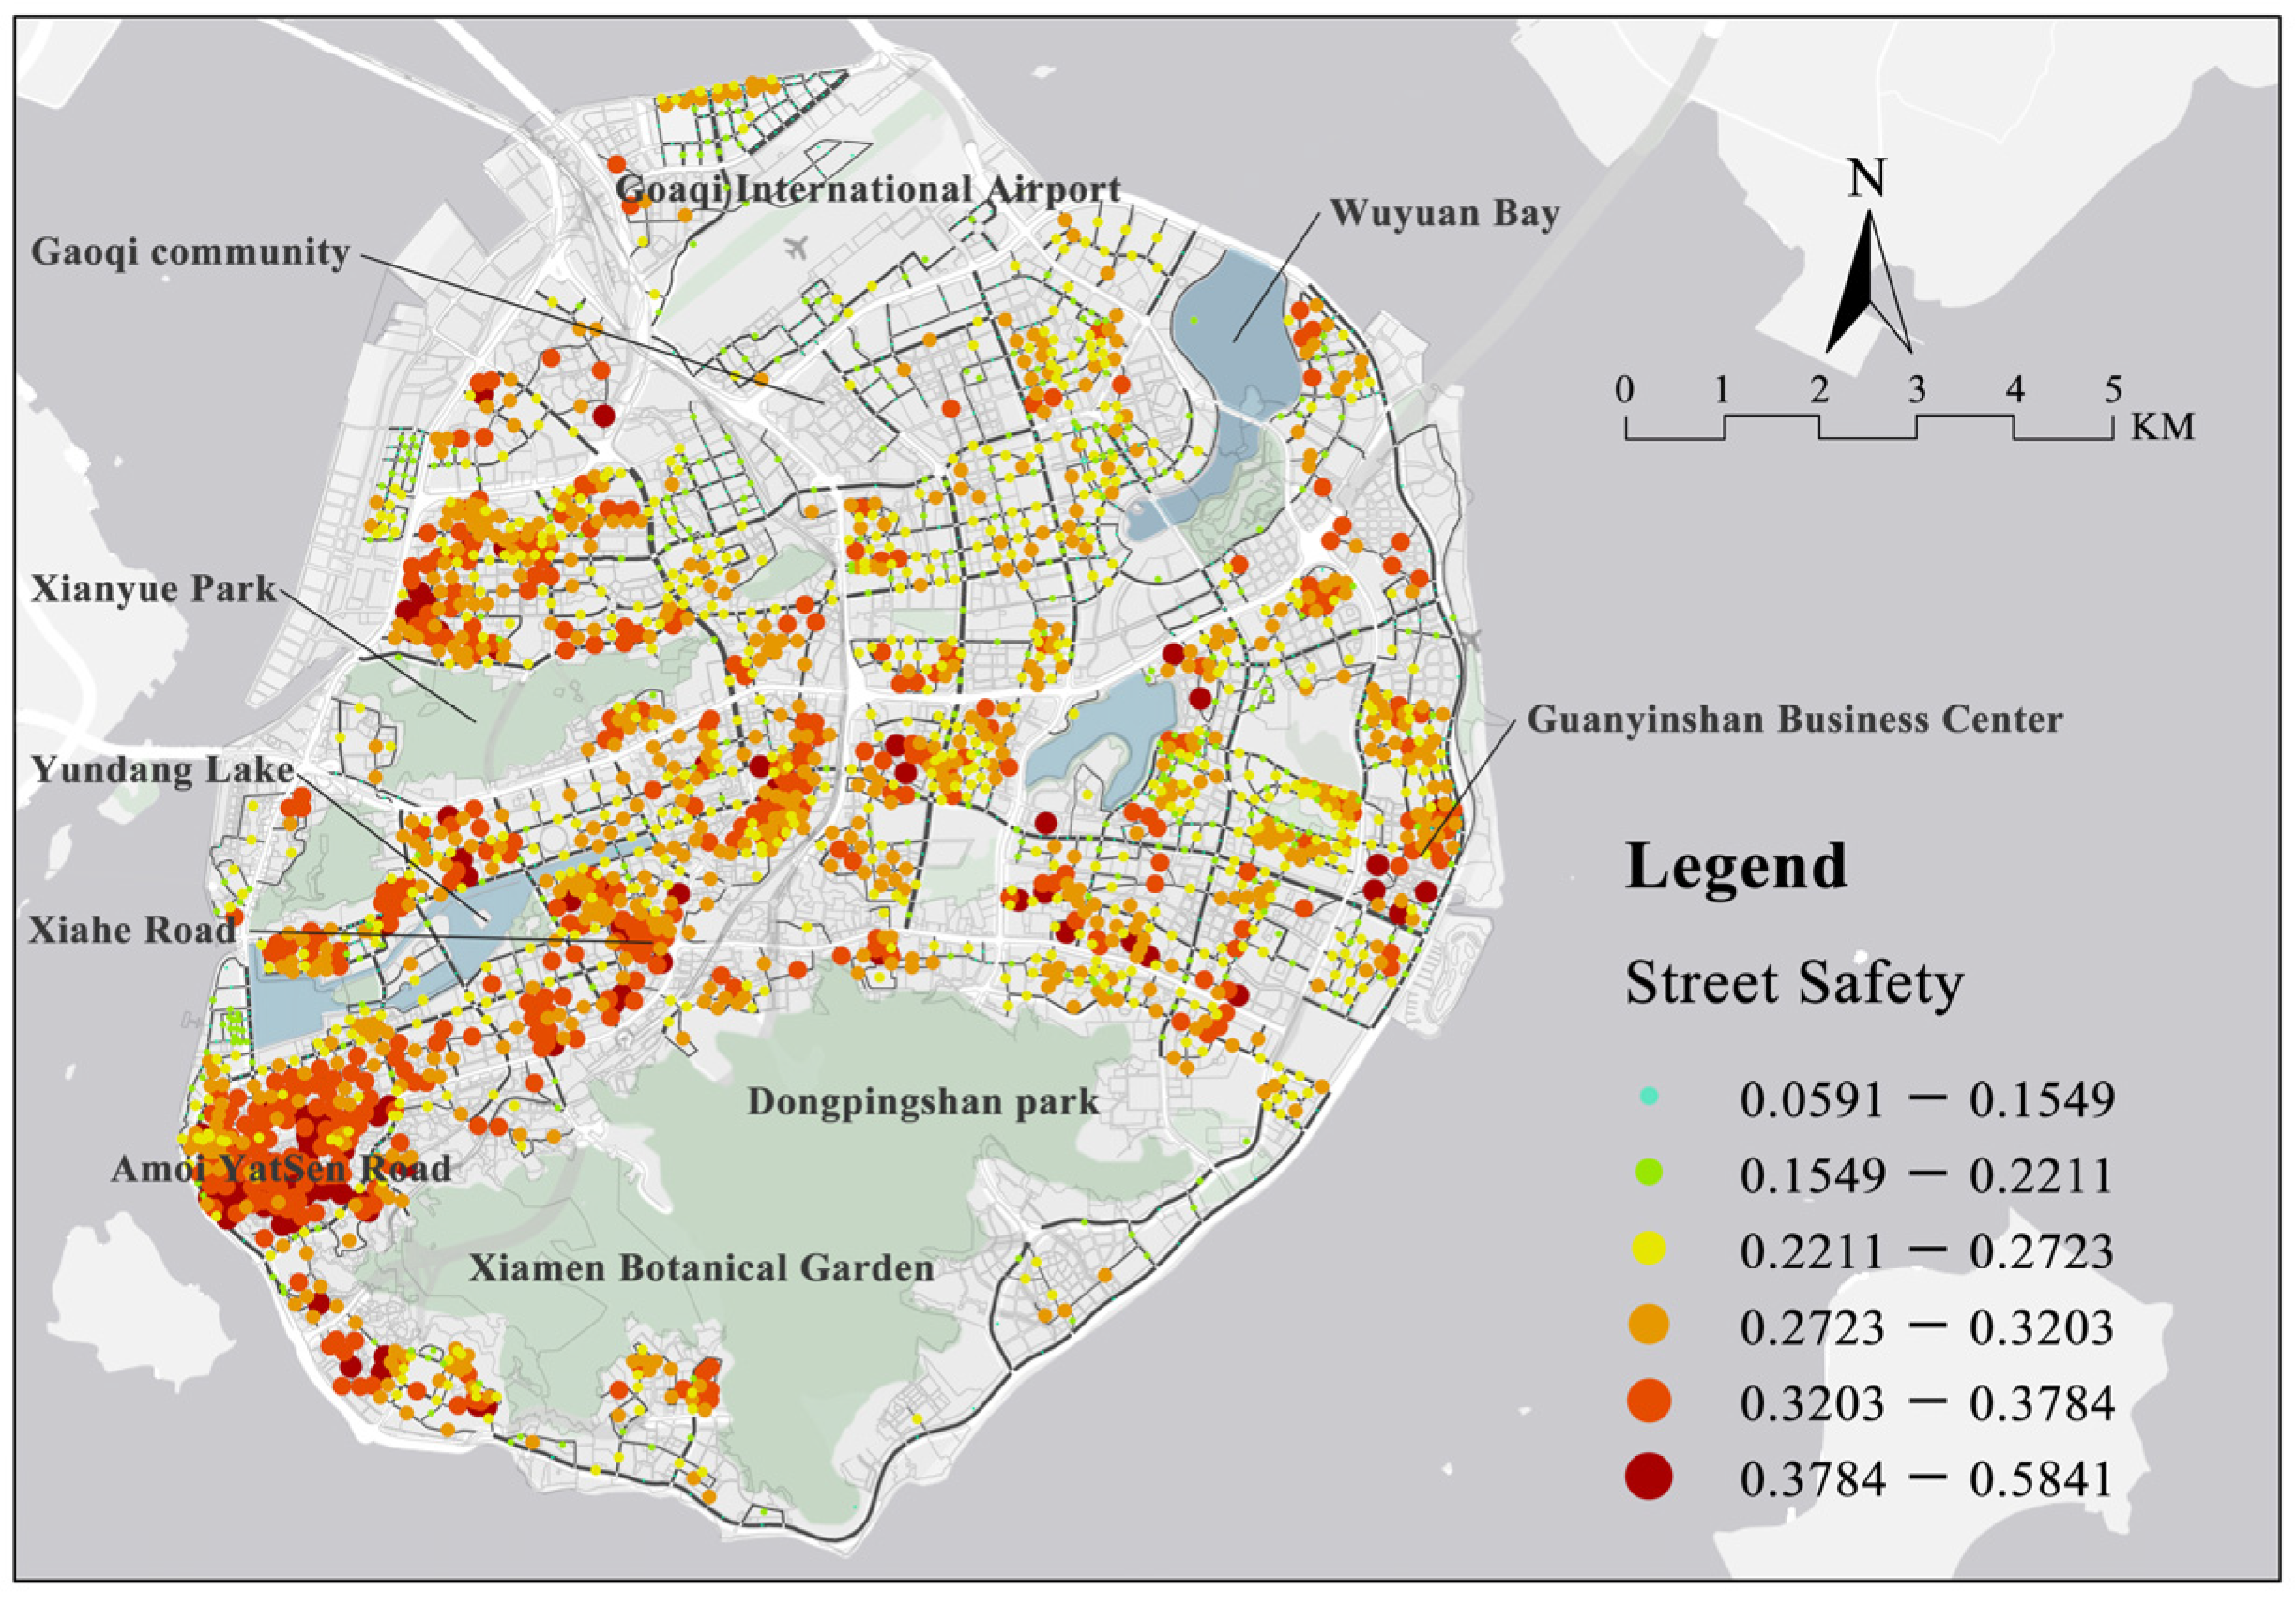
4.1. Study Area
4.2. Validity Test Results
4.3. Spatial Distribution of Street Safety
4.4. Dimensional Characteristics of Street Safety
5. Discussion
6. Conclusions
Author Contributions
Funding
Institutional Review Board Statement
Informed Consent Statement
Data Availability Statement
Acknowledgments
Conflicts of Interest
References
- Xu, L.; Jiang, W.; Chen, Z. Study on perceived safety in public spaces: Take perception of street view in Shanghai as an example. Landsc. Archit. 2018, 25, 23–29. [Google Scholar]
- Molnar, B.E.; Gortmaker, S.L.; Bull, F.C.; Buka, S.L. Unsafe to play? Neighborhood disorder and lack of safety predict reduced physical activity among urban children and adolescents. Am. J. Health Promot. 2004, 18, 378–386. [Google Scholar] [CrossRef]
- Baum, F.; Palmer, C. ‘Opportunity structures’: Urban landscape, social capital and health promotion in Australia. Health Promot. Int. 2002, 17, 351–361. [Google Scholar] [CrossRef] [Green Version]
- Hur, M.; Nasar, J.L. Physical upkeep, perceived upkeep, fear of crime and neighborhood satisfaction. J. Environ. Psychol. 2014, 38, 186–194. [Google Scholar] [CrossRef]
- Lund, H. Pedestrian environments and sense of community. J. Plan. Educ. Res. 2002, 21, 301–312. [Google Scholar] [CrossRef]
- Hartig, T.; Mitchell, R.; Vries, S.D.; Frumkin, H. Nature and health. Annu. Rev. Public Health 2014, 35, 207–228. [Google Scholar] [CrossRef] [Green Version]
- De Jesus, M.; Puleo, E.; Shelton, R.C.; Emmons, K.M. Associations between perceived social environment and neighborhood safety: Health implications. Health Place 2010, 16, 1007–1013. [Google Scholar] [CrossRef] [Green Version]
- Wang, R.; Yuan, Y.; Liu, Y.; Zhang, J.; Liu, P.; Lu, Y.; Yao, Y. Using street view data and machine learning to assess how perception of neighborhood safety influences urban residents mental health. Health Place 2019, 59, 102186. [Google Scholar] [CrossRef]
- Gilderbloom, J.I.; Riggs, W.W.; Meares, W.L. Does walkability matter? An examination of walkability’s impact on housing values, foreclosures and crime. Cities 2015, 42, 13–24. [Google Scholar] [CrossRef]
- Li, F.; Fisher, K.J.; Brownson, R.C.; Bosworth, M. Multilevel modelling of built environment characteristics related to neighbourhood walking activity in older adults. J. Epidemiol. Commun. H. 2005, 59, 558–564. [Google Scholar] [CrossRef] [Green Version]
- Asadi-Shekari, Z.; Moeinaddini, M.; Shah, M.Z. Pedestrian safety index for evaluating street facilities in urban areas. Safety Sci. 2015, 74, 1–14. [Google Scholar] [CrossRef]
- Paydar, M.; Kamani-Fard, A.; Etminani-Ghasrodashti, R. Perceived security of women in relation to their path choice toward sustainable neighborhood in Santiago, Chile. Cities 2017, 60, 289–300. [Google Scholar] [CrossRef]
- National Bureau of Statistics of the People’s Republic of China. China City Statistical Yearbook; China Statistics Press: Beijing, China, 2018.
- Mitis, F.; Sethi, D.; Racioppi, F. Preventing violence and unintentional injuries in Europe: From international collaboration to local implementation. A WHO Survey. Epidemiol. Prev. 2011, 34, 88. [Google Scholar]
- Tzouras, P.; Tsigdinos, S.; Karolemeas, C.; Bakogiannis, E. Discussing the role of traffic safety in sustainable urban mobility plans using spatial analysis techniques. In Advances in Mobility-as-a-Service Systems. CSUM 2020. Advances in Intelligent Systems and Computing; Nathanail, E.G., Adamos, G., Karakikes, I., Eds.; Springer: Berlin/Heidelberg, Germany, 2021; Volume 1278, pp. 505–514. [Google Scholar]
- Mehta, V. Lively streets. J. Plan. Educ. Res. 2007, 27, 165–187. [Google Scholar] [CrossRef]
- Ferenchak, N.N.; Marshall, W.E. Quantifying suppressed child pedestrian and bicycle trips. Travel Behav. Soc. 2020, 20, 91–103. [Google Scholar] [CrossRef]
- Zhang, F.; Fan, Z.; Kang, Y.; Hu, Y.; Ratti, C. “Perception bias”: Deciphering a mismatch between urban crime and perception of safety. Landsc. Urban Plan. 2021, 207, 104003. [Google Scholar] [CrossRef]
- Li, X.; Zhang, C.; Li, W. Does the visibility of greenery increase perceived safety in urban areas? Evidence from the Place Pulse 1.0 Dataset. ISPRS Int. J. Geo-Inf. 2015, 4, 1166–1183. [Google Scholar] [CrossRef] [Green Version]
- Yu, C. How differences in roadways affect school travel safety. J. Am. Plann. Assoc. 2015, 81, 203–220. [Google Scholar] [CrossRef]
- De Salazar, N.N.G.; Martín, M.C.; Chamizo Nieto, F.J.; Rosa-Jiménez, C.; Muñoz, J.B. Indicator system to measure the qualities of urban space affecting urban safety and coexistence. IOP Conf. Series. Mater. Sci. Eng. 2020, 960, 42051. [Google Scholar] [CrossRef]
- Dong, H. Does walkability undermine neighbourhood safety? J. Urban Des. 2017, 22, 59–75. [Google Scholar] [CrossRef]
- Özhanci, E.; Yilmaz, H.; Yilmaz, S. Safety perceptions of different plant designs in pedestrian and car streets. Urban Des. int. 2013, 19, 303–310. [Google Scholar] [CrossRef]
- Park, Y.; Garcia, M. Pedestrian safety perception and urban street settings. Int. J. Sustain. Transp. 2019, 14, 860–871. [Google Scholar] [CrossRef]
- Hong, A.; Sallis, J.F.; King, A.C.; Conway, T.L.; Saelens, B.; Cain, K.L.; Fox, E.H.; Frank, L.D. Linking green space to neighborhood social capital in older adults: The role of perceived safety. Soc. Sci. Med. 2018, 207, 38–45. [Google Scholar] [CrossRef]
- Suarez-Balcazar, Y.; Early, A.R.; Garcia, C.; Balcazar, D.; Arias, D.L.; Morales, M. Walkability safety and walkability participation: A health concern. Health Educ. Behav. 2020, 47, 430–438. [Google Scholar] [CrossRef]
- Kweon, B.; Rosenblatt-Naderi, J.; Ellis, C.D.; Shin, W.H.; Danies, B.H. The effects of pedestrian environments on walking behaviors and perception of pedestrian safety. Sustainability 2021, 13, 8728. [Google Scholar] [CrossRef]
- Baran, P.K.; Tabrizian, P.; Zhai, Y.; Smith, J.W.; Floyd, M.F. An exploratory study of perceived safety in a neighborhood park using immersive virtual environments. Urban For. Urban Gree. 2018, 35, 72–81. [Google Scholar] [CrossRef]
- Mouratidis, K. Compact city, urban sprawl and subjective well-Being. Cities 2019, 92, 261–272. [Google Scholar] [CrossRef]
- Peña-García, A.; Hurtado, A.; Aguilar-Luzón, M.C. Impact of public lighting on pedestrians’ perception of safety and well-Being. Safety Sci. 2015, 78, 142–148. [Google Scholar] [CrossRef]
- Harvey, C.; Aultman-Hall, L.; Hurley, S.E.; Troy, A. Effects of skeletal streetscape design on perceived safety. Landsc. Urban Plan. 2015, 142, 18–28. [Google Scholar] [CrossRef] [Green Version]
- Naik, N.; Philipoom, J.; Raskar, R.; Hidalgo, C. Streetscore-Predicting the perceived safety of one million streetscapes. In Proceedings of the IEEE Conference on Computer Vision & Pattern Recognition Workshops, Columbus, OH, USA, 23–28 June 2014; IEEE: Piscataway, NJ, USA, 2014. [Google Scholar]
- Rusydiana, A.S. Bibliometric analysis of journals, authors and topics related to COVID-19 and Islamic finance listed in the dimensions database by Biblioshiny. Sci. Edit. 2021, 8, 72–78. [Google Scholar] [CrossRef]
- Baylis, J. Discord and Collaboration 1945–1949; Palgrave Macmillan: London, UK, 1981. [Google Scholar]
- Odufuwa, B.; Badiora, A.I.; Olaleye, D.O.; Akinlotan, P.A.; Adebara, T.M. Perceived personal safety in built environment facilities: A Nigerian case study of urban recreation sites. J. Outdoor Rec. Tour. 2019, 25, 24–35. [Google Scholar] [CrossRef]
- Wolfers, A.; Stoessinger, J.G. Discord and collaboration: Essays on international politics. J. Polit. 1962, 25, 451. [Google Scholar]
- Stern, P.C. Psychology and the science of human-Environment interactions. Am. Psychol. 2000, 55, 523–530. [Google Scholar] [CrossRef]
- Pain, R. Place, social relations and the fear of crime: A review. Prog. Hum. Geog. 2000, 24, 365–387. [Google Scholar] [CrossRef]
- Maslow, A.H.; Hirsh, E.; Stein, M.; Honigmann, I. A clinically derived test for measuring psychological security-Insecurity. J. Gen. Psychol. 1945, 33, 21–41. [Google Scholar] [CrossRef]
- Garofalo, J. The fear of crime: Causes and consequences. J. Crim. Law Crim. 1981, 72, 839–857. [Google Scholar] [CrossRef] [Green Version]
- Lorenc, T.; Clayton, S.; Neary, D.; Whitehead, M.; Petticrew, M.; Thomson, H.; Cummins, S.; Sowden, A.; Renton, A. Crime, fear of crime, environment, and mental health and wellbeing: Mapping review of theories and causal pathways. Health Place 2012, 18, 757–765. [Google Scholar] [CrossRef]
- Sreetheran, M.; van den Bosch, C.C.K. A socio-Ecological exploration of fear of crime in urban green spaces: A systematic review. Urban For. Urban Gree. 2014, 13, 1–18. [Google Scholar] [CrossRef]
- Jacobs, J. The Death and Life of Great American Cities; Random House: New York, NY, USA, 1961. [Google Scholar]
- Gehl, J. Life between Buildings; The Danish Architectural Press: Copenhagen, Denmark, 2003. [Google Scholar]
- Jeffery, C.R. Crime Prevention through Environmental Design; Sage Publications: London, UK, 1971. [Google Scholar]
- Newman, O. Defensible Space: Crime Prevention through Urban Design; American Political Science Association: New York, NY, USA, 1972; Volume 69. [Google Scholar]
- Wilson, J.Q.; Kelling, G.L. Broken Windows. Atl. Mon. 1982, 249, 29–38. [Google Scholar]
- Appleton, J. Prospect refuge revisited. Landsc. J. 1984, 3, 91–103. [Google Scholar] [CrossRef]
- Ito, Z. Urban Crime; Toyo Economic new Newspaper Office: Tokyo, Japan, 1982. [Google Scholar]
- Calthorpe, P. The Next American Metropolis: Ecology, Community & the American Dream; The MIT Press: Cambridge, MA, USA, 1993. [Google Scholar]
- More, K.R.; Quigley-McBride, A.; Clerke, A.S.; More, C. Do measures of country-Level safety predict individual-Level health outcomes? Soc. Sci. Med. 2019, 225, 128–138. [Google Scholar] [CrossRef] [PubMed]
- Chen, J.; Chen, S. Mental health effects of perceived living environment and neighborhood safety in urbanizing China. Habitat. Int. 2015, 46, 101–110. [Google Scholar] [CrossRef]
- Wilson-Genderson, M.; Pruchno, R. Effects of neighborhood violence and perceptions of neighborhood safety on depressive symptoms of older adults. Soc. Sci. Med. 2013, 85, 43–49. [Google Scholar] [CrossRef]
- Landis, B.W.; Vattikuti, V.R.; Ottenberg, R.M.; McLeod, D.S.; Guttenplan, M. Modeling the roadside walking environment: Pedestrian level of service. Transp. Res. Rec. 2001, 41, 82–88. [Google Scholar] [CrossRef]
- Coleman, A.F.; Ryan, R.L.; Eisenman, T.S.; Locke, D.H.; Harper, R.W. The influence of street trees on pedestrian perceptions of safety: Results from environmental justice areas of Massachusetts, U.S. Urban For. Urban Gree. 2021, 64, 127258. [Google Scholar] [CrossRef]
- Aceves-Gonzalez, C.; Ekambaram, K.; Rey-Galindo, J.; Rizo-Corona, L. The role of perceived pedestrian safety on designing safer built environments. Traffic Inj. Prev. 2020, 21, S84–S89. [Google Scholar] [CrossRef]
- Hong, J.; Chen, C. The role of the built environment on perceived safety from crime and walking: Examining direct and indirect impacts. Transportation 2014, 41, 1171–1185. [Google Scholar] [CrossRef]
- Yao, Y.; Liang, Z.; Yuan, Z.; Liu, P.; Bie, Y.; Zhang, J.; Wang, R.; Wang, J.; Guan, Q. A human-Machine adversarial scoring framework for urban perception assessment using street-View images. Int. J. Geogr. Inf. Sci. 2019, 33, 2363–2384. [Google Scholar] [CrossRef]
- Wood, L.; Shannon, T.; Bulsara, M.; Pikora, T.; McCormack, G.; Giles-Corti, B. The anatomy of the safe and social suburb: An exploratory study of the built environment, social capital and residents’ perceptions of safety. Health Place 2008, 14, 15–31. [Google Scholar] [CrossRef]
- Mouratidis, K. The impact of urban tree cover on perceived safety. Urban For. Urban Gree. 2019, 44, 126434. [Google Scholar] [CrossRef]
- Stülpnagel, R.V.; Lucas, J. Crash risk and subjective risk perception during urban cycling: Evidence for congruent and incongruent sources. Accid. Anal. Prev. 2020, 142, 105584. [Google Scholar] [CrossRef] [PubMed]
- Schaefer-McDaniel, N.; Caughy, M.O.; O’Campo, P.; Gearey, W. Examining methodological details of neighbourhood observations and the relationship to health: A literature review. Soc. Sci. Med. 2010, 70, 277–292. [Google Scholar] [CrossRef] [PubMed]
- Zhang, F.; Zhou, B.; Liu, L.; Liu, Y.; Fung, H.H.; Lin, H.; Ratti, C. Measuring human perceptions of a large-Scale urban region using machine learning. Landsc. Urban Plan. 2018, 180, 148–160. [Google Scholar] [CrossRef]
- Mooney, S.J.; DiMaggio, C.J.; Lovasi, G.S.; Neckerman, K.M.; Bader, M.D.M.; Teitler, J.O.; Sheehan, D.M.; Jack, D.W.; Rundle, A.G. Use of Google Street View to assess environmental contributions to pedestrian injury. Am. J. Public Health 2016, 106, 462–469. [Google Scholar] [CrossRef] [PubMed]
- Ramírez, T.; Hurtubia, R.; Lobel, H.; Rossetti, T. Measuring heterogeneous perception of urban space with massive data and machine learning: An application to safety. Landsc. Urban Plan. 2021, 208, 104002. [Google Scholar] [CrossRef]
- Bustos, C.; Rhoads, D.; Solé-Ribalta, A.; Masip, D.; Arenas, A.; Lapedriza, A.; Borge-Holthoefer, J. Explainable, automated urban interventions to improve pedestrian and vehicle safety. Transport. Res. C-Emer. 2021, 125, 103018. [Google Scholar] [CrossRef]
- Xia, Y.; Yabuki, N.; Fukuda, T. Development of a system for assessing the quality of urban street-Level greenery using street view images and deep learning. Urban For. Urban Gree. 2021, 59, 126995. [Google Scholar] [CrossRef]
- Svechkina, A.; Trop, T.; Portnov, B.A. How much lighting is required to feel safe when walking through the streets at night? Sustainability 2020, 12, 3133. [Google Scholar] [CrossRef] [Green Version]
- Ye, Y.; Richards, D.; Lu, Y.; Song, X.; Zhuang, Y.; Zeng, W.; Zhong, T. Measuring daily accessed street greenery: A human-Scale approach for informing better urban planning practices. Landsc. Urban Plan. 2019, 191, 103434. [Google Scholar] [CrossRef]
- Xiao, C.; Shi, Q.; Gu, C. Assessing the spatial distribution pattern of street greenery and its relationship with socioeconomic status and the built environment in Shanghai, China. Land 2021, 10, 871. [Google Scholar] [CrossRef]
- Ludwig, C.; Hecht, R.; Lautenbach, S.; Schorcht, M.; Zipf, A. Mapping public urban green spaces based on OpenStreetMap and sentinel-2 imagery using belief functions. ISPRS Int. J. Geo-Inf. 2021, 10, 251. [Google Scholar] [CrossRef]
- Jensen, W.A.; Brown, B.B.; Smith, K.R.; Brewer, S.C.; Amburgey, J.W.; McIff, B. Active transportation on a complete street: Perceived and audited walkability correlates. Int. J. Environ. Res. Public Health 2017, 14, 1014. [Google Scholar] [CrossRef] [PubMed] [Green Version]
- Southworth, M. Designing the walkable city. J. Urban Plan. Dev. 2005, 131, 246–257. [Google Scholar] [CrossRef]
- Lee, S. An analysis of the characteristics of street environment affecting pedestrian accidents: Applications of street segment analysis unit and spatial statistics. J. Urban Des. Inst. Korea Urban Des. 2016, 17, 105–121. [Google Scholar]
- Cullen, G. The Concise Townscape; The MIT Press: Cambridge, MA, USA, 1961. [Google Scholar]
- Dobzhansky, T. The territorial imperative: A personal inquiry into the animal origins of property and nations. Anim. Behav. 1967, 15, 392–393. [Google Scholar] [CrossRef]
- Salesses, P.; Schechtner, K.; Hidalgo, C.A. The collaborative image of the city: Mapping the inequality of urban perception. PLoS ONE 2013, 8, e68400. [Google Scholar]
- Alexander, C.; Ishikawa, S.; Silverstein, M. A Pattern Language: Towns, Buildings, Construction; Oxford University Press: New York, NY, USA, 1977. [Google Scholar]
- Lynch, K. The Image of the City; The MIT Press: Cambridge, MA, USA, 1960. [Google Scholar]
- Arnold, H.F. Trees in Urban Design; Van Nostrand Reinhold: New York, NY, USA, 1993. [Google Scholar]
- Velashani, S.T.; Madani, I.; Azeri, A.R.K.; Hosseini, S.B. Effect of physical factors on the sense of security of the people in Isfahan’s traditional bazaar. Procedia Soc. Behav. Sci. 2015, 201, 165–174. [Google Scholar] [CrossRef] [Green Version]
- Jorgensen, A.; Hitchmough, J.; Calvert, T. Woodland spaces and edges: Their impact on perception of safety and preference. Landsc. Urban Plan. 2002, 60, 135–150. [Google Scholar] [CrossRef]
- Gehl, J. Cities for People; The MIT Press: Cambridge, MA, USA, 2010. [Google Scholar]
- Guo, X.; Chen, H.; Yang, X. An evaluation of street dynamic vitality and its influential factors based on multi-Source big data. ISPRS Int. J. Geo-Inf. 2021, 10, 143. [Google Scholar] [CrossRef]
- Wu, W.; Niu, X.; Li, M. Influence of built environment on street vitality: A case study of west Nanjing road in Shanghai based on mobile location data. Sustainability 2021, 13, 1840. [Google Scholar] [CrossRef]
- Ashihara, Y. The Aesthetic Townscape; The MIT Press: Cambridge, MA, USA, 1984. [Google Scholar]
- Jacobs, A.B. Great Streets; The MIT Press: Cambridge, MA, USA, 1995. [Google Scholar]
- Kuang, X.; Xu, W. Urban planning management based street façade control methods. Planners 2012, 28, 70–75. [Google Scholar]
- Harvey, C.W. Measuring Streetscape Design for Livability Using Spatial Data and Methodsm. Master’s Thesis, The University of Vermont, Burlington, VT, USA, 2014. [Google Scholar]
- Chen, Y.; Zhao, X. Research on ground-Floor interfaces along streets from the perspective of pedestrians: A case study of Huaihai road in Shanghai. City Plan. Rev. 2014, 38, 24–31. [Google Scholar]
- Wang, Q.; Zang, X. Origin, features, and adaptive planning strategies of urban block form. City Plan. Rev. 2018, 42, 131–138. [Google Scholar]
- Holcombe, R.G. The New Urbanism versus the market process. Rev. Austrian Econ. 2004, 17, 285–300. [Google Scholar] [CrossRef]
- Moughtin, J.C. Green Dimensions; China Architecture & Building Press: Beijing, China, 2004. [Google Scholar]
- Zhang, Y.; Lu, H.; Luo, S.; Sun, Z.; Qu, W. Human-Scale sustainability assessment of urban intersections based upon multi-source big data. Sustainability 2017, 9, 1148. [Google Scholar] [CrossRef] [Green Version]
- Tan, S.; Yang, J.; Yan, J.; Lee, C.; Hashim, H.; Chen, B. A holistic low carbon city indicator framework for sustainable development. Appl. Energ. 2017, 185, 1919–1930. [Google Scholar] [CrossRef]
- Shrout, P.E.; Fleiss, J.L. Intraclass correlations: Uses in assessing rater reliability. Psychol. Bull. 1979, 86, 420–428. [Google Scholar] [CrossRef]
- Cicchetti, D.V. Guidelines, criteria, and rules of thumb for evaluating normed and standardized assessment instruments in psychology. Psychol. Assess. 1994, 6, 284–290. [Google Scholar] [CrossRef]
- Wu, W.; Ma, Z.; Guo, J.; Niu, X.; Zhao, K. Evaluating the effects of built environment on street vitality at the city level: An empirical research based on spatial panel Durbin model. Int. J. Environ. Res. Public Health 2022, 19, 1664. [Google Scholar] [CrossRef]


| Scholar | Year | Publication | Main Ideas | Morphological Elements |
|---|---|---|---|---|
| Jane Jacobs [43] | 1961 | The Death and Life of Great American Cities | The sense of street safety comes from the continuous pedestrian flow on the street and the informal “natural surveillance” provided by the stores. | Clear public and private boundaries, buildings and stores along the street, adequate and continuous pedestrian flow |
| Jan Gehl [44] | 2003 | Life between Buildings | Safe streets create social places where people can rely on and interact with each other. | Suitable walking space, places to stay, flexible boundaries |
| C. Ray Jeffery [45] | 1971 | Crime Prevention through Environmental Design | The built environment and facilities are designed to prevent and reduce crime, reduce pedestrian fear and concern, and increase sense of safety. | Form, openness, recognizability, and visibility of space, layout of buildings, and streetscape amenities |
| Oscar Newman [46] | 1972 | Defensible Space: Crime Prevention through Urban Design | The built environment is designed and adapted to reduce crime. The core idea is to increase informal surveillance and visibility of locations by enhancing visual accessibility. | Territoriality, surveillance, image, milieu |
| James Q Wilson; George L Kelling [47] | 1982 | Broken Windows | Disordered spaces and low-quality environments can induce potential criminal motivation and create negative safety experiences. | Well-maintained street space, neat layout of facilities, high-quality landscape greenery |
| Jay Appleton [48] | 1984 | Prospect Refuge Revisited | High visual permeability can promote individuals’ sense of self-protection in street space. | Transparent space and open view |
| Ito Zi [49] | 1982 | Urban Crime | The time blind spot caused by low monitoring coverage and the dead space created by the shading of buildings or obstacles are the main inducements of urban crime. | Clear spatial boundaries, permeable spaces, complete safety facilities |
| Peter Calthorpe [50] | 1993 | The Next American Metropolis: Ecology, Community & the American Dream | Based on the relationship between urban economic development, population health, green and low-carbon development and urban walkability, the author expounds on the importance of walkability to street safety. | Walkable space, convenient public transportation, away from the city’s main roads |
| Dimension | Indicator | Description of Indicator | Formula | Explanation | Data Type |
|---|---|---|---|---|---|
| Walkability | Relative Walking Width Index | The ratio of walkway to all traffic space, reflecting the walking capacity of the street | is the relative walking width index; , , , respectively, represent the pixel area of the walkway, roadway, and vehicles in the i-th street view image of the street. m is the number of street view images collected for the street. | Street View Image | |
| Vehicle Interference Index | The ratio of vehicles to roadway, reflecting the degree of disturbance to pedestrians by vehicles | is the vehicle interference index, , , respectively, represent the pixel area of roadway and vehicle in the i-th street view image of the street, and m is the number of street view images collected for the street. | Street View Image | ||
| Traffic Facilities Index | The ratio of traffic safety facilities to the street view image, reflecting the traffic management level of the street | is the traffic facility index, is the pixel area of traffic signals and signs in the i-th street view image of the street, is the total pixel area of the i-th street view image of the street, and m is the number of street view images collected for the street. | Street View Image | ||
| Pedestrian Appearance Ratio | The ratio of pedestrians to the street view image, reflecting the density of pedestrians on the street | is the pedestrian appearance rate, is the pixel area of pedestrians in the i-th street view image of the street, is the total pixel area of the i-th street view image of the street, and m is the number of street view images collected for the street. | Street View Image | ||
| Spatial Enclosure | Distance to the Optimal D/H Ratio | The optimal D/H ratio is subtracted from the ratio of the average street width to the average building height, and then the absolute value is calculated. The optimal D/H ratio is determined as 1.5 [86,87]. | is the distance to the optimal D/H ratio, is the average street width, and is the average height of the buildings along the street. | Building vector data | |
| Distance to the Optimal Interface Continuity Index | The optimal build-to-line ratio is subtracted from the average build-to-line ratio, and then the absolute value is calculated. Combining the construction experience of Western countries and Chinese major cities, the optimal build-to-line ratio is determined as 0.8 [88]. The calculation refers to the quantitative identification method of street interface based on the GIS platform proposed by Harvey [89]. | is the distance to the optimal interface continuity index, is the total length of the building interface along the street, and is the length of the street centerline. | Building vector data | ||
| Street View Enclosure Index | The ratio of buildings, walls, fences, and other elements that have the function of defining the spatial boundary to the street view image | is the street view enclosure index,, , , respectively, represent the pixel area of buildings, walls, and fences in the i-th street view image of the street, is the total pixel area of the i-th street view image of the street, and m is the number of street view images collected for the street. | Street View Image | ||
| Visual Permeability | Visual Obscuration Index | The ratio of trees, pillars, vehicles, and other elements that obstruct the sight to the street view image, reflecting the degree to which the environmental elements in the street space obstruct the sight of pedestrians. | is the visual obscuration index, , , respectively, represent the pixel area of trees, pillars, and various vehicles in the i-th street view image of the street, is the total pixel area of the i-th street view image of the street, and m is the number of street view images collected for the street. | Street View Image | |
| Interface Transparency Index | The ratio of the horizontal length of the building interface with visual permeability to the total length of the building interface along the street. Building interfaces are classified into four categories: commercial building interfaces with high permeability (category I), office building interfaces with medium permeability (category II), residential building interfaces with low permeability (category III), and walls without permeability (category IV) [90]. | is the interface transparency index, is the length of the category I building interface of the street, is the length of the category II building interface of the street, is the length of the category III building interface of the street, and is the total length of the building interface along the street. | Building vector data | ||
| Sky Openness Index | The ratio of the sky to the street view image, reflecting the sky openness of the street space | is the sky openness index, is the pixel area of the sky in the i-th street view image of the street, is the total pixel area of the i-th street view image of the street, and m is the number of street view images collected for the street. | Street View Image | ||
| Vitality | Functional Diversity | The mix of POIs within 55 m around the street, reflecting the diversity of street functions. The POIs are classified into eight types: government institution, transportation, commerce, education, housing, company and enterprise, green, and others. | is the functional diversity around the street, is the proportion of r-th POI to the total number of POI within 55 m around the street, and n is the number of POI types within 55 m meters around the street. | POIs | |
| Development Intensity | Building floor area ratio within 100 m around the street | is the development intensity around the street, is the total building area within 100 m around the street, and is the total land area within 100 m around the street. | Building vector data | ||
| Distance to the Optimal Street Length | The optimal street length is subtracted from the actual street length, and then the absolute value is calculated. The optimal street length is determined as 100 m [91,92,93]. | is the distance to the optimal street length, and is the length of the street centerline. | Open Street Map | ||
| Building Age | The age of the buildings around the street | is the building age around the street, and is the completion year of the nearest residential neighborhood or public building around the street. | Building vector data |
Publisher’s Note: MDPI stays neutral with regard to jurisdictional claims in published maps and institutional affiliations. |
© 2022 by the authors. Licensee MDPI, Basel, Switzerland. This article is an open access article distributed under the terms and conditions of the Creative Commons Attribution (CC BY) license (https://creativecommons.org/licenses/by/4.0/).
Share and Cite
Wu, W.; Guo, J.; Ma, Z.; Zhao, K. Data-Driven Approach to Assess Street Safety: Large-Scale Analysis of the Microscopic Design. ISPRS Int. J. Geo-Inf. 2022, 11, 537. https://doi.org/10.3390/ijgi11110537
Wu W, Guo J, Ma Z, Zhao K. Data-Driven Approach to Assess Street Safety: Large-Scale Analysis of the Microscopic Design. ISPRS International Journal of Geo-Information. 2022; 11(11):537. https://doi.org/10.3390/ijgi11110537
Chicago/Turabian StyleWu, Wanshu, Jinhan Guo, Ziying Ma, and Kai Zhao. 2022. "Data-Driven Approach to Assess Street Safety: Large-Scale Analysis of the Microscopic Design" ISPRS International Journal of Geo-Information 11, no. 11: 537. https://doi.org/10.3390/ijgi11110537