
Cardiac Imaging Biomarkers in Chronic Kidney Disease
 , ,
, ,
Abstract
:1. Introduction
2. Echocardiography
2.1. Cardiac Remodelling
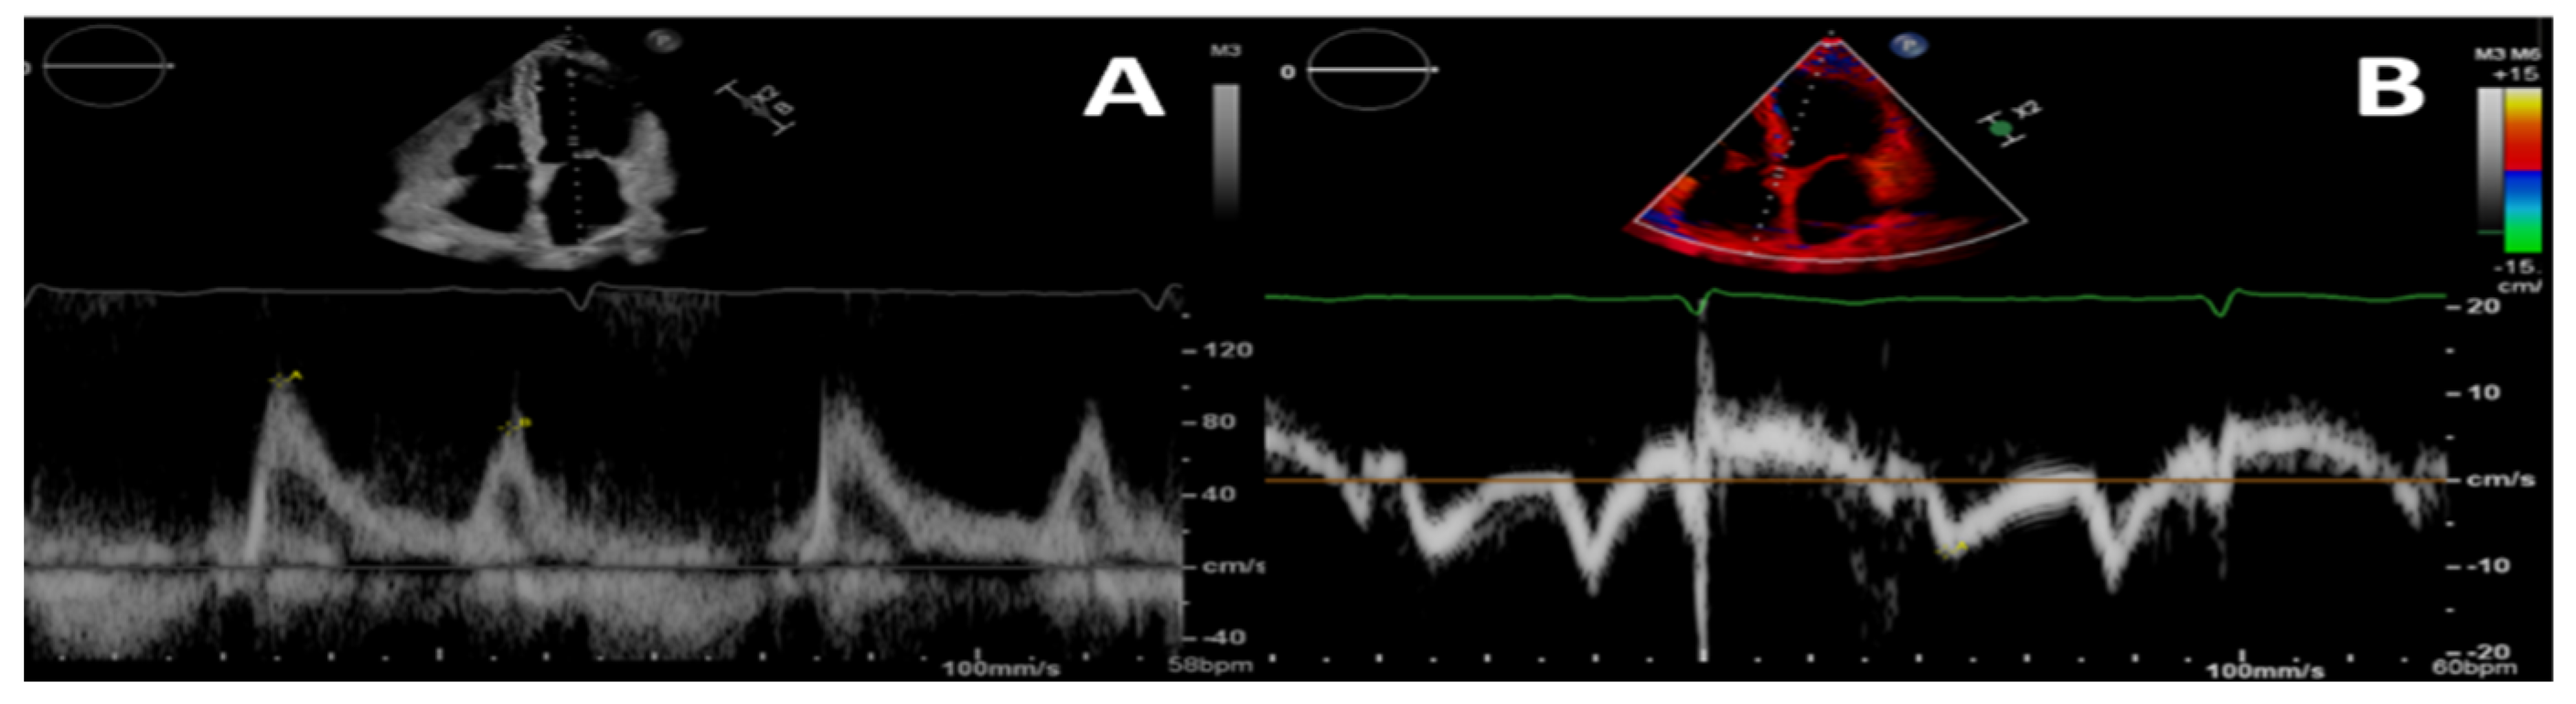
2.2. Diastolic Function
2.3. Systolic Function
2.4. Calcification
2.5. Other Biomarkers
3. Cardiac Magnetic Resonance
3.1. Left Ventricular Hypertrophy
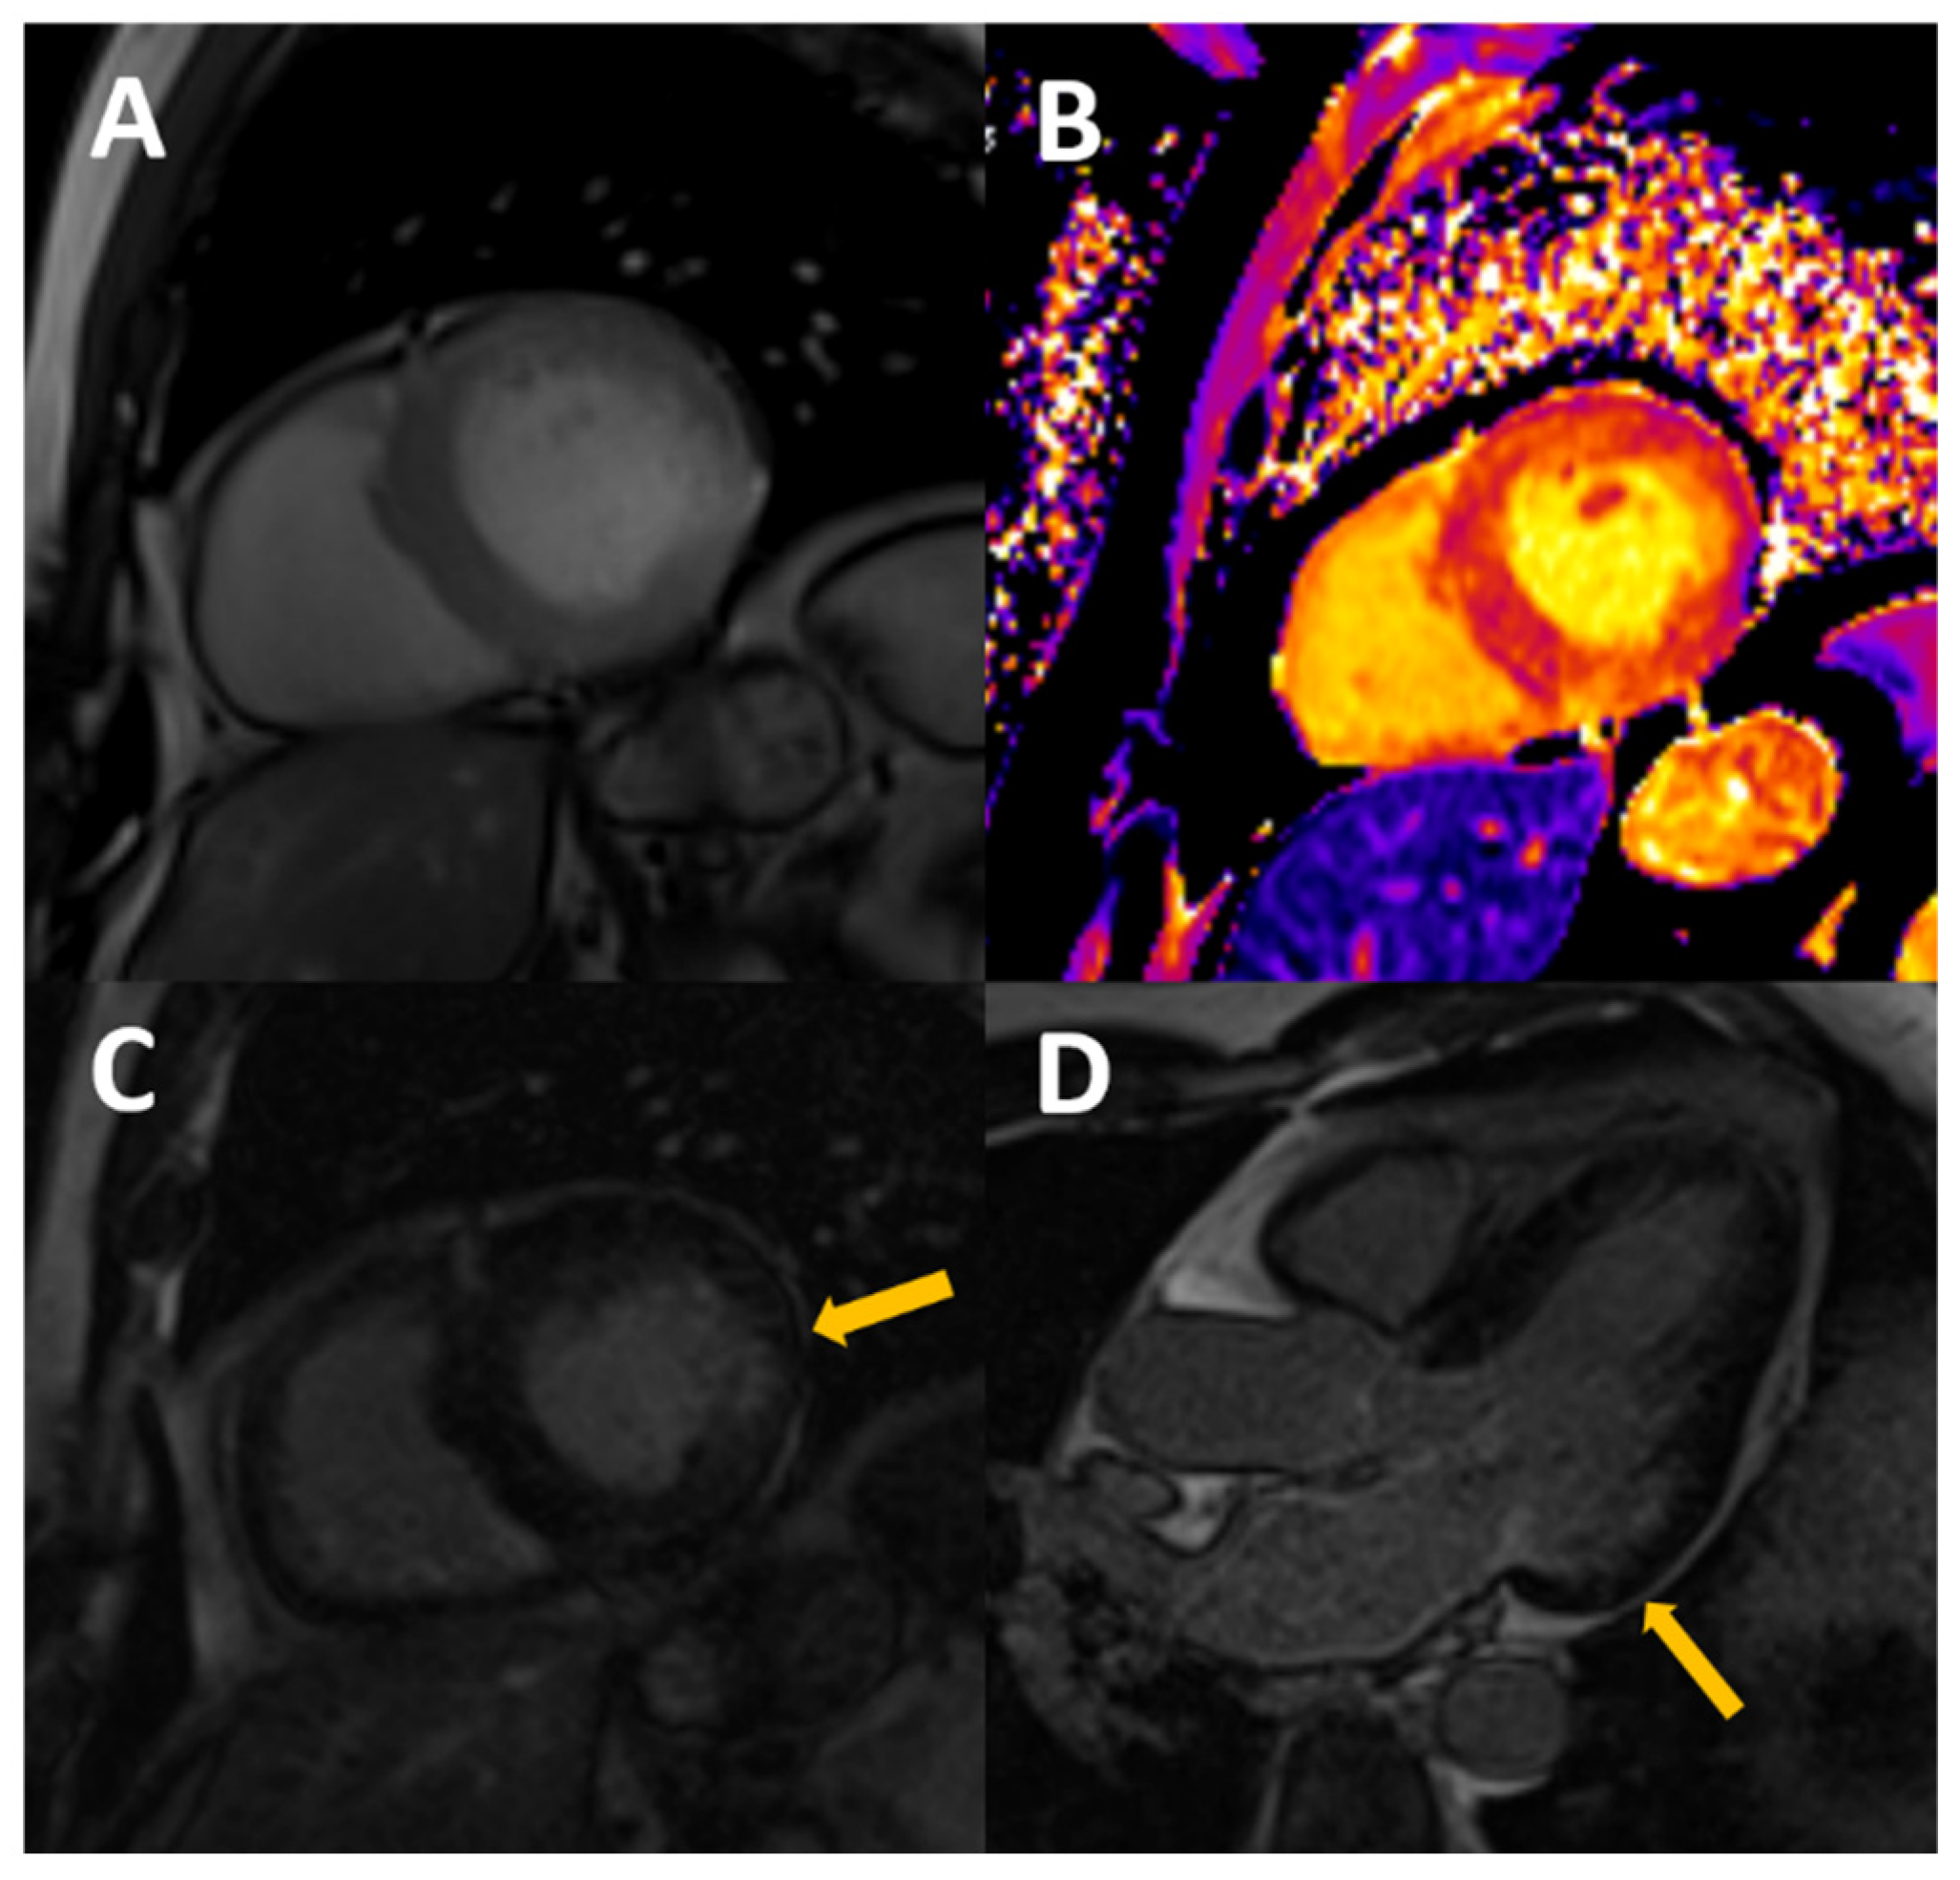
3.2. Regional Fibrosis
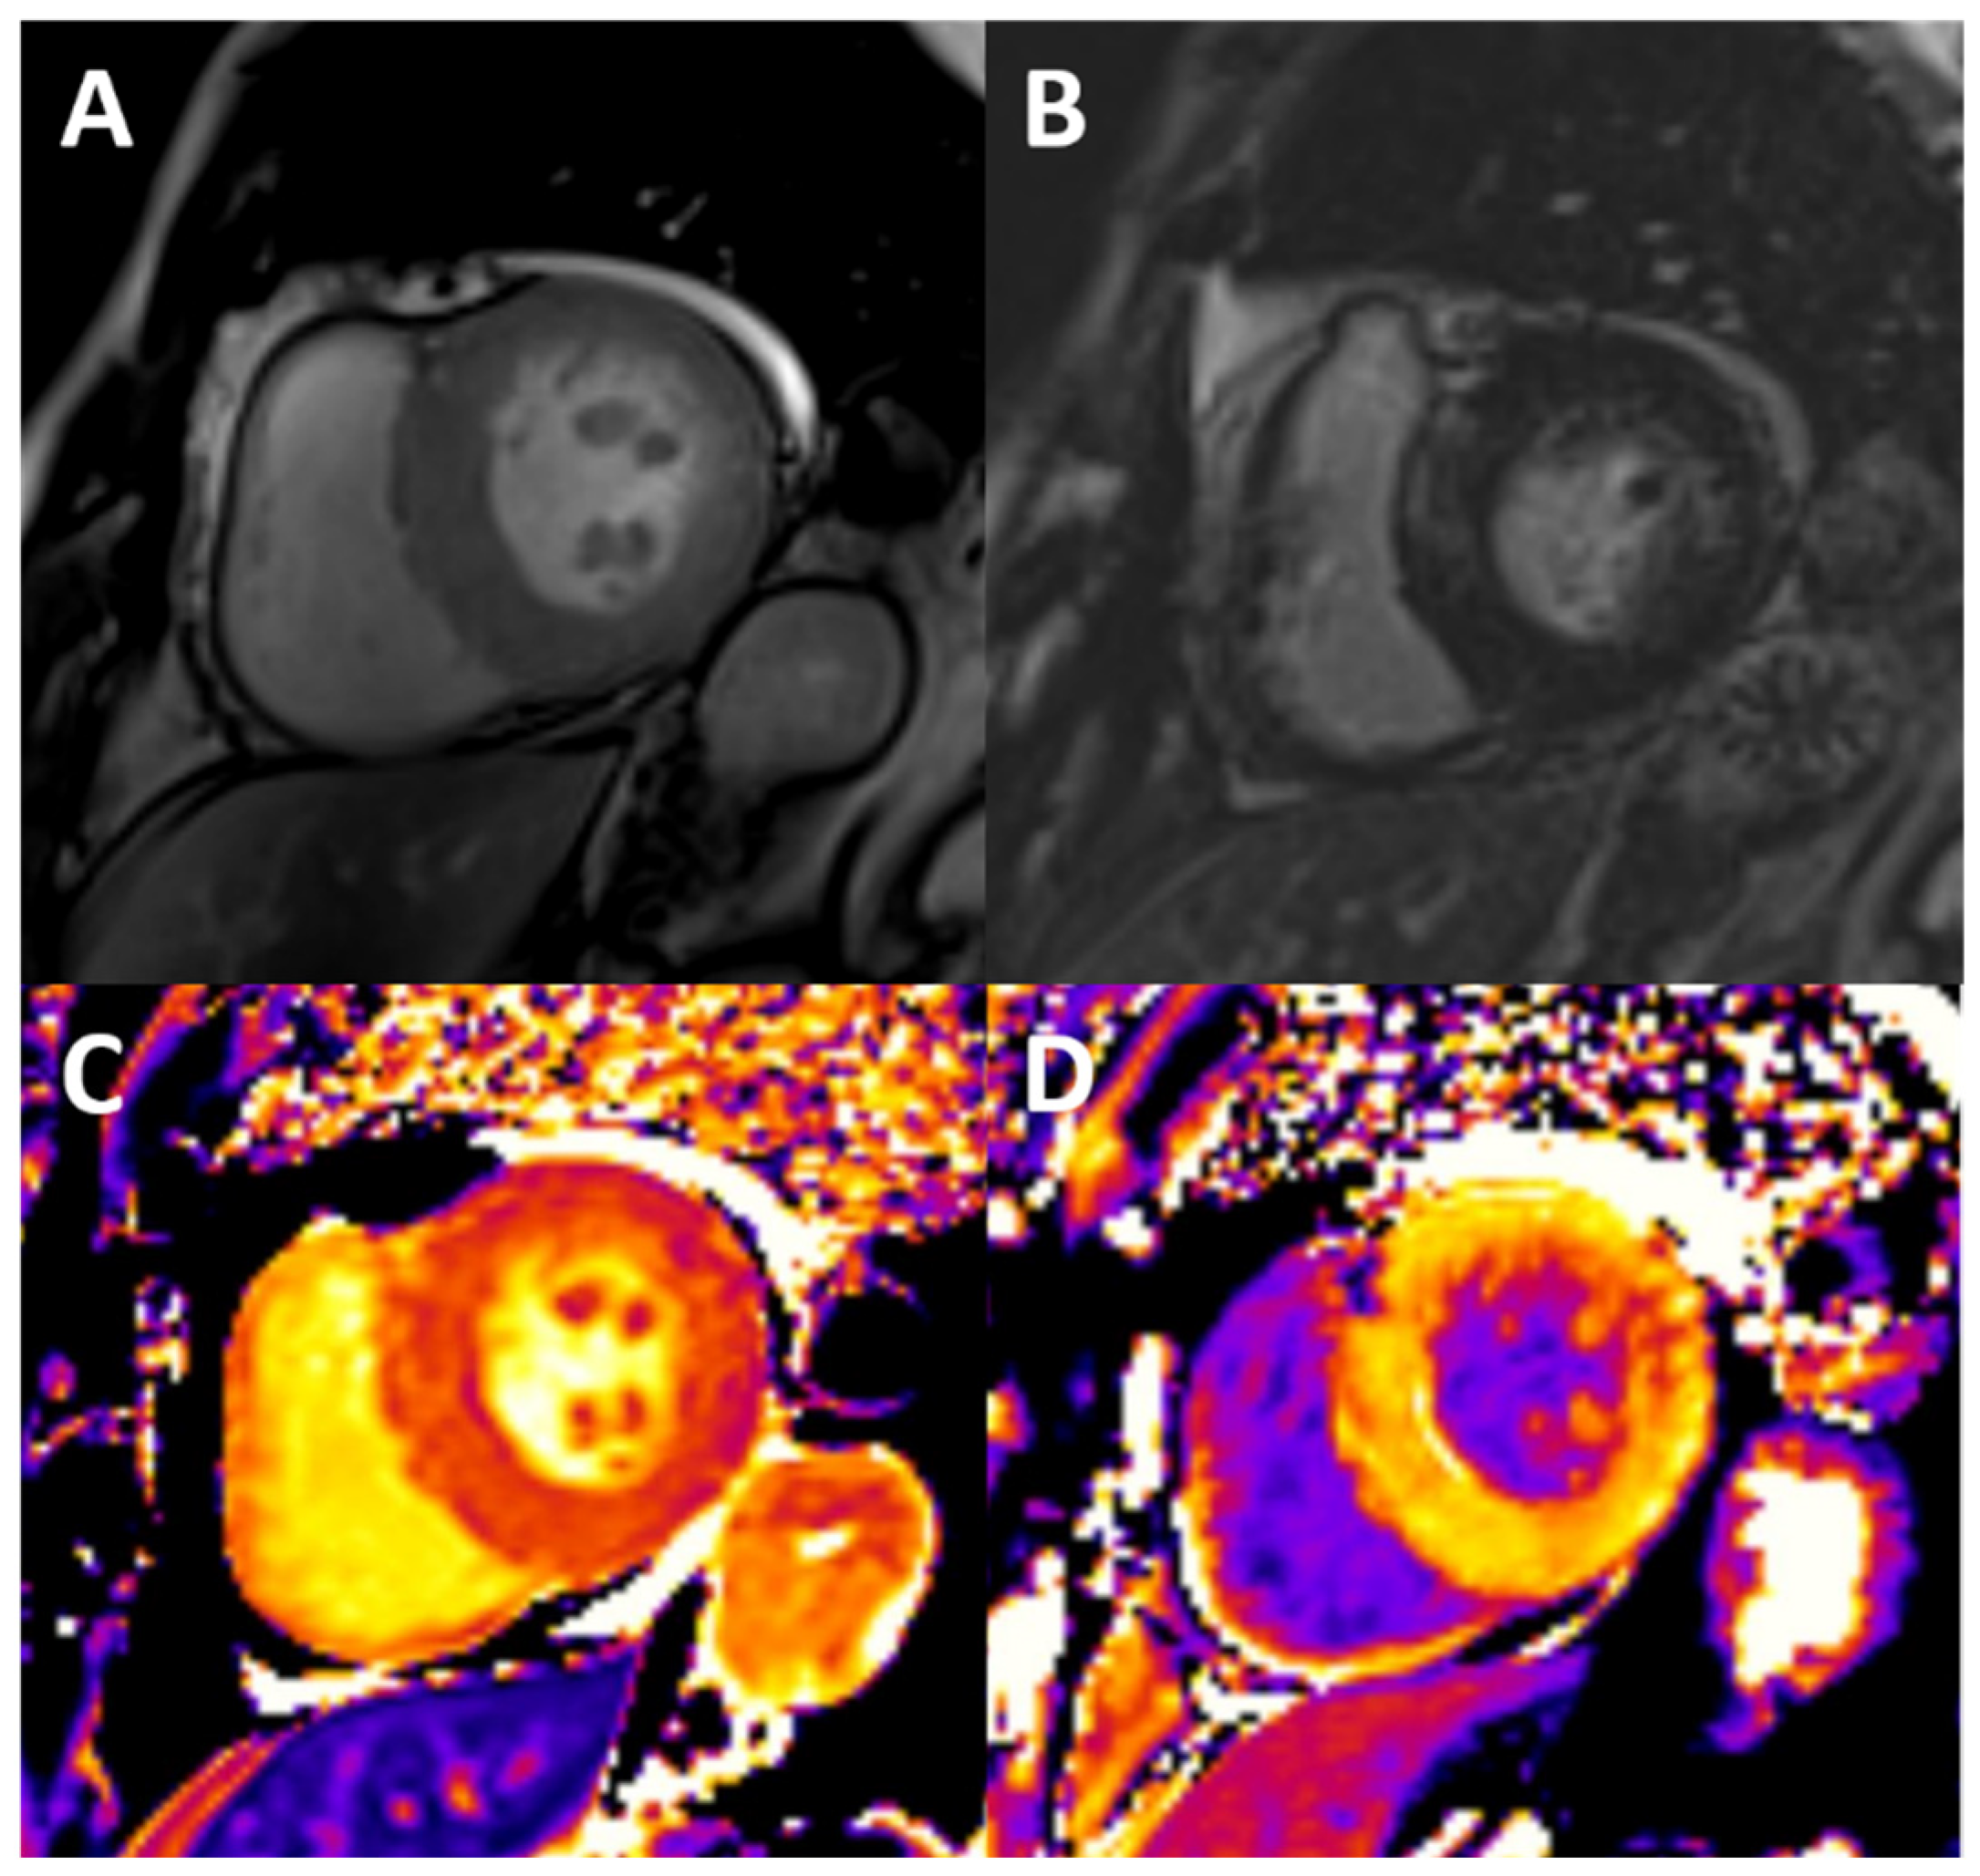
3.3. Diffuse Fibrosis and Edema
3.4. Vascular Stiffness
3.5. Other Biomarkers
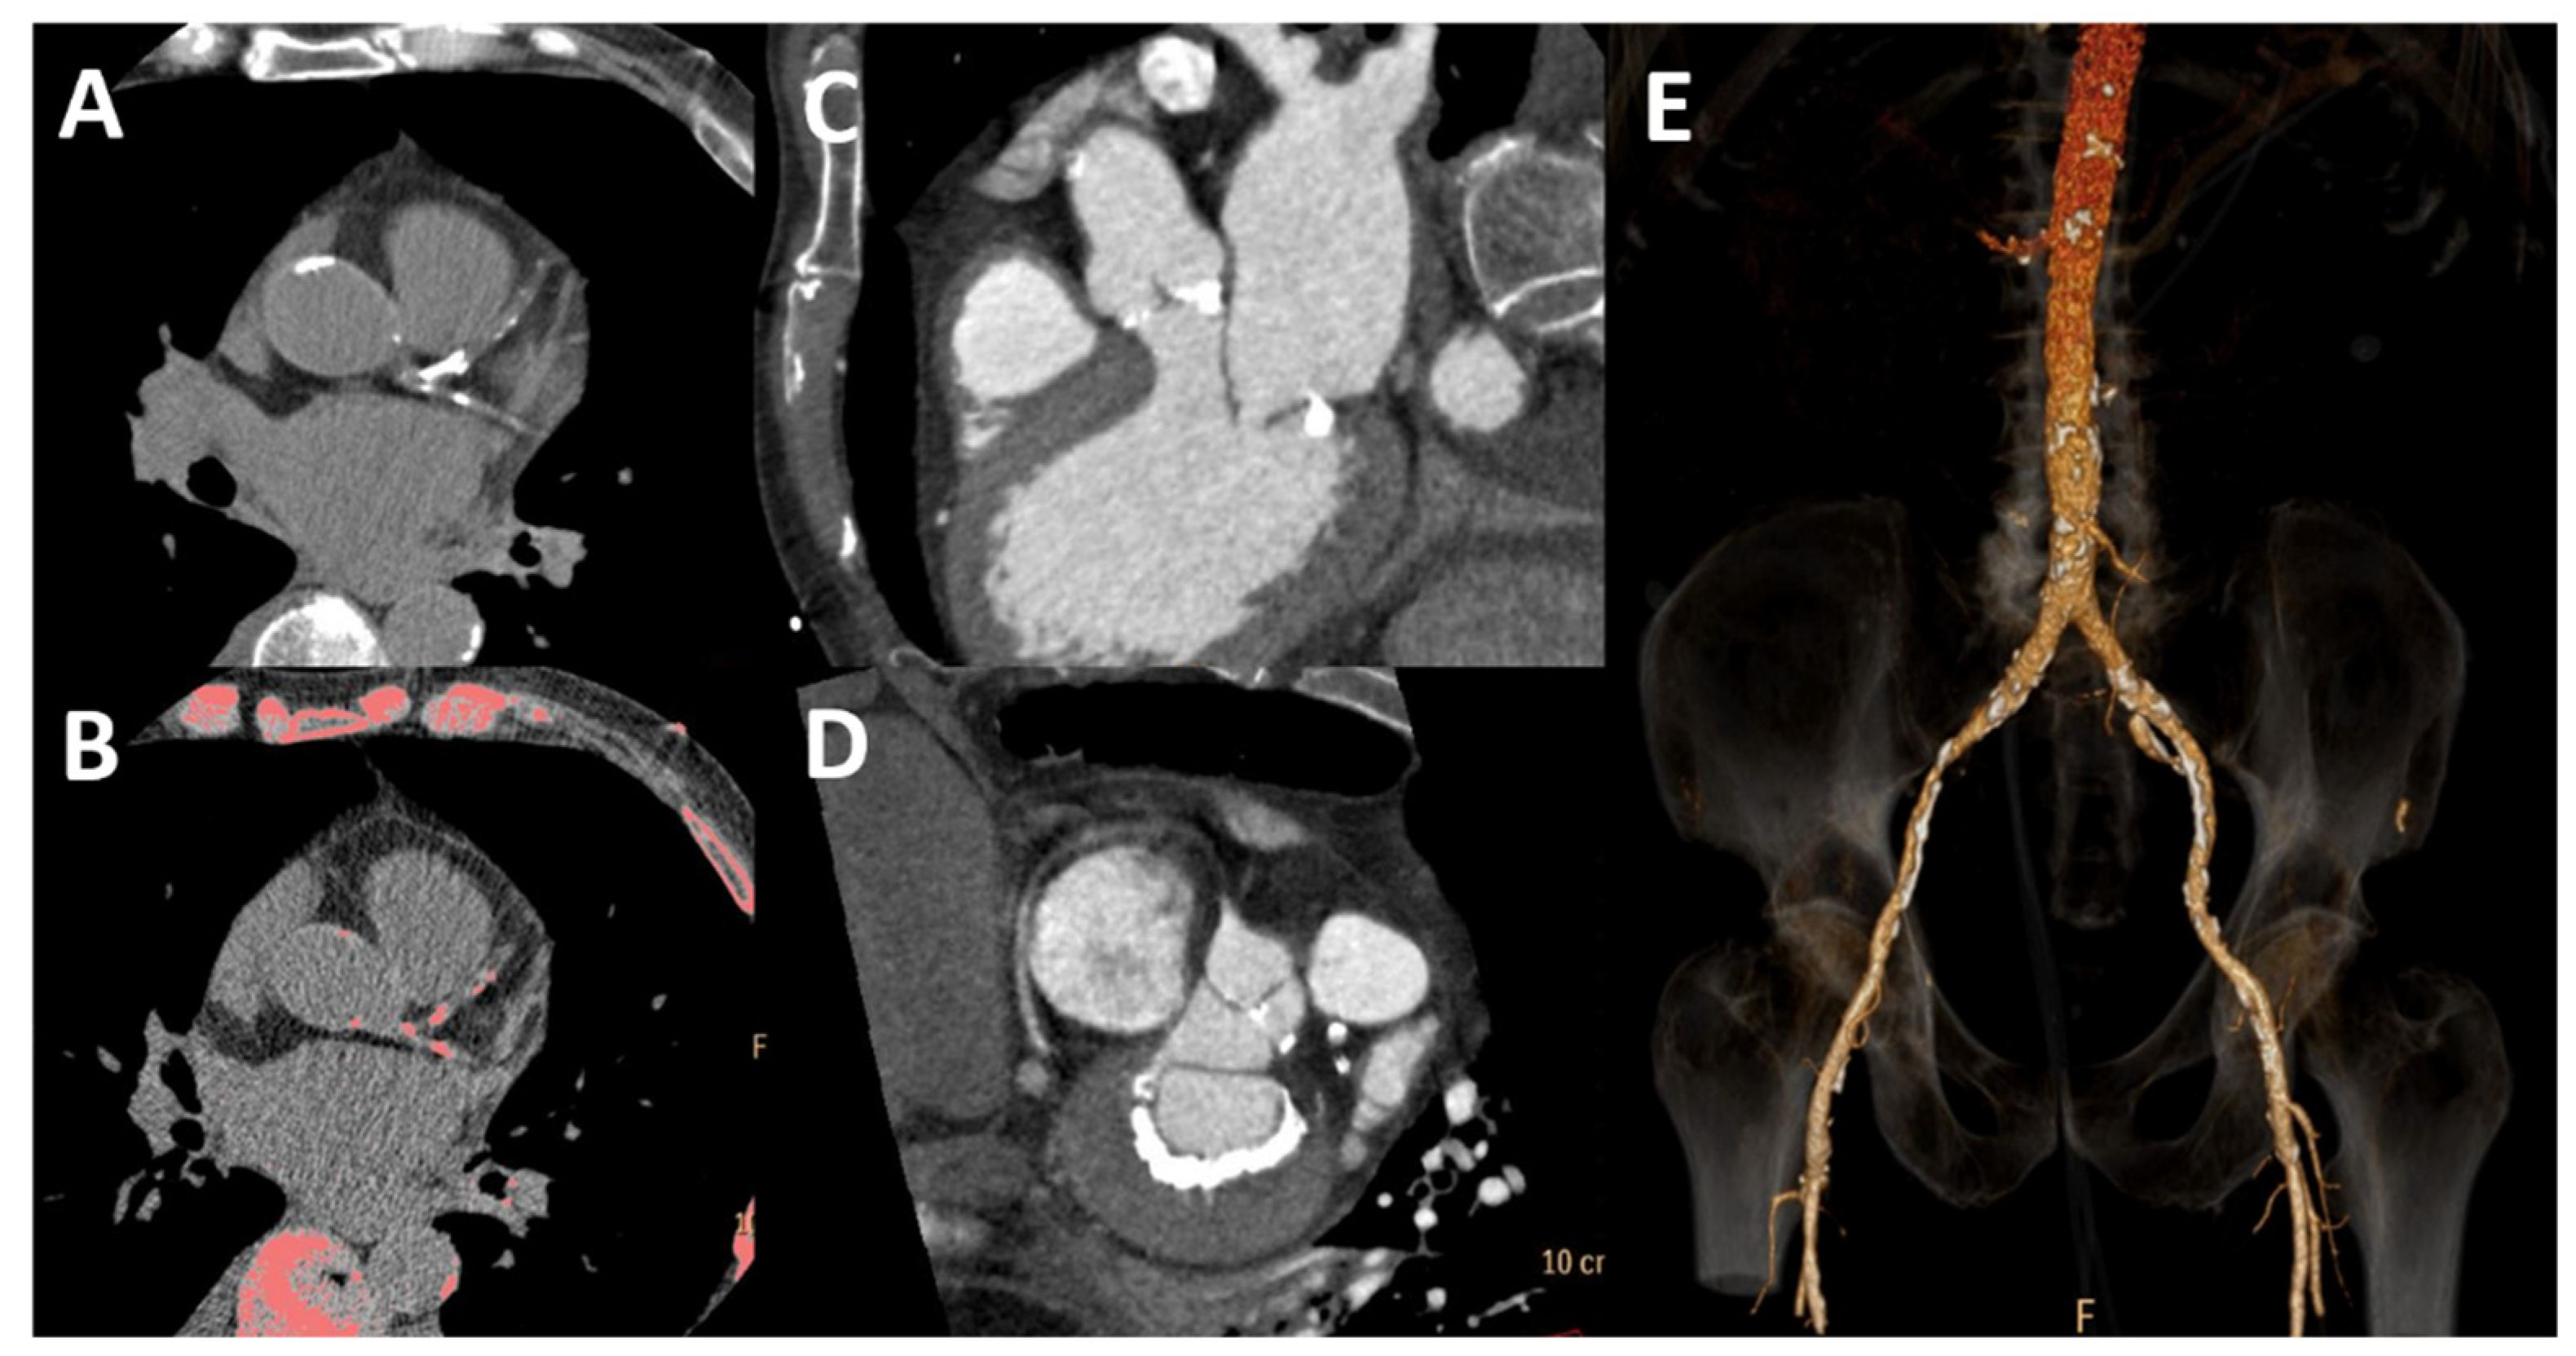
4. Computed Tomography
5. Conclusions
Funding
Conflicts of Interest
References
- Go, A.S.; Chertow, G.M.; Fan, D.; McCulloch, C.E.; Hsu, C.-Y. Chronic Kidney Disease and the Risks of Death, Cardiovascular Events, and Hospitalization. N. Engl. J. Med. 2004, 351, 1296–1305. [Google Scholar] [CrossRef] [PubMed]
- Visseren, F.L.J.; Mach, F.; Smulders, Y.M.; Carballo, D.; Koskinas, K.C.; Bäck, M.; Benetos, A.; Biffi, A.; Boavida, J.-M.; Capodanno, D.; et al. ESC Guidelines on cardiovascular disease prevention in clinical practice. Eur. Heart J. 2021, 42, 3227–3337. [Google Scholar] [CrossRef]
- Sarnak, M.J.; Amann, K.; Bangalore, S.; Cavalcante, J.L.; Charytan, D.M.; Craig, J.C.; Gill, J.S.; Hlatky, M.A.; Jardine, A.G.; Landmesser, U.; et al. Chronic Kidney Disease and Coronary Artery Disease. J. Am. Coll. Cardiol. 2019, 74, 1823–1838. [Google Scholar] [CrossRef] [PubMed]
- Shamseddin, M.K.; Parfrey, P.S. Sudden cardiac death in chronic kidney disease: Epidemiology and prevention. Nat. Rev. Nephrol. 2011, 7, 145–154. [Google Scholar] [CrossRef]
- Remppis, A.; Ritz, E. Non-Coronary Heart Disease in Dialysis Patients: Cardiac Problems in the Dialysis Patient: Beyond Coronary Disease. Semin. Dial. 2008, 21, 319–325. [Google Scholar] [CrossRef]
- Tonelli, M.; Karumanchi, S.A.; Thadhani, R. Epidemiology and Mechanisms of Uremia-Related Cardiovascular Disease. Circulation 2016, 133, 518–536. [Google Scholar] [CrossRef] [PubMed]
- Wang, X.; Shapiro, J.I. Evolving concepts in the pathogenesis of uraemic cardiomyopathy. Nat. Rev. Nephrol. 2019, 15, 159–175. [Google Scholar] [CrossRef]
- Foley, R.N.; Parfrey, P.S.; Harnett, J.D.; Kent, G.M.; Martin, C.J.; Murray, D.C.; Barre, P.E. Clinical and echocardiographic disease in patients starting end-stage renal disease therapy. Kidney Int. 1995, 47, 186–192. [Google Scholar] [CrossRef]
- Zuijdewijn, C.L.D.R.V.; Hansildaar, R.; Bots, M.L.; Blankestijn, P.J.; Dorpel, M.A.V.D.; Grooteman, M.P.; Kamp, O.; ter Wee, P.M.; Nubé, M.J. Eccentric Left Ventricular Hypertrophy and Sudden Death in Patients with End-Stage Kidney Disease. Am. J. Nephrol. 2015, 42, 126–133. [Google Scholar] [CrossRef]
- Wang, S.; Xue, H.; Zou, Y.; Sun, K.; Fu, C.; Wang, H.; Hui, R. Left ventricular hypertrophy, abnormal ventricular geometry and relative wall thickness are associated with increased risk of stroke in hypertensive patients among the Han Chinese. Hypertens. Res. 2014, 37, 870–874. [Google Scholar] [CrossRef]
- Christensen, J.; Landler, N.E.; Olsen, F.J.; Feldt-Rasmussen, B.; Hansen, D.; Kamper, A.-L.; Christoffersen, C.; Ballegaard, E.L.F.; Sørensen, I.M.H.; Bjergfelt, S.S.; et al. Left ventricular structure and function in patients with chronic kidney disease assessed by 3D echocardiography: The CPH-CKD ECHO study. Int. J. Cardiovasc. Imaging 2021, 38, 1233–1244. [Google Scholar] [CrossRef]
- Stewart, G.A.; Foster, J.; Cowan, M.; Rooney, E.; Mcdonagh, T.; Dargie, H.J.; Rodger, R.S.C.; Jardine, A. Echocardiography overestimates left ventricular mass in hemodialysis patients relative to magnetic resonance imaging. Kidney Int. 1999, 56, 2248–2253. [Google Scholar] [CrossRef]
- Grothues, F.; Smith, G.C.; Moon, J.C.; Bellenger, N.G.; Collins, P.; Klein, H.U.; Pennell, D.J. Comparison of interstudy reproducibility of cardiovascular magnetic resonance with two-dimensional echocardiography in normal subjects and in patients with heart failure or left ventricular hypertrophy. Am. J. Cardiol. 2002, 90, 29–34. [Google Scholar] [CrossRef] [PubMed]
- Badve, S.V.; Palmer, S.C.; Strippoli, G.F.; Roberts, M.A.; Teixeira-Pinto, A.; Boudville, N.; Cass, A.; Hawley, C.M.; Hiremath, S.S.; Pascoe, E.M.; et al. The Validity of Left Ventricular Mass as a Surrogate End Point for All-Cause and Cardiovascular Mortality Outcomes in People with CKD: A Systematic Review and Meta-Analysis. Am. J. Kidney Dis. 2016, 68, 554–563. [Google Scholar] [CrossRef]
- Odudu, A.; Eldehni, M.T.; McCann, G.P.; Horsfield, M.A.; Breidthardt, T.; McIntyre, C.W. Characterisation of cardiomyopathy by cardiac and aortic magnetic resonance in patients new to hemodialysis. Eur. Radiol. 2016, 26, 2749–2761. [Google Scholar] [CrossRef]
- Hayer, M.K.; Radhakrishnan, A.; Price, A.M.; Liu, B.; Baig, S.; Weston, C.J.; Biasiolli, L.; Ferro, C.J.; Townend, J.N.; Steeds, R.P.; et al. Defining Myocardial Abnormalities across the Stages of Chronic Kidney Disease. JACC Cardiovasc. Imaging 2020, 13, 2357–2367. [Google Scholar] [CrossRef]
- Mark, P.; Johnston, N.; Groenning, B.; Foster, J.; Blyth, K.; Martin, T.; Steedman, T.; Dargie, H.; Jardine, A. Redefinition of uremic cardiomyopathy by contrast-enhanced cardiac magnetic resonance imaging. Kidney Int. 2006, 69, 1839–1845. [Google Scholar] [CrossRef] [PubMed]
- Price, A.M.; Hayer, M.K.; Vijapurapu, R.; Fyyaz, S.A.; Moody, W.E.; Ferro, C.J.; Townend, J.N.; Steeds, R.P.; Edwards, N.C. Myocardial characterization in pre-dialysis chronic kidney disease: A study of prevalence, patterns and outcomes. BMC Cardiovasc. Disord. 2019, 19, 295. [Google Scholar] [CrossRef]
- Edwards, N.C.; Moody, W.E.; Yuan, M.; Hayer, M.K.; Ferro, C.J.; Townend, J.N.; Steeds, R.P. Diffuse Interstitial Fibrosis and Myocardial Dysfunction in Early Chronic Kidney Disease. Am. J. Cardiol. 2015, 115, 1311–1317. [Google Scholar] [CrossRef] [PubMed]
- Graham-Brown, M.P.; March, D.S.; Churchward, D.R.; Stensel, D.J.; Singh, A.; Arnold, R.; Burton, J.O.; McCann, G.P. Novel cardiac nuclear magnetic resonance method for noninvasive assessment of myocardial fibrosis in hemodialysis patients. Kidney Int. 2016, 90, 835–844. [Google Scholar] [CrossRef] [PubMed]
- Rutherford, E.; Talle, M.A.; Mangion, K.; Bell, E.; Rauhalammi, S.M.; Roditi, G.; McComb, C.; Radjenovic, A.; Welsh, P.; Woodward, R.; et al. Defining myocardial tissue abnormalities in end-stage renal failure with cardiac magnetic resonance imaging using native T1 mapping. Kidney Int. 2016, 90, 845–852. [Google Scholar] [CrossRef]
- Antlanger, M.; Aschauer, S.; Kammerlander, A.A.; Duca, F.; Säemann, M.D.; Bonderman, D.; Mascherbauer, J. Impact of Systemic Volume Status on Cardiac Magnetic Resonance T1 Mapping. Sci. Rep. 2018, 8, 5572. [Google Scholar] [CrossRef] [PubMed]
- Chen, M.; Arcari, L.; Engel, J.; Freiwald, T.; Platschek, S.; Zhou, H.; Zainal, H.; Buettner, S.; Zeiher, A.M.; Geiger, H.; et al. Aortic stiffness is independently associated with interstitial myocardial fibrosis by native T1 and accelerated in the presence of chronic kidney disease. IJC Heart Vasc. 2019, 24, 100389. [Google Scholar] [CrossRef] [PubMed]
- Arcari, L.; Hinojar, R.; Engel, J.; Freiwald, T.; Platschek, S.; Zainal, H.; Zhou, H.; Vasquez, M.; Keller, T.; Rolf, A.; et al. Native T1 and T2 provide distinctive signatures in hypertrophic cardiac conditions—Comparison of uremic, hypertensive and hypertrophic cardiomyopathy. Int. J. Cardiol. 2020, 306, 102–108. [Google Scholar] [CrossRef] [PubMed]
- Han, X.; He, F.; Cao, Y.; Li, Y.; Gu, J.; Shi, H. Associations of B-type natriuretic peptide (BNP) and dialysis vintage with CMRI-derived cardiac indices in stable hemodialysis patients with a preserved left ventricular ejection fraction. Int. J. Cardiovasc. Imaging 2020, 36, 2265–2278. [Google Scholar] [CrossRef] [PubMed]
- Lin, L.; Xie, Q.; Zheng, M.; Zhou, X.; Dekkers, I.A.; Tao, Q.; Lamb, H.J. Identification of cardiovascular abnormalities by multiparametric magnetic resonance imaging in end-stage renal disease patients with preserved left ventricular ejection fraction. Eur. Radiol. 2021, 31, 7098–7109. [Google Scholar] [CrossRef]
- Qin, L.; Gu, S.; Xiao, R.; Liu, P.; Yan, F.; Yu, H.; Yang, W. Value of native T1 mapping in the prediction of major adverse cardiovascular events in hemodialysis patients. Eur. Radiol. 2022, 32, 6878–6890. [Google Scholar] [CrossRef]
- Arcari, L.; Engel, J.; Freiwald, T.; Zhou, H.; Zainal, H.; Gawor, M.; Buettner, S.; Geiger, H.; Hauser, I.; Nagel, E.; et al. Cardiac biomarkers in chronic kidney disease are independently associated with myocardial edema and diffuse fibrosis by cardiovascular magnetic resonance. J. Cardiovasc. Magn. Reson. 2021, 23, 71. [Google Scholar] [CrossRef]
- Kotecha, T.; Martinez-Naharro, A.; Yoowannakul, S.; Lambe, T.; Rezk, T.; Knight, D.S.; Hawkins, P.N.; Moon, J.C.; Muthurangu, V.; Kellman, P.; et al. Acute changes in cardiac structural and tissue characterisation parameters following haemodialysis measured using cardiovascular magnetic resonance. Sci. Rep. 2019, 9, 1388. [Google Scholar] [CrossRef]
- Rankin, A.J.; Mangion, K.; Lees, J.S.; Rutherford, E.; Gillis, K.A.; Edy, E.; Dymock, L.; Treibel, T.A.; Radjenovic, A.; Patel, R.K.; et al. Myocardial changes on 3T cardiovascular magnetic resonance imaging in response to haemodialysis with fluid removal. J. Cardiovasc. Magn. Reson. 2021, 23, 125. [Google Scholar] [CrossRef]
- Graham-Brown, M.; Churchward, D.R.; Hull, K.L.; Preston, R.; Pickering, W.P.; Eborall, H.C.; McCann, G.P.; Burton, J.O. Cardiac Remodelling in Patients Undergoing in-Centre Nocturnal Haemodialysis: Results from the MIDNIGHT Study, a Non-Randomized Controlled Trial. Blood Purif. 2017, 44, 301–310. [Google Scholar] [CrossRef]
- Ramchand, J.; Iskandar, J.-P.; Layoun, H.; Puri, R.; Chetrit, M.; Burrell, L.M.; Krishnaswamy, A.; Griffin, B.P.; Yun, J.J.; Flamm, S.D.; et al. Effect of Myocardial Tissue Characterization Using Native T1 to Predict the Occurrence of Adverse Events in Patients with Chronic Kidney Disease and Severe Aortic Stenosis. Am. J. Cardiol. 2022, 183, 85–92. [Google Scholar] [CrossRef] [PubMed]
- Magunia, H.; Dietrich, C.; Langer, H.F.; Schibilsky, D.; Schlensak, C.; Rosenberger, P.; Nowak-Machen, M. 3D echocardiography derived right ventricular function is associated with right ventricular failure and mid-term survival after left ventricular assist device implantation. Int. J. Cardiol. 2018, 272, 348–355. [Google Scholar] [CrossRef] [PubMed]
- Jain, V.; Gupta, K.; Bhatia, K.; Rajapreyar, I.; Singh, A.; Zhou, W.; Klein, A.; Nanda, N.C.; Prabhu, S.D.; Bajaj, N.S. Coronary flow abnormalities in chronic kidney disease: A systematic review and meta-analysis. Echocardiography 2022, 39, 1382–1390. [Google Scholar] [CrossRef] [PubMed]
- Kashioulis, P.; Guron, C.W.; Svensson, M.K.; Hammarsten, O.; Saeed, A.; Guron, G. Patients with moderate chronic kidney disease without heart disease have reduced coronary flow velocity reserve. ESC Heart Fail. 2020, 7, 2797–2806. [Google Scholar] [CrossRef] [PubMed]
- Arcari, L.; Ciavarella, G.M.; Altieri, S.; Limite, L.R.; Russo, D.; Luciani, M.; De Biase, L.; Mené, P.; Volpe, M. Longitudinal changes of left and right cardiac structure and function in patients with end-stage renal disease on replacement therapy. Eur. J. Intern. Med. 2020, 78, 95–100. [Google Scholar] [CrossRef]
- Liang, H.-Y.; Hsiao, Y.-L.; Yeh, H.-C.; Ting, I.-W.; Lin, C.-C.; Chiang, H.-Y.; Kuo, C.-C. Associations between Myocardial Diastolic Dysfunction and Cardiovascular Mortality in Chronic Kidney Disease: A Large Single-Center Cohort Study. J. Am. Soc. Echocardiogr. 2022, 35, 395–407. [Google Scholar] [CrossRef]
- Kim, M.K.; Kim, B.; Lee, J.Y.; Kim, J.S.; Han, B.-G.; Choi, S.O.; Yang, J.W. Tissue Doppler-derived E/e’ ratio as a parameter for assessing diastolic heart failure and as a predictor of mortality in patients with chronic kidney disease. Korean J. Intern. Med. 2013, 28, 35–44. [Google Scholar] [CrossRef]
- Gan, G.C.; Bhat, A.; Chen, H.H.; Gu, K.H.; Fernandez, F.; Kadappu, K.K.; Byth, K.; Eshoo, S.; Thomas, L. Left Atrial Reservoir Strain by Speckle Tracking Echocardiography: Association with Exercise Capacity in Chronic Kidney Disease. J. Am. Heart Assoc. 2021, 10, e017840. [Google Scholar] [CrossRef]
- Ayer, A.; Banerjee, U.; Mills, C.; Donovan, C.; Nelson, L.; Shah, S.J.; Dubin, R.F. Left atrial strain is associated with adverse cardiovascular events in patients with end-stage renal disease: Findings from the Cardiac, Endothelial Function and Arterial Stiffness in ESRD (CERES) study. Hemodial. Int. 2022, 26, 323–334. [Google Scholar] [CrossRef]
- Garg, P.; Gosling, R.; Swoboda, P.; Jones, R.; Rothman, A.; Wild, J.M.; Kiely, D.G.; Condliffe, R.; Alabed, S.; Swift, A.J. Cardiac magnetic resonance identifies raised left ventricular filling pressure: Prognostic implications. Eur. Heart J. 2022, 43, 2511–2522. [Google Scholar] [CrossRef] [PubMed]
- Wali, R.K.; Wang, G.S.; Gottlieb, S.S.; Bellumkonda, L.; Hansalia, R.; Ramos, E.; Drachenberg, C.; Papadimitriou, J.; Brisco, M.A.; Blahut, S.; et al. Effect of kidney transplantation on left ventricular systolic dysfunction and congestive heart failure in patients with end-stage renal disease. J. Am. Coll. Cardiol. 2005, 45, 1051–1060. [Google Scholar] [CrossRef] [PubMed]
- Hensen, L.C.; Goossens, K.; Delgado, V.; Abou, R.; Rotmans, J.I.; Jukema, J.W.; Bax, J.J. Prevalence of left ventricular systolic dysfunction in pre-dialysis and dialysis patients with preserved left ventricular ejection fraction. Eur. J. Heart Fail. 2018, 20, 560–568. [Google Scholar] [CrossRef] [PubMed]
- Hayer, M.K.; Price, A.M.; Liu, B.; Baig, S.; Ferro, C.J.; Townend, J.N.; Steeds, R.P.; Edwards, N.C. Diffuse Myocardial Interstitial Fibrosis and Dysfunction in Early Chronic Kidney Disease. Am. J. Cardiol. 2018, 121, 656–660. [Google Scholar] [CrossRef] [PubMed]
- Sulemane, S.; Panoulas, V.F.; Bratsas, A.; Grapsa, J.; Brown, E.A.; Nihoyannopoulos, P. Subclinical markers of cardiovascular disease predict adverse outcomes in chronic kidney disease patients with normal left ventricular ejection fraction. Int. J. Cardiovasc. Imaging 2017, 33, 687–698. [Google Scholar] [CrossRef] [PubMed]
- Prasad, G.V.R.; Yan, A.T.; Nash, M.M.; Kim, S.J.; Wald, R.; Wald, R.; Lok, C.; Gunaratnam, L.; Karur, G.R.; Kirpalani, A.; et al. Determinants of Left Ventricular Characteristics Assessed by Cardiac Magnetic Resonance Imaging and Cardiovascular Biomarkers Related to Kidney Transplantation. Can. J. Kidney Health Dis. 2018, 5, 2054358118809974. [Google Scholar] [CrossRef]
- Barbosa, M.F.; Contti, M.M.; de Andrade, L.G.M.; Mauricio, A.D.C.V.; Ribeiro, S.M.; Szarf, G. Feature-tracking cardiac magnetic resonance left ventricular global longitudinal strain improves 6 months after kidney transplantation associated with reverse remodeling, not myocardial tissue characteristics. Int. J. Cardiovasc. Imaging 2021, 37, 3027–3037. [Google Scholar] [CrossRef]
- Paneni, F.; Gregori, M.; Ciavarella, G.M.; Sciarretta, S.; De Biase, L.; Marino, L.; Tocci, G.; Principe, F.; Domenici, A.; Luciani, R.; et al. Right Ventricular Dysfunction in Patients with End-Stage Renal Disease. Am. J. Nephrol. 2010, 32, 432–438. [Google Scholar] [CrossRef]
- Hickson, L.J.; Negrotto, S.M.; Onuigbo, M.; Scott, C.G.; Rule, A.D.; Norby, S.M.; Albright, R.C.; Casey, E.T.; Dillon, J.J.; Pellikka, P.A.; et al. Echocardiography Criteria for Structural Heart Disease in Patients with End-Stage Renal Disease Initiating Hemodialysis. J. Am. Coll. Cardiol. 2016, 67, 1173–1182. [Google Scholar] [CrossRef]
- Matsuo, H.; Dohi, K.; Machida, H.; Takeuchi, H.; Aoki, T.; Nishimura, H.; Yasutomi, M.; Senga, M.; Ichikawa, T.; Kakuta, K.; et al. Echocardiographic Assessment of Cardiac Structural and Functional Abnormalities in Patients with End-Stage Renal Disease Receiving Chronic Hemodialysis. Circ. J. 2018, 82, 586–595. [Google Scholar] [CrossRef]
- Sin, H.; Wong, P.; Lo, K.; Lo, M.; Chan, S.; Lo, K.; Wong, Y.; Ho, L.; Kwok, W.; Chan, K.; et al. Evaluation of the relationship between cardiac calcification and cardiovascular disease using the echocardiographic calcium score in patients undergoing peritoneal dialysis: A cross-sectional study. Singap. Med. J. 2022. [Google Scholar] [CrossRef] [PubMed]
- Bai, J.; Zhang, X.; Zhang, A.; Zhang, Y.; Ren, K.; Ren, Z.; Zhao, C.; Wang, Q.; Cao, N. Cardiac valve calcification is associated with mortality in hemodialysis patients: A retrospective cohort study. BMC Nephrol. 2022, 23, 43. [Google Scholar] [CrossRef]
- Zhu, J.; Tang, C.; Ouyang, H.; Shen, H.; You, T.; Hu, J. Prediction of All-Cause Mortality Using an Echocardiography-Based Risk Score in Hemodialysis Patients. Cardiorenal Med. 2021, 11, 33–43. [Google Scholar] [CrossRef] [PubMed]
- Sharma, R.; Pellerin, D.; Gaze, D.C.; Mehta, R.L.; Gregson, H.; Streather, C.P.; Collinson, P.O.; Brecker, S.J. Mitral annular calcification predicts mortality and coronary artery disease in end stage renal disease. Atherosclerosis 2007, 191, 348–354. [Google Scholar] [CrossRef]
- Hensen, L.C.; el Mahdiui, M.; van Rosendael, A.R.; Smit, J.M.; Jukema, J.W.; Bax, J.J.; Delgado, V. Prevalence and Prognostic Implications of Mitral and Aortic Valve Calcium in Patients with Chronic Kidney Disease. Am. J. Cardiol. 2018, 122, 1732–1737. [Google Scholar] [CrossRef]
- Braun, J.; Oldendorf, M.; Moshage, W.; Heidler, R.; Zeitler, E.; Luft, F.C. Electron beam computed tomography in the evaluation of cardiac calcifications in chronic dialysis patients. Am. J. Kidney Dis. 1996, 27, 394–401. [Google Scholar] [CrossRef] [PubMed]
- Goodman, W.G.; Goldin, J.; Kuizon, B.D.; Yoon, C.; Gales, B.; Sider, D.; Wang, Y.; Chung, J.; Emerick, A.; Greaser, L.; et al. Coronary-Artery Calcification in Young Adults with End-Stage Renal Disease Who Are Undergoing Dialysis. N. Engl. J. Med. 2000, 342, 1478–1483. [Google Scholar] [CrossRef]
- Kramer, H.; Toto, R.; Peshock, R.; Cooper, R.; Victor, R. Association between Chronic Kidney Disease and Coronary Artery Calcification. J. Am. Soc. Nephrol. 2005, 16, 507–513. [Google Scholar] [CrossRef]
- Mukai, H.; Dai, L.; Chen, Z.; Lindholm, B.; Ripsweden, J.; Brismar, T.B.; Heimbürger, O.; Barany, P.; Qureshi, A.R.; Söderberg, M.; et al. Inverse J-shaped relation between coronary arterial calcium density and mortality in advanced chronic kidney disease. Nephrol. Dial. Transplant. 2020, 35, 1202–1211. [Google Scholar] [CrossRef]
- Havel, M.; Kaminek, M.; Metelkova, I.; Budikova, M.; Henzlova, L.; Koranda, P.; Zadražil, J.; Kincl, V. Prognostic value of myocardial perfusion imaging and coronary artery calcium measurements in patients with end-stage renal disease. Hell. J. Nucl. Med. 2015, 18, 199–206. [Google Scholar] [CrossRef]
- Russo, D.; Corrao, S.; Battaglia, Y.; Andreucci, M.; Caiazza, A.; Carlomagno, A.; Lamberti, M.; Pezone, N.; Pota, A.; Russo, L.; et al. Progression of coronary artery calcification and cardiac events in patients with chronic renal disease not receiving dialysis. Kidney Int. 2011, 80, 112–118. [Google Scholar] [CrossRef] [PubMed]
- Fujiu, A.; Ogawa, T.; Matsuda, N.; Ando, Y.; Nitta, K. Aortic Arch Calcification and Arterial Stiffness Are Independent Factors for Diastolic Left Ventricular Dysfunction in Chronic Hemodialysis Patients. Circ. J. 2008, 72, 1768–1772. [Google Scholar] [CrossRef] [PubMed]
- Furusawa, K.; Takeshita, K.; Suzuki, S.; Tatami, Y.; Morimoto, R.; Okumura, T.; Yasuda, Y.; Murohara, T. Assessment of abdominal aortic calcification by computed tomography for prediction of latent left ventricular stiffness and future cardiovascular risk in pre-dialysis patients with chronic kidney disease: A single center cross-sectional study. Int. J. Med. Sci. 2019, 16, 939–948. [Google Scholar] [CrossRef]
- Edwards, N.C.; Ferro, C.; Townend, J.; Steeds, R. Aortic distensibility and arterial-ventricular coupling in early chronic kidney disease: A pattern resembling heart failure with preserved ejection fraction. Heart 2008, 94, 1038–1043. [Google Scholar] [CrossRef]
- Chue, C.D.; Edwards, N.C.; Ferro, C.J.; Townend, J.; Steeds, R. Effects of age and chronic kidney disease on regional aortic distensibility: A cardiovascular magnetic resonance study. Int. J. Cardiol. 2013, 168, 4249–4254. [Google Scholar] [CrossRef] [PubMed]
- Lang, R.M.; Badano, L.P.; Mor-Avi, V.; Afilalo, J.; Armstrong, A.; Ernande, L.; Flachskampf, F.A.; Foster, E.; Goldstein, S.A.; Kuznetsova, T.; et al. Recommendations for Cardiac Chamber Quantification by Echocardiography in Adults: An Update from the American Society of Echocardiography and the European Association of Cardiovascular Imaging. J. Am. Soc. Echocardiogr. 2015, 28, 412. [Google Scholar] [CrossRef]
- Eckardt, K.-U.; Scherhag, A.; Macdougall, I.C.; Tsakiris, D.; Clyne, N.; Locatelli, F.; Zaug, M.F.; Burger, H.U.; Drueke, T.B. Left Ventricular Geometry Predicts Cardiovascular Outcomes Associated with Anemia Correction in CKD. J. Am. Soc. Nephrol. 2009, 20, 2651–2660. [Google Scholar] [CrossRef]
- Lieb, W.; Gona, P.; Larson, M.G.; Aragam, J.; Zile, M.R.; Cheng, S.; Benjamin, E.J.; Vasan, R.S. The Natural History of Left Ventricular Geometry in the Community. JACC Cardiovasc. Imaging 2014, 7, 870–878. [Google Scholar] [CrossRef]
- Nagueh, S.F.; Smiseth, O.A.; Appleton, C.P.; Byrd, B.F., 3rd; Dokainish, H.; Edvardsen, T.; Flachskampf, F.A.; Gillebert, T.C.; Klein, A.L.; Lancellotti, P.; et al. Recommendations for the Evaluation of Left Ventricular Diastolic Function by Echocardiography: An Update from the American Society of Echocardiography and the European Association of Cardiovascular Imaging. J. Am. Soc. Echocardiogr. 2016, 29, 277–314. [Google Scholar] [CrossRef]
- Dayco, J.S.; Kherallah, R.Y.; Epstein, J.; Adegbala, O.; Reji, C.; Dirani, K.; Oviedo, C.; Afonso, L. Correlation between Echocardiographic Diastolic Parameters and Invasive Measurements of Left Ventricular Filling Pressure in Patients with Takotsubo Cardiomyopathy. J. Am. Soc. Echocardiogr. 2022, in press. [CrossRef]
- Wu, V.C.-C.; Takeuchi, M.; Kuwaki, H.; Iwataki, M.; Nagata, Y.; Otani, K.; Haruki, N.; Yoshitani, H.; Tamura, M.; Abe, H.; et al. Prognostic Value of LA Volumes Assessed by Transthoracic 3D Echocardiography. JACC Cardiovasc. Imaging 2013, 6, 1025–1035. [Google Scholar] [CrossRef] [PubMed]
- Ma, C.; Liao, Y.; Fan, J.; Zhao, X.; Su, B.; Zhou, B. The novel left atrial strain parameters in diagnosing of heart failure with preserved ejection fraction. Echocardiography 2022, 39, 416. [Google Scholar] [CrossRef] [PubMed]
- Saha, S.A.; Beatty, A.L.; Mishra, R.K.; Whooley, M.A.; Schiller, N.B. Usefulness of an Echocardiographic Composite Cardiac Calcium Score to Predict Death in Patients with Stable Coronary Artery Disease (from the Heart and Soul Study). Am. J. Cardiol. 2015, 116, 50–58. [Google Scholar] [CrossRef] [PubMed]
- Laurent, S.; Cockcroft, J.; Van Bortel, L.; Boutouyrie, P.; Giannattasio, C.; Hayoz, D.; Pannier, B.; Vlachopoulos, C.; Wilkinson, I.; Struijker-Boudier, H. Expert consensus document on arterial stiffness: Methodological issues and clinical applications. Eur. Heart J. 2006, 27, 2588–2605. [Google Scholar] [CrossRef]
- Teixeira, R.; Vieira, M.J.; Gonçalves, A.; Cardim, N.; Gonçalves, L. Ultrasonographic vascular mechanics to assess arterial stiffness: A review. Eur. Heart J. Cardiovasc. Imaging 2016, 17, 233–246. [Google Scholar] [CrossRef]
- Suh, S.Y.; Kim, E.J.; Choi, C.U.; Na, J.O.; Kim, S.H.; Kim, H.J.; Han, S.W.; Chung, S.M.; Ryu, K.H.; Park, C.G.; et al. Aortic Upper Wall Tissue Doppler Image Velocity: Relation to Aortic Elasticity and Left Ventricular Diastolic Function. Echocardiography 2009, 26, 1069–1074. [Google Scholar] [CrossRef]
- Carluccio, E.; Biagioli, P.; Zuchi, C.; Bardelli, G.; Murrone, A.; Lauciello, R.; D’addario, S.; Mengoni, A.; Alunni, G.; Ambrosio, G. Fibrosis assessment by integrated backscatter and its relationship with longitudinal deformation and diastolic function in heart failure with preserved ejection fraction. Int. J. Cardiovasc. Imaging 2016, 32, 1071–1080. [Google Scholar] [CrossRef]
- Weinreb, J.C.; Rodby, R.A.; Yee, J.; Wang, C.L.; Fine, D.; McDonald, R.J.; Perazella, M.A.; Dillman, J.R.; Davenport, M.S. Use of Intravenous Gadolinium-Based Contrast Media in Patients with Kidney Disease: Consensus Statements from the American College of Radiology and the National Kidney Foundation. Kidney Med. 2021, 3, 142–150. [Google Scholar] [CrossRef]
- Schieda, N.; Maralani, P.J.; Hurrell, C.; Tsampalieros, A.K.; Hiremath, S. Updated Clinical Practice Guideline on Use of Gadolinium-Based Contrast Agents in Kidney Disease Issued by the Canadian Association of Radiologists. Can. Assoc. Radiol. J. 2019, 70, 226–232. [Google Scholar] [CrossRef]
- Arcari, L.; Camastra, G.; Ciolina, F.; Danti, M.; Cacciotti, L. T1 and T2 Mapping in Uremic Cardiomyopathy: An Update. Card. Fail. Rev. 2022, 8, e02. [Google Scholar] [CrossRef]
- Aoki, J.; Ikari, Y.; Nakajima, H.; Mori, M.; Sugimoto, T.; Hatori, M.; Tanimoto, S.; Amiya, E.; Hara, K. Clinical and pathologic characteristics of dilated cardiomyopathy in hemodialysis patients. Kidney Int. 2005, 67, 333–340. [Google Scholar] [CrossRef] [PubMed]
- Izumaru, K.; Hata, J.; Nakano, T.; Nakashima, Y.; Nagata, M.; Fukuhara, M.; Oda, Y.; Kitazono, T.; Ninomiya, T. Reduced Estimated GFR and Cardiac Remodeling: A Population-Based Autopsy Study. Am. J. Kidney Dis. 2019, 74, 373–381. [Google Scholar] [CrossRef] [PubMed]
- Hayer, M.K.; Radhakrishnan, A.; Price, A.M.; Baig, S.; Liu, B.; Ferro, C.; Captur, G.; Townend, J.; Moon, J.; Edwards, N.C.; et al. Early effects of kidney transplantation on the heart—A cardiac magnetic resonance multi-parametric study. Int. J. Cardiol. 2019, 293, 272–277. [Google Scholar] [CrossRef] [PubMed]
- Pedrizzetti, G.; Claus, P.; Kilner, P.J.; Nagel, E. Principles of cardiovascular magnetic resonance feature tracking and echocardiographic speckle tracking for informed clinical use. J. Cardiovasc. Magn. Reson. 2016, 18, 51. [Google Scholar] [CrossRef]
- Khatri, P.J.; Tandon, V.; Chen, L.; Yam, Y.; Chow, B.J. Can left ventricular end-diastolic volumes be estimated with prospective ECG-gated CT coronary angiography? Eur. J. Radiol. 2012, 81, 226–229. [Google Scholar] [CrossRef]
- Walpot, J.; Inácio, J.R.; Massalha, S.; Hossain, A.; Small, G.R.; Crean, A.M.; Yam, Y.; Rybicki, F.; Dwivedi, G.; Chow, B. Determining Early Remodeling Patterns in Diabetes and Hypertension Using Cardiac Computed Tomography: The Feasibility of Assessing Early LV Geometric Changes. Am. J. Hypertens. 2020, 33, 496–504. [Google Scholar] [CrossRef]
- Boczar, K.E.; Alam, M.; Chow, B.J.; Dwivedi, G. Incremental Prognostic Value of Estimated LV End-Diastolic Volume by Cardiac CT. JACC Cardiovasc. Imaging 2014, 7, 1280–1281. [Google Scholar] [CrossRef]
- Klein, R.; Ametepe, E.S.; Yam, Y.; Dwivedi, G.; Chow, B.J. Cardiac CT assessment of left ventricular mass in mid-diastasis and its prognostic value. Eur. Heart J. Cardiovasc. Imaging 2017, 18, 95–102. [Google Scholar] [CrossRef]
- Kang, D.K.; Thilo, C.; Schoepf, U.J.; Barraza, J.M.; Nance, J.W.; Bastarrika, G.; Abro, J.A.; Ravenel, J.G.; Costello, P.; Goldhaber, S.Z. CT Signs of Right Ventricular Dysfunction: Prognostic Role in Acute Pulmonary Embolism. JACC Cardiovasc. Imaging 2011, 4, 841–849. [Google Scholar] [CrossRef]
- Kurita, Y.; Kitagawa, K.; Kurobe, Y.; Nakamori, S.; Nakajima, H.; Dohi, K.; Ito, M.; Sakuma, H. Estimation of myocardial extracellular volume fraction with cardiac CT in subjects without clinical coronary artery disease: A feasibility study. J. Cardiovasc. Comput. Tomogr. 2016, 10, 237–241. [Google Scholar] [CrossRef]
- Gama, F.; Rosmini, S.; Bandula, S.; Patel, K.P.; Massa, P.; Tobon-Gomez, C.; Ecke, K.; Stroud, T.; Condron, M.; Thornton, G.D.; et al. Extracellular Volume Fraction by Computed Tomography Predicts Long-Term Prognosis among Patients with Cardiac Amyloidosis. JACC Cardiovasc. Imaging 2022, 15, 2082–2094. [Google Scholar] [CrossRef] [PubMed]
- Faucon, A.-L.; Bobrie, G.; Clément, O. Nephrotoxicity of iodinated contrast media: From pathophysiology to prevention strategies. Eur. J. Radiol. 2019, 116, 231–241. [Google Scholar] [CrossRef] [PubMed]


| Pathologic Abnormality | Echocardiography | Cardiac Magnetic Resonance | Computed Tomography | References | ||||||
|---|---|---|---|---|---|---|---|---|---|---|
| Value | Imaging Biomarker | Prognosis | Value | Imaging Biomarker | Prognosis | Value | Imaging Biomarker | Prognosis | ||
| LV hypertrophy | +++ | 2D- and 3D imaging | Yes | ++++ | b-SSFP cine imaging | Yes | + | Volumetric CT | No | [8,9,10,11,12,13,14,15,16] |
| Fibrosis | + | Backscatter echocardiography | No | ++++ | T1 mapping; LGE. | Yes | + | CT ECV | No | [16,17,18,19,20,21,22,23,24,25,26,27,28,29,30,31,32] |
| Edema | - | - | - | ++++ | T1 and T2 mapping | No | - | - | - | [16,24,25,26,28,29,30] |
| Microvascular dysfunction | ++ | PW Doppler | ++ | Perfusion imaging | No | - | - | - | [23,33,34,35] | |
| LV stiffness | +++ | PW-Doppler; tissue Doppler;sSpeckle tracking | Yes | + | Phase contrast imaging | No | - | - | - | [36,37,38,39,40,41] |
| LV systolic dysfunction | +++ | 2D-imaging; speckle tracking | Yes | ++++ | b-SSFP cine imaging; feature tracking | Yes | + | Cine CT | No | [16,21,42,43,44,45,46,47] |
| Right heart abnormalities | +++ | 2D and 3D imaging; CW-Doppler; tissue Doppler; speckle tracking | Yes | ++++ | b-SSFP cine imaging; feature tracking | Yes | + | Volumetric CT | No | [36,48,49] |
| Calcification | +++ | 2D-imaging | Yes | + | T1 and T2 weighted imaging | No | ++++ | Calcium score | Yes | [50,51,52,53,54,55,56,57,58,59,60,61,62,63] |
| Vascular stiffness | + | Tissue Doppler; speckle tracking | No | +++ | Phase-contrast imaging | No | ++ | Vascular calcification (indirect estimate) | Yes | [15,23,45,64,65] |
| Author (N) | Population | Sequence | Health | Disease | LGE (%) | ||
|---|---|---|---|---|---|---|---|
| 1.5T | 3T | 1.5T | 3T | ||||
| A. Fibrosis | |||||||
| Edwards (43) [19] | 60–15 mL/min/1.73 m2 | Native T1 (MOLLI 3(3)3(3)5) | 955 ± 30 | 986 ± 37 | 30 (0) | ||
| ECV | 0.25 ± 0.03 | 0.28 ± 0.04 | |||||
| Graham-Brown (35) [20] | Hemodialysis | Native T1 (MOLLI 3(3)3(3)5, 50°) | 1292.7 | 1088.8 | |||
| Rutherford (33) [21] | Hemodialysis | Native T1 (MOLLI 3(3)3(3)5 35°) | 1161 ± 29 | 1184 ± 34 | |||
| Antlanger (37) [22] | Hemodialysis | Native T1 (MOLLI 5(3)3 35°) | 998 ± 47 | 1022 ± 50 | |||
| Chen (276) [23] | ≤60 mL/min/1.73 m2 | Native T1 (MOLLI 3(2)3(2)5 50°) | 1123 ± 31 | 1152 ± 43 | 35 (16) | ||
| Arcari (154) [24] | ≤60 mL/min/1.73 m2 | Native T1 (MOLLI 3(2)3(2)5 50°) | 1062 ± 39 | 1161 ± 55 | 7 (4) | ||
| T2 FLASH | 35.8 ± 2.3 | 41.8 ± 5.2 | |||||
| Han (43) [25] | Hemodialysis | Native T1 (MOLLI 5(3)3 35°) | 1006 ± 25 | 1056 ± 32 | - | ||
| T2-SSFP | 46 ± 2 | 50 ± 3 | |||||
| Lin (23) [26] | Peritoneal dialysis | Native T1 (MOLLI 5(3)3 35°) | 1256 ± 45 | 1302 ± 30 | - | ||
| T2-TrueFISP | 40.5 ± 1.6 | 44.6 ± 2.6 | |||||
| Qin (52) [27] | Hemodialysis | Native T1 (MOLLI 5(3)3 20°) | 1238 ± 31 | 1280± 45 | |||
| B. Vascular stiffness | |||||||
| Edwards (117) [64] | 60–30 mL/min/1.73 m2 | AA distensibility | 4.12 × 10⁻³ | 2.94/2.18 × 10−3 (stage 3–2) | |||
| Chue (189) [65] | 90–15 mL/min/1.73 m2 | AA distensibility | 4.1 × 10⁻³ | 2.8 × 10⁻³ | |||
| Odudu (54) [15] | Hemodialysis | AA distensibility | 4.1 × 10⁻³ | 2 × 10⁻³ | |||
| PWV | 5.3 ± 1.9 | 7.9 ± 3.5 | |||||
| Chen (276) [23] | ≤60 mL/min/1.73 m2 | PWV | 7.3 ± 2.4 | 9.2 ± 2.6 | |||
Disclaimer/Publisher’s Note: The statements, opinions and data contained in all publications are solely those of the individual author(s) and contributor(s) and not of MDPI and/or the editor(s). MDPI and/or the editor(s) disclaim responsibility for any injury to people or property resulting from any ideas, methods, instructions or products referred to in the content. |
© 2023 by the authors. Licensee MDPI, Basel, Switzerland. This article is an open access article distributed under the terms and conditions of the Creative Commons Attribution (CC BY) license (https://creativecommons.org/licenses/by/4.0/).
Share and Cite
Valbuena-López, S.C.; Camastra, G.; Cacciotti, L.; Nagel, E.; Puntmann, V.O.; Arcari, L. Cardiac Imaging Biomarkers in Chronic Kidney Disease. Biomolecules 2023, 13, 773. https://doi.org/10.3390/biom13050773
Valbuena-López SC, Camastra G, Cacciotti L, Nagel E, Puntmann VO, Arcari L. Cardiac Imaging Biomarkers in Chronic Kidney Disease. Biomolecules. 2023; 13(5):773. https://doi.org/10.3390/biom13050773
Chicago/Turabian StyleValbuena-López, Silvia C., Giovanni Camastra, Luca Cacciotti, Eike Nagel, Valentina O. Puntmann, and Luca Arcari. 2023. "Cardiac Imaging Biomarkers in Chronic Kidney Disease" Biomolecules 13, no. 5: 773. https://doi.org/10.3390/biom13050773