
Enhanced Acetone Sensing Based on Group-11 Metal (Cu, Ag, and Au) Nanoparticles Embedded in Graphitic Carbon Nitride (gCN)
Abstract
:1. Introduction
2. Experimental Details
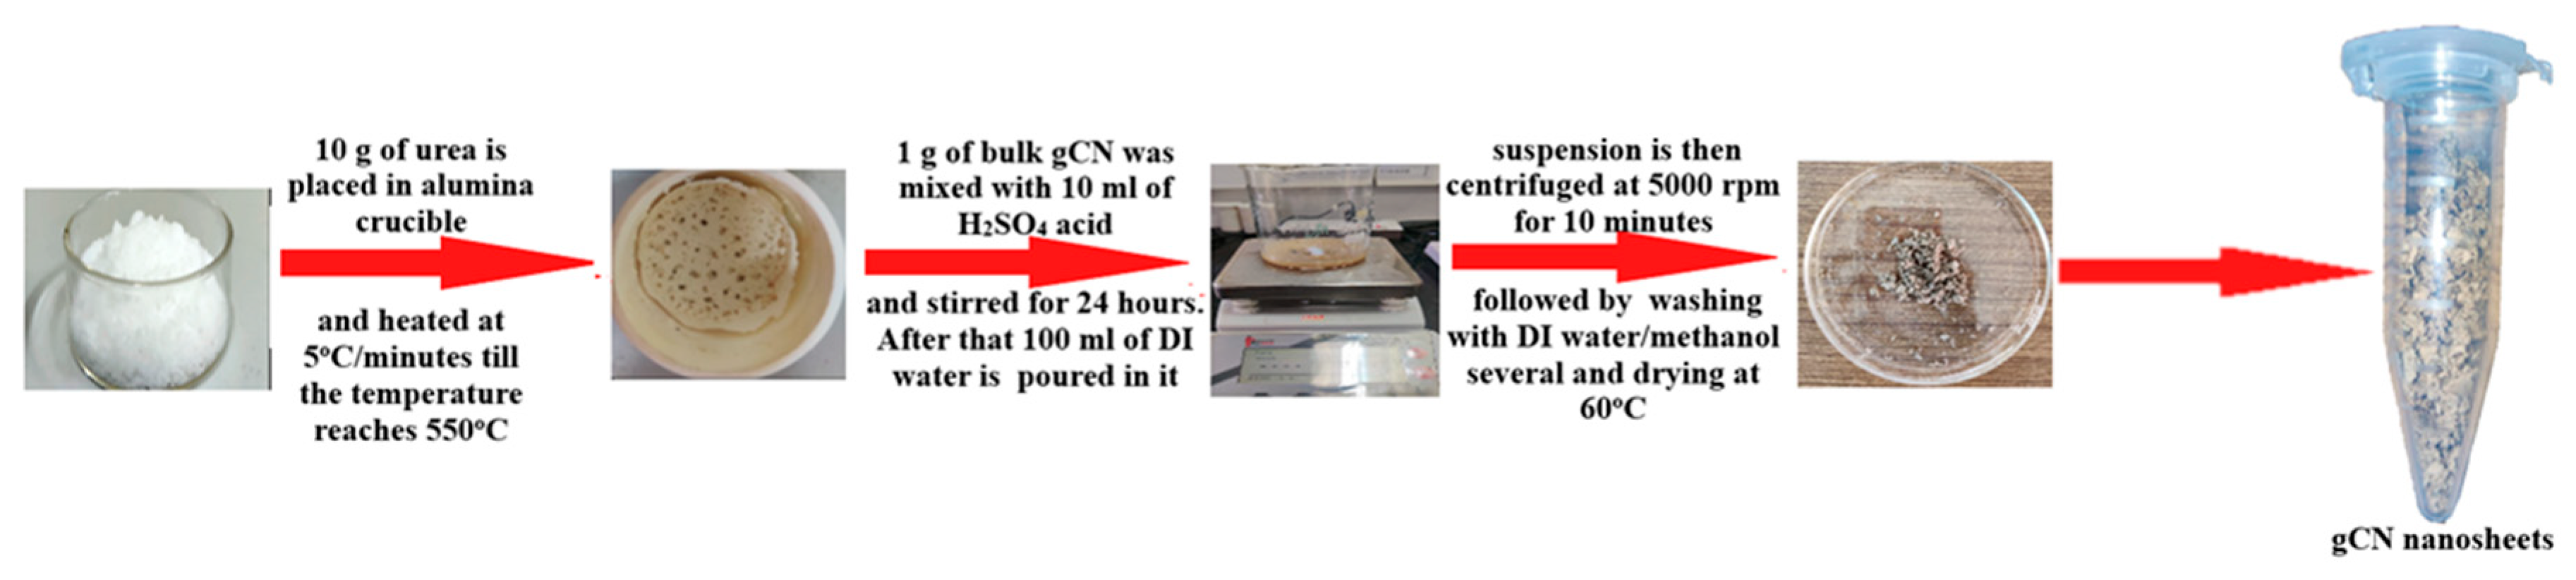
2.1. Synthesis of Bulk gCN and gCN Nanosheets
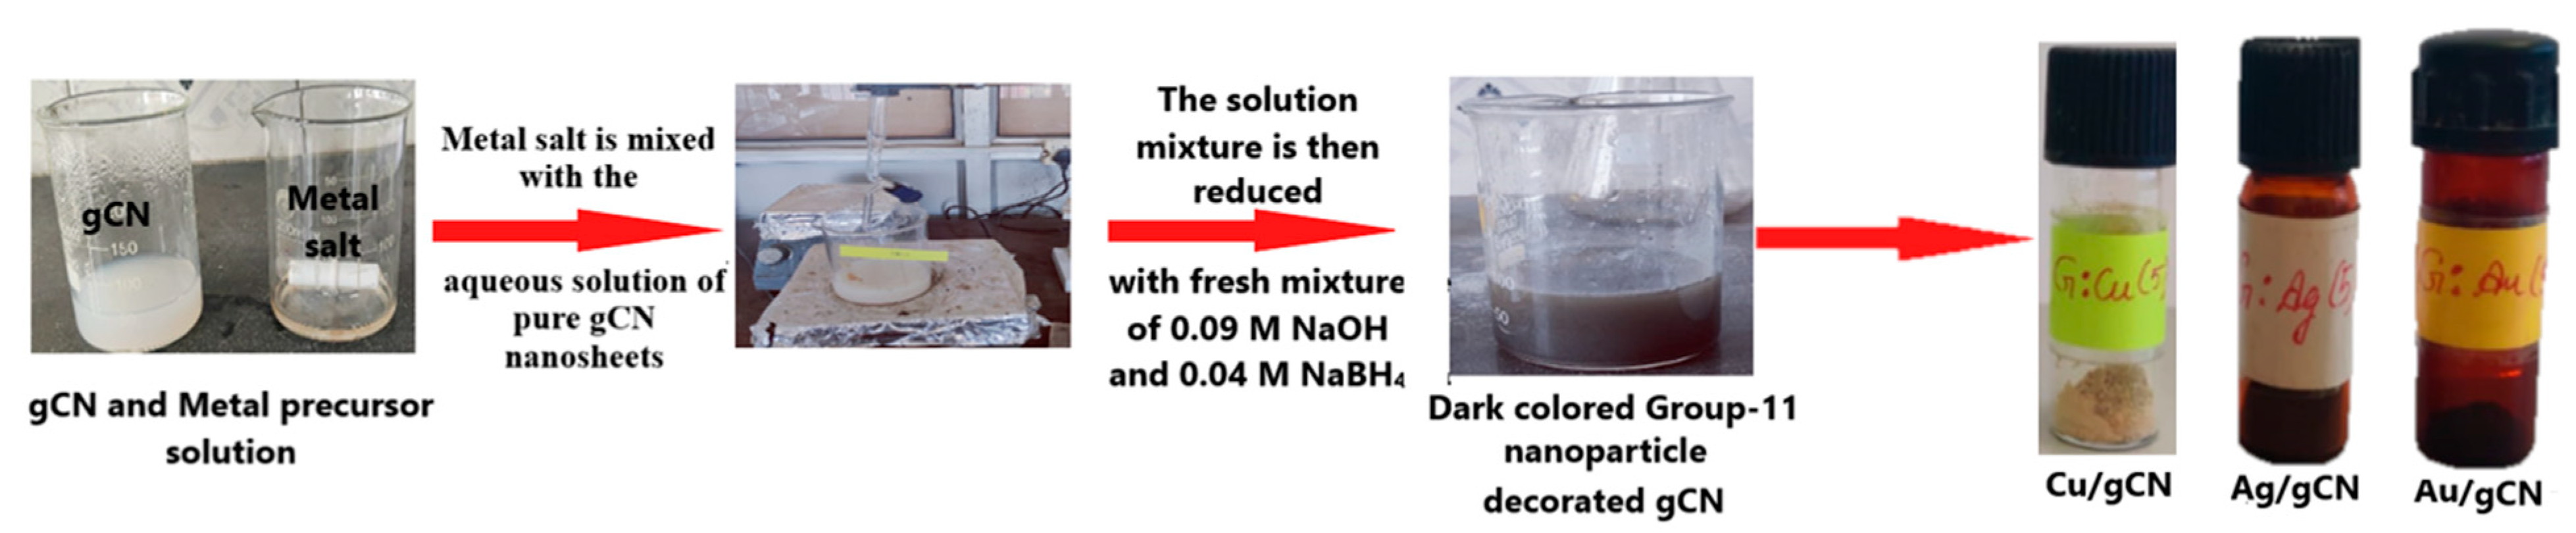
2.2. Synthesis of Group-11 TM Nanoparticles Embedded gCN
3. Material Characterizations
4. Results and Discussion
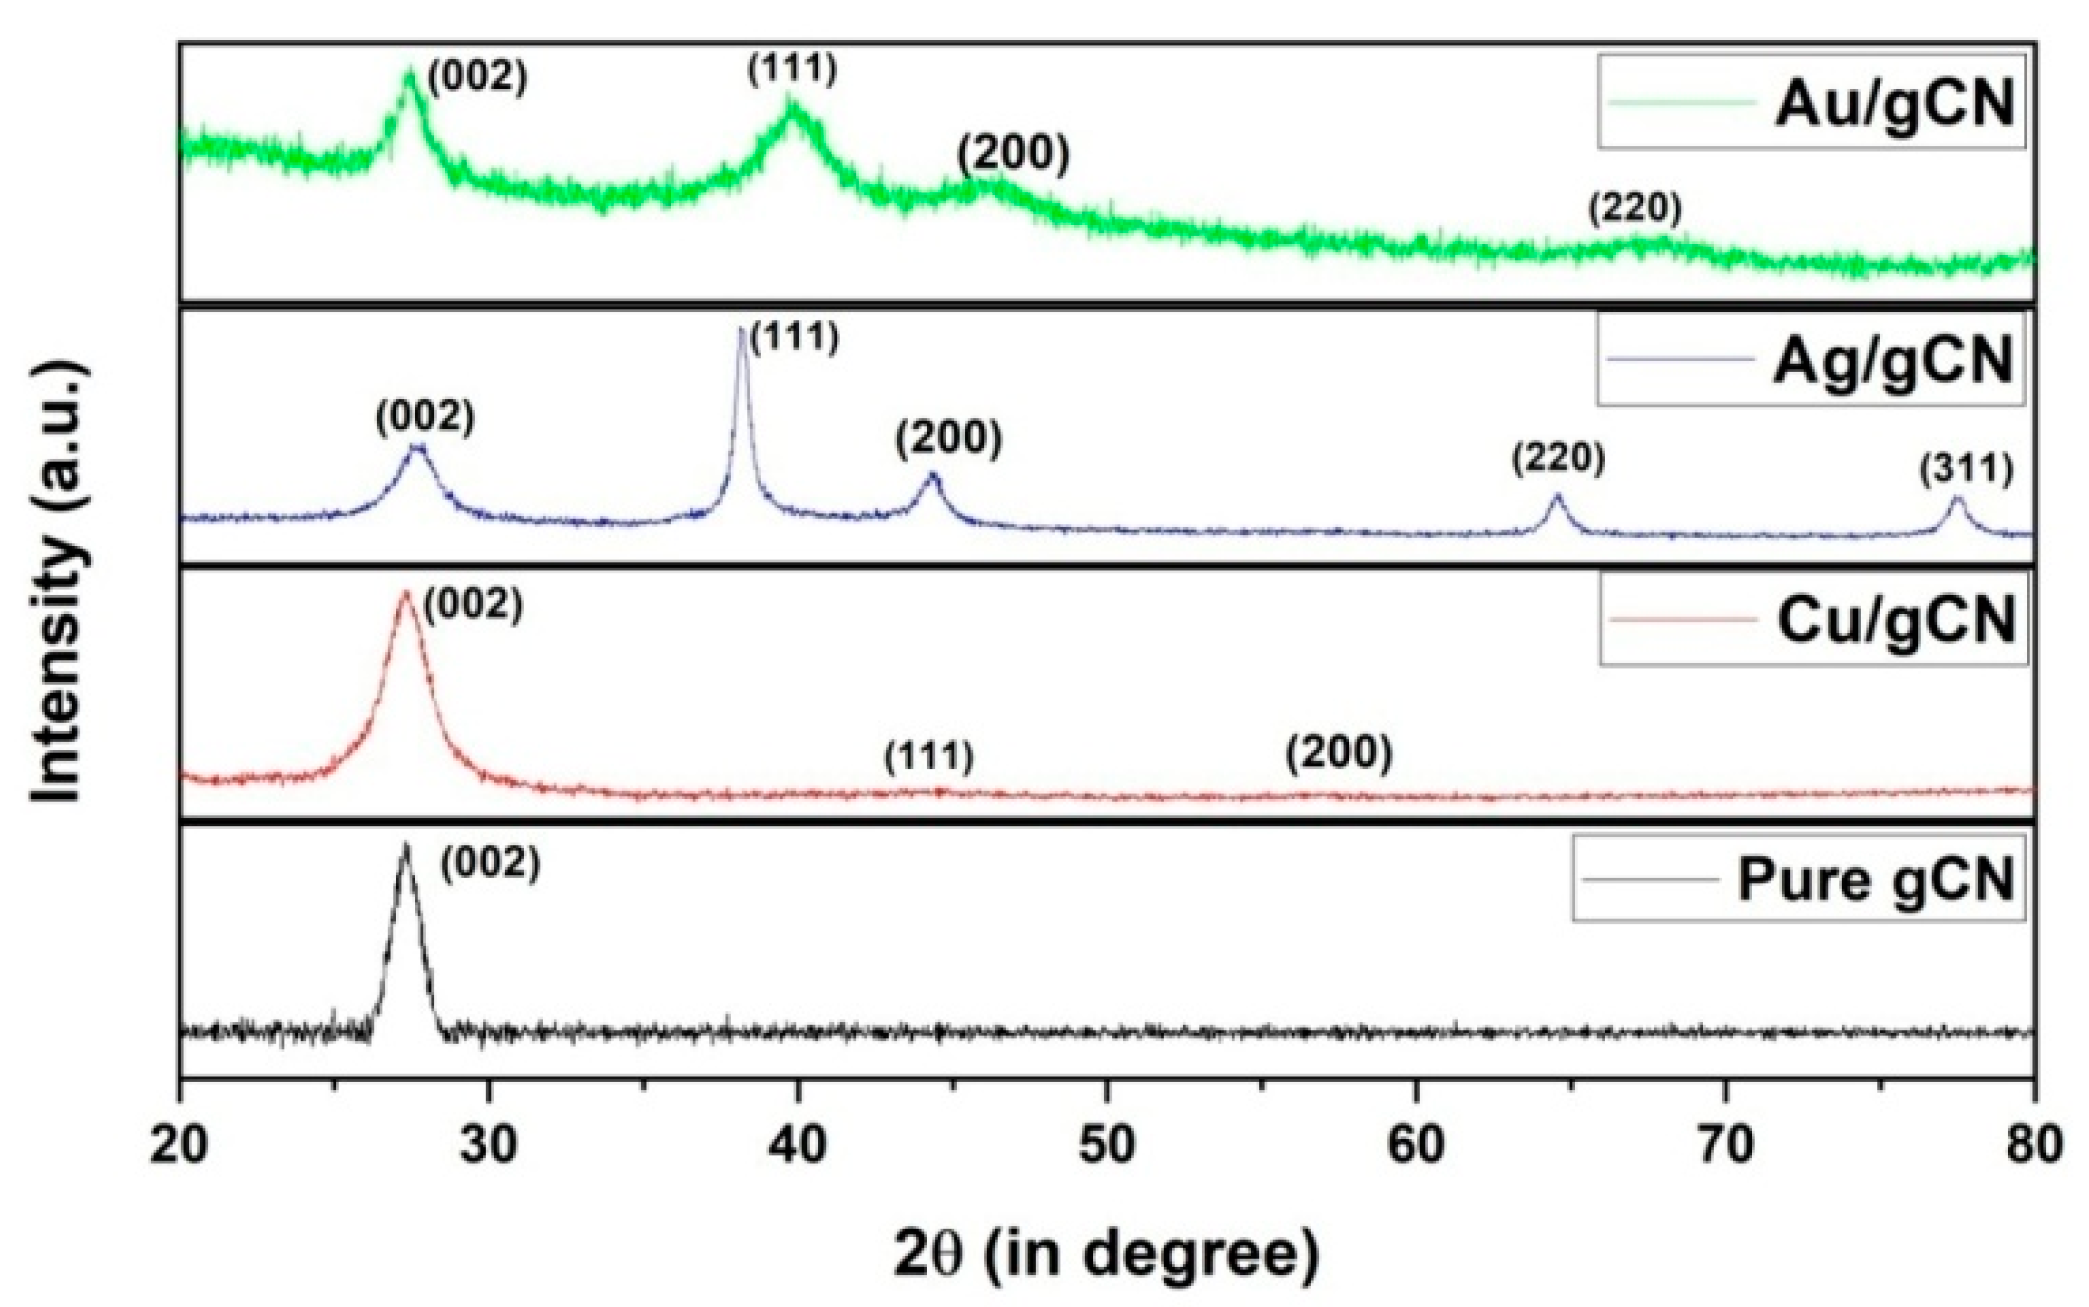
4.1. XRD
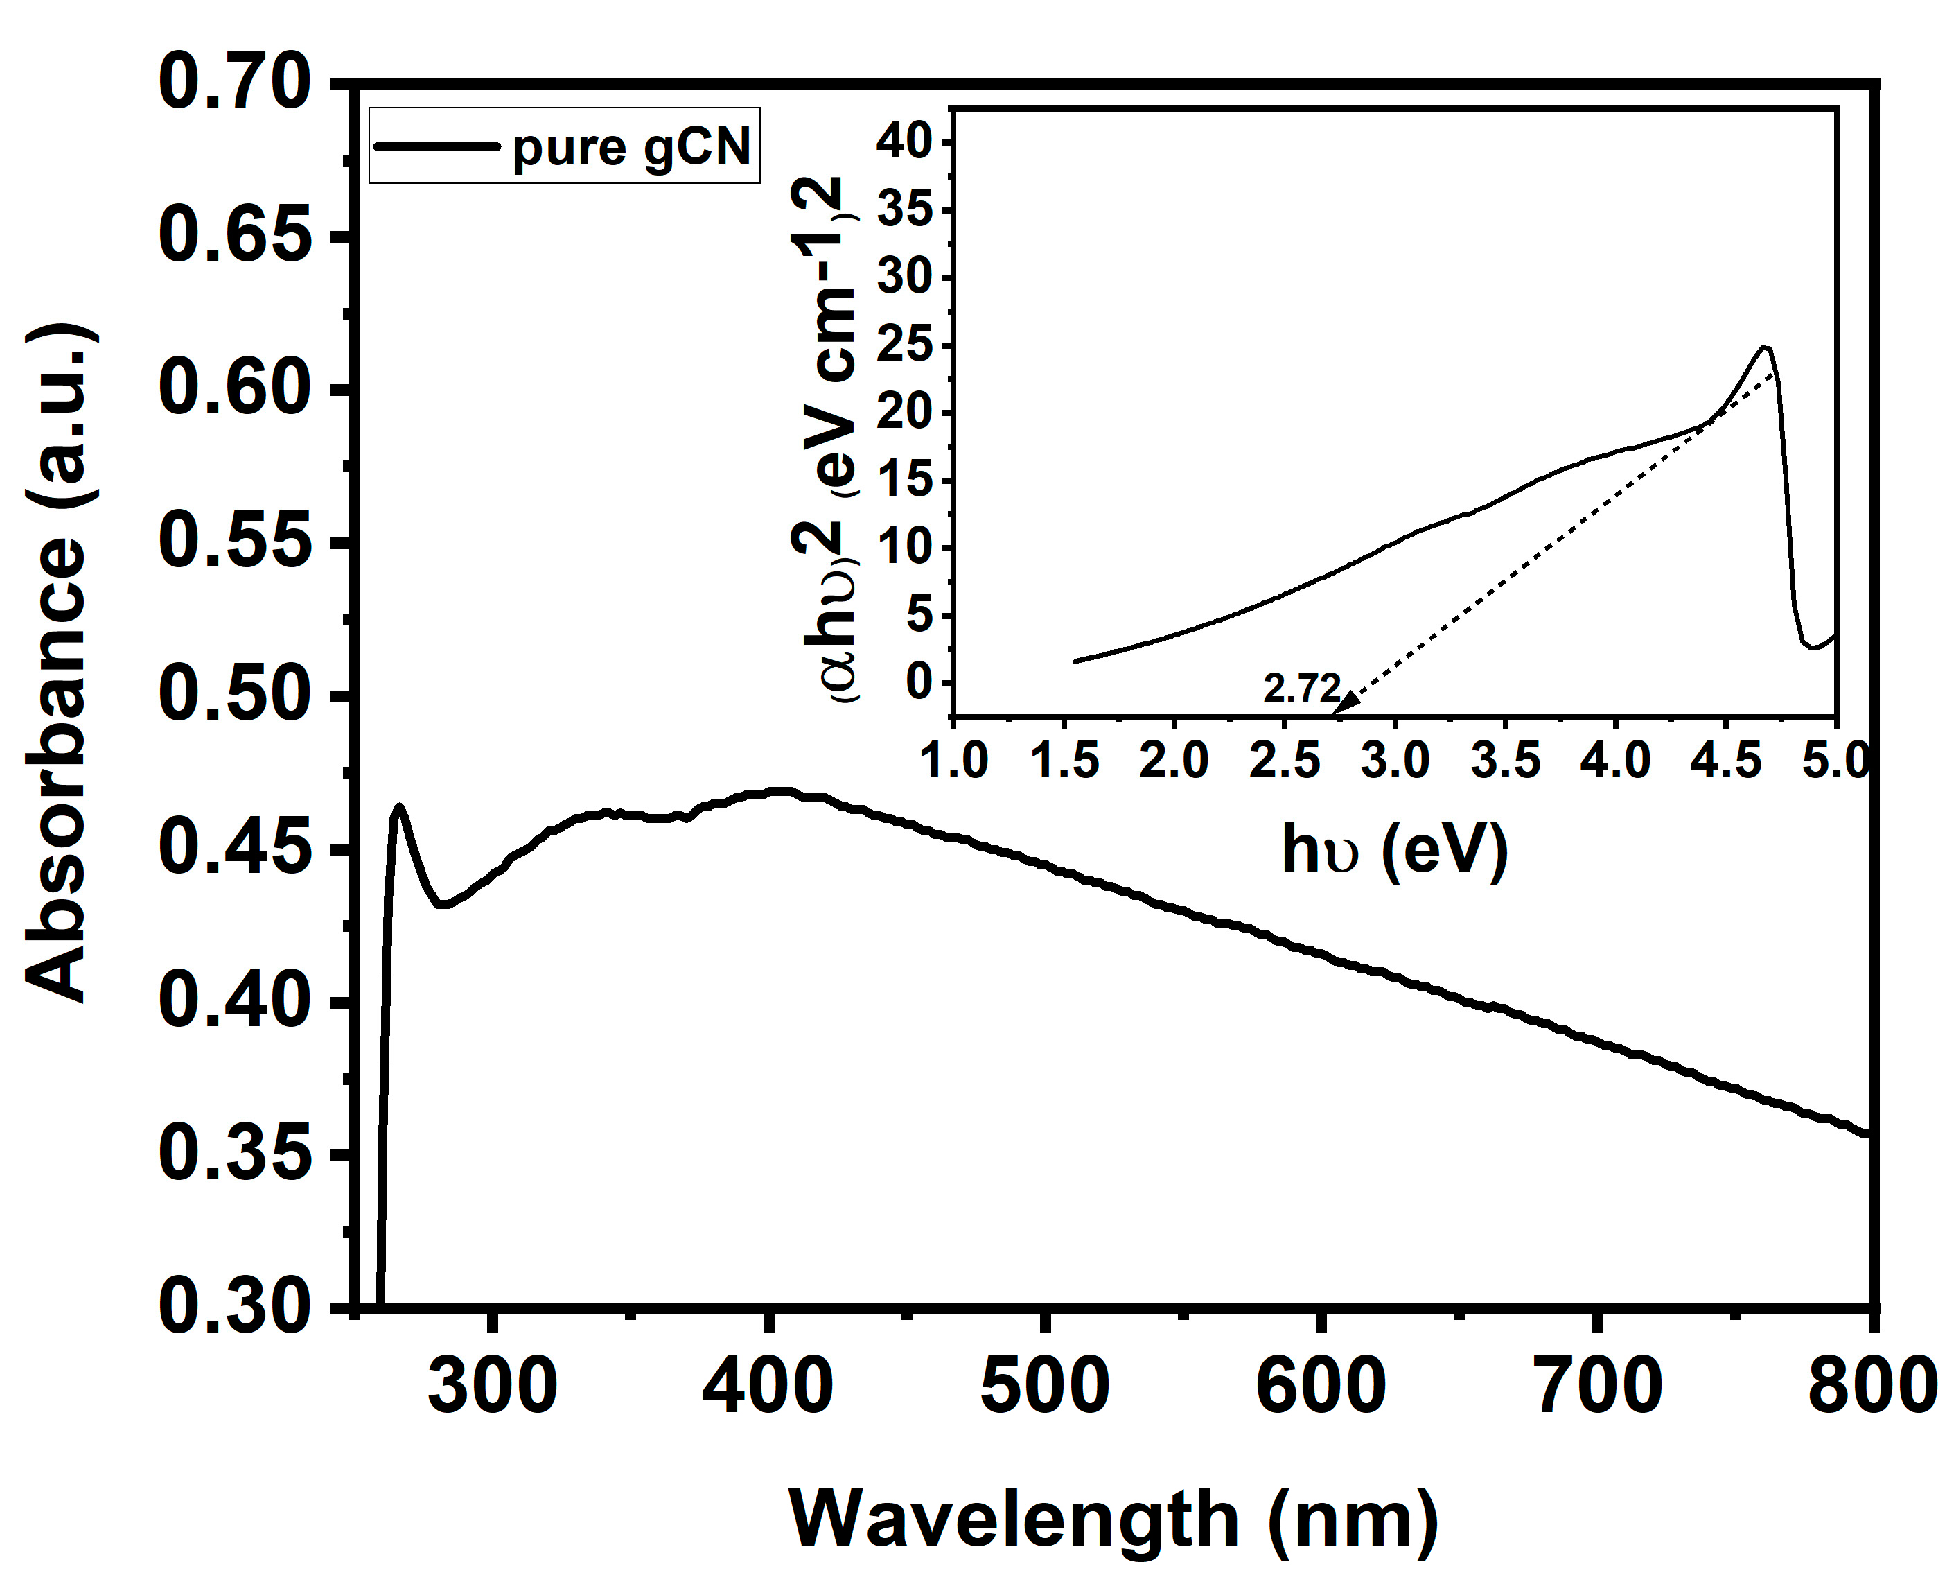
4.2. UV/Vis Spectroscopy
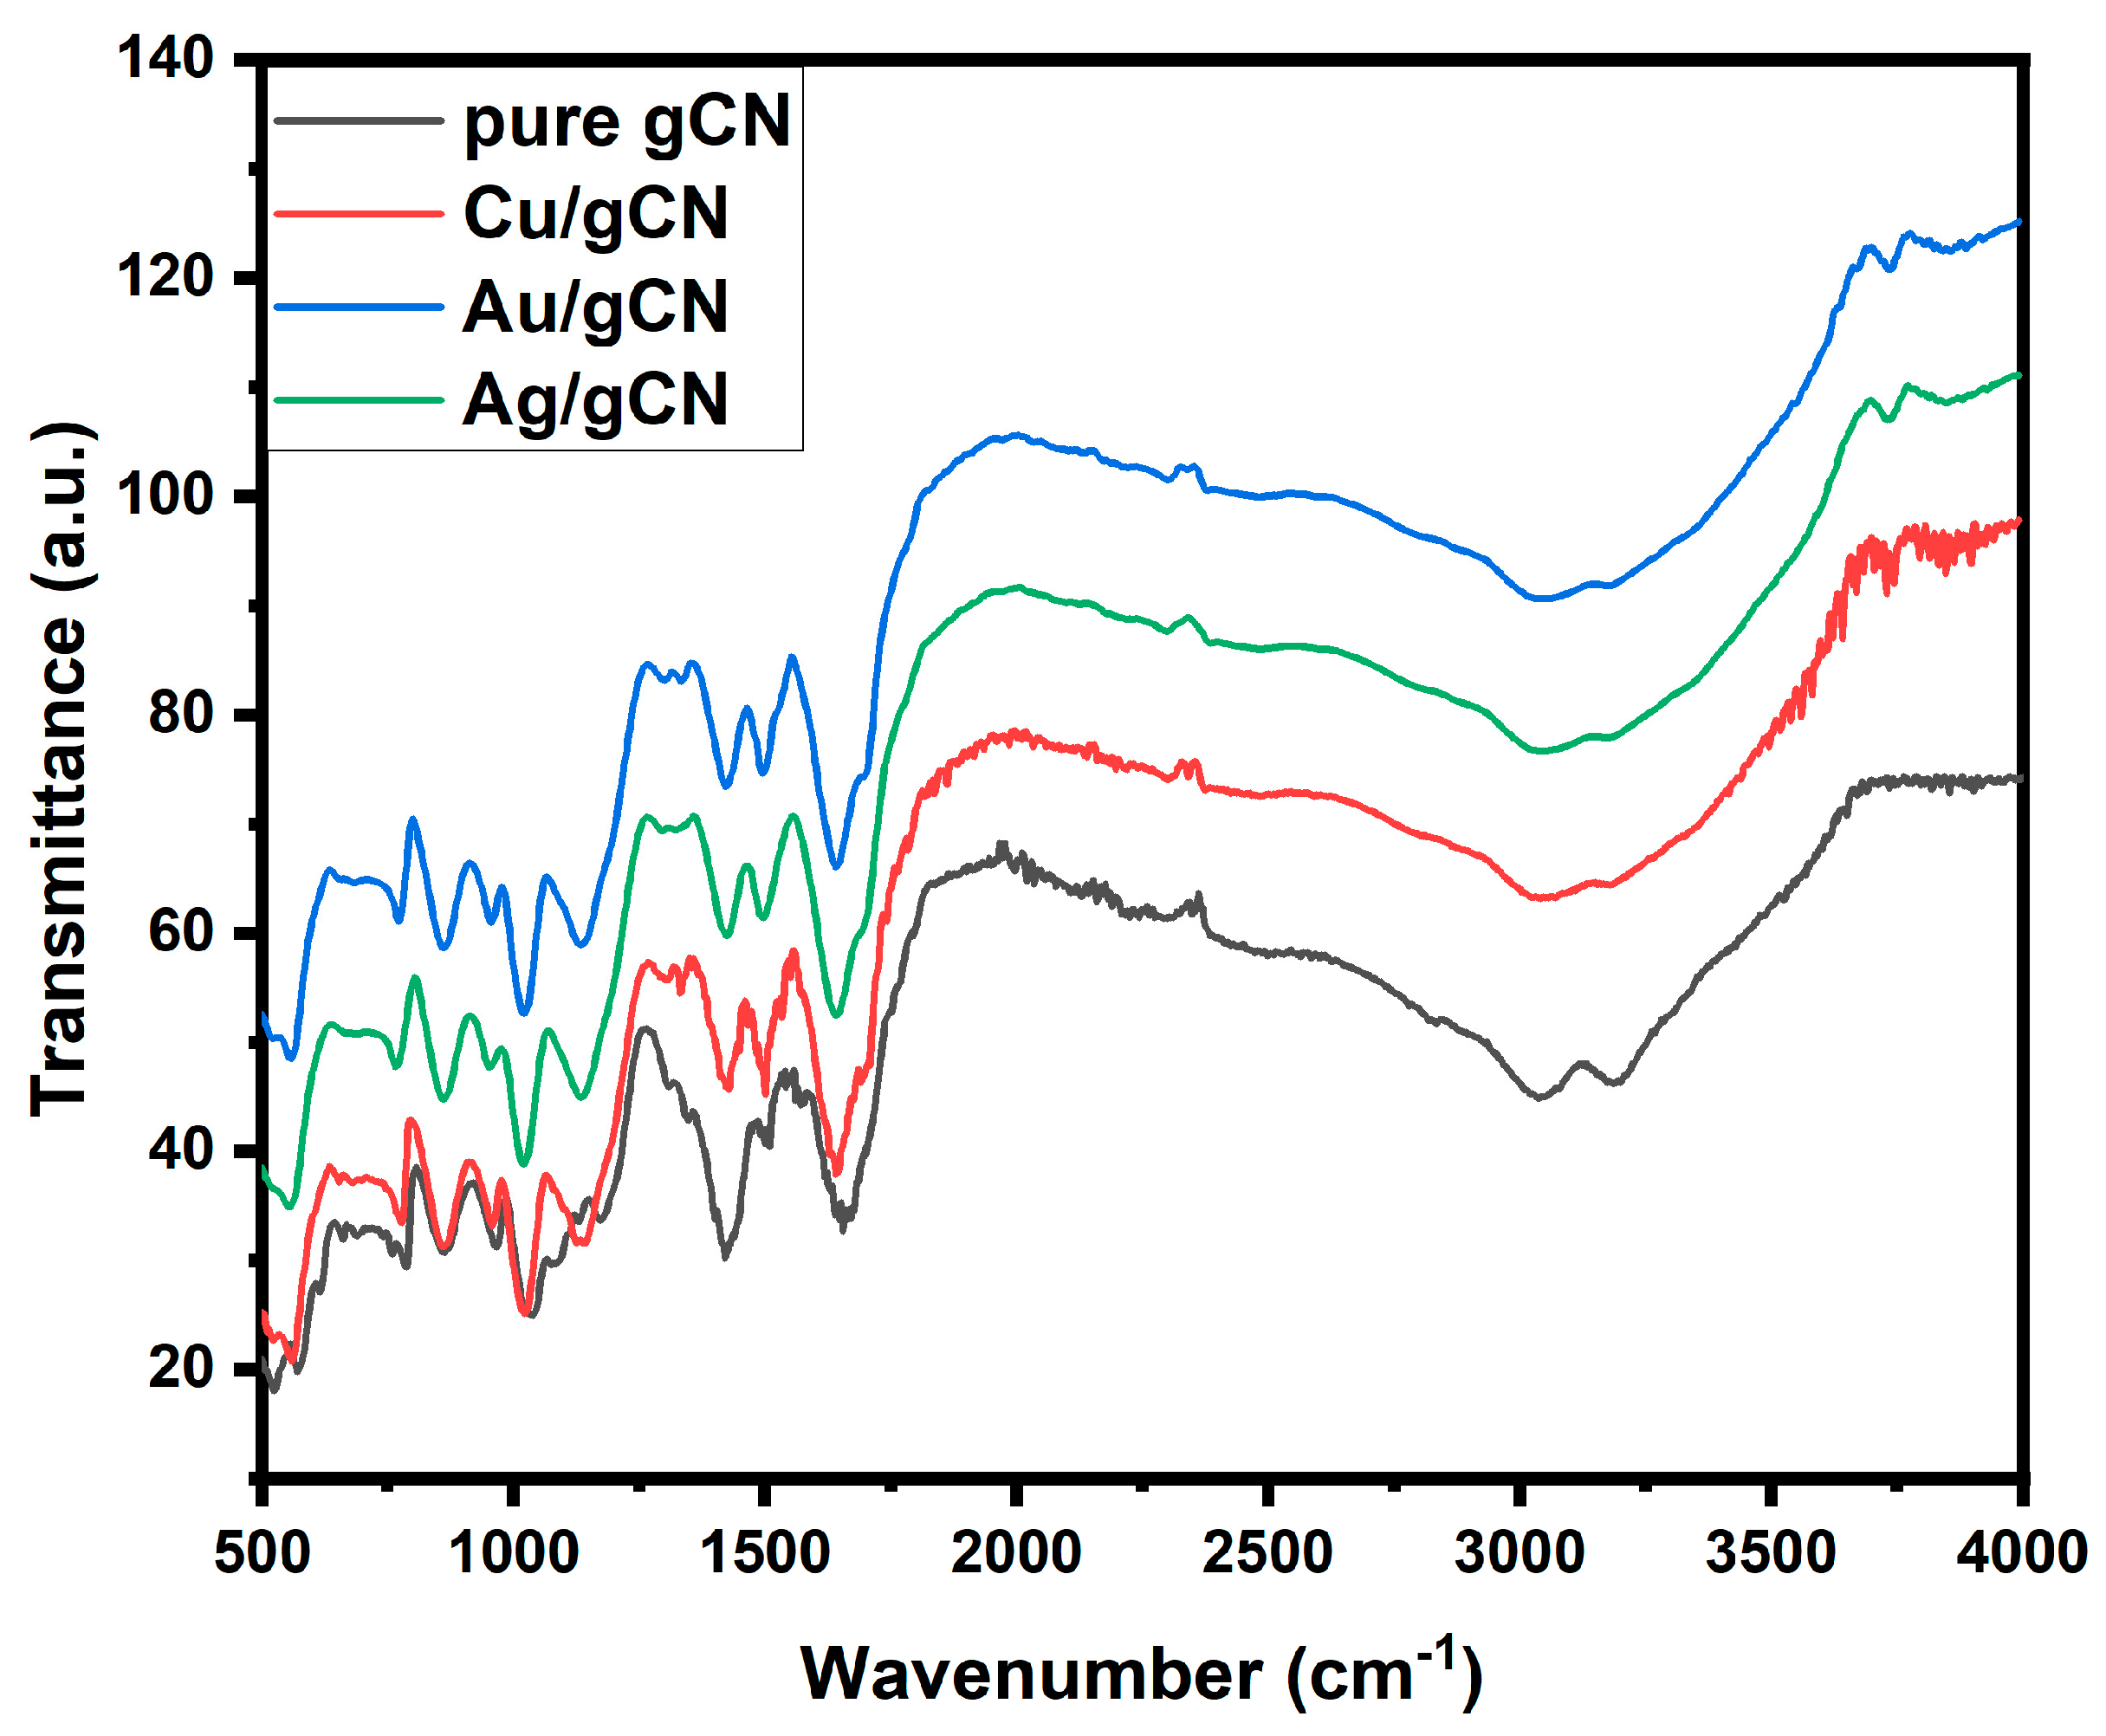
4.3. FTIR Spectroscopy
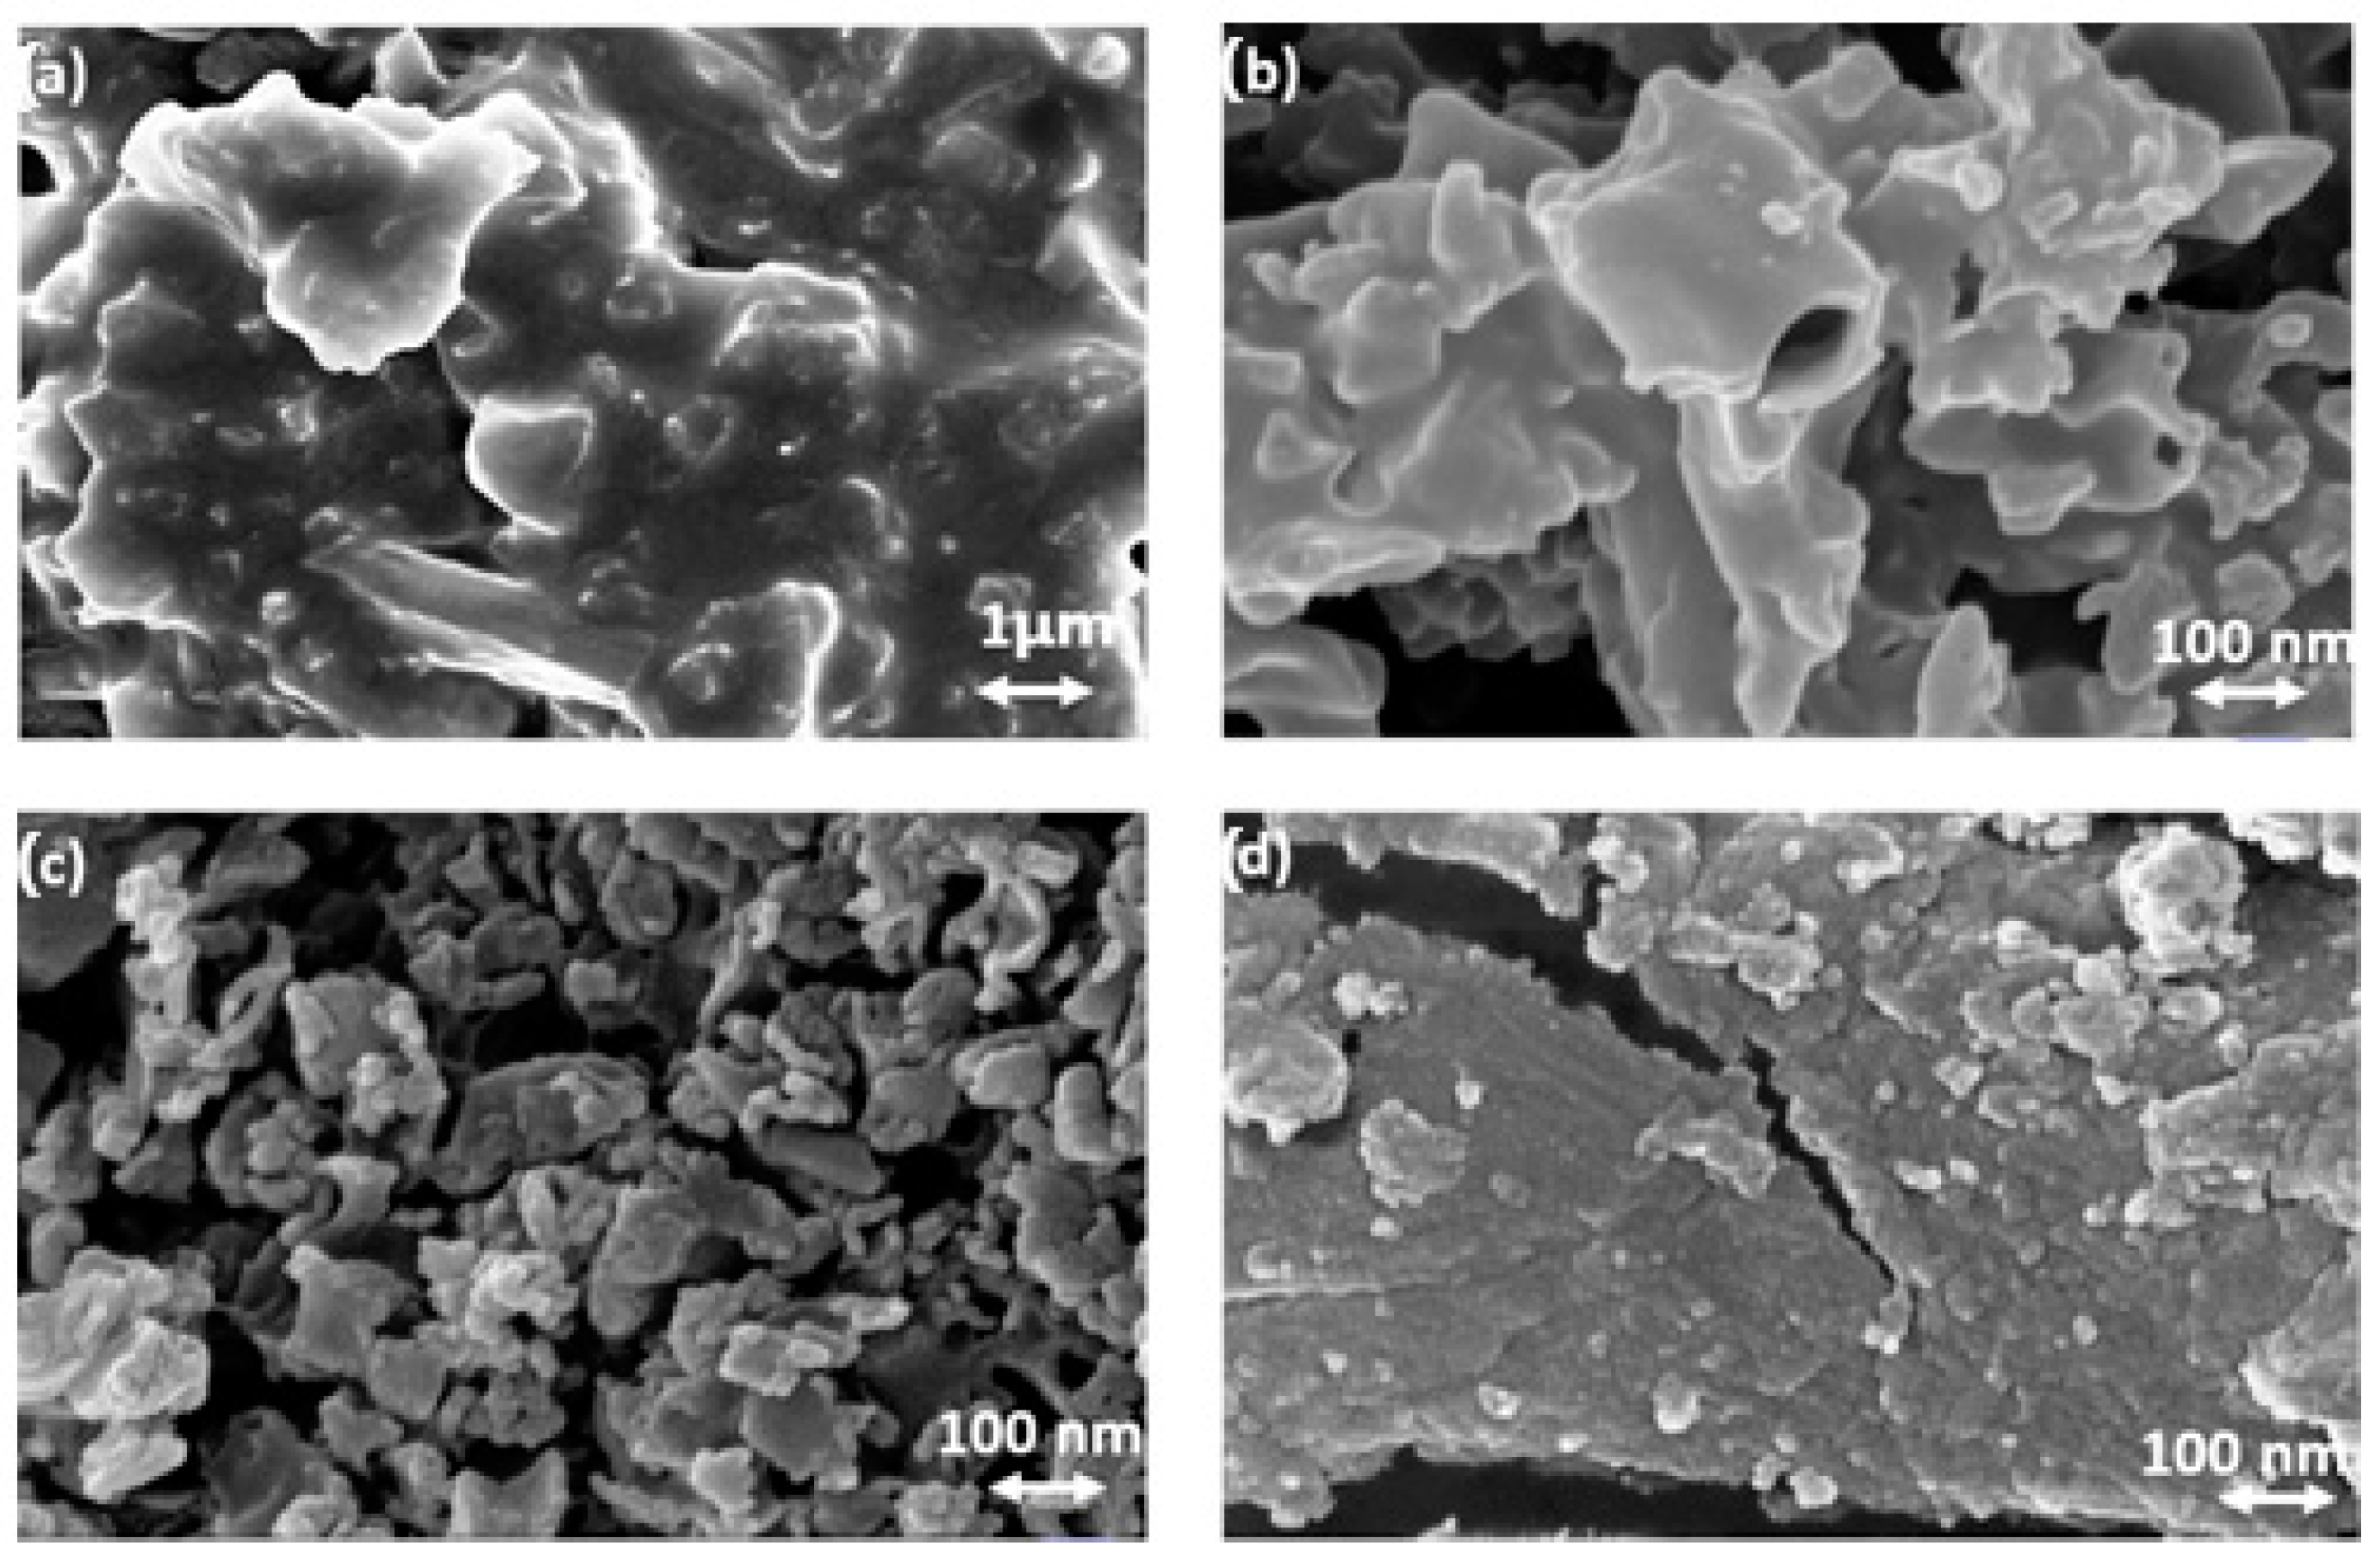
4.4. FESEM and EDS
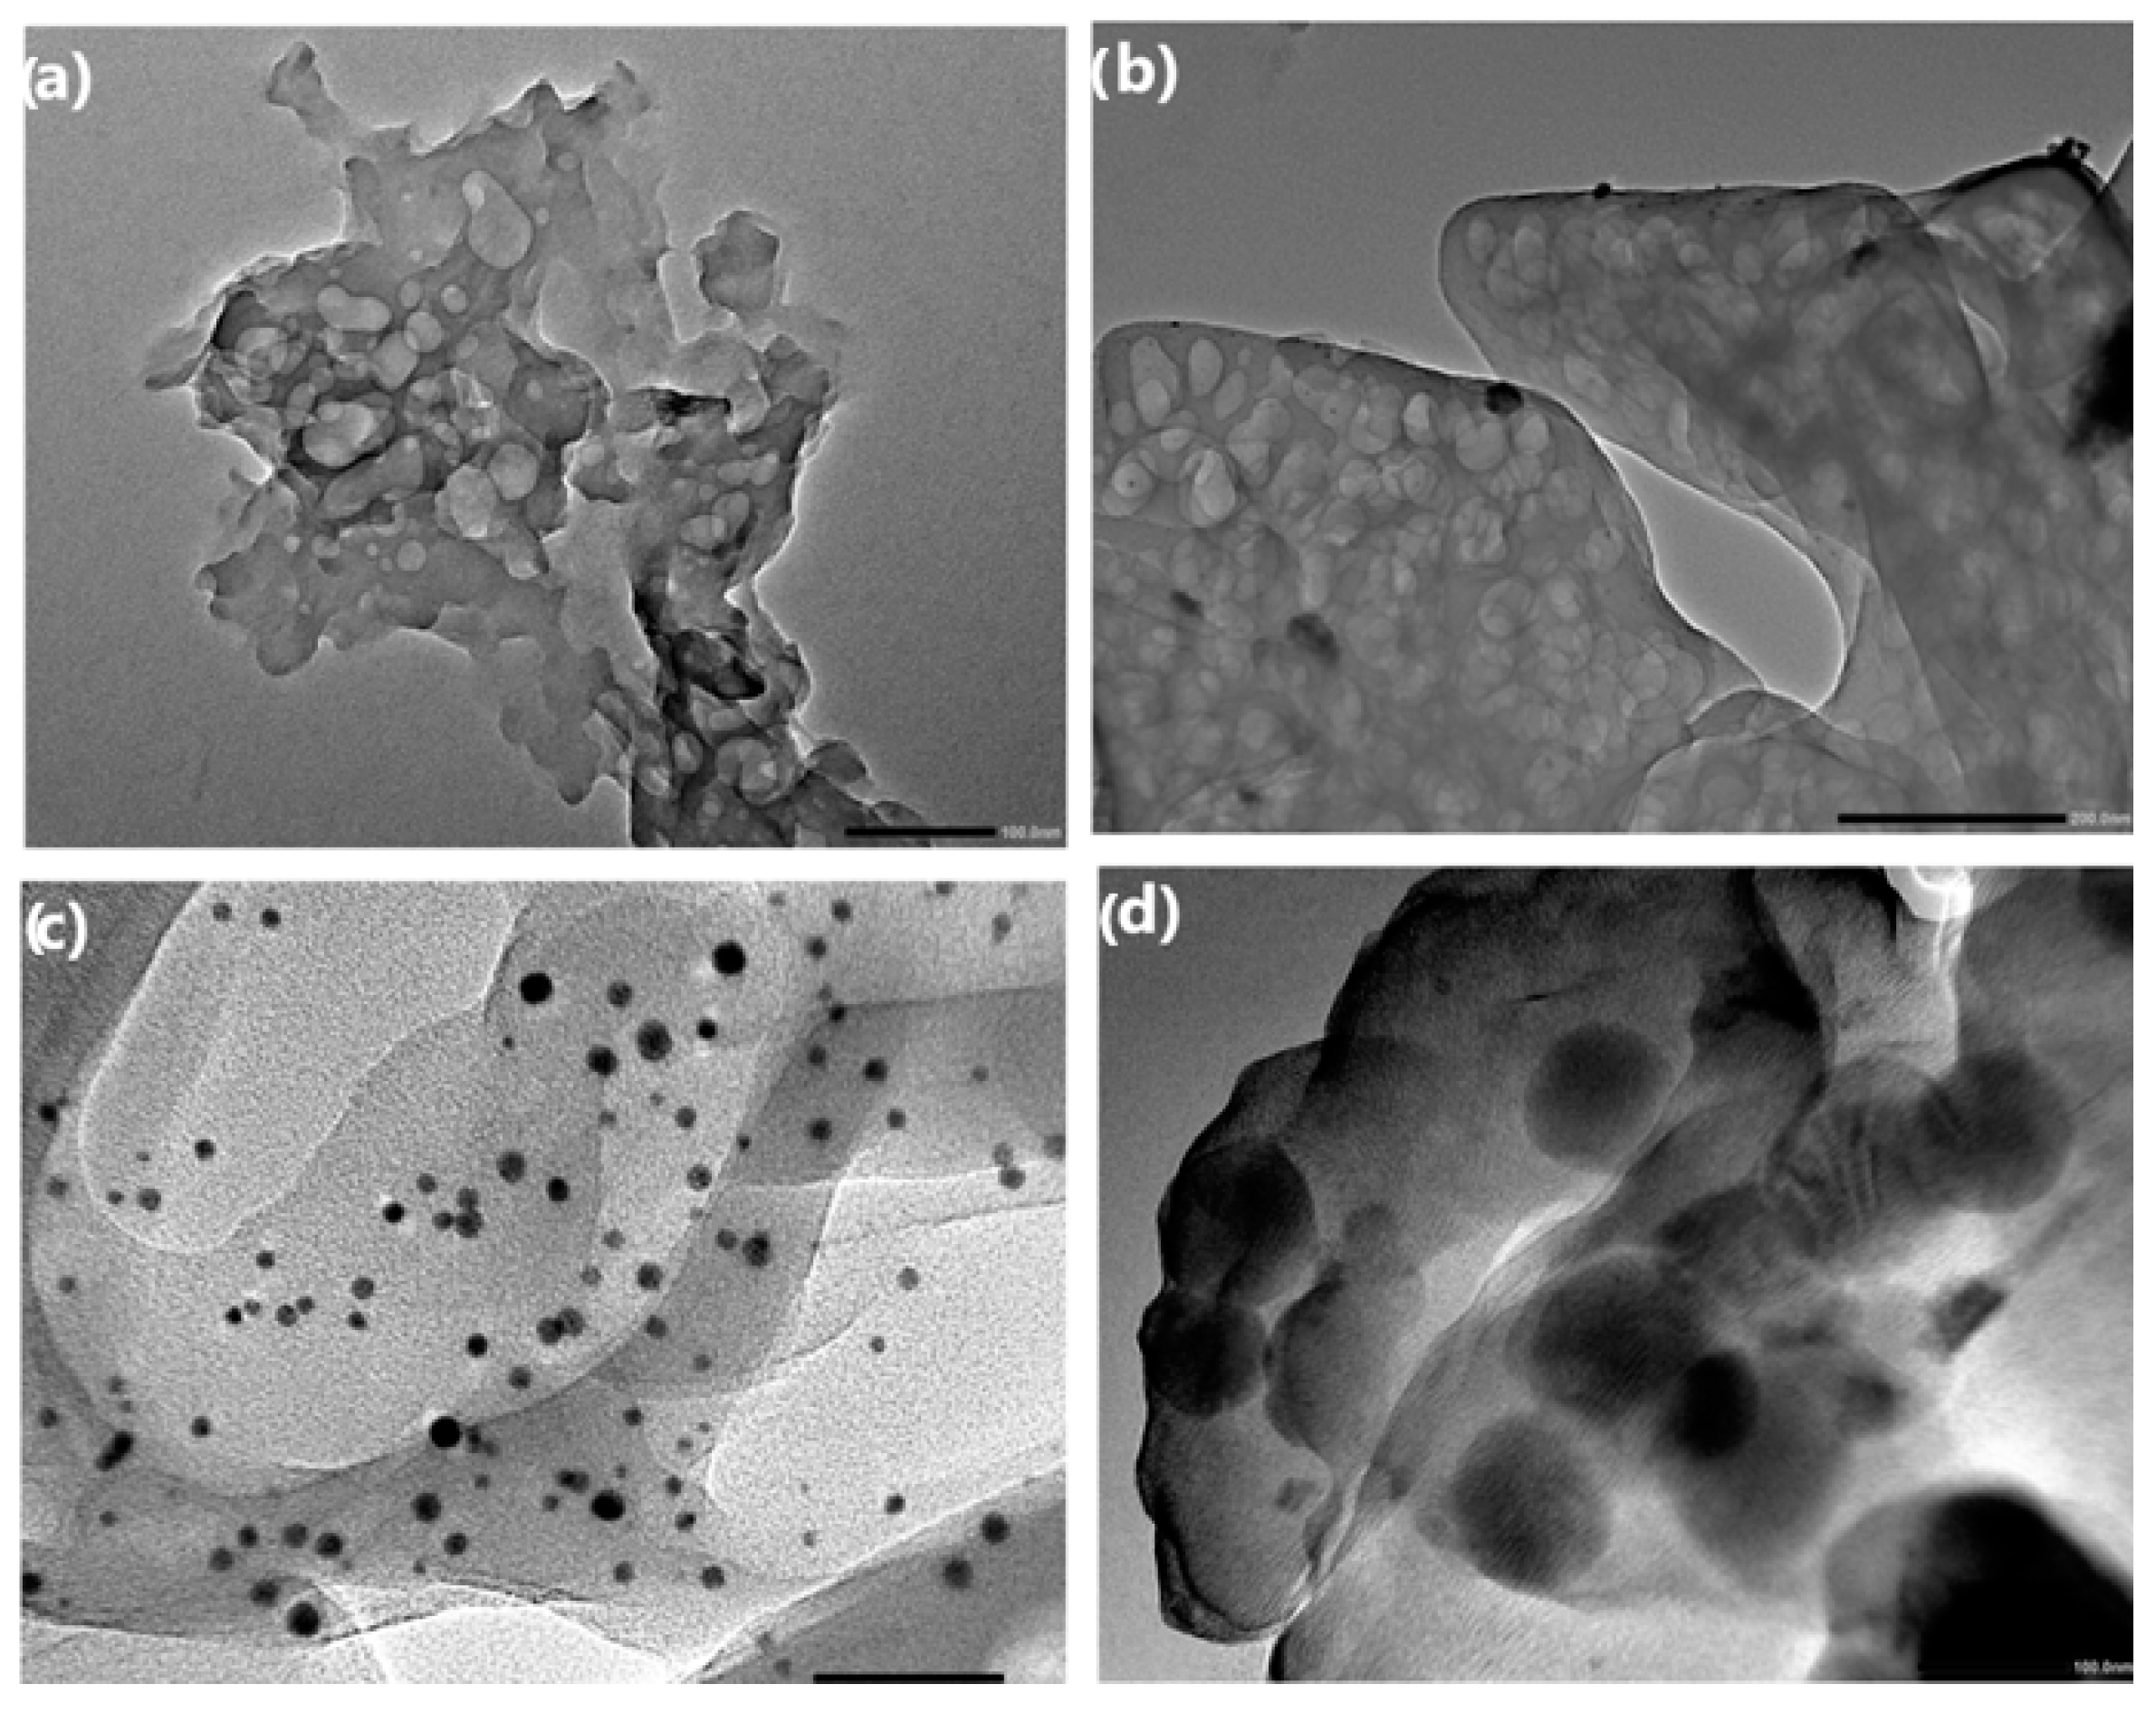
4.5. HRTEM
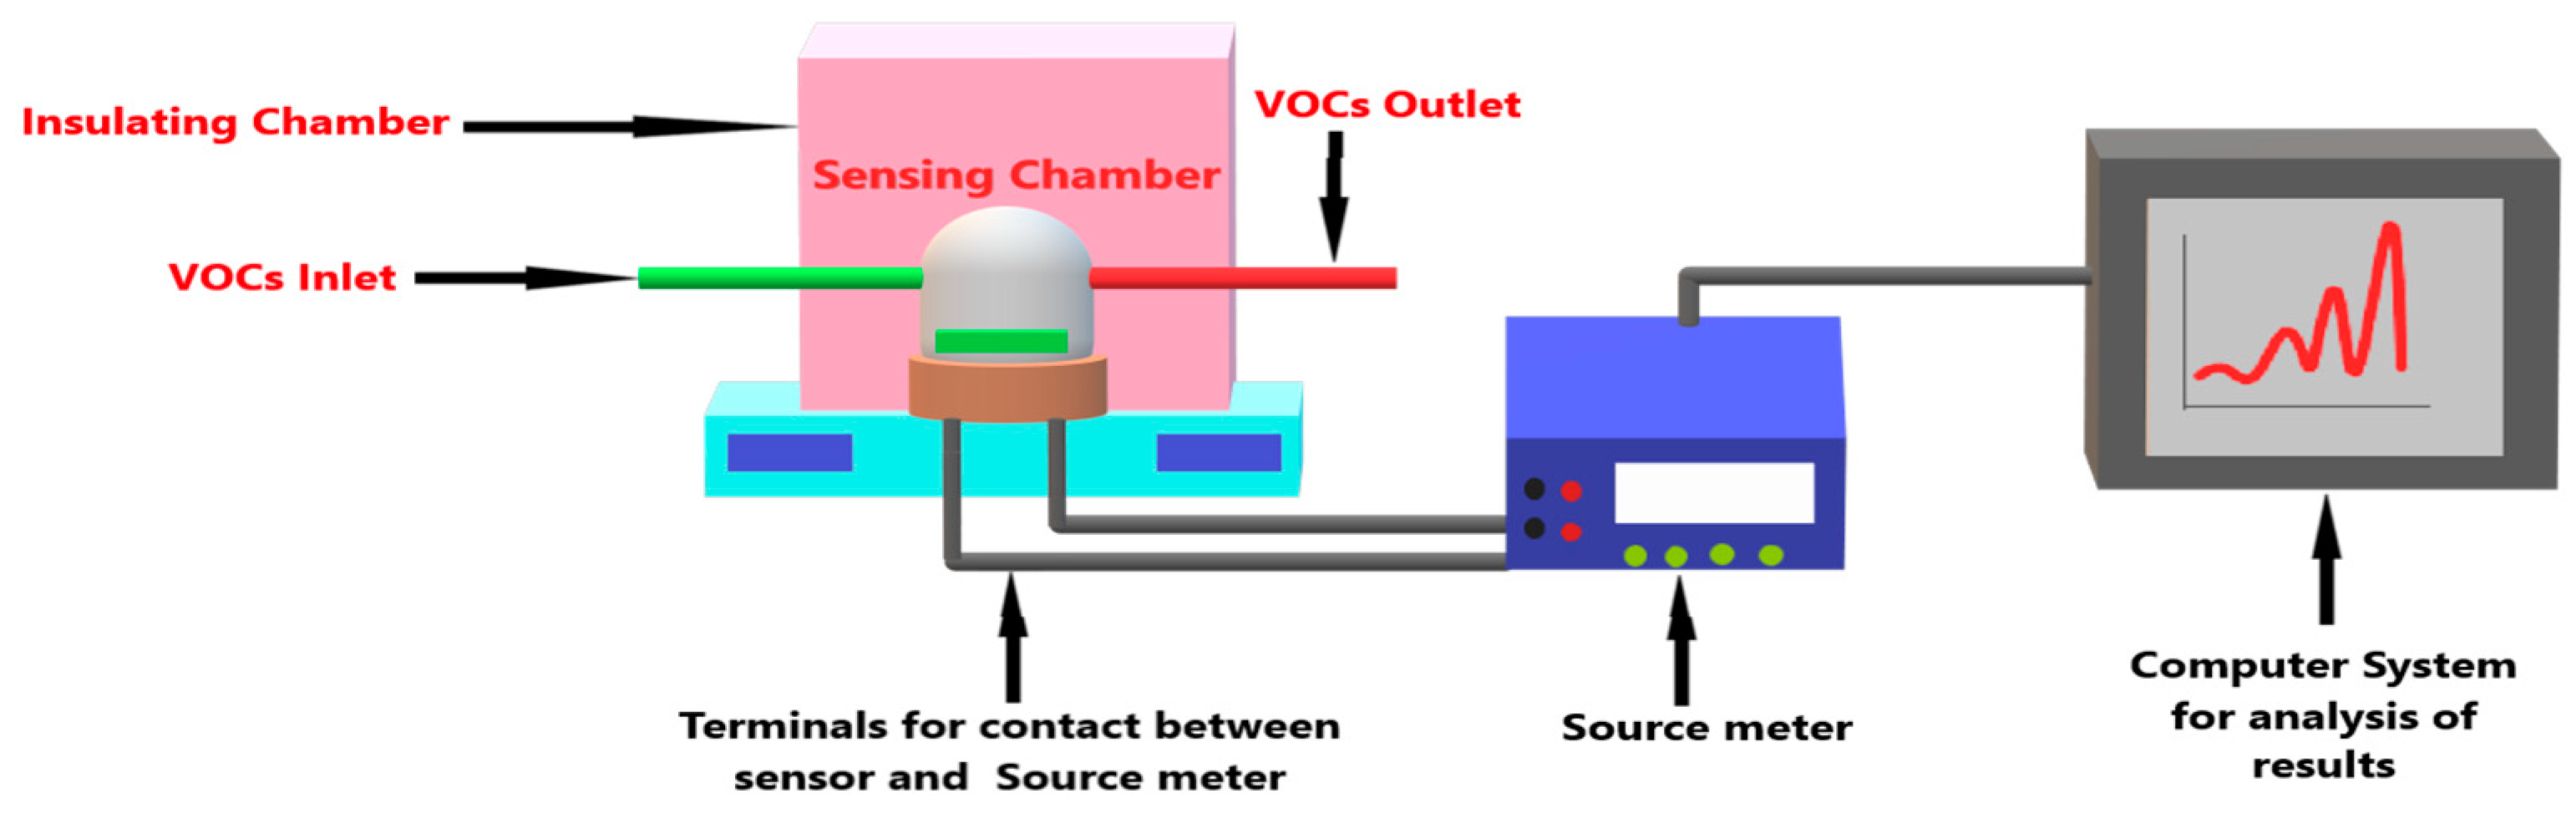
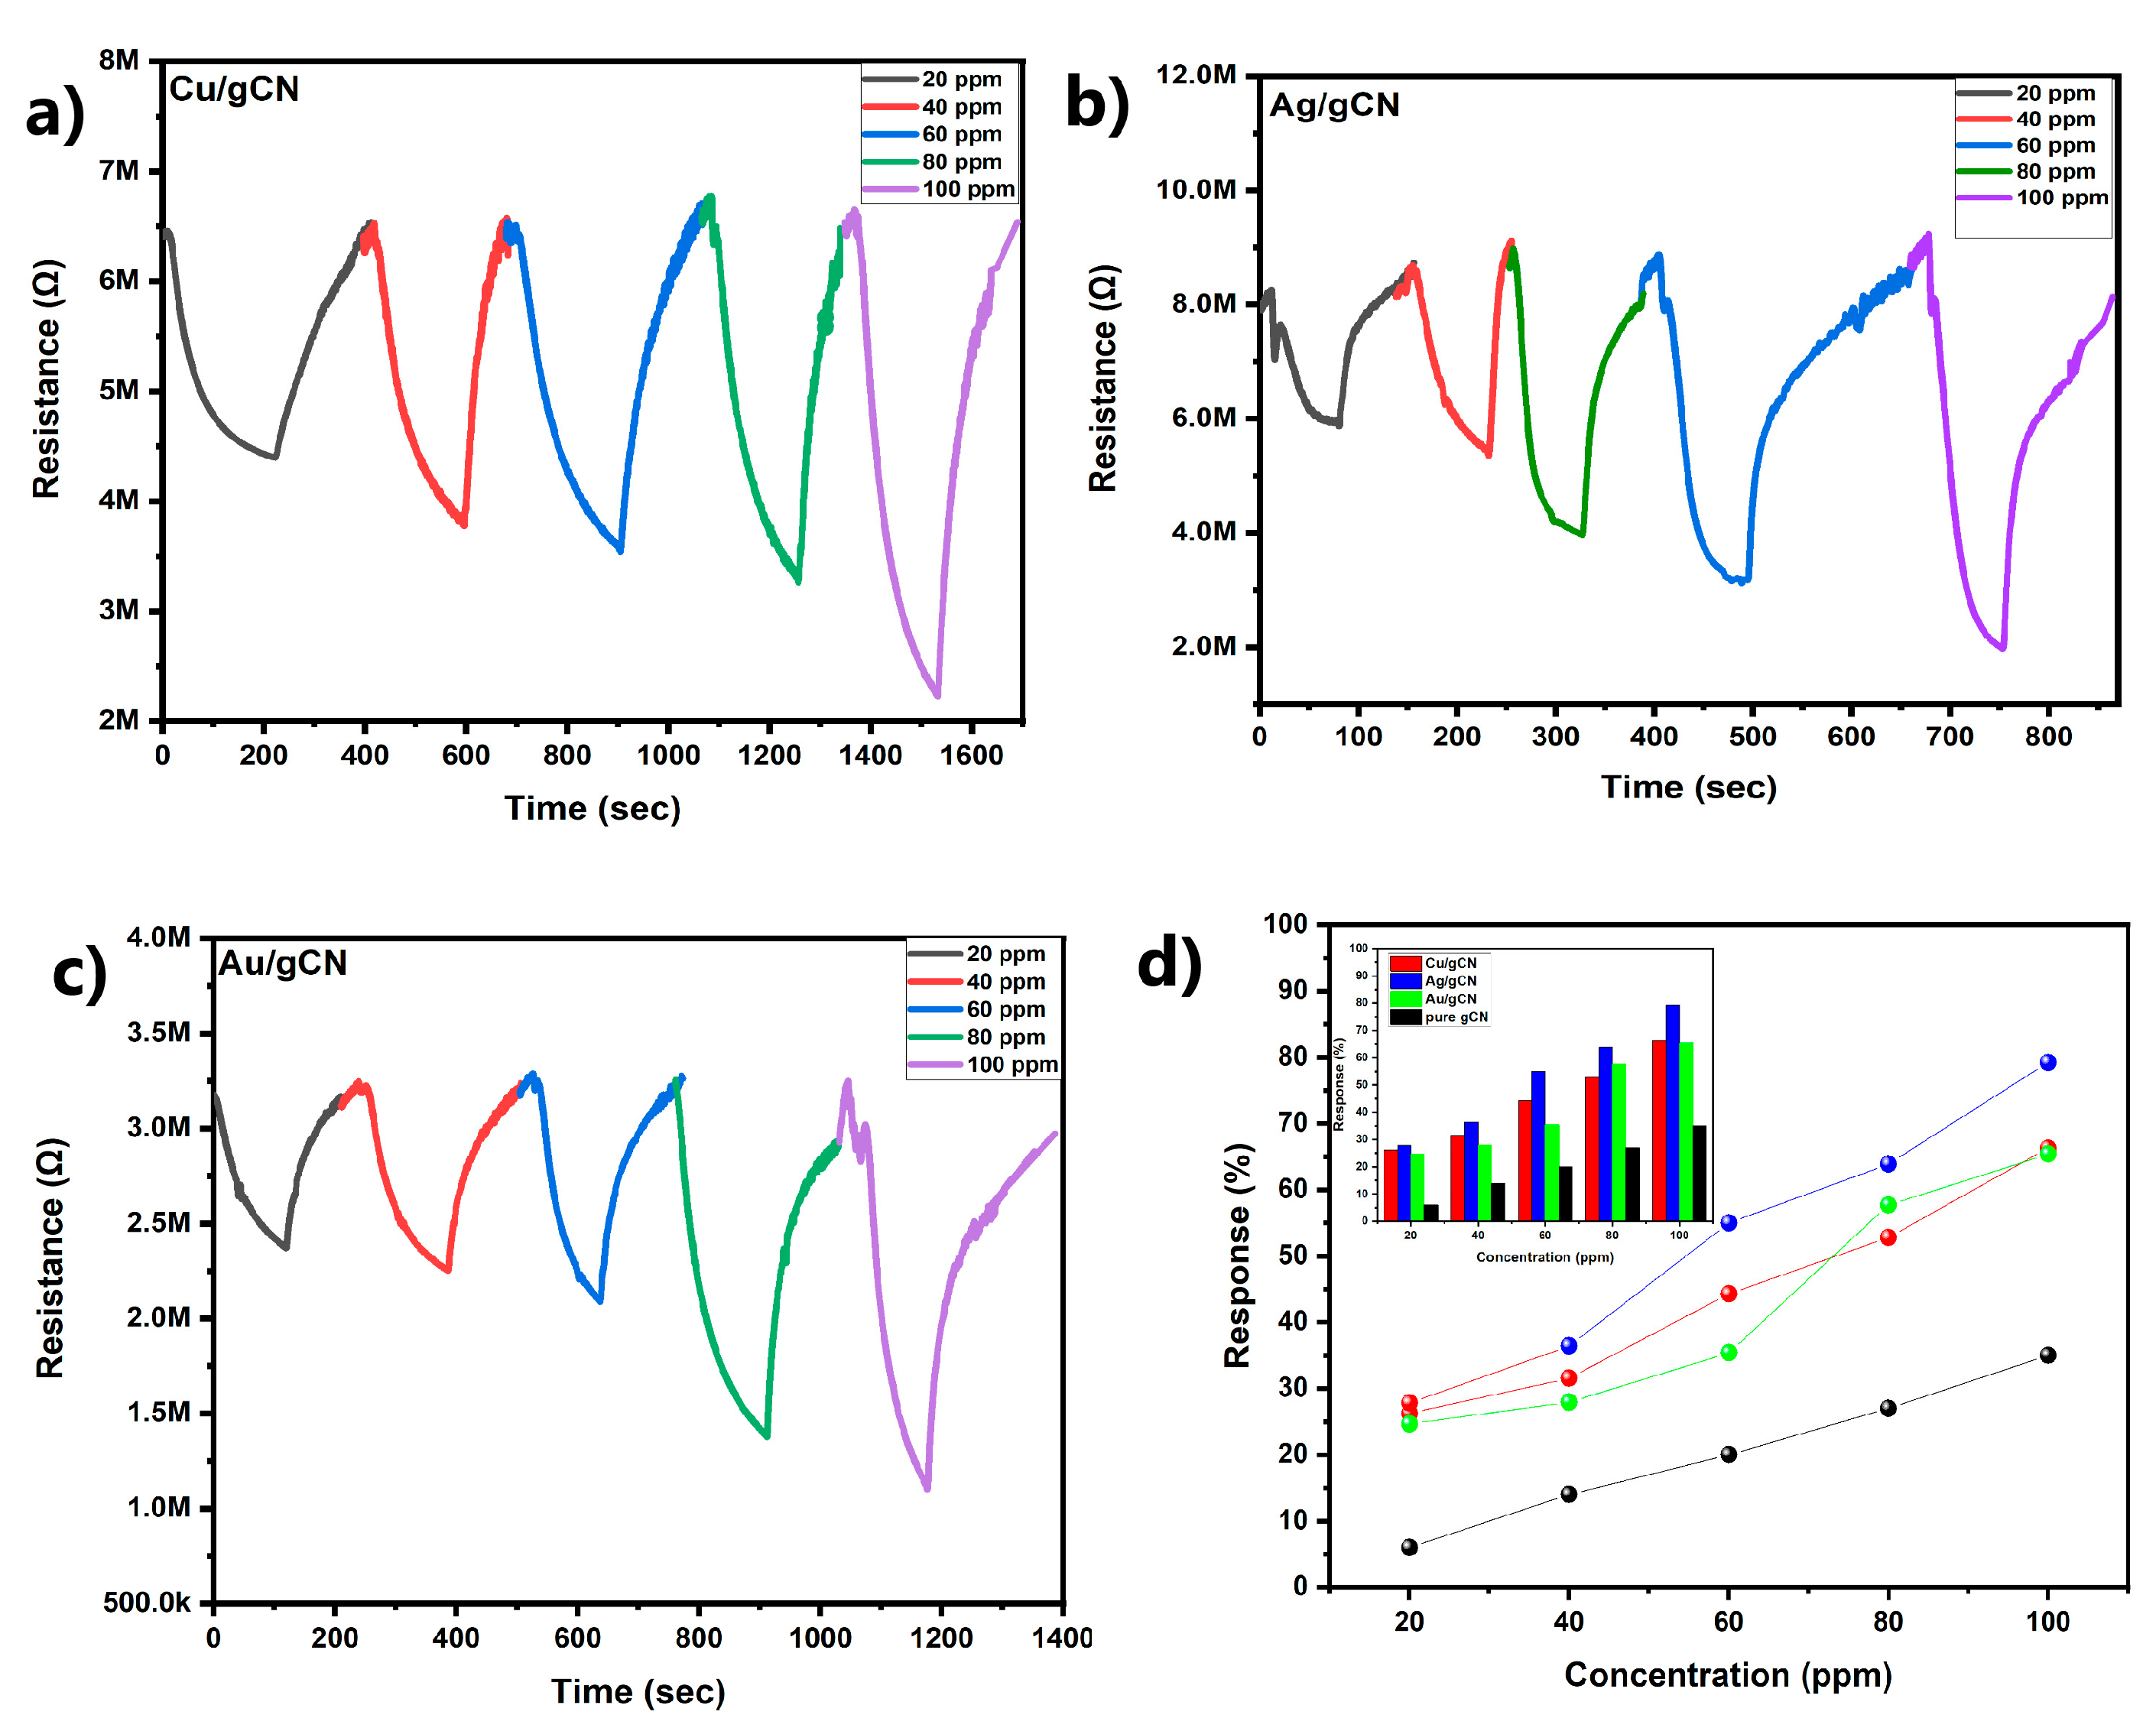
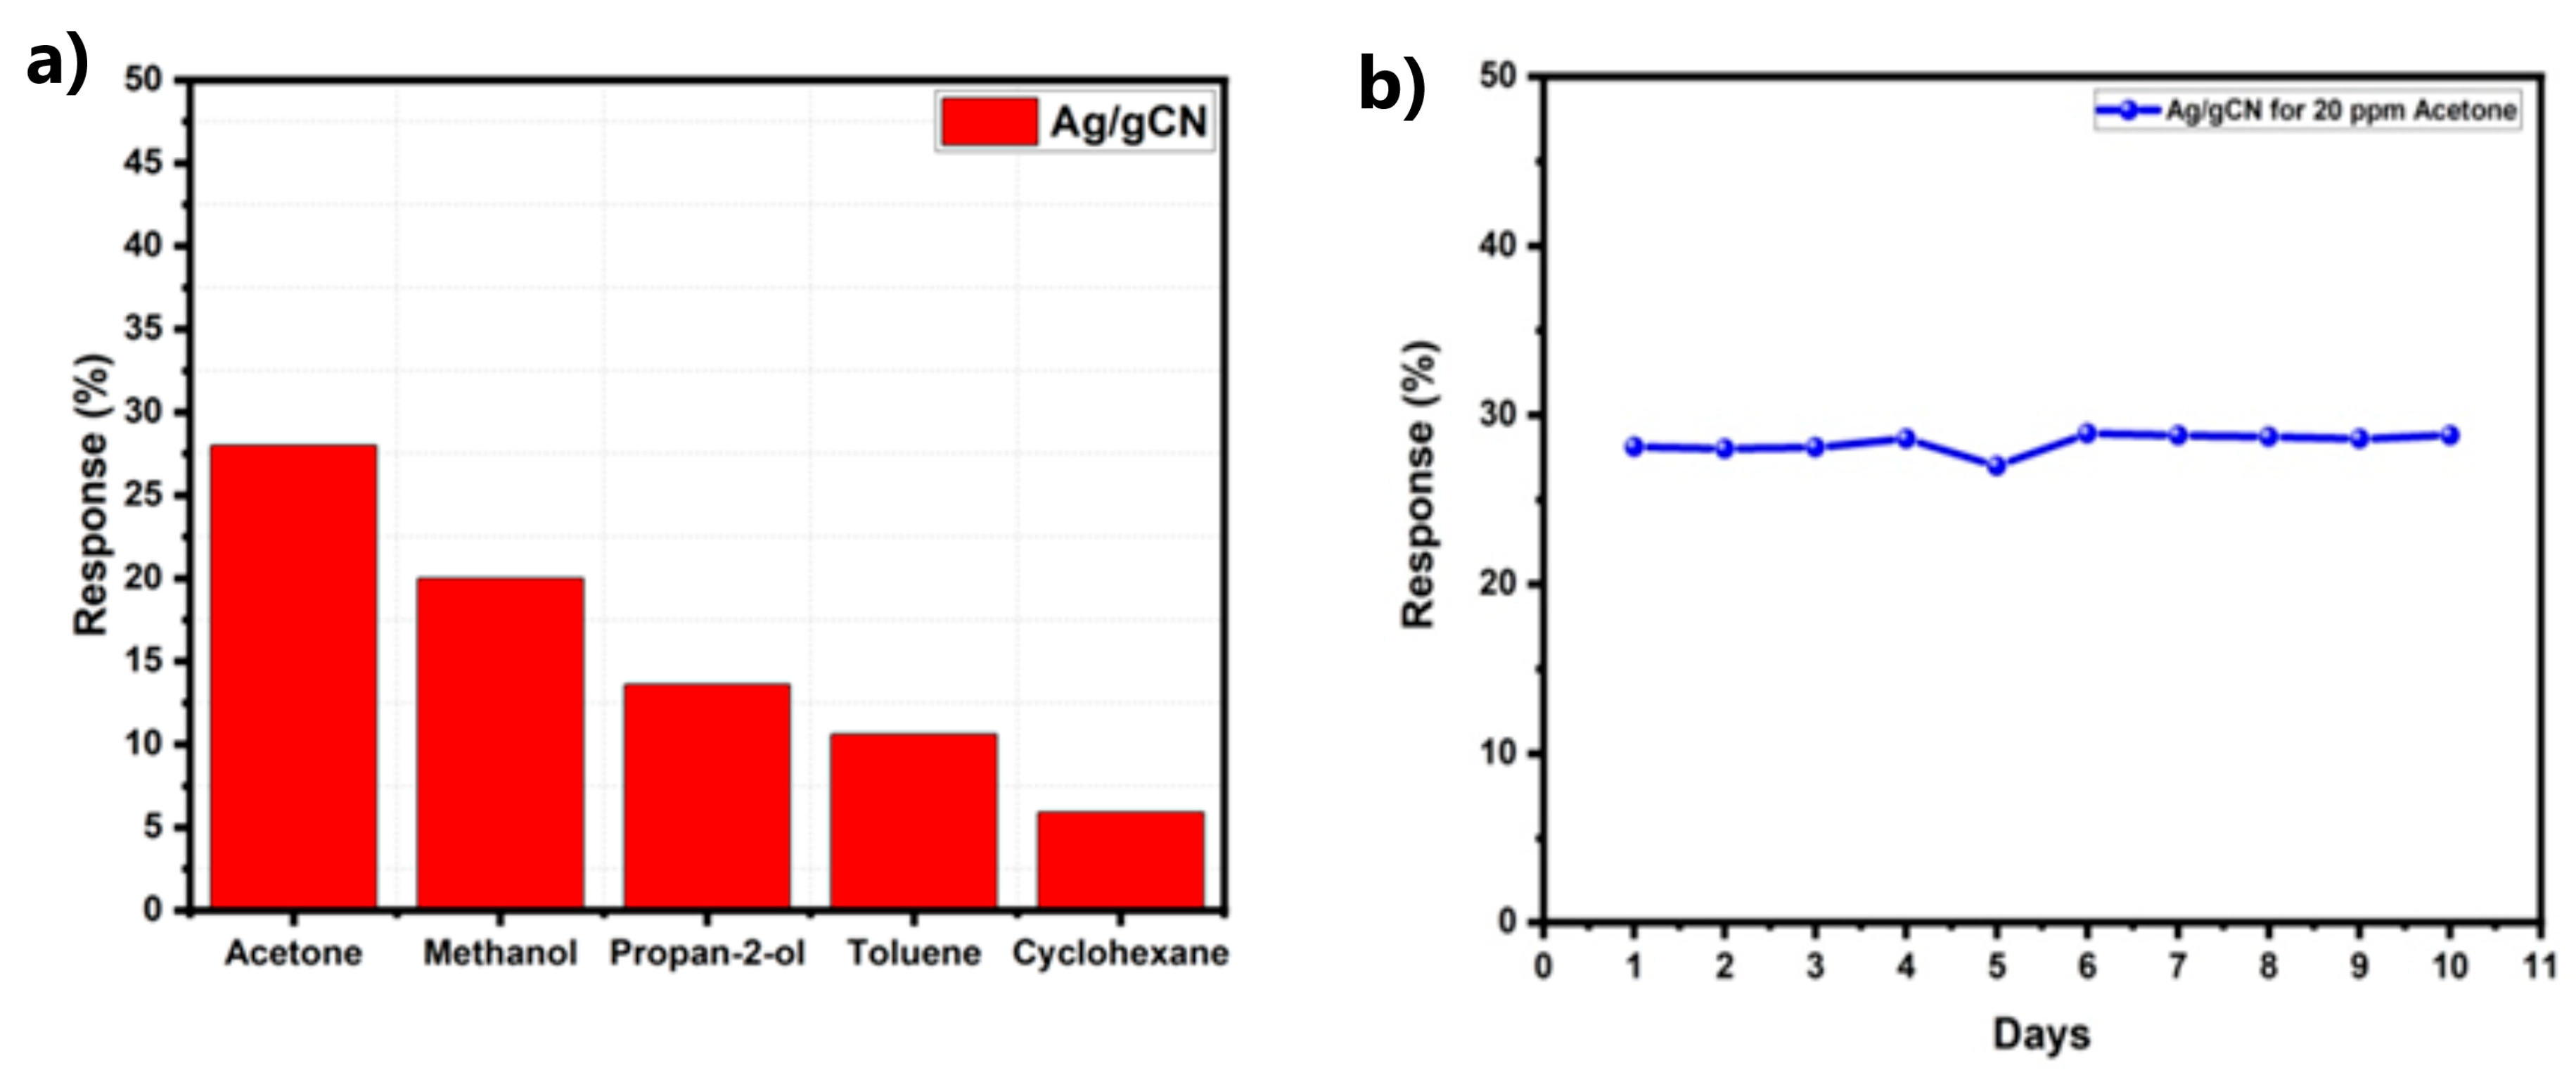
4.6. Sensing
4.7. Sensing Mechanism
5. Conclusions
Supplementary Materials
Author Contributions
Funding
Data Availability Statement
Acknowledgments
Conflicts of Interest
References
- Liew, F.E.; Nogle, R.; Abdalla, T.; Rasor, B.J.; Canter, C.; Jensen, R.O.; Wang, L.; Strutz, J.; Chirania, P.; de Tissera, S.; et al. Carbon-negative production of acetone and isopropanol by gas fermentation at industrial pilot scale. Nat. Biotechnol. 2022, 40, 335–344. [Google Scholar] [CrossRef] [PubMed]
- Weber, I.C.; Braun, H.P.; Krumeich, F.; Güntner, A.T.; Pratsinis, S.E. Superior Acetone Selectivity in Gas Mixtures by Catalyst-Filtered Chemoresistive Sensors. Adv. Sci. 2020, 7, 2001503. [Google Scholar] [CrossRef]
- Chang, H.; Motagamwala, A.H.; Huber, G.W.; Dumesic, J.A. Synthesis of biomass-derived feedstocks for the polymers and fuels industries from 5-(hydroxymethyl)furfural (HMF) and acetone. Green Chem. 2019, 21, 5532–5540. [Google Scholar] [CrossRef]
- Singh, M.; Kaur, N.; Drera, G.; Casotto, A.; Sangaletti, L.; Comini, E. SAM Functionalized ZnO Nanowires for Selective Acetone Detection: Optimized Surface Specific Interaction Using APTMS and GLYMO Monolayers. Adv. Funct. Mater. 2020, 30, 2003217. [Google Scholar] [CrossRef]
- Available online: https://naturalpedia.com/acetone-toxicity-side-effects-diseases-and-environmental-impacts.html (accessed on 15 February 2023).
- US Environmental Protection Agency (EPA), Integrated Risk Information System (IRIS). Summary on Acetone (67-64-1). 2000. Available online: http://www.epa.gov/iris (accessed on 17 January 2014).
- New Jersey Department of Health and Senior Services. Hazardous Substance Fact Sheet for Acetone. 2014. Available online: http://nj.gov/health/eoh/rtkweb/documents/fs/0006.pdf (accessed on 25 January 2014).
- Sharma, R.; Nihal Sharma, M.; Goswamy, J.K. Synthesis and characterization of MoS2/WO3 nanocomposite for electrochromic device application. Int. J. Energy Res. 2022, 46, 22176–22187. [Google Scholar] [CrossRef]
- Sharma, R.; Nihal Sharma, M.; Goswamy, J.K. LiMn2O4 -rGO/PANI Nanocomposite as a Cathode Material for Li-Ion Batteries. J. Electrochem. Soc. 2022, 169, 083505. [Google Scholar] [CrossRef]
- Zhou, X.; Zou, Y.; Ma, J.; Cheng, X.; Li, Y.; Deng, Y.; Zhao, D. Cementing Mesoporous ZnO with Silica for Controllable and Switchable Gas Sensing Selectivity. Chem. Mater. 2019, 31, 8112–8120. [Google Scholar] [CrossRef]
- Wang, R.; Lan, K.; Chen, Z.; Zhang, X.; Hung, C.-T.; Zhang, W.; Wang, C.; Wang, S.; Chen, A.; Li, W.; et al. Janus Mesoporous Sensor Devices for Simultaneous Multivariable Gases Detection. Matter 2019, 1, 1274–1284. [Google Scholar] [CrossRef]
- Afreen, S.; Zhu, J.-J. Rethinking EBAD: Evolution of smart noninvasive detection of diabetes. TrAC Trends Anal. Chem. 2019, 118, 477–487. [Google Scholar] [CrossRef]
- Fang, C.-J.; You, H.-C.; Huang, Z.-L.; Hsu, C.-L.; Tsai, C.-F.; Lin, Y.-T.; Kao, Y.-M.; Tseng, S.-H.; Wang, D.-Y.; Su, N.-W. Simultaneous Analysis of the Stable Carbon Isotope Ratios of Acetoin and Acetic Acid by GC-C-IRMS for Adulteration Detection in Brewed Rice Vinegar Products. J. Agric. Food Chem. 2020, 68, 14252–14260. [Google Scholar] [CrossRef]
- Siebert, L.; Wolff, N.; Ababii, N.; Terasa, M.-I.; Lupan, O.; Vahl, A.; Duppel, V.; Qiu, H.; Tienken, M.; Mirabelli, M.; et al. Facile fabrication of semiconducting oxide nanostructures by direct ink writing of readily available metal microparticles and their application as low power acetone gas sensors. Nano Energy 2020, 70, 104420. [Google Scholar] [CrossRef]
- Cao, C.; Yuan, Q.; Wang, C.; Deng, L.; Li, H.; Wang, D. Controlled synthesis of hierarchical tungsten oxide hydrates for efficient acetone detection. Appl. Surf. Sci. 2022, 604, 154651. [Google Scholar] [CrossRef]
- Nihal Sharma, R.; Kaur, N.; Choudhary, B.C.; Goswamy, J.K. DFT based study of transition metals (Au, Ag, Pd & Pt) doped graphitic carbon nitride (gCN) monolayer as a CO gas sensor. Phys. Scr. 2022, 97, 065706. [Google Scholar] [CrossRef]
- Zhao, Z.; Sun, Y.; Dong, F. Graphitic carbon nitride based nanocomposites: A review. Nanoscale 2015, 7, 15–37. [Google Scholar] [CrossRef]
- Mamba, G.; Mishra, A.K. Graphitic carbon nitride (g-C 3 N 4) nanocomposites: A new and exciting generation of visible light driven photocatalysts for environmental pollution remediation. Appl. Catal. B Environ. 2016, 198, 347–377. [Google Scholar] [CrossRef]
- Cao, S.; Low, J.; Yu, J.; Jaroniec, M. Polymeric Photocatalysts Based on Graphitic Carbon Nitride. Adv. Mater. 2015, 27, 2150–2176. [Google Scholar] [CrossRef] [PubMed]
- Zhou, L.; Zhang, H.; Sun, H.; Liu, S.; Tade, M.O.; Wang, S.; Jin, W. Recent advances in non-metal modification of graphitic carbon nitride for photocatalysis: A historic review. Catal. Sci. Technol. 2016, 6, 7002–7023. [Google Scholar] [CrossRef]
- Huang, D.; Yan, X.; Yan, M.; Zeng, G.; Zhou, C.; Wan, J.; Cheng, M.; Xue, W. Graphitic Carbon Nitride-Based Heterojunction Photoactive Nanocomposites: Applications and Mechanism Insight. ACS Appl. Mater. Interfaces 2018, 10, 21035–21055. [Google Scholar] [CrossRef]
- Oseghe, E.O.; Akpotu, S.O.; Mombeshora, E.T.; Oladipo, A.O.; Ombaka, L.M.; Maria, B.B.; Idris, A.O.; Mamba, G.; Ndlwana, L.; Ayanda, O.S.; et al. Multi-dimensional applications of graphitic carbon nitride nanomaterials—A review. J. Mol. Liq. 2021, 344, 117820. [Google Scholar] [CrossRef]
- Mousavi, M.; Habibi-Yangjeh, A.; Pouran, S.R. Review on magnetically separable graphitic carbon nitride-based nanocomposites as promising visible-light-driven photocatalysts. J. Mater. Sci. Mater. Electron. 2018, 29, 1719–1747. [Google Scholar] [CrossRef]
- Cao, J.; Gong, Y.; Wang, Y.; Zhang, B.; Zhang, H.; Sun, G.; Bala, H.; Zhang, Z. Cocoon-like ZnO decorated graphitic carbon nitride nanocomposite: Hydrothermal synthesis and ethanol gas sensing application. Mater. Lett. 2017, 198, 76–80. [Google Scholar] [CrossRef]
- Zhang, S.; Hang, N.; Zhang, Z.; Yue, H.; Yang, W. Preparation of g-C3N4/Graphene Composite for Detecting NO2 at Room Temperature. Nanomaterials 2017, 7, 12. [Google Scholar] [CrossRef] [PubMed]
- Meng, F.; Chang, Y.; Qin, W.; Yuan, Z.; Zhao, J.; Zhang, J.; Han, E.; Wang, S.; Yang, M.; Shen, Y.; et al. ZnO-Reduced Graphene Oxide Composites Sensitized with Graphitic Carbon Nitride Nanosheets for Ethanol Sensing. ACS Appl. Nano Mater. 2019, 2, 2734–2742. [Google Scholar] [CrossRef]
- Nihal Sharma, R.; Kaur, N.; Choudhary, B.C.; Goswamy, J.K. DFT based comparative study of pristine gCN and gCN-ZnO composite as a sensor for CO and CO2 gases. Mater. Lett. 2022, 324, 132649. [Google Scholar] [CrossRef]
- Wang, Y.; Wang, X.; Antonietti, M. Polymeric Graphitic Carbon Nitride as a Heterogeneous Organocatalyst: From Photochemistry to Multipurpose Catalysis to Sustainable Chemistry. Angew. Int. Ed. 2012, 51, 68–89. [Google Scholar] [CrossRef]
- Zheng, Y.; Lin, L.; Wang, B.; Wang, X. Graphitic Carbon Nitride Polymers toward Sustainable Photoredox Catalysis. Angew. Int. Ed. 2015, 54, 12868–12884. [Google Scholar] [CrossRef]
- Xu, B.; Ahmed, M.B.; Zhou, J.L.; Altaee, A.; Xu, G.; Wu, M. Graphitic carbon nitride based nanocomposites for the photocatalysis of organic contaminants under visible irradiation: Progress, limitations and future directions. Sci. Total Environ. 2018, 633, 546–559. [Google Scholar] [CrossRef]
- Jiang, L.; Yuan, X.; Pan, Y.; Liang, J.; Zeng, G.; Wu, Z.; Wang, H. Doping of graphitic carbon nitride for photocatalysis: A reveiw. Appl. Catal. B Environ. 2017, 217, 388–406. [Google Scholar] [CrossRef]
- Sun, Y.; Ha, W.; Chen, J.; Qi, H.; Shi, Y. Advances and applications of graphitic carbon nitride as sorbent in analytical chemistry for sample pretreatment: A review. TrAC Trends Anal. Chem. 2016, 84, 12–21. [Google Scholar] [CrossRef]
- Leong, K.H.; Liu, S.L.; Sim, L.C.; Saravanan, P.; Jang, M.; Ibrahim, S. Surface reconstruction of titania with g-C3N4 and Ag for promoting efficient electrons migration and enhanced visible light photocatalysis. Appl. Surf. Sci. 2015, 358, 370–376. [Google Scholar] [CrossRef]
- Zada, A.; Qu, Y.; Ali, S.; Sun, N.; Lu, H.; Yan, R.; Zhang, X.; Jing, L. Improved visible-light activities for degrading pollutants on TiO2/g-C3N4 nanocomposites by decorating SPR Au nanoparticles and 2,4-dichlorophenol decomposition path. J. Hazard. Mater. 2018, 342, 715–723. [Google Scholar] [CrossRef] [PubMed]
- Hou, W.; Cronin, S.B. A Review of Surface Plasmon Resonance-Enhanced Photocatalysis. Adv. Funct. Mater. 2013, 23, 1612–1619. [Google Scholar] [CrossRef]
- Veerakumar, P.; Rajkumar, C.; Chen, S.-M.; Thirumalraj, B.; Lin, K.-C. Ultrathin 2D graphitic carbon nitride nanosheets decorated with silver nanoparticles for electrochemical sensing of quercetin. J. Electroanal. Chem. 2018, 826, 207–216. [Google Scholar] [CrossRef]
- Yuan, J.; Yang, M.-P.; Zhi, W.-Y.; Wang, H.; Wang, H.; Lu, J.-X. Efficient electrochemical reduction of CO2 to ethanol on Cu nanoparticles decorated on N-doped graphene oxide catalysts. J. CO2 Util. 2019, 33, 452–460. [Google Scholar] [CrossRef]
- Chen, Y.; Zhu, Y.; Zhao, Y.; Wang, J. Fluorescent and colorimetric dual-response sensor based on copper (II)-decorated graphitic carbon nitride nanosheets for detection of toxic organophosphorus. Food Chem. 2021, 345, 128560. [Google Scholar] [CrossRef]
- Basharnavaz, H.; Habibi-Yangjeh, A.; Mousavi, M. Ni, Pd, and Pt-embedded graphitic carbon nitrides as excellent adsorbents for HCN removal: A DFT study. Appl. Surf. Sci. 2018, 456, 882–889. [Google Scholar] [CrossRef]
- Han, J.; Zou, H.Y.; Liu, Z.X.; Yang, T.; Gao, M.X.; Huang, C.Z. Efficient visible-light photocatalytic heterojunctions formed by coupling plasmonic Cu2−x Se and graphitic carbon nitride. N. J. Chem. 2015, 39, 6186–6192. [Google Scholar] [CrossRef]
- Yao, Y.; Lu, F.; Zhu, Y.; Wei, F.; Liu, X.; Lian, C.; Wang, S. Magnetic core–shell CuFe2O4@C3N4 hybrids for visible light photocatalysis of Orange II. J. Hazard. Mater. 2015, 297, 224–233. [Google Scholar] [CrossRef]
- Saravanakumar, K.; Mamba, G.; Muthuraj, V. 1D/2D MnWO4 nanorods anchored on g-C3N4 nanosheets for enhanced photocatalytic degradation ofloxacin under visible light irradiation. Colloids Surf. A Physicochem. Eng. Asp. 2019, 581, 123845. [Google Scholar] [CrossRef]
- Li, H.; Jing, Y.; Ma, X.; Liu, T.; Yang, L.; Liu, B.; Yin, S.; Wei, Y.; Wang, Y. Construction of a well-dispersed Ag/graphene-like g-C3N4 photocatalyst and enhanced visible light photocatalytic activity. RSC Adv. 2017, 7, 8688–8693. [Google Scholar] [CrossRef]
- Nihal Rattan, S.; Manpreet Anjali Harjot Kumar, S.; Sharma, M.; Tripathi, S.K.; Goswamy, J.K. Synthesis and characterization of Ag metal doped SnO2, WO3 and WO3–SnO2 for propan-2-ol sensing. Results Mater. 2021, 9, 100127. [Google Scholar] [CrossRef]
- Nihal Sharma, R.; Sharma, M.; Goswamy, J.K. Au decorated WO3-SnO2 nanocomposite for enhanced benzene vapors sensing performance. Phys. Scr. 2023, 98, 045809. [Google Scholar] [CrossRef]
- Xu, J.; Zhang, L.; Shi, R.; Zhu, Y. Chemical exfoliation of graphitic carbon nitride for efficient heterogeneous photocatalysis. J. Mater. Chem. A 2013, 1, 14766. [Google Scholar] [CrossRef]
- Phan, D.-T.; Chung, G.-S. Reliability of hydrogen sensing based on bimetallic Ni–Pd/graphene composites. Int. J. Hydrogen Energy 2014, 39, 20294–20304. [Google Scholar] [CrossRef]
- Zhang, D.; Sun, Y.; Jiang, C.; Zhang, Y. Room temperature hydrogen gas sensor based on palladium decorated tin oxide/molybdenum disulfide ternary hybrid via hydrothermal route. Sens. Actuators B Chem. 2017, 242, 15–24. [Google Scholar] [CrossRef]
- Ibrahim, A.; Memon, U.B.; Duttagupta, S.P.; Mahesh, I.; Raman, R.K.S.; Sarkar, A.; Pendharkar, G.; Tatiparti, S.S.V. Nano-structured palladium impregnate graphitic carbon nitride composite for efficient hydrogen gas sensing. Int. J. Hydrogen Energy 2020, 45, 10623–10636. [Google Scholar] [CrossRef]
- Saruhan, B.; Lontio Fomekong, R.; Nahirniak, S. Review: Influences of Semiconductor Metal Oxide Properties on Gas Sensing Characteristics. Front. Sens. 2021, 2, 657931. [Google Scholar] [CrossRef]
- Wang, Z.; Ali Haidry, A.; Xie, L.; Zavabeti, A.; Li, Z.; Yin, W.; Lontio Fomekong, R.; Saruhan, B. Acetone sensing applications of Ag modified TiO2 porous nanoparticles synthesized via facile hydrothermal method. Appl. Surf. Sci. 2020, 533, 147383. [Google Scholar] [CrossRef]
- Zhang, R.; Wang, Y.; Zhang, Z.; Cao, J. Highly Sensitive Acetone Gas Sensor Based on g-C3N4 Decorated MgFe2O4 Porous Microspheres Composites. Sensors 2018, 18, 2211. [Google Scholar] [CrossRef]
- Sahani, S.; Park, S.J.; Myung, Y.; Pham, T.-H.; Tung, T.T.; Kim, T. Enhanced Room-Temperature Ethanol Detection by Quasi 2D Nanosheets of an Exfoliated Polymeric Graphitized Carbon Nitride Composite-Based Patterned Sensor. ACS Omega 2022, 7, 41905–41914. [Google Scholar] [CrossRef]
- Malik, R.; Tomer, V.K.; Chaudhary, V.; Dahiya, M.S.; Nehra, S.P.; Duhan, S.; Kailasam, K. A low temperature, highly sensitive and fast response toluene gas sensor based on In(III)-SnO2 loaded cubic mesoporous graphitic carbon nitride. Sens. Actuators B Chem. 2018, 255, 3564–3575. [Google Scholar] [CrossRef]
- Absalan, S.; Nasresfahani, S.h.; Sheikhi, M.H. High-performance carbon monoxide gas sensor based on palladium/tin oxide/porous graphitic carbon nitride nanocomposite. J. Alloy. Compd. 2019, 795, 79–90. [Google Scholar] [CrossRef]
- Nihal Sharma, R.; Kaur, N.; Sharma, M.; Choudhary, B.C.; Goswamy, J.K. Improved room temperature ethanol vapors sensing using silver nanoparticles decorated graphitic carbon nitride (Ag-gCN) nanocomposite. Mater. Lett. 2023, 342, 134343. [Google Scholar] [CrossRef]


| Sr.No. | Material | Analyte | Response (%) | Operating Temperature (°C) | Reference |
|---|---|---|---|---|---|
| 1. | Exfoliated polymeric carbon nitride | Ethanol | 2.31 | 20 ± 2° | [53] |
| 2. | Pd/SnO2/g-C3N4 | CO | 5.55 | 125 | [54] |
| 3. | In(III)-SnO2/g-CN | Toluene | 2.4 | 90 | [55] |
| 4. | Pure gCN Ag/gCN | Ethanol | 6.67 14.87 | Room temperature | [56] |
| 5. | Cu/gCN Ag/gCN Au/gCN | Acetone | 25 28 24 | Room Temperature | This work |
Disclaimer/Publisher’s Note: The statements, opinions and data contained in all publications are solely those of the individual author(s) and contributor(s) and not of MDPI and/or the editor(s). MDPI and/or the editor(s) disclaim responsibility for any injury to people or property resulting from any ideas, methods, instructions or products referred to in the content. |
© 2023 by the authors. Licensee MDPI, Basel, Switzerland. This article is an open access article distributed under the terms and conditions of the Creative Commons Attribution (CC BY) license (https://creativecommons.org/licenses/by/4.0/).
Share and Cite
Nihal; Sharma, R.; Kaur, N.; Sharma, M.; Choudhary, B.C.; Goswamy, J.K. Enhanced Acetone Sensing Based on Group-11 Metal (Cu, Ag, and Au) Nanoparticles Embedded in Graphitic Carbon Nitride (gCN). Atoms 2023, 11, 78. https://doi.org/10.3390/atoms11050078
Nihal, Sharma R, Kaur N, Sharma M, Choudhary BC, Goswamy JK. Enhanced Acetone Sensing Based on Group-11 Metal (Cu, Ag, and Au) Nanoparticles Embedded in Graphitic Carbon Nitride (gCN). Atoms. 2023; 11(5):78. https://doi.org/10.3390/atoms11050078
Chicago/Turabian StyleNihal, Rahul Sharma, Navjot Kaur, Mamta Sharma, B. C. Choudhary, and J. K. Goswamy. 2023. "Enhanced Acetone Sensing Based on Group-11 Metal (Cu, Ag, and Au) Nanoparticles Embedded in Graphitic Carbon Nitride (gCN)" Atoms 11, no. 5: 78. https://doi.org/10.3390/atoms11050078