Article

Study of Electron Impact Excitation of Na-like Kr Ion for Impurity Seeding Experiment in Large Helical Device

1
National Institute for Fusion Science, National Institutes of Natural Sciences, 322-6 Oroshi-cho, Toki 509-5292, Gifu, Japan
2
Department of Quantum Science and Energy Engineering, Tohoku University, 6-6-01-2 Aobayama, Sendai 980-8579, Miyagi, Japan
3
Graduate Institute for Advanced Studies, SOKENDAI, 322-6 Oroshi-cho, Toki 509-5292, Gifu, Japan
*
Author to whom correspondence should be addressed.
Atoms 2023, 11(11), 142; https://doi.org/10.3390/atoms11110142
Submission received: 31 August 2023 / Revised: 20 October 2023 / Accepted: 1 November 2023 / Published: 5 November 2023
(This article belongs to the Special Issue Atomic Processes for Plasma Modeling Applications)

Abstract

:
In this work, a krypton gas impurity seeding experiment was conducted in a Large Helical Device. Emission lines from the Na-like Kr ion in the extreme ultraviolet wavelength region, such as 22.00 nm, 17.89 nm, 16.51 nm, 15.99 nm, and 14.08 nm, respective to 2 p 6 3 p ( 2 P 1 / 2 o ) 2 p 6 3 s ( 2 S 1 / 2 ) , 2 p 6 3 p ( 2 P 3 / 2 o ) 2 p 6 3 s ( 2 S 1 / 2 ) , 2 p 6 3 d ( 2 D 3 / 2 ) 2 p 6 3 p ( 2 P 3 / 2 o ) , 2 p 6 3 d ( 2 D 5 / 2 ) 2 p 6 3 p ( 2 P 3 / 2 o ) , and 2 p 6 3 d ( 2 D 3 / 2 ) 2 p 6 3 p ( 2 P 1 / 2 o ) transitions, are observed. In order to generate a theoretical synthetic spectrum, an extensive calculation concerning the excitation of the Kr 25 + ion through electron impact was performed for the development of a suitable plasma model. For this, the relativistic multiconfiguration Dirac–Hartree–Fock method was employed along with its extension to the relativistic configuration interaction method to compute the relativistic bound-state wave functions and excitation energies of the fine structure levels using the General Relativistic Atomic Structure Package-2018. In addition, another set of calculations was carried out utilizing the relativistic many-body perturbation theory and relativistic configuration interaction methods integrated within the Flexible Atomic Code. To investigate the reliability of our findings, the results of excitation energies, transition probabilities, and weighted oscillator strengths of different dipole-allowed transitions obtained from these different methods are presented and compared with the available data. Further, the detailed electron impact excitation cross-sections and their respective rate coefficients are obtained for various fine structure resolved transitions using the fully relativistic distorted wave method. Rate coefficients, calculated using the Flexible Atomic Code for population and de-population kinetic processes, are integrated into the collisional-radiative plasma model to generate a theoretical spectrum. Further, the emission lines observed from the Kr 25 + ion in the impurity seeding experiment were compared with the present plasma model spectrum, demonstrating a noteworthy overall agreement between the measurement and the theoretical synthetic spectrum.

1. Introduction

Spectroscopy of high-temperature fusion plasma plays an essential role in investigating different plasma diagnostics associated with magnetic confinement fusion devices [1,2,3,4]. Large tokamak and stellarator devices such as ITER, DEMO, LHD, Wendelstein 7-X, JET, ASDEX Upgrade, JT-60U, EAST, etc., are expected to have inert gases as the external impurities, which are injected into the machine as the coolant gases [5,6,7,8,9,10,11,12,13]. Many impurity seeding experiments have been conducted in the existing fusion plasma devices using Nitrogen ( N 2 ) , and inert gases such as Neon (Ne), Argon (Ar), and Krypton (Kr), to study the radiation enhancement and reduction in the particle heat load in the divertor region for divertor detachment [10,13,14,15,16]. In earlier studies, the spectroscopic measurements of highly charged Kr 18 + , Kr 17 + , Kr 24 + , and Kr 25 + ions along with lower ionization states, viz. Kr 7 + and Kr 5 + , were investigated to examine the relevance of different ionization states in divertor detachment operation in a Large Helical Device (LHD) [17,18]. However, in ASDEX Upgrade (AUG) and JT-60SA tokamaks, numerical simulation and experimental studies have been conducted using Kr gas and Kr+ N 2 gases in support of ITER experiments and the development of impurity scenarios for a large-scale fusion DEMOnstration reactor (DEMO) [19]. In high-atomic-number (Z) impurities, Kr gas is the favorable atomic element as it is chemically non-invasive and radiates efficiently in the Scrape-Off Layer (SOL) and core regions [19]. The presence of Highly Charged Ions (HCIs) of such impurity leads to lower dilution within the core plasma and helps in facilitating the identification of an impurity scenario that enables the optimization of plasma performance in terms of power exhaust and confinement. Hence, there has been a significant interest in conducting experimental research within tokamak and stellarator devices utilizing Kr gas for fusion plasma diagnostic investigations. In the context of spectral measurements in high-temperature fusion plasma, a thorough theoretical validation of the precise contribution from each charge state of highly charged Kr ions remains elusive due to the paucity of atomic and electron collision data. To address this gap and acquire deeper insights into the spectroscopic and dynamic properties of highly charged Kr ions, it becomes imperative to provide dependable atomic data encompassing excitation energies of fine structure levels, transition probabilities, oscillator strengths, and excitation cross-sections for a substantial number of transitions. These data are pivotal for formulating a robust plasma model capable of generating synthetic spectra to corroborate experimental findings. The accuracy of this theoretical spectrum hinges on the meticulous incorporation of collisional and radiative processes into the model, necessitating precise atomic structure calculations, cross-sections, and respective rate coefficient determination for various processes. Given the complexity of performing measurements alone, the growing demand for the atomic structure and electron-ion collision data of HCIs cannot be solely satisfied through empirical means. Therefore, a complete set of reliable atomic and electron collision data derived from rigorous relativistic methodologies is required, with integration into the plasma model being essential for diagnostic purposes [20].
In this study, we conducted Extreme Ultraviolet (EUV) spectral diagnostics for the Na-like Kr ion using the emission spectra of Kr atomic ions measured in the impurity seeding experiment of LHD, along with appropriate Collisional-Radiative (CR) plasma model calculations. To develop a suitable CR model, detailed atomic ion structure and electron collision calculations were performed for the Kr 25 + ion. In this view, a fully relativistic multiconfiguration Electron Impact Excitation (EIE) calculation of the highly charged Na-like Kr ion was discussed from its ground state 2 s 2 2 p 6 3 s ( 2 S 1 / 2 ) . Two sets of theoretical calculations were carried out using the Relativistic Multiconfiguration Dirac–Hartree–Fock (RMCDHF) method and the Relativistic Many-Body Perturbation Theory (RMBPT) to make Kr 25 + ion computation consistent. In the first set, we studied the excitation of the Kr 25 + ion by considering the ground state configuration and Multi-Reference (MR) 2 s 2 2 p 6 3 l 1 ( 1 l 1 2 ) , 2 s 2 2 p 6 4 l 2 ( 0 l 2 3 ) , 2 s 2 2 p 6 5 l 3 ( 0 l 3 4 ) , 2 s 2 2 p 6 6 l 3 ( 0 l 3 4 ) , and 2 s 2 2 p 6 7 l 3 ( 0 l 3 4 ) configurations. Here, the orbital 2 s 2 is common; therefore, it will be omitted from this point forward. In this set of calculations, the RMCDHF method was applied along with Relativistic Configuration Interaction (RCI) to incorporate the relevant relativistic corrections, namely the transverse photon interaction as the Breit interaction and the vacuum polarization, and the self-energy correction as Quantum Electrodynamic (QED) corrections [21,22,23]. The relativistic wave functions, information on the considered fine structure energy levels, and their respective excitation energies with respect to the ground state were calculated using the General Relativistic Atomic Structure Package (GRASP 2018) [24]. Moreover, transition parameters such as transition probabilities, weighted oscillator strengths, and wavelengths of the dipole-allowed transitions were also obtained using the relativistic atomic ion wave functions and excitation energies.
Further, an additional set of calculations were conducted by considering the ground state 2 p 6 3 s ( 2 S 1 / 2 ) , and different excited states, such as 2 p 6 3 l 1 ( 1 l 1 2 ) , 2 p 6 4 l 2 ( 0 l 2 3 ) , 2 p 6 n 1 l 3 ( 5 n 1 7 and 0 l 3 4 ) , 2 p 5 3 s 3 l 1 ( 1 l 1 2 ) , 2 p 5 3 s n 2 l 4 ( 4 n 2 6 and 0 l 4 2 ) , 2 p 5 3 l 1 2 ( 1 l 1 2 ) , 2 p 5 3 p 3 d , and 2 p 5 3 p 4 l 4 ( 0 l 4 2 ) . The RMBPT and RCI methods were employed using the Flexible Atomic Code (FAC) [25] (RCI method from FAC hereafter FAC-RCI) to calculate the various atomic and transition parameters, as mentioned earlier [26]. In this calculation, the impact of several other excited states was explored by including the orbitals up to 7l (where l = 0–4). This extended consideration not only aids in investigating the reliability of the relativistic wave functions, energies, and transition parameters determined using these methods but also enables their assessment through comparison with the parameters obtained from the RMCDHF-RCI GRASP 2018 [24] calculation. Here, the results obtained for these parameters through different relativistic methods consistently align with the data from the NIST database [27] and Rathi et al. [28]. This comparative analysis indicates that the wave functions have been effectively optimized. Therefore, these refined wave functions are suitable for subsequent calculations pertaining to electron-ion collision parameters and the development of the plasma model.
The atomic structure and transition parameters calculated through the FAC-RCI method are integrated into the detailed electron collision and CR model calculations. The relativistic bound-state wave functions, generated using the FAC-RCI method, are incorporated in constructing the Transition matrix (T-matrix) for excitation cross-section computations. Here, we calculated detailed EIE cross-sections from the ground state to the 2 p 6 3 l 1 ( 1 l 1 2 ) , 2 p 6 n l ( 4 n 7 and 0 l 2 ) excited states and among the excited states, along with their respective rate coefficients, using the Relativistic Distorted Wave (RDW) method [26]. The EIE cross-sections of various fine structure transitions are reported for the incident electron energies ranging from the excitation threshold up to 21 keV, and excitation rate coefficients are presented for the transitions from the ground state only as a function of electron temperature, ranging up to 600 eV.
Moreover, a suitable CR model was developed to generate a theoretical synthetic spectrum for the EUV spectral analysis of Kr 25 + ion. In the development of a CR model, we incorporated various population transfer kinetic processes among the considered fine structure levels of the Kr 25 + ion, including electron impact excitation, ionization, radiative decay, and their corresponding reverse processes, such as electron impact de-excitation and three-body recombination. The rate balance equation constructed with the help of these collisional and radiative processes utilizes the rate coefficients of the different processes calculated using the FAC. In the CR model calculation, rate balance equations are solved simultaneously for the considered fine structure levels of Kr 25 + ion. The theoretical CR model synthetic spectrum of Kr 25 + ion is generated based on the intensities of the emission lines, which are determined by the state population of the respective fine structure level involved in the radiative transition. Further, the emission lines from the Na-like Kr ion observed in the EUV spectrum, viz. 22.00 nm, 17.89 nm, 16.51 nm, 15.99 nm, and 14.08 nm, respective to 2 p 6 3 p ( 2 P 1 / 2 o ) 2 p 6 3 s ( 2 S 1 / 2 ) , 2 p 6 3 p ( 2 P 3 / 2 o ) 2 p 6 3 s ( 2 S 1 / 2 ) , 2 p 6 3 d ( 2 D 3 / 2 ) 2 p 6 3 p ( 2 P 3 / 2 o ) , 2 p 6 3 d ( 2 D 5 / 2 ) 2 p 6 3 p ( 2 P 3 / 2 o ) , and 2 p 6 3 d ( 2 D 3 / 2 ) 2 p 6 3 p ( 2 P 1 / 2 o ) transitions, are compared with the theoretical CR model spectrum. The comparative analysis suggests that the line emission wavelengths and their respective intensities in LHD spectral measurement align well with the CR model calculations, demonstrating a significant degree of agreement.
The CR model developed for this work aims to demonstrate the reliability of the atomic structure parameters and electron-ion collision calculations based on the precision of the wave functions. An extensive analysis of the theoretical CR model spectrum, in conjunction with the LHD-measured spectrum, for the calculation of electron temperature and electron density, along with absolute intensity comparison, is not in the scope of this article. Through this comparison, we can assert that the current atomic structure and electron-ion collision calculation data and the corresponding CR model synthetic spectrum of the Na-like Kr ion are reliable to incorporate in EUV spectroscopic diagnostics for future fusion experiments in different tokamak devices.
This article is arranged as follows: In Section 2, the details of the Kr gas impurity seeding experiment in LHD are discussed. A concise overview of the relativistic theoretical methods is given in Section 3. In Section 4, the results of excitation energies, transition parameters, fine structure EIE cross-sections, and rate coefficients of Kr 25 + ion are presented and discussed. In Section 5, we briefly describe the development of the CR model, and a comparison of the theoretical spectrum from the CR model with the LHD-measured spectrum is discussed.

2. Kr Gas Impurity Seeding Experiment in LHD

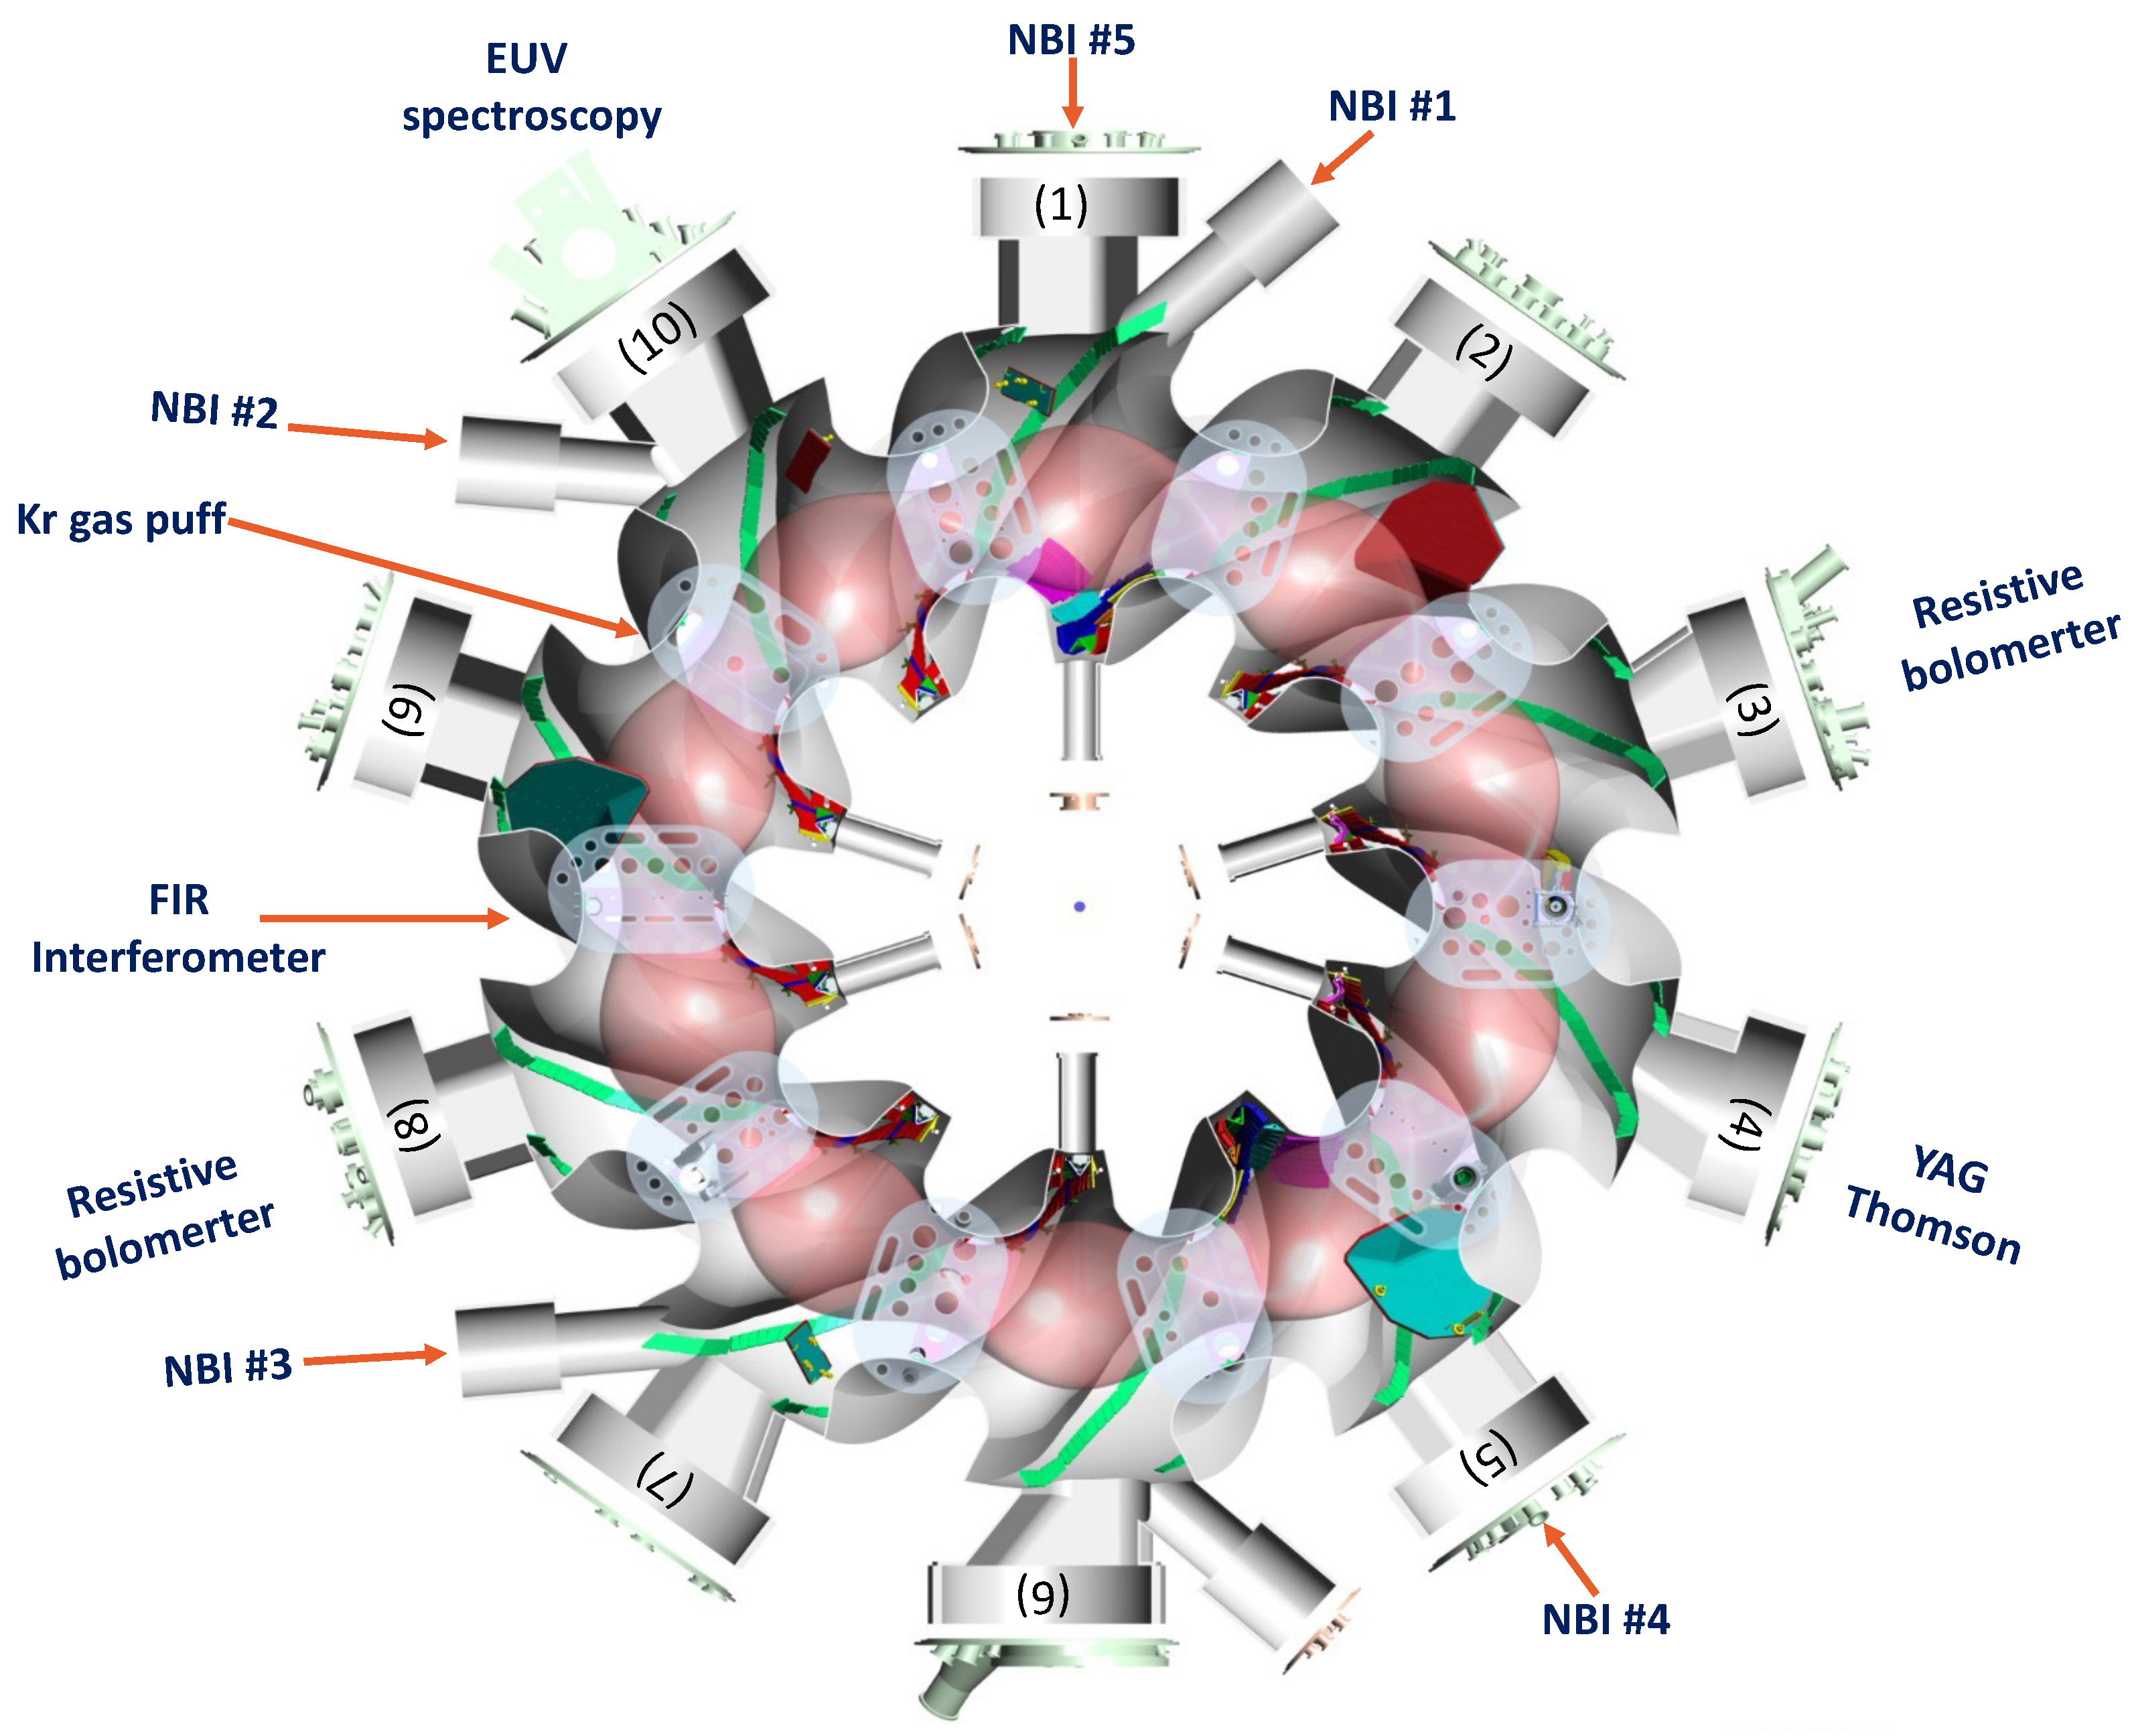
2.1. Experimental Setup on LHD

LHD is a superconducting fusion plasma confinement device that operates within a heliotron magnetic configuration. The integral coil configuration of LHD consists of a pair of continuous superconducting helical coils featuring poloidal and toroidal pitch numbers of 2 and 10, respectively, along with three pairs of superconducting poloidal coils [29]. In the standard configuration with a toroidal magnetic field of 3 T and a maximum plasma volume of 30 m 3 , LHD plasma possesses major (R) and averaged minor (a) radii of 3.6 m and 0.64 m, respectively [4,29,30,31]. Figure 1 depicts a schematic representation of an experimental setup on LHD. In the LHD experiment, plasma ignition is initiated using Electron Cyclotron Heating (ECH) and sustained with the use of Negative-Neutral Beam Injections (N-NBIs) and Positive-Neutral Beam Injections (P-NBIs) labeled as NBIs #1–5. N-NBIs are inserted into the plasma with a major radius of the magnetic axis R ax = 3.6 m, a toroidal magnetic field strength B t = 2.75 T, a pitch parameter γ = 1.2538, and canceling rate of the quadrupole field B q = 100 % . The Kr gas puff is introduced into the vacuum vessel from the port at 9.5. Resistive Bolometers installed at outer ports 3 (3-O) and 8 (8-O) are utilized to measure the total radiation power ( P rad ) from the core and edge plasma regions [32]. The line-averaged electron density ( n ¯ e ) is measured from a Far-Infrared (FIR) interferometer installed at port 8.5 [33]. However, the measurement of the radial profiles of the electron temperature ( T e ) and electron density ( n e ) is conducted using a Yttrium Aluminum Garnet (YAG) Thomson system installed at port 4 [34]. The emission profile of Kr ions, including Kr 23 + , Kr 24 + , and Kr 25 + charge states, is measured using EUV spectroscopy through a flat-field grazing incidence EUV long spectrometer [35], which was installed at the 10-O port located on the outboard side of the 10th toroidal section. Here, the exit slit of the spectrometer is equipped with a back-illuminated CCD detector (Andor model DO420-BN: 1024 × 256 pixels, with a pixel size of 26 × 26 μ m 2 ) and the temporal evolution of the emission spectrum is measured with a time resolution of 5 ms [4]. In this work, the emissions from the Kr ions measured from the EUV long spectrometer are reported in the wavelength range of 14–23 nm. The details of the spectral measurement will be discussed in Section 5.

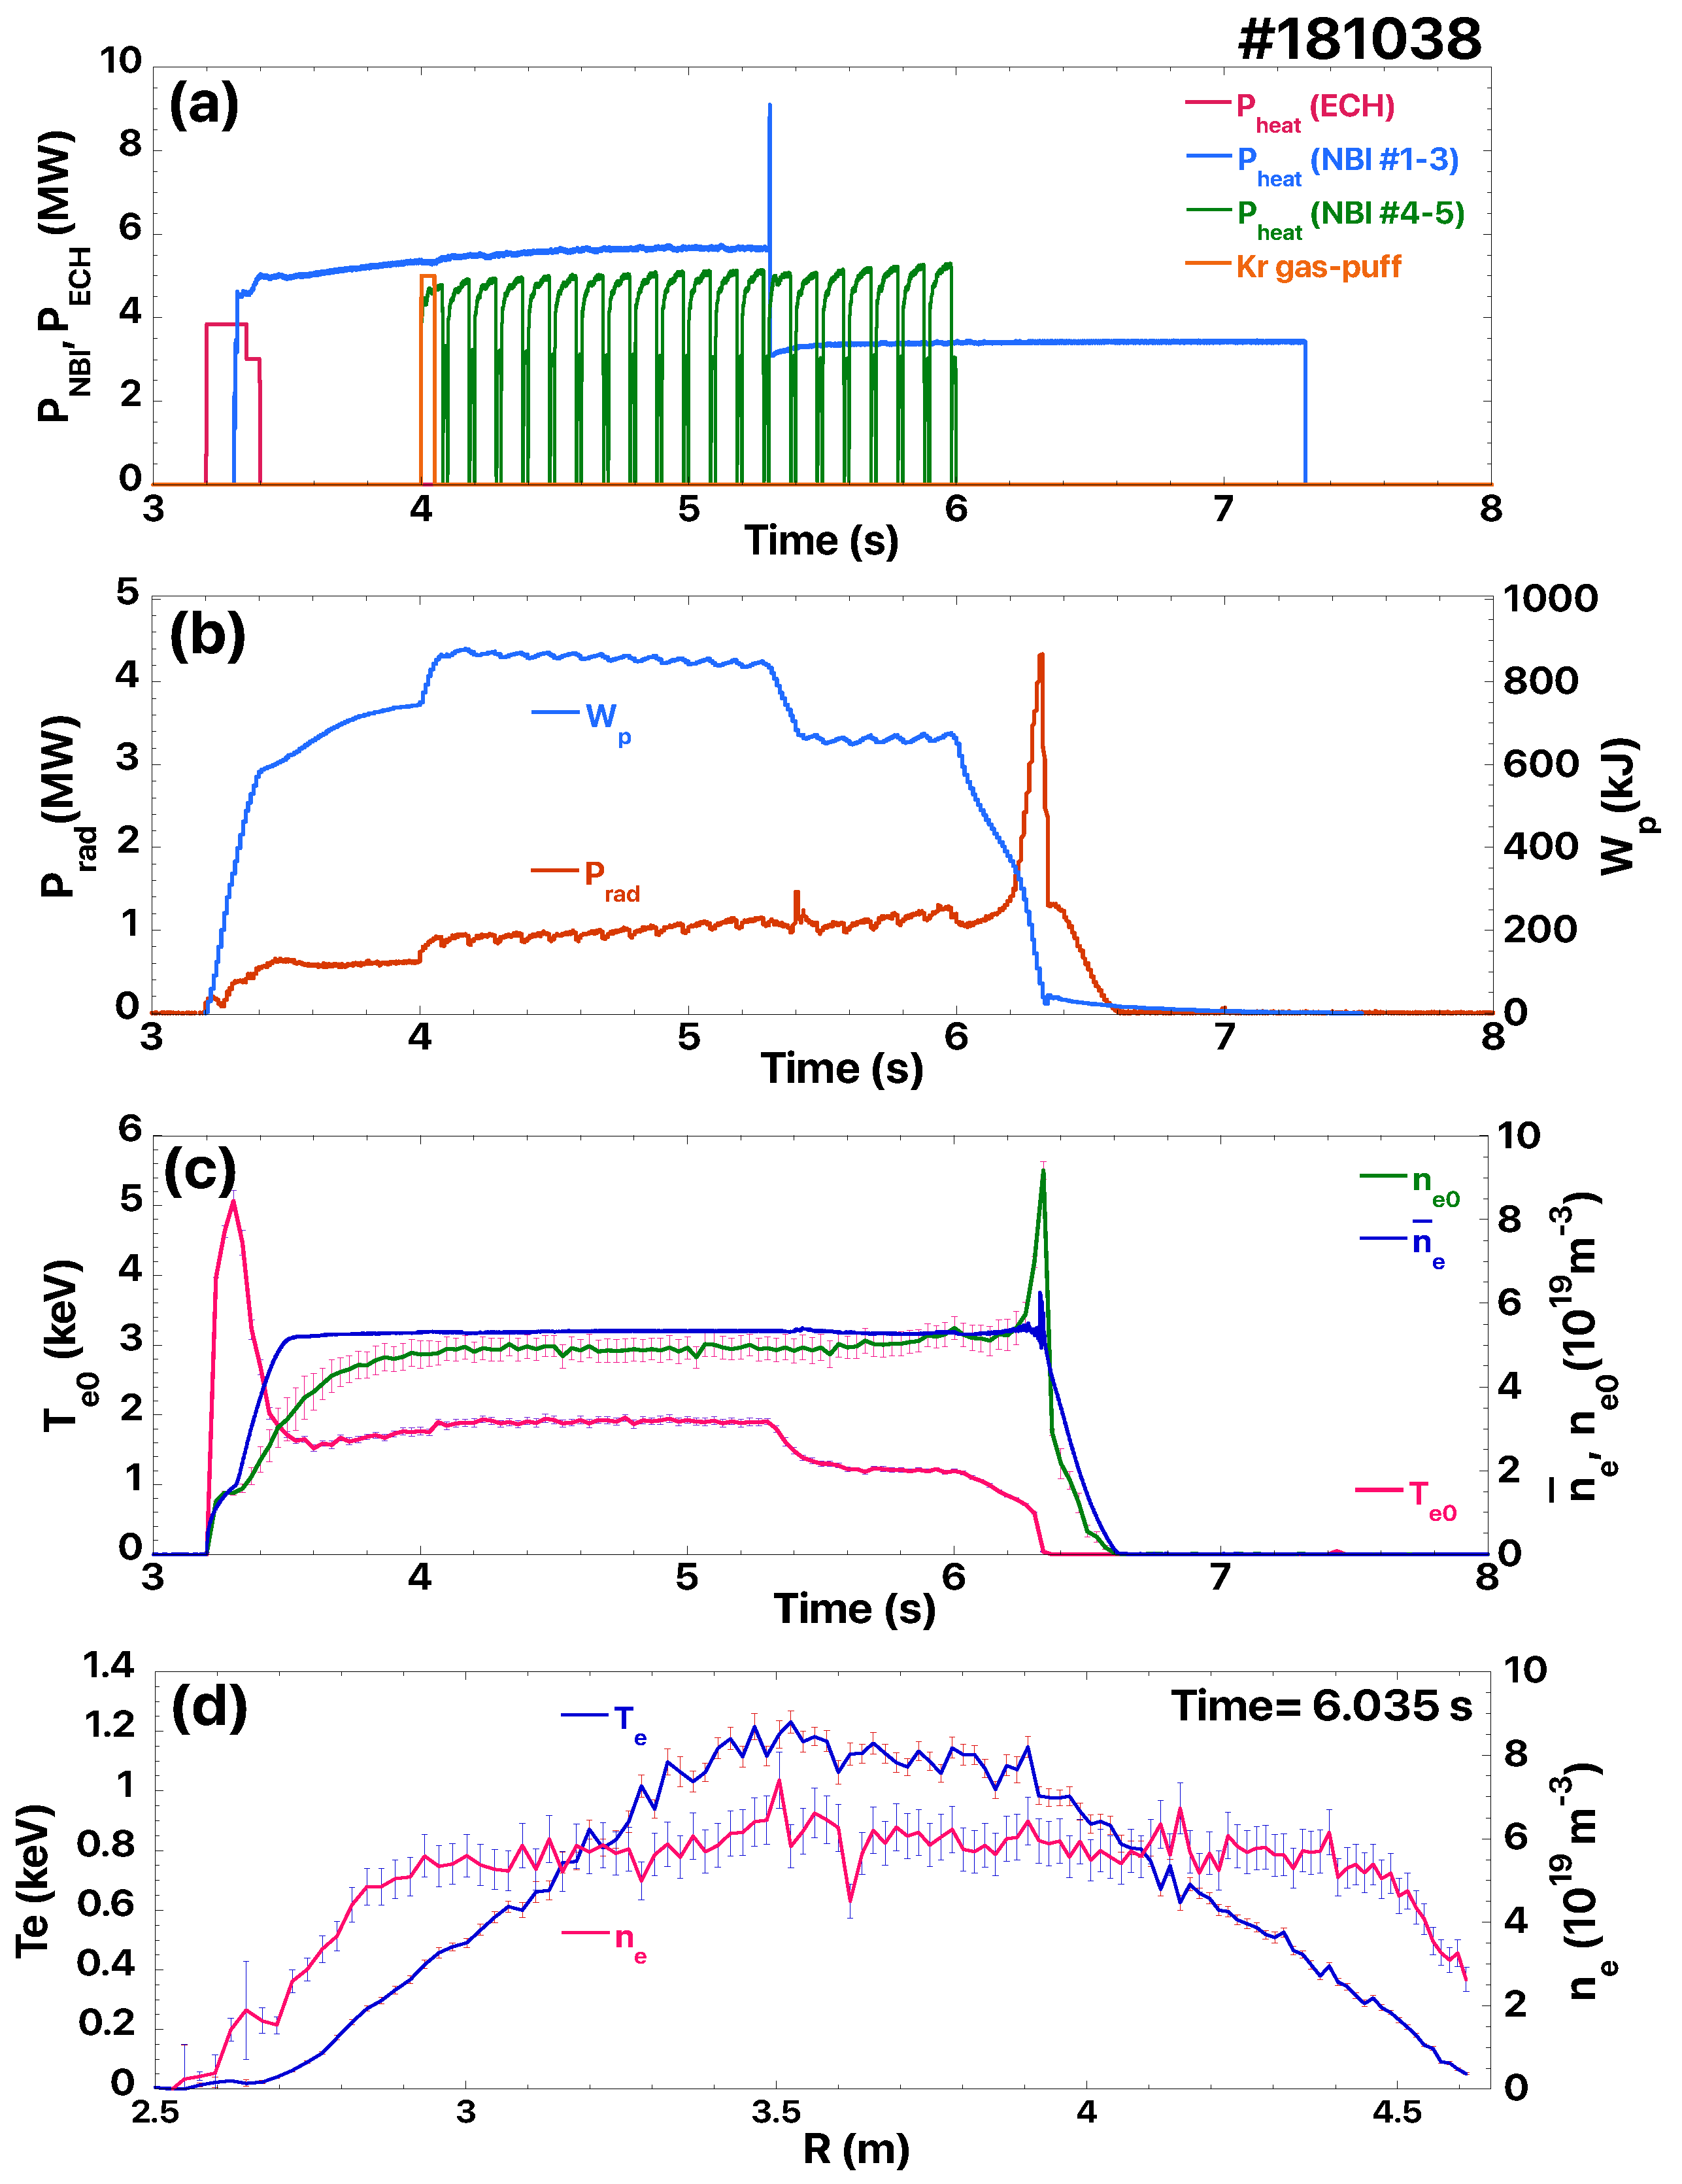
2.2. LHD Plasma Behavior in Kr Seeding Experiment

Typical time evolution waveforms of different plasma parameters associated with the Kr gas seeding experiment in LHD are presented in Figure 2, alongside the radial profiles of the electron temperature and a density at 6.035 s. Figure 2a shows the injection patterns of plasma heating to sustain the ignited plasma. For plasma generation, ECH is applied over a duration of 3.2–3.4 s. Additionally, NBIs #1–2 and NBI #3 are engaged to sustain the plasma from 3.3 to 5.3 s and 5.3 to 7.3 s, respectively, and NBIs #4–5 are injected over a duration of 4.0–6.0 s. Kr gas is injected into the vacuum vessel as an external impurity at 4.0 s for a duration of 50 ms to assess the behavior of different parameters within the Kr-seeded experiment. The variation in total radiation power ( P rad ) and plasma stored energy ( W p ) is presented in Figure 2b, revealing a gradual increase in magnitude following the Kr gas infusion. Notably, within this discharge, the effect of power modulation of NBIs #4–5 is clearly discernible in the time evolution pattern of the P rad and W p parameters. Figure 2c provides insights into the behavior of the central electron temperature ( T e 0 ) , density ( n e 0 ) , and line-averaged electron density ( n ¯ e ) , suggesting that the injection of the Kr gas does not deteriorate the plasma confinement. Emission lines from Na-like Kr ion are observed at 6.035 s; thus, the radial profiles of the electron temperature ( T e ) and density ( n e ) at 6.035 s are reported in Figure 2d. The Thomson Scattering (TS) diagnostic system in LHD is utilized to measure the electron temperature and density profiles of a Kr gas-seeded plasma along the major radius of LHD, specifically within a horizontally elongated section that comprises 144 spatial points [34,36]. In the TS diagnostic setup, backscattered light from each spatial point is meticulously collected using light collection optics, 144 optical fibers, 144 polychromators, and a data acquisition system. This configuration enables us to precisely observe the entire plasma region along the major radius. The analysis system within this diagnostic setup provides precise values for T e and n e , each corresponding to distinct spatial points. Subsequent typical errors associated with these parameters are depicted in Figure 2d, highlighting variations specific to each light collection optic. However, the errors in the central electron temperature and density displayed in Figure 2c are not estimated from the Thomson Scattering measurements. The errors in T e 0 and n e 0 represent the standard deviations resulting from the polynomial fitting of the electron temperature and density profiles. Further details regarding the TS diagnostic system installed in the LHD can be found in the work of Narihara et al. [34], and the estimation of errors in the electron temperature and density profiles is discussed in the study by Funaba et al. [36].

3. Relativistic Theoretical Calculation Considerations

The calculation of electron impact excitation of Kr 25 + ion is initiated with the requirement of reliable initial and final bound-state wave functions in order to obtain the excitation energies and transition parameters, such as transition probabilities and oscillator strengths. The representation of multiconfiguration bound-state wave functions is approximated using an Atomic State Function (ASF) [37]. This ASF is mathematically expressed as the linear expansion over the basis states (also referred to as Configuration State Functions (CSFs)) with the same symmetries in angular momentum (J) and parity (P), as follows:
Ψ ( P J M ) = i = 1 N c i Φ i ( P J M )
Here, Φ i shows the contribution of CSFs along with their mixing coefficients c i via linear expansion up to the total number of CSFs (N) included in the calculation, while the argument P J M gives the information of respective CSFs in terms of parity (P), total angular momentum (J), and their z-component (M). These CSFs are represented as antisymmetric sums of the product of N one electron Dirac spinors. However, attaining precision in the ASF is an intricate endeavor that necessitates meticulous consideration of a substantial number of CSFs and their correlation effects during the computation process. The monitoring of CSFs’ contributions is performed through the associated mixing coefficients. The RMCDHF method, along with the RCI method provided within GRASP2018 and the RMBPT and RCI methods integrated into the FAC, were employed to calculate the wave functions of the initial and final states. Further details regarding the computation of these wave functions are discussed in Section 4.
The EIE cross-sections of the Kr 25 + ion from its ground state and excited states are calculated using the RDW method. Detailed information on the RDW method is available in previous articles [26,38,39]. Here, the calculation of the linked T-matrix for the transition from the lower state | J l M l μ l to the upper state | J u M u μ u involves the incorporation of the initial and final bound-state wave functions obtained from the RCI method of FAC, and the associated T-matrix expression can be written as follows [40,41] (atomic units are used throughout):
T l u R D W ( J u M u , k u μ u ; J l M l , k l μ l , θ ) = Φ u r e l ( 1 , 2 , , N ) F u , μ u D W ( k u , N + 1 ) | V U f | × A Φ l r e l ( 1 , 2 , , N ) F l , μ l D W + ( k l , N + 1 )
The EIE cross-sections for the considered fine structure transitions from the ground state to upper excited states, as well as among the excited states at a specific projectile electron energy (E), can be obtained using the following expression [40]:
σ l u e x = 2 π 2 ( 2 J l + 1 ) k u k l M u μ u M l μ l | T l u R D W ( J u , M u , k u , μ u ; J l , M l , k l , μ l , θ ) | 2 d Ω
The symbols and notations used in Equations (2) and (Section 3) have their usual meanings. The symbols Φ l r e l and Φ u r e l denote the relativistic bound-state wave functions of the Kr 25 + ion in the lower state (l) and the upper state (u), with position coordinates (1, 2, …, N) with respect to the nucleus. J l / u and M l / u indicate the total angular momentum quantum number and its associated magnetic quantum number in the respective states. The notation F l / u , μ l / u D W + ( ) represents the distorted wave functions of the incoming (outgoing) projectile electron, with position coordinate (N + 1) with respect to the nucleus, and the sign +/− refers to the incoming and outgoing waves. Here, the symbols μ l and μ u are the spin projections of the incident and scattered electrons, and θ is the angle between their wavevectors ( k l / u ). The antisymmetric operator ’A’ takes into account the effect of the exchange of projectile electrons with the bound electrons of Kr 25 + ion. ’V’ represents the Coulomb interaction potential due to the interaction between the projectile electron and the Kr 25 + ion, and ’U’ refers to the distortion potential, which depends only on the radial coordinates of the projectile electron.
To appropriately integrate the electron impact excitation process into a suitable plasma model, the necessary excitation rate coefficients can be derived using the computed EIE cross-sections and calculated using the following expression [40,42]:
R l u e x = 2 E l u σ l u e x ( E ) E f ( E ) d E
Here, E l u denotes the excitation threshold energy of a particular fine structure transition from the lower level to the upper level. σ l u e x signifies the associated EIE cross-section computed at varying incident electron energies, referred to as E. Further, the symbol f ( E ) represents the Electron Energy Distribution Function (EEDF), and it is considered to be a Maxwellian distribution in the present study.

4. Results and Discussion

4.1. Relativistic Multiconfiguration Wave Functions of Kr 25 + Ion

As we know, the electronic configuration of Kr 25 + is 1 s 2 2 s 2 2 p 6 3 s in non-relativistic notation. In the calculation, the 1s orbital has been designated as the core orbital, while the 2s, 2p, and 3s orbitals serve as the peel orbitals. In the present RMCDHF-RCI computation, we considered 39 fine structure levels of different excited states, all of which are associated with the selected multi-reference configurations. In the initial approximation, the 2 p 6 3 l 1 ( 1 l 1 2 ) and 2 p 6 n l ( 4 n 7 and 0 l 4 ) configurations are referred to as multi-reference configurations with up to 7l ( 0 l 4 ) spectroscopic orbitals. The wave function calculation is initialized using the CSFs generated with the considered MR configurations. Here, a simultaneous calculation was carried out using the considered even and odd parities MR configurations for the reference wave functions and energy levels using the GRASP 2018 code [24]. In this case, the electron correlation within the MR configurations is incorporated through the RMCDHF-RCI computations and the resulting values of excitation energies are denoted as Dirac–Fock ( E DF ) and are reported in Table 1. For further refinements in the calculation, an active set approach was employed, and a deliberate expansion of the active set was systematically undertaken to accommodate the electron correlation effects. In this connection, principal quantum number 8 orbitals, such as 8l (where l = 0–4; l is an orbital quantum number), were incorporated as a layer of correlation orbitals in the calculation to correct the reference CSFs. Moreover, valence–valence and core–valence correlations via Single Double (SD) excitation were also included, which led to the generation of a large number of CSFs [21,22] for both even and odd configurations. Specifically, the even set of configurations yielded 2,205,128 CSFs, while the odd set of configurations contributed 1,570,415 CSFs to the overall calculation. A fine structure splitting within excited states was observed as well due to the size of Kr 25 + ion and important relativistic effects. Therefore, the layers of further correlation orbitals and triple excitation are not included in the calculation due to the limitation of the available computational facility. However, relativistic corrections such as transverse photon interaction, vacuum polarization, and self-energy are implemented through the RCI calculation. The excitation energies of the fine structure levels computed from this method are termed as E RMCDHF - RCI and reported in Table 1. Further, the convergence of these multiconfiguration wave functions is tested by comparing the excitation energies available for the fine structure levels in the NIST database ( E NIST ) [27] and reported by Rathi et al. [28]. Moreover, the radiative transition rates ( A RMCDHF - RCI ) and weighted oscillator strengths ( gf RMCDHF - RCI o s c ) of the dipole-allowed transitions are obtained utilizing the transformed initial and final state wave functions and are reported in Table 2.
An additional EIE calculation of Kr 25 + ion was performed for the atomic structure and electron collision parameters to develop a suitable CR model for the interpretation of spectroscopic measurement in the Kr gas seeding experiment. In this set, we utilized the RCI method integrated within the FAC [25]. The considerations encompass a range of excited state configurations such as 2 p 6 3 l 1 ( 1 l 1 2 ) , 2 p 6 4 l 2 ( 0 l 2 3 ) , 2 p 6 n 1 l 3 ( 5 n 1 7 and 0 l 3 4 ) , 2 p 5 3 s 3 l 1 ( 1 l 1 2 ) , 2 p 5 3 s n 2 l 4 ( 4 n 2 6 and 0 l 4 2 ) , 2 p 5 3 l 1 2 ( 1 l 1 2 ) , 2 p 5 3 p 3 d , and 2 p 5 3 p 4 l 4 ( 0 l 4 2 ) . To ensure the consistency of this FAC-RCI calculation, we expanded the atomic-ion structure calculations by employing the second-order RMBPT method to obtain precise excitation energies and transition parameters. In the RMBPT and FAC-RCI calculations, we incorporated 385 fine structure levels for the considered configurations. The RMBPT method is based on an approximation of the Dirac–Coulomb–Breit (DCB) Hamiltonian as H D C B = H D C + H B r e i t ; a detailed description of the method is explained in Lindgren [43], Safronova et al. [44], Vikas et al. [45], and Gu [46,47].
In the FAC, the RMBPT approach entails the division of the Hilbert space of the system into two distinct subspaces: a model space specified as M and an orthogonal space referred to as O. The effect of states beyond the M space is conventionally considered through a perturbation expansion and included as part of the non-Hermitian effective Hamiltonian. The correct eigenvalues of the Dirac–Coulomb–Breit Hamiltonian can be ascertained by solving the eigenvalue problem corresponding to the total effective Hamiltonian. Here, the M space encompasses a meticulous inclusion of configuration interaction effects, and the interplay between the M and O spaces is accounted through the perturbation method. In the method, the Breit interaction, along with the relevant QED corrections, is likewise taken into account as well in the same manner as for the RMCDHF-RCI calculations. In the present RMBPT calculation, all the possible considered configurations with the principal quantum number 3 n 7 and the orbital quantum number 0 l 4 are part of M space for Kr 25 + ion. While configurations in O space are the possible contribution from the single and double excitations of configurations in M space, the maximum values of the related quantum numbers in these SD excited configurations are [ n ] S 125 , [ n ] D 65 , and [ l ] S , D 20 . Present RMBPT and FAC-RCI calculations were performed using the eight processors mode in the parallelized version of the FAC, i.e., FAC 1.1.5 [25].
The excitation energies obtained from the FAC-RCI, RMBPT, and RMCDHF-RCI methods are meticulously compared with the data sourced from the NIST database [27] and the findings reported by Rathi et al. [28], and these results are reported in Table 1. In the initial approximation of the RMCDHF-RCI method, the excitation energies computed from the MR configurations are presented as preliminary values in Table 1, designated as E DF . The average difference between these E DF values and the NIST database is 0.638 eV. For further precision in excitation energy, a layer of correlation orbitals was integrated into the calculation, extending it to double excitation. This extension resulted in the generation of 2,205,128 CSFs for the even set of configurations and 1,570,415 CSFs for the odd set of configurations. This calculation significantly improved the excitation energy values and reduced the average energy difference between the E RMCDHF - RCI and the NIST database from 0.638 eV to 0.192 eV. The average relative percentage also decreased from 0.106% to 0.032% for E RMCDHF - RCI in relation to the NIST values. As a result, remarkable convergence was achieved in RMCDHF-RCI calculations concerning the NIST values. Nevertheless, the results for excitation energies corresponding to the fine structure levels of the 2 p 6 3 p excited state displayed substantial improvement, with the relative percentage decreasing from 0.240% to 0.023% for the 2 p 6 3 p 2 P 1 / 2 o level and from 0.17% to 0.01% for the 2 p 6 3 p 2 P 3 / 2 o level. Moreover, the results obtained from the FAC-RCI and RMBPT methods demonstrate that the average difference in excitation energies relative to the NIST values is nearly identical, at approximately 0.67 eV. The average relative percentage from these two approaches is notably small, obtaining a mere 0.055%, closely resembling the precision exhibited by the RMCDHF-RCI method, as discussed above. In addition, the FAC-RCI calculation displays an average difference of 0.358 eV when compared with RMCDHF-RCI, signifying the effectiveness of our FAC-RCI calculations. However, the average difference between FAC-RCI and RMBPT, which is 0.062 eV, further underscores the consistency of our relativistic calculations across various methodologies. The comparison of excitation energies obtained from different relativistic methods with the NIST values reveals a strong convergence, indicating an overall excellent agreement with the NIST ASD [27] and the work of Rathi et al. [28]. This excellent agreement contributes to establishing the reliability of our wave functions and supports their utility in the context of atomic ion structure and electron-ion collision parameters determined in this study. Here, it is worth mentioning that we employed jj-coupling throughout the calculation to describe the fine structure states of the considered configurations. Nevertheless, for the sake of reader convenience and simplicity, the energy levels presented in Table 1 are described using LS-coupling. Moreover, Table 2 provides the weighted oscillator strengths and transition rates for fine structure transitions calculated using the RMCDHF-RCI, FAC-RCI, and RMBPT methods within the framework of GRASP 2018 and FAC. The wavelengths of various dipole-allowed transitions, computed through these theoretical methods, are compared with the NIST database [27] and presented in Table 3. These findings not only validate the suitability of our calculations for the forthcoming electron-ion collision investigations but also accentuate their potential applicability.

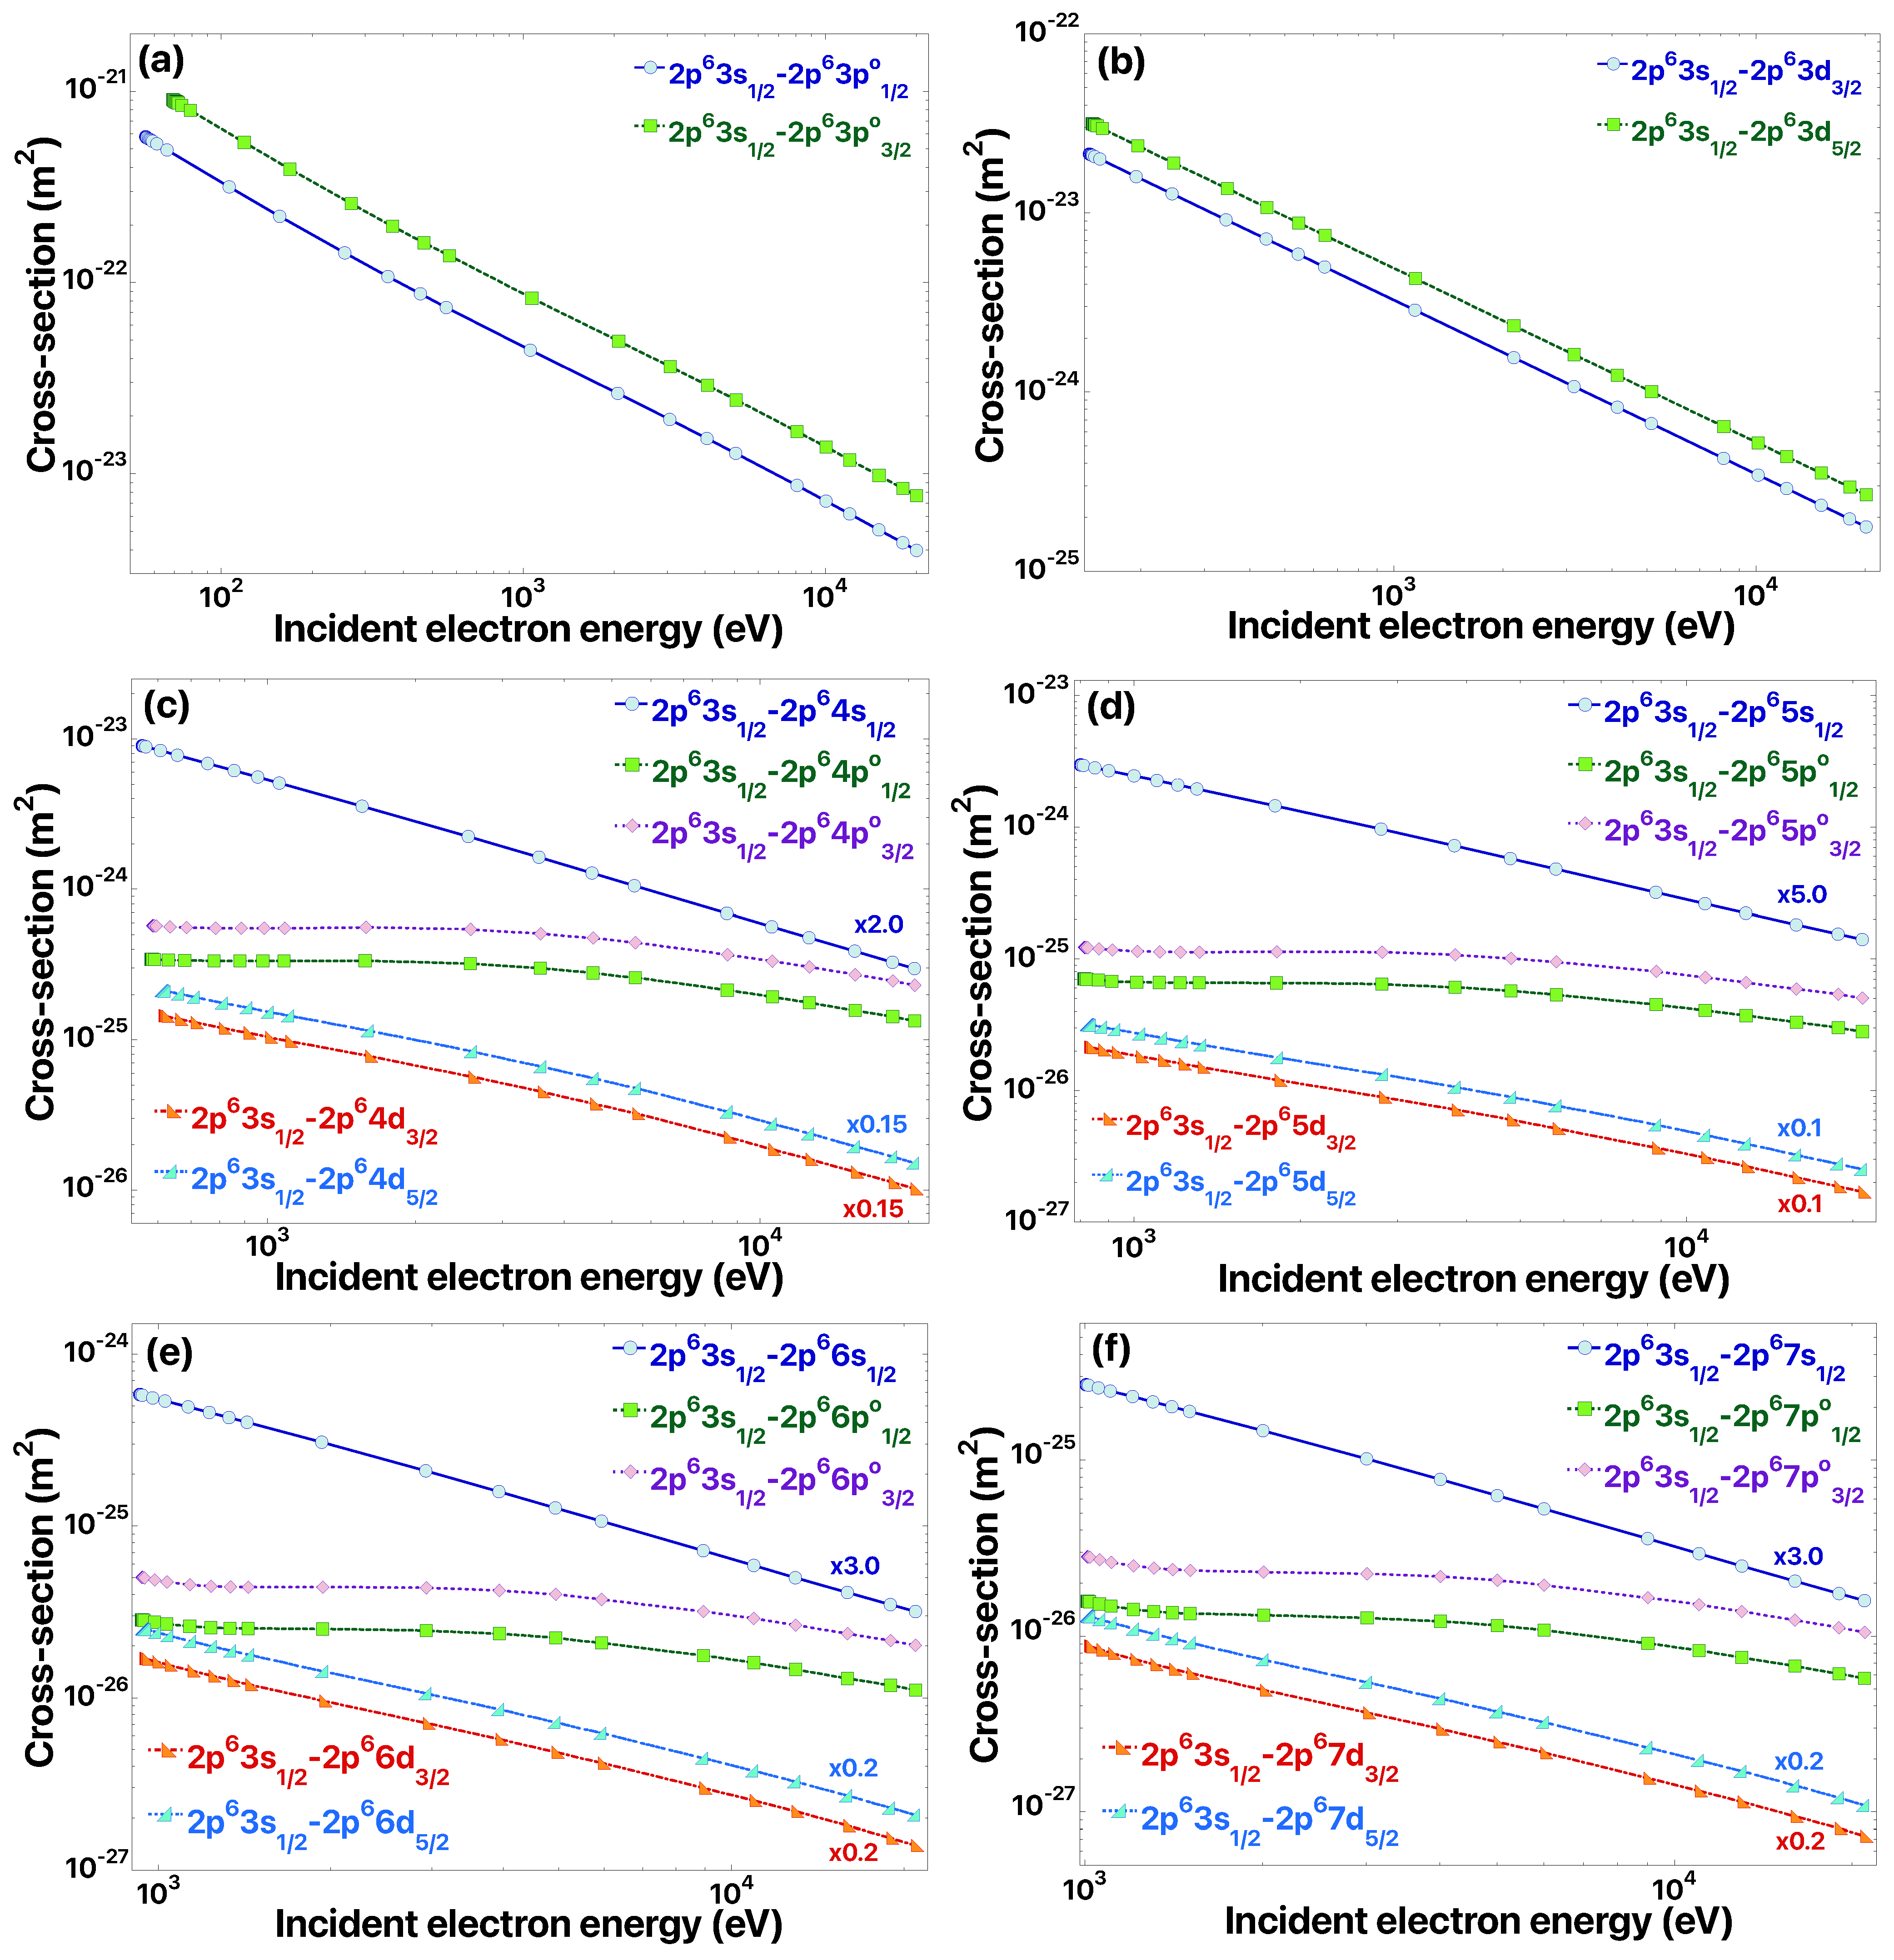
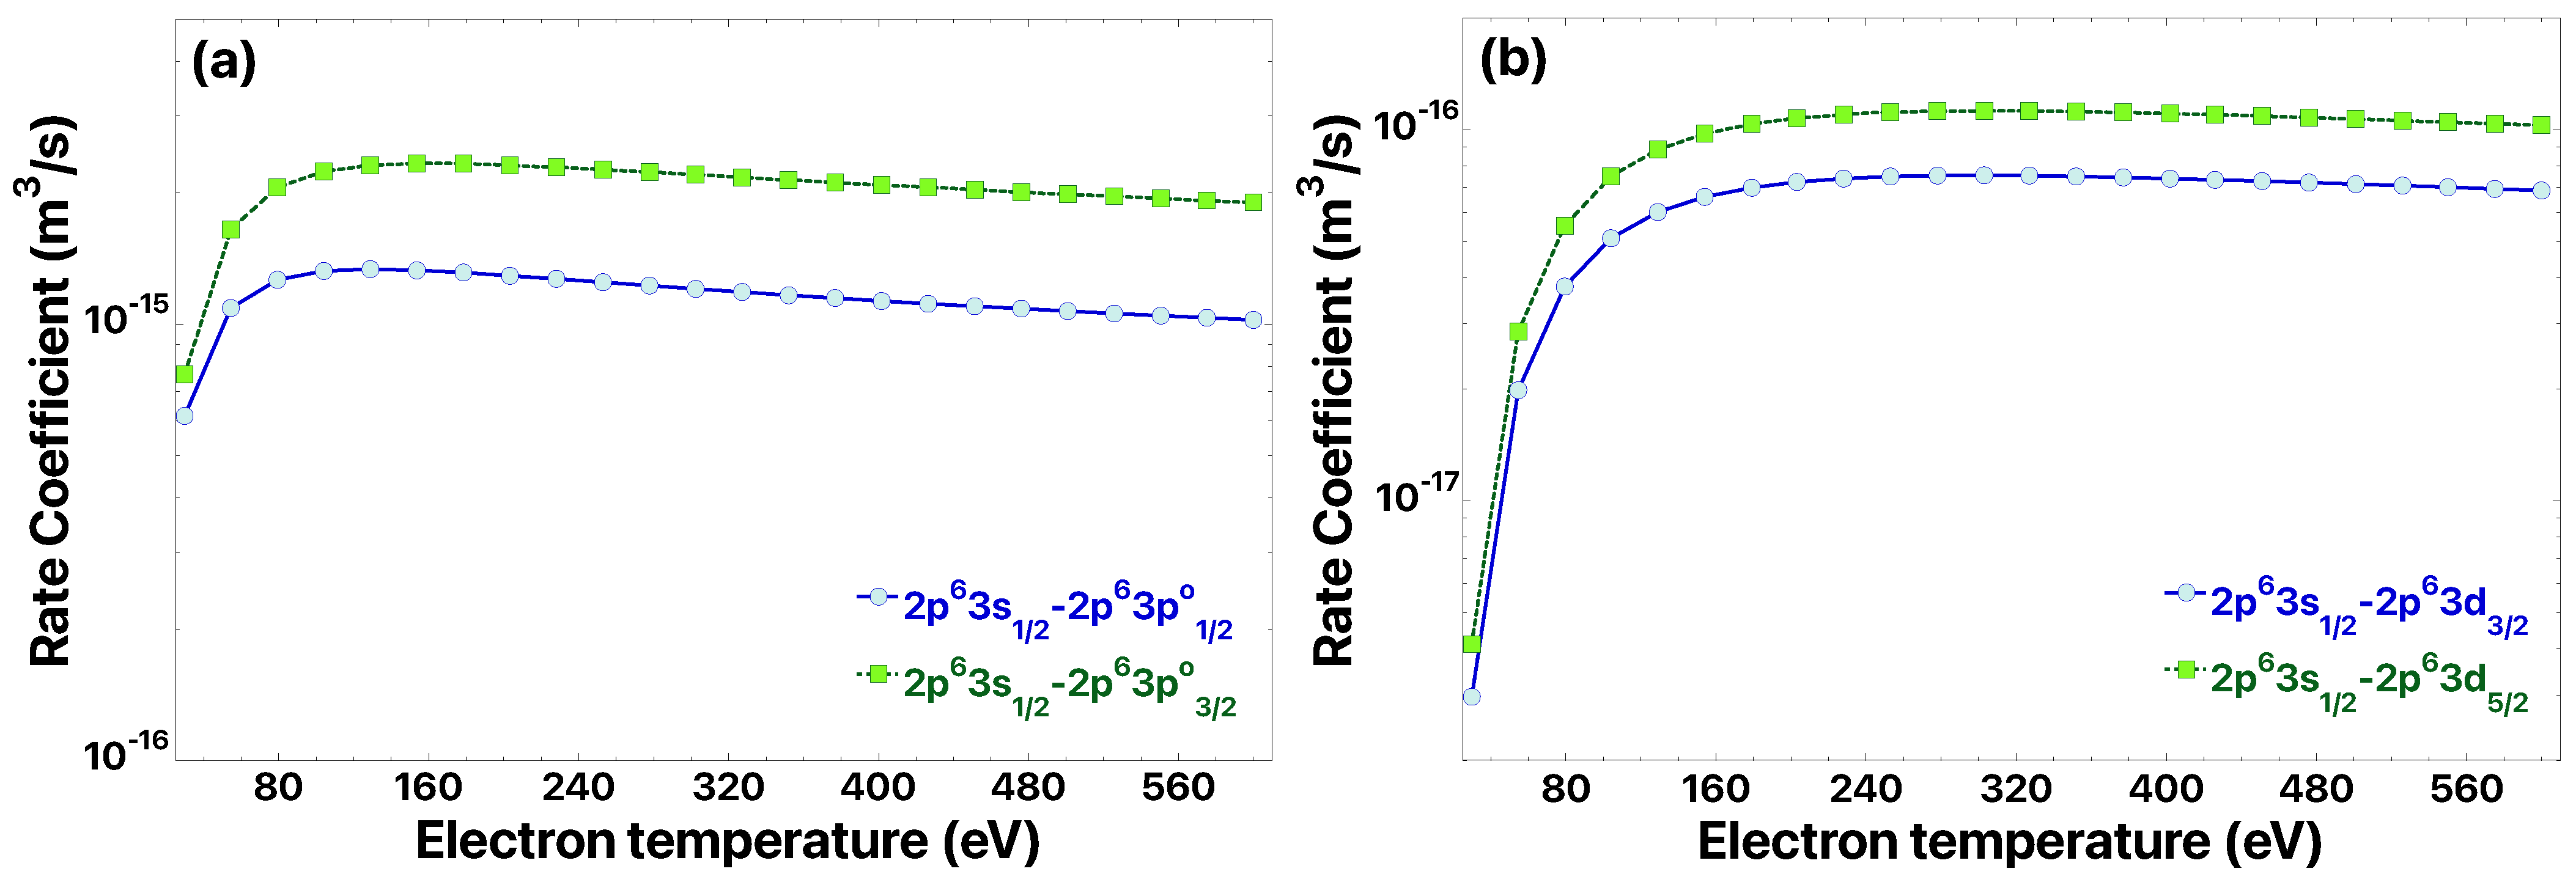
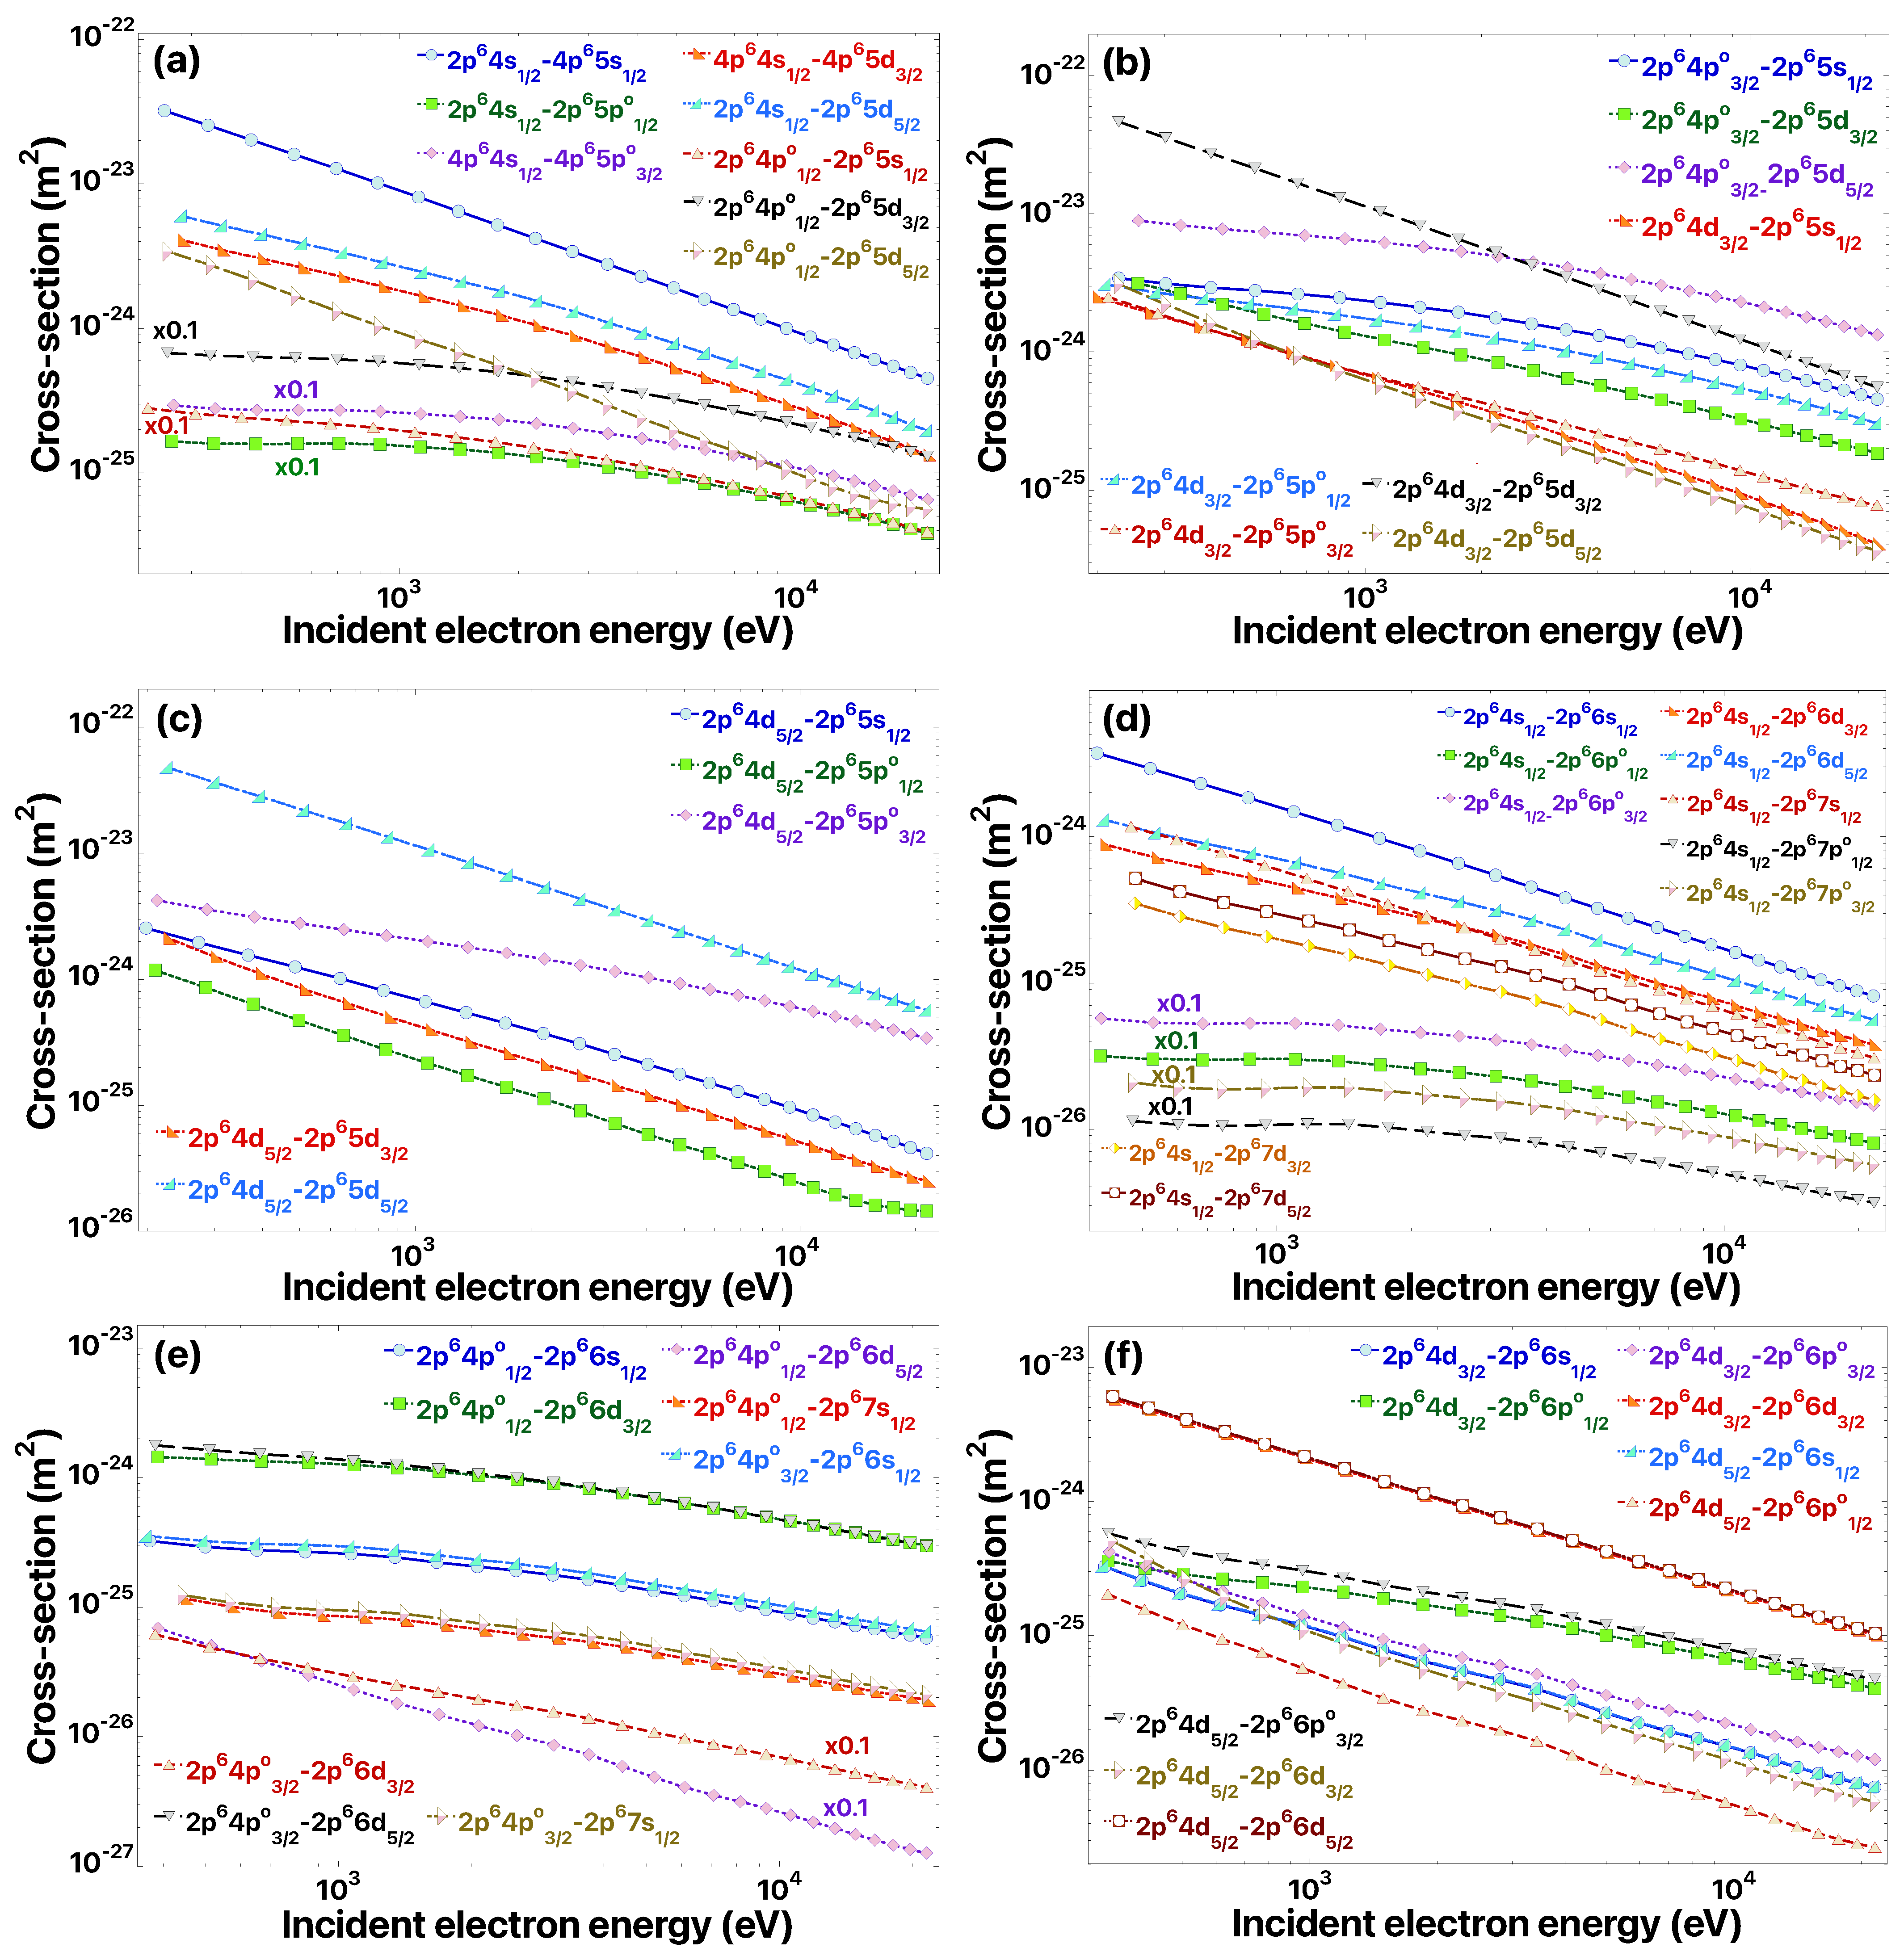
4.2. Electron Impact Excitation Cross-Section for Kr 25 + Ion

In this section, we present the electron impact excitation cross-sections for various transitions among the fine structure levels within Kr 25 + ion. In the calculation, the relativistic bound-state wave functions, generated through the FAC-RCI method, are incorporated in the formulation of the T-matrix for the meticulous computation of EIE cross-sections. Figure 3a–f display the EIE cross-sections for the transitions from the ground state, i.e., 2 p 6 3 s ( 2 S 1 / 2 ) , to the upper fine structure levels, including the 2 p 6 3 l 1 (where 1 l 1 2 ), 2 p 6 4 l 2 , 2 p 6 5 l 2 , 2 p 6 6 l 2 , and 2 p 6 7 l 2 (where 0 l 2 2 ) excited states. In Kr 25 + ion, any 2 p 6 n 1 s state (where 3 n 1 7 ) possesses a single fine structure state, whereas 2 p 6 n 2 p and 2 p 6 n 2 d excited states (where 3 n 2 7 ) possess two fine structure states.
In Figure 3a,b, we present the electron impact excitation cross-sections from the ground state ( 2 p 6 3 s ) to the 2 p 6 3 p and 2 p 6 3 d excited states. In these transitions, the ground state of the Kr 25 + ion exhibits even parity, while the 2 p 6 3 p and 2 p 6 3 d excited states possess odd and even parities, respectively. Subsequently, the excitation from the 2 p 6 3 s state to the 2 p 6 3 p state represents the dipole-allowed transitions, whereas the excitation from the 2 p 6 3 s state to the 2 p 6 3 d signifies the dipole-forbidden transitions. In Figure 3a,b, we depict the EIE cross-sections for both dipole-allowed transitions ( 2 p 6 3 s 1 / 2 2 p 6 3 p 1 / 2 o and 2 p 6 3 s 1 / 2 2 p 6 3 p 3 / 2 o ) and forbidden transitions ( 2 p 6 3 s 1 / 2 2 p 6 3 d 3 / 2 and 2 p 6 3 s 1 / 2 2 p 6 3 d 5 / 2 ) as a function of incident electron energies, ranging from the excitation threshold to 21 keV. The characteristics of the cross-section curves for the 2 p 6 3 p and 2 p 6 3 d configurations are alike, with notable differences: the cross-sections for the dipole-allowed transitions are notably higher, by two orders of magnitude, compared with the forbidden transitions depicted in Figure 3b. Further, it is evident that as the incident electron energy increases, the cross-section values for the forbidden transitions decrease more rapidly when compared with the dipole-allowed transitions. The connection between the magnitude of the cross-sections and the specific total angular momentum ( J ) values associated with fine structure transitions becomes apparent when examining Figure 3a,b. The EIE cross-sections for the dipole-allowed transitions with higher angular momentum J values are of greater magnitude, and a similar trend is observed for the forbidden transitions. Additionally, it is worth noting that the cross-sections exhibit a decrement pattern relative to changes in total angular momentum J, following the order as Δ J = 1 > 0 in Figure 3a and Δ J = 2 > 1 in Figure 3b.
In examining Figure 3c–f, the EIE cross-section curves provide insight into transitions originating from the ground state to the fine structure levels of the 2 p 6 4 l 2 , 2 p 6 5 l 2 , 2 p 6 6 l 2 , and 2 p 6 7 l 2 (where 0 l 2 2 ) excited states. An observable consistent pattern emerges, wherein the magnitude of the cross-section curves experiences a decline connected with the increase in both the principal quantum number and corresponding excitation energies. To provide a clearer representation of the cross-sections for transitions leading to the 2 p 6 4 l 2 , 2 p 6 5 l 2 , 2 p 6 6 l 2 , and 2 p 6 7 l 2 (where l 2 = 0 and 2) excited states, we undertook scaling, employing the values delineated in Figure 3c–f. Here, it is worth emphasizing that, in line with our previous observations in Figure 3a,b, the cross-sections associated with the forbidden transitions demonstrate a considerably steeper decline compared with the dipole-allowed transitions. This behavior persists with respect to total angular momentum J and changes in angular momentum ( Δ J ) within Figure 3c–f. Following the order delta Δ J = 1 > 0 and Δ J = 2 > 1 in Figure 3c–f for the transition leads to 2 p 6 4 l 2 , 2 p 6 5 l 2 , 2 p 6 6 l 2 , and 2 p 6 7 l 2 , corresponding to distinct orbital angular momentum values of 1 and 2, respectively.
Moreover, we present the results of the excitation rate coefficients for transitions originating from the ground state to the 2 p 6 3 p and 2 p 6 3 d excited states calculated using Equation (4), illustrated in Figure 4a,b, with due consideration to the electron temperature. The behavior observed in the EIE rate coefficient curves aligns as expected and is of a general nature. Specifically, these rates exhibit a propensity to increase and then become nearly flat as the electron temperature increases, a trend readily explicable by tracking the profile of the Maxwellian electron energy distribution function in relation to the temperature variation. Here, in the case of 2 p 6 3 s 1 / 2 2 p 6 3 p 1 / 2 o , 2 p 6 3 s 1 / 2 2 p 6 3 p 3 / 2 o , 2 p 6 3 s 1 / 2 2 p 6 3 d 3 / 2 , and 2 p 6 3 s 1 / 2 2 p 6 3 d 5 / 2 transitions, the excitation rates demonstrate an increase in the magnitude with rising electron temperature, extending up to 100 eV. Beyond this temperature range, the rate coefficients associated with these transitions maintain a relatively consistent profile up to 600 eV. Moreover, the EIE rate coefficient results regarding the transition from the ground state to the 2 p 6 4 l 2 , 2 p 6 5 l 2 , 2 p 6 6 l 2 , and 2 p 6 7 l 2 (where 0 l 2 2 ) excited states are presented in Figure A1 of Appendix A.
In addition, we have also compiled the EIE cross-section results, and these include the fine structure transitions among the 2 p 6 3 l 1 (where 1 l 1 2 ), 2 p 6 4 l 2 (with 0 l 2 3 ), and 2 p 6 n 1 l 3 (where 5 n 1 7 and 0 l 3 2 ) excited states. The calculated EIE cross-section of these transitions covers a wide range of incident electron energies from the excitation threshold to 21 keV, and corresponding results are presented in Figure A2 and Figure A3 of Appendix A. The variations in the magnitudes of these cross-sections depend upon multiple factors, including the essential characteristics of the transition, such as variations in the principal quantum number, orbital angular momentum, total angular momentum, parities respective to the initial and final states of the transitions, nature of the transition, etc., as discussed for Figure 3a,b.

5. Collisional-Radiative Model

In this section, we discuss the development of a suitable collisional-radiative model tailored for generating the theoretical synthetic spectrum within the context of the Kr gas impurity seeding experiment in LHD. In the present CR model, we incorporated the fine structure levels of various excited states, including 2 p 6 3 p , 2 p 6 3 d , 2 p 6 4 l 1 ( 0 l 1 3 ) , 2 p 6 5 l 2 , 2 p 6 6 l 2 , and 2 p 6 7 l 2 ( 0 l 2 4 ) , along with the ground state of Kr 25 + and Kr 26 + ions. For the sake of simplicity, 39 fine structure levels of the Kr 25 + ion responsible for line emissions in the EUV wavelength region are illustrated through the Grotrian diagram from the NIST database [27] and presented in Figure 5, and their excitation energies relative to the ground state are also provided in Table 1. Here, we monitored the distribution of population density among the considered fine structure levels by tracking their population and depopulation through different collisional and radiative processes occurring in the plasma environment. To achieve this, we included relevant population transfer kinetic processes such as electron impact excitation, de-excitation, ionization, three-body recombination, and radiative decay in the CR model, and these involved processes are listed below:
  • Electron impact excitation and de-excitation
    e i n c i d e n t + Kr 25 + ( l ) e s c a t t e r e d + Kr 25 + * ( u ) .
  • Electron impact ionization and three-body recombination
    e i n c i d e n t + Kr 25 + ( l ) Kr 26 + + e s c a t t e r e d + e e j e c t e d .
  • Spontaneous radiative decay
    Kr 25 + ( l ) Kr 25 + ( u ) + h ν l u .
The rate balance equation for the population of an excited upper level ( n u ) is constructed using the processes defined above. This upper level (u) can be populated through electron impact excitation and three-body recombination. Conversely, it can be depopulated through reverse processes, such as de-excitation and ionization. Further, it can also be populated and depopulated through the spontaneous radiative decay process, both from the upper to lower levels.
l l u k l u e x ( T e ) n l n e + l > u A l u n l + n e n + n e k + u ( T e ) l l u k u l d e e x ( T e ) n u n e l < u A u l n u n u n e k u + ( T e ) = 0
In the above equation, the terms designated as positive and negative refer to the processes associated with population and depopulation channels, respectively. The variables n e and T e denote the electron density and electron temperature, while n l represents the state population of the l t h energy level. In the rate balance equation, we utilized our computed radiative transition rates ( A u l ) for the decay from the upper energy level (u) to the lower energy level (l) as provided in Table 2. Further, the temperature-dependent excitation rates, denoted as k l u can be accurately calculated using the obtained EIE cross-sections and the Maxwellian electron energy distribution function, as shown in Equation (4). However, the de-excitation rates ( k u l ) are integrated within the model through the detailed balance principle and computed excitation cross-sections. Similar to the excitation rate coefficients, the ionization rate coefficient ( k u + ) is determined using the ionization cross-section. We computed the cross-section within the framework of the Distorted Wave (DW) approximation integrated within the FAC. The rate coefficient for three-body recombination ( k + u ) is also obtained through calculations conducted using the FAC code.
Here, the solutions of rate balance equations yield the population distribution among the fine structure levels within excited states encompassed by the CR model. Further, for the theoretical emission line profiles, the computed state population density is utilized to derive the intensity ( I u l ) associated with a specific emission line corresponding to the transition energy ( E l u ) . The theoretical CR model intensities of the emission lines originating from an upper level to any lower level ( u l ) can be computed using the I u l = E l u A u l n u expression. Here, these intensities are correlated with the population distribution of the upper levels ( n u ) . In this study, our initial calculation phase is focused on generating Kr 25 + ion within the complex LHD plasma environment. We based our selection of electron temperature on research conducted by Dong et al. [48], which establishes a correlation between ionization energy and the local electron temperature ( T eZ ). This correlation is further expounded upon in the work of Dong et al. [48]. Our work adopts this approximation, considering the electron temperature to be roughly half of the ionization potential associated with the relevant charge state, resulting in T eZ / E i ratios distributed around one-half. Therefore, for the preliminary CR model calculation, we set the electron temperature of 600 eV, approximately half of the ionization potential of Kr 25 + ion (which is 1205.23 eV). Thereafter, we conducted a Kr gas impurity seeding experiment at an electron density of 4 × 10 19 m 3 , observing line emissions from Kr 25 + during shot #181038 and analyzed line emissions from Kr 25 + ion at 6.035 s.
In the present work, we are studying the emission line profiles of Na-like Kr ion in the EUV wavelength region. Specifically, we present the emission lines at wavelengths of 22.00 nm, 17.89 nm, 16.51 nm, 15.99 nm, and 14.08 nm, respective to 2 p 6 3 p ( 2 P 1 / 2 o ) 2 p 6 3 s ( 2 S 1 / 2 ) , 2 p 6 3 p ( 2 P 3 / 2 o ) 2 p 6 3 s ( 2 S 1 / 2 ) , 2 p 6 3 d ( 2 D 3 / 2 ) 2 p 6 3 p ( 2 P 3 / 2 o ) , 2 p 6 3 d ( 2 D 5 / 2 ) 2 p 6 3 p ( 2 P 3 / 2 o ) , and 2 p 6 3 d ( 2 D 3 / 2 ) 2 p 6 3 p ( 2 P 1 / 2 o ) transitions measured in a Kr gas seeding experiment, as shown in Figure 6a. The absolute calibrated intensities derived from the measured emission spectrum are presented in Figure 6a. Comprehensive insights into the calibration factor can be found in the work authored by Chowdhuri et al. [35]. The measured emission spectrum exhibits a systematic error of ± 0.037 % following the meticulous wavelength calibration process. The radial profiles of electron temperature and density, as depicted in Figure 2d, closely align with an electron density of approximately 6 × 10 19 m 3 within the 580–600 eV electron temperature range for the Kr 25 + ion in this study. To validate our selection of electron temperature, we conducted a series of theoretical calculations to examine the behavior of our CR model over a broader range of electron temperature and densities, ranging from 400 to 620 eV and 1 × 10 19 to 6 × 10 19 m 3 , respectively. The line ratio calculation for the Kr 25 + ion was performed between the 17.899 nm and 22.007 nm lines, considering varying electron temperatures and densities within the specified ranges. This thorough investigation did not reveal any significant deviations in the line ratio for the CR model spectrum, indicating that the line ratio (17.899 nm/22.007 nm) is not particularly sensitive to variations in electron temperature. Additionally, it is noteworthy that the line ratio between the 17.899 nm and 22.007 nm lines in the LHD-measured spectrum is 2.6, while the line ratio calculated from the CR model spectrum for an electron temperature and density of 600 eV and 6 × 10 19 m 3 is 2.28. The theoretical line ratio closely approximates the line ratio obtained for the measured emission lines, which suggests that the selection of electron temperature as half of the ionization potential for Kr 25 + ion is a reliable choice for generating a theoretical CR model spectrum to validate the atomic ion structure and electron-ion collision calculations in the present work. Therefore, a theoretical synthetic emission spectrum is generated for an electron temperature of 600 eV and electron density of 6 × 10 19 m 3 using the line convolution with Gaussian functions that have a standard deviation of 0.26 eV. Figure 6b presents the synthetic spectrum of Kr 25 + ion, as derived from detailed electron collision and CR model calculations. In Figure 6a,b, the emission lines observed in the LHD experiment, as mentioned earlier, are compared with the calculated CR model spectrum. A close examination reveals a remarkable congruence between the experimental and theoretical spectra.
Table 4 provides a comprehensive overview of the wavelengths corresponding to the emission lines depicted in Figure 6a,b. These values are presented alongside wavelengths calculated using the FAC-RCI theoretical method to facilitate comparison. The first two columns in Table 4 describe the upper and lower levels involved in each transition that leads to line emission. The third and fourth columns display the wavelengths obtained from our experimental measurements, including fitting error and data available in the NIST database [27], respectively. We determined the wavelength of each measured emission line from the Kr 25 + ion by applying Gaussian fitting to the spectrum featured in Figure 6a. The respective fitting error serves as the uncertainty associated with the wavelength of each emission line. The fifth column highlights the differences between λ NIST and λ EXP , demonstrating a striking concurrence between the NIST data and measured values. The final column in Table 4 presents the wavelengths obtained from the FAC-RCI ( λ FAC - RCI ) method.
The comparison of these wavelengths reveals a remarkable agreement among them. In this connection, the present theoretical CR model spectrum signifies that atomic ion structure and electron collision data of different parameters calculated from the FAC-RCI and RDW methods are reliable. To investigate electron temperature dependence, detailed calculations of various line ratios between the LHD-measured spectrum and the CR model spectrum are necessary. These calculations should incorporate other kinetic processes as well within the CR model, such as dielectronic recombination, charge exchange recombination, etc. This helps to minimize the discrepancies in the line ratio between the 17.899 nm and 22.007 nm lines in the LHD-measured spectrum and CR model spectrum. The detailed estimation of electron temperature through extensive line ratio and theoretical intensity calibration calculations is not the focus of this study. The primary objective of the present CR model is to validate the reliability of atomic structure parameters and electron-ion collision calculations, primarily through the assessment of wave function precision. Although a comprehensive analysis including the theoretical CR model spectrum in conjunction with the LHD-measured spectrum for the calculation of electron temperature, electron density, and absolute intensity comparison is beyond the scope of this article, this comparative study reinforces the applicability of current atomic structure and electron-ion collision data in developing a sophisticated plasma model for EUV spectroscopic diagnostics in the context of fusion plasma. This facilitates the examination of fusion plasma behavior in Kr seeding experiments conducted in various tokamak devices.

6. Conclusions

In the present work, we investigated the emission line profiles of Na-like Kr ion within the EUV wavelength region, as observed in a Kr gas impurity seeding experiment in LHD. Moreover, a suitable collisional-radiative model was developed to produce the synthetic spectrum of Kr 25 + ion, which was used to validate the atomic ion and electron collision calculations through the experimental measurements. In the development of the plasma model, we incorporated important electron impact excitation processes, along with their reverse processes, and calculated the required essential data of atomic ion structure parameters using different relativistic methods and electron collision data through the RDW method. In this view, we carried out RMCDHF and RMCDHF-RCI calculations using the GRASP2018 code, while in another set, we utilized the RMBPT and RCI methods integrated within FAC. These calculations yielded the transition energies, weighted oscillator strengths, transition rates, and wavelengths for the various fine structure transitions. We present a comprehensive comparison of these parameters among the different methodologies and against previous values, demonstrating a consistent and favorable agreement. Further, we undertook calculations of the EIE cross-sections for the fine structure transitions from the ground state to the excited states and among the excited states using the RDW method. These cross-section results are reported with respect to the incident electron energies, spanning from the excitation threshold to 21 keV. Here, the results of the respective excitation rates for the transitions from the ground state are reported as a function of electron temperature up to 600 eV. Moreover, the excitation and de-excitation rates derived from the cross-section data are incorporated into the CR model for the proper inclusion of these processes. In the CR model calculations, rate balance equations are solved simultaneously for an electron temperature of 600 eV and an electron density of 6 × 10 19 m 3 to obtain the distribution of the state populations of the considered fine structure levels. To validate our findings, the emission lines from the Kr 25 + ion at wavelengths of 22.00 nm, 17.89 nm, 16.51 nm, 15.99 nm, and 14.08 nm, respective to 2 p 6 3 p ( 2 P 1 / 2 o ) 2 p 6 3 s ( 2 S 1 / 2 ) , 2 p 6 3 p ( 2 P 3 / 2 o ) 2 p 6 3 s ( 2 S 1 / 2 ) , 2 p 6 3 d ( 2 D 3 / 2 ) 2 p 6 3 p ( 2 P 3 / 2 o ) , 2 p 6 3 d ( 2 D 5 / 2 ) 2 p 6 3 p ( 2 P 3 / 2 o ) , and 2 p 6 3 d ( 2 D 3 / 2 ) 2 p 6 3 p ( 2 P 1 / 2 o ) transitions measured in the experiment, are compared with the CR model spectrum. Our comparative analysis reveals that the emission lines and their respective wavelengths in LHD spectral measurements show an overall good agreement with the CR model calculations. This comparison between the experimental and theoretical spectra substantiates the reliability of our atomic ion structure, electron collision, and CR model calculations of the highly charged Kr 25 + ion. In the future, these findings can be leveraged in the development of a sophisticated plasma model, enabling a comprehensive exploration of fusion plasma behavior in Kr seeding experiments across different tokamak devices.

Author Contributions

The contributions of each author to this work are as follows: Conceptualization, S.G. and I.M.; theoretical investigation, S.G.; experiment, S.G., T.O. and I.M.; formal analysis, S.G.; visualization, S.G.; validation, I.M. and T.O.; writing—original draft, S.G.; writing—review and editing, I.M., T.O. and S.G.; resources, I.M.; supervision, I.M. All authors have reviewed and agreed to the published version of the manuscript.

Funding

The present research work was conducted at the NIFS, with funding provided by the COE Fellowship Program at NIFS Japan. Additionally, this research was partly supported by the NIFS collaboration research program (NIFS22KIIF010).

Data Availability Statement

Figure A1Figure A3 depicting the EIE rates and cross-sections among the fine structure levels can be found in Appendix A. The LHD data can be accessed from the LHD data repository at https://www-lhd.nifs.ac.jp/pub/Repository_en.html). Further data will be made available upon request.

Acknowledgments

The authors acknowledge Motoshi Goto, Yasuko Kawamoto, Tomoko Kawate, and the LHD experiment group for their assistance in the spectroscopic measurements during the Kr gas seeding experiment in an LHD. S.G. acknowledges the National Institute for Fusion Science for the support provided through the COE Fellowship.

Conflicts of Interest

The authors declare no conflict of interest.

Appendix A

Figure A1. (ad) EIE rate coefficients ( m 3 / s ) as a function of electron temperature (eV) for the excitation from the ground state ( 2 p 6 3 s 1 / 2 ) to the fine structure levels of 2 p 6 4 l 2 , 2 p 6 5 l 2 , 2 p 6 6 l 2 , and 2 p 6 7 l 2 (where 0 l 2 2 ) configurations of Kr 25 + ion.
Atoms 11 00142 g0a1
Figure A2. (ah) EIE cross-sections ( in m 2 ) as a function of incident electron energy (in eV) for the excitation from the 2 p 6 3 p and 2 p 6 3 d excited states to the various fine structure levels of the 2 p 6 4 l 1 (where 0 l 1 3 ), 2 p 6 5 l 2 , 2 p 6 6 l 2 , and 2 p 6 7 l 2 (where 0 l 2 2 ) excited states of Kr 25 + ion.
Atoms 11 00142 g0a2
Figure A3. (af) EIE cross-sections ( in m 2 ) as a function of incident electron energy (in eV) for the excitation from the 2 p 6 4 l 2 excited state to the various fine structure levels of the 2 p 6 5 l 2 , 2 p 6 6 l 2 , and 2 p 6 7 l 2 (where 0 l 2 2 ) excited states of Kr 25 + ion.
Atoms 11 00142 g0a3

References

  1. Dong, C.; Morita, S.; Chowdhuri, M.B.; Goto, M. Survey of EUV impurity line spectra and EUV bremsstrahlung continuum in LHD. Plasma Fusion Res. 2011, 6, 2402078. [Google Scholar] [CrossRef]
  2. Denne, B.; Hinnov, E. Spectral lines of highly-ionized atoms for the diagnostics of fusion plasmas. Phys. Scr. 1987, 35, 811. [Google Scholar] [CrossRef]
  3. Martinelli, L.; Mikitchuck, D.; Duval, B.; Andrebe, Y.; Blanchard, P.; Février, O.; Gorno, S.; Elaian, H.; Linehan, B.; Perek, A.; et al. Implementation of high-resolution spectroscopy for ion (and electron) temperature measurements of the divertor plasma in the Tokamak à configuration variable. Rev. Sci. Instruments 2022, 93, 123505. [Google Scholar] [CrossRef] [PubMed]
  4. Oishi, T.; Morita, S.; Kobayashi, M.; Mukai, K.; Kawamura, G.; Masuzaki, S.; Hayashi, Y.; Suzuki, C.; Kawamoto, Y.; Goto, M.; et al. EUV and VUV Spectra of NeIII-NeX Line Emissions Observed in the Impurity Gas-Puffing Experiments of the Large Helical Device. Plasma Fusion Res. 2021, 16, 2402006. [Google Scholar] [CrossRef]
  5. Kallenbach, A.; Bernert, M.; Dux, R.; Casali, L.; Eich, T.; Giannone, L.; Herrmann, A.; McDermott, R.; Mlynek, A.; Müller, H.; et al. Impurity seeding for tokamak power exhaust: From present devices via ITER to DEMO. Plasma Phys. Control. Fusion 2013, 55, 124041. [Google Scholar] [CrossRef]
  6. Kallenbach, A.; Bernert, M.; Dux, R.; Reimold, F.; Wischmeier, M.; ASDEX Upgrade Team. Analytical calculations for impurity seeded partially detached divertor conditions. Plasma Phys. Control. Fusion 2016, 58, 045013. [Google Scholar] [CrossRef]
  7. Mukai, K.; Masuzaki, S.; Hayashi, Y.; Oishi, T.; Suzuki, C.; Kobayashi, M.; Tokuzawa, T.; Tanaka, H.; Tanaka, K.; Kinoshita, T.; et al. Steady-state sustainment of divertor detachment with multi-species impurity seeding in LHD. Nucl. Fusion 2021, 61, 126018. [Google Scholar] [CrossRef]
  8. Effenberg, F.; Brezinsek, S.; Feng, Y.; König, R.; Krychowiak, M.; Jakubowski, M.; Niemann, H.; Perseo, V.; Schmitz, O.; Zhang, D.; et al. First demonstration of radiative power exhaust with impurity seeding in the island divertor at Wendelstein 7-X. Nucl. Fusion 2019, 59, 106020. [Google Scholar] [CrossRef]
  9. Maddison, G.; Brix, M.; Budny, R.; Charlet, M.; Coffey, I.; Cordey, J.; Dumortier, P.; Erents, S.; Hawkes, N.; Von Hellermann, M.; et al. Impurity-seeded plasma experiments on JET. Nucl. Fusion 2002, 43, 49. [Google Scholar] [CrossRef]
  10. Reimold, F.; Wischmeier, M.; Bernert, M.; Potzel, S.; Kallenbach, A.; Müller, H.; Sieglin, B.; Stroth, U.; ASDEX Upgrade Team. Divertor studies in nitrogen induced completely detached H-modes in full tungsten ASDEX Upgrade. Nucl. Fusion 2015, 55, 033004. [Google Scholar] [CrossRef]
  11. Komm, M.; Khodunov, I.; Cavalier, J.; Vondracek, P.; Henderson, S.; Seidl, J.; Horacek, J.; Naydenkova, D.; Adamek, J.; Bilkova, P.; et al. Divertor impurity seeding experiments at the COMPASS tokamak. Nucl. Fusion 2019, 59, 106035. [Google Scholar] [CrossRef]
  12. Gałązka, K.; Ivanova-Stanik, I.; Stępniewski, W.; Zagórski, R.; Neu, R.; Romanelli, M.; Nakano, T. Numerical analyses of JT-60SA tokamak with tungsten divertor by COREDIV code. Plasma Phys. Control. Fusion 2017, 59, 045011. [Google Scholar] [CrossRef]
  13. Liping, D.; Yanmin, D.; Kaiyun, C.; Xiuda, Y.; Zhang, L.; Feng, X.; Jingbo, C.; Songtao, M.; Zhenwei, W.; Liqun, H. Influence of impurity seeding on the plasma radiation in the EAST tokamak. Plasma Sci. Technol. 2018, 20, 065102. [Google Scholar]
  14. Asakura, N.; Nakano, T.; Oyama, N.; Sakamoto, T.; Matsunaga, G.; Itami, K. Investigations of impurity seeding and radiation control for long-pulse and high-density H-mode plasmas in JT-60U. Nucl. Fusion 2009, 49, 115010. [Google Scholar] [CrossRef]
  15. Mukai, K.; Masuzaki, S.; Hayashi, Y.; Oishi, T.; Suzuki, C.; Kobayashi, M.; Tanaka, H.; Peterson, B.J.; LHD Experiment Group. Divertor Detachment with Multi-Species Impurity Seeding in LHD. Plasma Fusion Res. 2020, 15, 1402051. [Google Scholar] [CrossRef]
  16. Ingesson, L.; Rapp, J.; Matthews, G. Radiation in impurity-seeded discharges in the JET MkI, MkIIA and MkIIGB divertors. J. Nucl. Mater. 2003, 313, 1173–1177. [Google Scholar] [CrossRef]
  17. Suzuki, C.; Mukai, K.; Masuzaki, S.; Kobayashi, M.; Peterson, B.; Akiyama, T.; Murakami, I.; LHD Experiment Group. Spectroscopic studies on the enhanced radiation with high Z rare gas seeding for mitigating divertor heat loads in LHD plasmas. Nucl. Mater. Energy 2019, 19, 195–199. [Google Scholar] [CrossRef]
  18. Mukai, K.; Masuzaki, S.; Peterson, B.J.; Akiyama, T.; Kobayashi, M.; Suzuki, C.; Tanaka, H.; Pandya, S.N.; Sano, R.; Motojima, G.; et al. Development of impurity seeding and radiation enhancement in the helical divertor of LHD. Nucl. Fusion 2015, 55, 083016. [Google Scholar] [CrossRef]
  19. Ivanova-Stanik, I.; Zagórski, R.; Chomiczewska, A.; Bernert, M.; Glöggler, S.; Kallenbach, A. COREDIV modelling of nitrogen and krypton seeding at the ASDEX Upgrade tokamak. Plasma Phys. Control. Fusion 2022, 64, 045015. [Google Scholar] [CrossRef]
  20. Henderson, S.; Bernert, M.; Brida, D.; Cavedon, M.; David, P.; Dux, R.; Février, O.; Järvinen, A.; Kallenbach, A.; Komm, M.; et al. Divertor detachment and reattachment with mixed impurity seeding on ASDEX Upgrade. Nucl. Fusion 2023, 63, 086024. [Google Scholar] [CrossRef]
  21. Jönsson, P.; Godefroid, M.; Gaigalas, G.; Ekman, J.; Grumer, J.; Li, W.; Li, J.; Brage, T.; Grant, I.P.; Bieroń, J.; et al. An introduction to relativistic theory as implemented in GRASP. Atoms 2022, 11, 7. [Google Scholar] [CrossRef]
  22. Grant, I.; Quiney, H. GRASP: The Future? Atoms 2022, 10, 108. [Google Scholar] [CrossRef]
  23. Li, Y.; Li, J.; Song, C.; Zhang, C.; Si, R.; Wang, K.; Godefroid, M.; Gaigalas, G.; Jönsson, P.; Chen, C. Performance Tests and Improvements on the rmcdhf and rci Programs of GRASP. Atoms 2023, 11, 12. [Google Scholar] [CrossRef]
  24. Fischer, C.F.; Gaigalas, G.; Jönsson, P.; Bieroń, J. GRASP2018—A Fortran 95 version of the general relativistic atomic structure package. Comput. Phys. Commun. 2019, 237, 184–187. [Google Scholar] [CrossRef]
  25. Gu, M.F. FAC: Flexible Atomic Code. Astrophysics Source Code Library. 2018, pp. ascl–1802. Available online: https://ui.adsabs.harvard.edu/abs/2018ascl.soft02001G/abstract (accessed on 31 October 2023).
  26. Gu, M.F. The flexible atomic code. Can. J. Phys. 2008, 86, 675–689. [Google Scholar] [CrossRef]
  27. Kramida, A.; Ralchenko, Y.; Reader, J.; NIST ASD Team. NIST Atomic Spectra Database; (ver. 5.10), [Online]; National Institute of Standards and Technology: Gaithersburg, MD, USA, 2022. Available online: https://physics.nist.gov/asd (accessed on 27 August 2023).
  28. Rathi, S.; Sharma, L. Extended calculations of atomic structure parameters for Na-like Ar, Kr and Xe ions using relativistic MCDHF and MBPT methods. Atoms 2022, 10, 131. [Google Scholar] [CrossRef]
  29. Takeiri, Y.; Morisaki, T.; Osakabe, M.; Yokoyama, M.; Sakakibara, S.; Takahashi, H.; Nakamura, Y.; Oishi, T.; Motojima, G.; Murakami, S.; et al. Extension of the operational regime of the LHD towards a deuterium experiment. Nucl. Fusion 2017, 57, 102023. [Google Scholar] [CrossRef]
  30. Oishi, T.; Kobayashi, M.; Takahashi, H.; Hayashi, Y.; Mukai, K.; Morita, S.; Goto, M.; Kawamoto, Y.; Kawate, T.; Masuzaki, S.; et al. Spatial Profiles of NeVI-NeX Emission in ECR-Heated Discharges of the Large Helical Device with Divertor Detachment Induced by RMP Application and Ne Impurity Seeding. Plasma Fusion Res. 2022, 17, 2402022. [Google Scholar] [CrossRef]
  31. Oishi, T.; Morita, S.; Kobayashi, M.; Kawamura, G.; Kawamoto, Y.; Kawate, T.; Masuzaki, S.; Suzuki, C.; Goto, M. EUV/VUV Spectroscopy for the Study of Carbon Impurity Transport in Hydrogen and Deuterium Plasmas in the Edge Stochastic Magnetic Field Layer of Large Helical Device. Plasma 2023, 6, 308–321. [Google Scholar] [CrossRef]
  32. Peterson, B.; Yoshimura, S.; Drapiko, E.; Seo, D.; Ashikawa, N.; Miyazawa, J. Bolometer Diagnostics on LHD. Fusion Sci. Technol. 2010, 58, 412–417. [Google Scholar] [CrossRef]
  33. Akiyama, T.; Kawahata, K.; Tanaka, K.; Tokuzawa, T.; Ito, Y.; Okajima, S.; Nakayama, K.; Michael, C.; Vyacheslavov, L.; Sanin, A.; et al. Interferometer systems on LHD. Fusion Sci. Technol. 2010, 58, 352–363. [Google Scholar] [CrossRef]
  34. Narihara, K.; Yamada, I.; Hayashi, H.; Yamauchi, K. Design and performance of the Thomson scattering diagnostic on LHD. Rev. Sci. Instruments 2001, 72, 1122–1125. [Google Scholar] [CrossRef]
  35. Chowdhuri, M.B.; Morita, S.; Goto, M.; Nishimura, H.; Nagai, K.; Fujioka, S. Spectroscopic comparison between 1200 grooves/mm ruled and holographic gratings of a flat-field spectrometer and its absolute sensitivity calibration using bremsstrahlung continuum. Rev. Sci. Instruments 2013, 78, 023501, Erratum in Rev. Sci. Instruments 2013, 84, 109901. [Google Scholar] [CrossRef] [PubMed]
  36. Funaba, H.; Yasuhara, R.; Uehara, H.; Yamada, I.; Sakamoto, R.; Osakabe, M.; Den Hartog, D. Electron temperature and density measurement by Thomson scattering with a high repetition rate laser of 20 kHz on LHD. Sci. Rep. 2022, 12, 15112. [Google Scholar] [CrossRef] [PubMed]
  37. Grant, I.P. Relativistic Quantum Theory of Atoms and Molecules: Theory and Computation; Springer: Berlin/Heidelberg, Germany, 2007. [Google Scholar]
  38. Madison, D.H.; Bartschat, K. The distorted-wave method for elastic scattering and atomic excitation. In Computational Atomic Physics: Electron and Positron Collisions with Atoms and Ions; Springer: Berlin/Heidelberg, Germany, 1996; pp. 65–86. [Google Scholar]
  39. Srivastava, R.; Zuo, T.; McEachran, R.; Stauffer, A. Relativistic distorted-wave calculation of electron excitation of cadmium. J. Phys. At. Mol. Opt. Phys. 1992, 25, 1073. [Google Scholar] [CrossRef]
  40. Gupta, S.; Srivastava, R. Detailed electron impact fine-structure excitation cross-sections of Kr+ and linear polarization of its subsequently emitted photons. J. Quant. Spectrosc. Radiat. Transf. 2020, 253, 106992. [Google Scholar] [CrossRef]
  41. Sahoo, A.; Sharma, L. Electron Impact Excitation of Extreme Ultra-Violet Transitions in Xe7+–Xe10+ Ions. Atoms 2021, 9, 76. In Electron Scattering in Gases; MDPI: Basel, Switzerland, 2021; p. 207. [Google Scholar]
  42. Bharti, S.; Sharma, L.; Srivastava, R. Electron impact excitation of Ge-like to Cu-like xenon ions in the extreme ultraviolet. J. Phys. At. Mol. Opt. Phys. 2020, 53, 165001. [Google Scholar] [CrossRef]
  43. Lindgren, I. The Rayleigh-Schrodinger perturbation and the linked-diagram theorem for a multi-configurational model space. J. Phys. At. Mol. Phys. 1974, 7, 2441. [Google Scholar] [CrossRef]
  44. Safronova, M.; Johnson, W.; Safronova, U. Relativistic many-body calculations of the energies of n = 2 states for the berylliumlike isoelectronic sequence. Phys. Rev. A 1996, 53, 4036. [Google Scholar] [CrossRef]
  45. Vilkas, M.J.; Ishikawa, Y.; Koc, K. Relativistic multireference many-body perturbation theory for quasidegenerate systems: Energy levels of ions of the oxygen isoelectronic sequence. Phys. Rev. A 1999, 60, 2808. [Google Scholar] [CrossRef]
  46. Gu, M. Wavelengths of 2l→ 3l’Transitions in L-Shell Ions of Iron and Nickel: A Combined Configuration Interaction and Many-Body Perturbation Theory Approach. Astrophys. J. Suppl. Ser. 2005, 156, 105. [Google Scholar] [CrossRef]
  47. Gu, M. Many-body perturbation theory wavelengths of high-n x-ray transitions of Fe and Ni L-shell ions. Astrophys. J. Suppl. Ser. 2007, 169, 154. [Google Scholar] [CrossRef]
  48. Dong, C. Study on radial position of impurity ions in core and edge plasma of LHD using space-resolved EUV spectrometer. Plasma Sci. Technol. 2011, 13, 140. [Google Scholar] [CrossRef]
Figure 1. A schematic representation of an experimental setup for Kr gas impurity seeding experiment in LHD.
Atoms 11 00142 g001
Figure 2. Typical time evolution waveforms of various parameters in the Kr gas puff experiment (#181038): (a) heating power of ECH and NBIs #1–5 and Kr gas puff time period; (b) total radiation power ( P rad ) and plasma stored energy ( W p ) ; (c) central electron temperature ( T e 0 ) , density ( n e 0 ) , and line-averaged electron density ( n ¯ e ) ; (d) radial profiles of electron temperature ( T e ) and density ( n e ) at 6.035 s.
Atoms 11 00142 g002
Figure 3. (af) EIE cross-sections ( m 2 ) as a function of incident electron energy (in eV) for the excitation from the ground state ( 2 p 6 3 s ) to the fine structure levels of the 2 p 6 3 p , 2 p 6 3 d , 2 p 6 4 l 2 , 2 p 6 5 l 2 , 2 p 6 6 l 2 , and 2 p 6 7 l 2 (where 0 l 2 2 ) excited states of Kr 25 + ion.
Atoms 11 00142 g003
Figure 4. (a,b) EIE rate coefficients ( m 3 / s ) as a function of electron temperature (eV) for the excitation from the ground state ( 2 p 6 3 s ) to the fine structure levels of the 2 p 6 3 p and 2 p 6 3 d configurations of Kr 25 + ion.
Atoms 11 00142 g004
Figure 5. A partial energy level scheme of the Kr 25 + ion, representing the lowest 39 energy levels of various excited states relative to the ground state 2 p 6 3 s ( 2 S 1 / 2 ) , is presented using the Grotrian diagram from the NIST database [27]. Line emissions from these levels in the EUV regions, within the wavelength range of 1.2–54 nm, are highlighted with long gray-colored lines. Energy levels associated with the even parity configurations are denoted with the gray lines, while the blue lines represent the levels with odd parity configurations.
Atoms 11 00142 g005
Figure 6. (a) The EUV spectrum from the Kr seeding experiment in the LHD includes line emissions released from highly charged Kr ions within the wavelength range of 14–23 nm. (b) The theoretical synthetic spectrum of Kr 25 + ion obtained using the present CR model.
Atoms 11 00142 g006
Table 1. Excitation energies (in eV) of the fine structure levels of Kr 25 + ion from the present FAC-RCI, RMBPT, and RMCDHF-RCI calculations are listed and compared with the data available in the NIST database [27], and are also contrasted with the theoretical values from Rathi et al. [28].
ConfigurationTerm E FAC RCI E RMBPT E MBPT [28] E DF E RMCDHF RCI E RCI [28] E NIST [27]
2 p 6 3 s 2 S 1 / 2 0.00000.00000.00000.00000.00000.00000.0000
2 p 6 3 p 2 P 1 / 2 o 56.205056.520856.469256.475556.353456.305456.3400
2 p 6 3 p 2 P 3 / 2 o 69.125269.433469.366869.386069.277369.302269.2670
2 p 6 3 d 2 D 3 / 2 144.431144.618144.447144.558144.486144.198144.340
2 p 6 3 d 2 D 5 / 2 146.865147.057146.860146.982146.935146.730146.796
2 p 6 4 s 2 S 1 / 2 556.622556.809556.763556.542556.932556.919557.15
2 p 6 4 p 2 P 1 / 2 o 579.760579.834579.777579.596579.943579.960580.18
2 p 6 4 p 2 P 3 / 2 o 584.912584.986584.926584.751585.101585.130585.280
2 p 6 4 d 2 D 3 / 2 612.904613.121612.955612.810613.224613.154613.39
2 p 6 4 d 2 D 5 / 2 613.977614.197614.025613.886614.309614.259614.46
2 p 6 4 f 2 F 5 / 2 o 627.860627.832627.948627.613628.121628.135628.270
2 p 6 4 f 2 F 7 / 2 o 628.285628.257628.372628.041628.550628.568628.710
2 p 6 5 s 2 S 1 / 2 800.197800.229800.192800.037800.562800.534800.830
2 p 6 5 p 2 P 1 / 2 o 811.722811.765811.697811.539812.043812.074812.340
2 p 6 5 p 2 P 3 / 2 o 814.286814.328814.261814.109814.614814.646814.910
2 p 6 5 d 2 D 3 / 2 827.936827.999827.893827.754828.293828.278828.550
2 p 6 5 d 2 D 5 / 2 828.493828.557828.449828.313828.856828.909829.110
2 p 6 5 f 2 F 5 / 2 o 835.341835.347835.347835.140835.727835.739835.890
2 p 6 5 f 2 F 7 / 2 o 835.558835.564835.564835.359835.947835.960836.110
2 p 6 5 g 2 G 7 / 2 836.397836.399836.435836.142836.781836.807837.020
2 p 6 5 g 2 G 9 / 2 836.528836.530836.566836.274836.913836.926837.150
2 p 6 6 s 2 S 1 / 2 928.199928.226928.127928.080928.664928.716928.910
2 p 6 6 p 2 P 1 / 2 o 934.802934.834934.763934.640935.210935.253935.460
2 p 6 6 p 2 P 3 / 2 o 936.256936.288936.222936.101936.672936.708936.930
2 p 6 6 d 2 D 3 / 2 943.933943.979943.892943.780944.369944.374944.580
2 p 6 6 d 2 D 5 / 2 944.256944.303944.216944.105944.697944.852944.910
2 p 6 6 f 2 F 5 / 2 o 948.155948.174948.140947.991948.608948.629948.840
2 p 6 6 f 2 F 7 / 2 o 948.281948.299948.266948.118948.736948.758948.970
2 p 6 6 g 2 G 7 / 2 948.818948.826948.812948.629949.274949.300-
2 p 6 6 g 2 G 9 / 2 948.894948.902948.888948.705949.350949.369-
2 p 6 7 s 2 S 1 / 2 1003.781003.811003.751003.681004.291004.39-
2 p 6 7 p 2 P 1 / 2 o 1007.891007.921007.851007.751008.361008.45-
2 p 6 7 p 2 P 3 / 2 o 1008.801008.821008.761008.661009.271009.30-
2 p 6 7 d 2 D 3 / 2 1013.541013.581013.511013.411014.031014.11-
2 p 6 7 d 2 D 5 / 2 1013.741013.781013.711013.621014.241014.25-
2 p 6 7 f 2 F 5 / 2 o 1016.181016.201016.161016.041016.671016.70-
2 p 6 7 f 2 F 7 / 2 o 1016.261016.281016.231016.121016.751016.78-
2 p 6 7 g 2 G 7 / 2 1016.611016.621016.591016.461017.111017.12-
2 p 6 7 g 2 G 9 / 2 1016.661016.671016.641016.511017.161017.18-
2 p 6 1 S 0 1204.561204.58----1205.23
Table 2. Weighted oscillator strengths ( gf osc ) and transition probabilities (A) (in s 1 ) of various dipole-allowed transitions obtained from FAC-RCI, RMBPT, and RMCDHF-RCI methods are listed.
Upper-Level
j j-Coupling
Lower-Level
j j-Coupling
gf FAC RCI osc gf RMBPT osc gf RMCDHF RCI osc A FAC RCI A RMBPT A RMCDHF RCI
2 p 6 3 p 1 / 2 o 2 p 6 3 s 1 / 2 1.6800 × 10 1 1.6723 × 10 1 1.6669 × 10 1 1.1514 × 10 10 1.1591 × 10 10 1.1485 × 10 10
2 p 6 3 p 3 / 2 o 2 p 6 3 s 1 / 2 4.1999 × 10 1 4.1775 × 10 1 4.1665 × 10 1 2.1770 × 10 10 2.1847 × 10 10 2.1692 × 10 10
2 p 6 4 p 1 / 2 o 2 p 6 3 s 1 / 2 1.9675 × 10 1 2.0376 × 10 1 2.0343 × 10 1 1.4348 × 10 12 1.4863 × 10 12 1.4844 × 10 12
2 p 6 4 p 3 / 2 o 2 p 6 3 s 1 / 2 3.4912 × 10 1 3.6240 × 10 1 3.6199 × 10 1 1.2957 × 10 12 1.3453 × 10 12 1.3443 × 10 12
2 p 6 5 p 1 / 2 o 2 p 6 3 s 1 / 2 5.7760 × 10 2 5.9464 × 10 2 5.8522 × 10 2 8.2570 × 10 11 8.5015 × 10 11 8.3726 × 10 11
2 p 6 5 p 3 / 2 o 2 p 6 3 s 1 / 2 1.0600 × 10 1 1.0941 × 10 1 1.0775 × 10 1 7.6248 × 10 11 7.8705 × 10 11 7.7569 × 10 11
2 p 6 6 p 1 / 2 o 2 p 6 3 s 1 / 2 2.6200 × 10 2 2.7142 × 10 2 2.6117 × 10 2 4.9673 × 10 11 5.1463 × 10 11 4.9559 × 10 11
2 p 6 6 p 3 / 2 o 2 p 6 3 s 1 / 2 4.8648 × 10 2 5.0568 × 10 2 4.8677 × 10 2 4.6260 × 10 11 4.8089 × 10 11 4.6329 × 10 11
2 p 6 7 p 1 / 2 o 2 p 6 3 s 1 / 2 1.4619 × 10 2 1.5562 × 10 2 1.4245 × 10 2 3.2220 × 10 11 3.4302 × 10 11 3.1424 × 10 11
2 p 6 7 p 3 / 2 o 2 p 6 3 s 1 / 2 2.7277 × 10 2 2.9222 × 10 2 2.6703 × 10 2 3.0113 × 10 11 3.2262 × 10 11 2.9508 × 10 11
2 p 6 4 p 1 / 2 o 2 p 6 3 d 3 / 2 1.0235 × 10 1 1.0414 × 10 1 1.0425 × 10 1 4.2892 × 10 11 4.2800 × 10 11 4.2895 × 10 11
2 p 6 4 p 3 / 2 o 2 p 6 3 d 3 / 2 1.8022 × 10 2 1.8342 × 10 2 1.8370 × 10 2 3.7933 × 10 10 3.8587 × 10 10 3.8688 × 10 10
2 p 6 4 p 1 / 2 o 2 p 6 4 s 1 / 2 2.5063 × 10 1 2.4741 × 10 1 2.4790 × 10 1 2.9111 × 10 9 2.8456 × 10 9 2.8479 × 10 9
2 p 6 4 p 3 / 2 o 2 p 6 3 d 5 / 2 1.6687 × 10 1 1.6971 × 10 1 1.8370 × 10 1 3.4736 × 10 11 3.5307 × 10 11 3.8688 × 10 11
2 p 6 4 p 3 / 2 o 2 p 6 4 s 1 / 2 6.1906 × 10 1 6.1171 × 10 1 6.1307 × 10 1 5.3747 × 10 9 5.2682 × 10 9 5.2773 × 10 9
2 p 6 3 d 3 / 2 2 p 6 3 p 1 / 2 o 3.9880 × 10 1 3.9562 × 10 1 3.9539 × 10 1 3.3675 × 10 10 3.3309 × 10 10 3.3316 × 10 10
2 p 6 3 d 3 / 2 2 p 6 3 p 3 / 2 o 6.8053 × 10 2 6.7499 × 10 2 6.7462 × 10 2 4.1865 × 10 9 4.1392 × 10 9 4.1395 × 10 9
2 p 6 3 d 5 / 2 2 p 6 3 p 3 / 2 o 6.3635 × 10 1 6.3127 × 10 1 6.3097 × 10 1 2.7813 × 10 10 2.7508 × 10 10 2.7519 × 10 10
2 p 6 4 s 1 / 2 2 p 6 3 p 1 / 2 o 1.0968 × 10 1 1.0818 × 10 1 1.0740 × 10 1 5.9594 × 10 11 5.8749 × 10 11 5.8388 × 10 11
2 p 6 4 s 1 / 2 2 p 6 3 p 3 / 2 o 2.4840 × 10 1 2.4511 × 10 1 2.4364 × 10 1 1.2808 × 10 12 1.2632 × 10 12 1.2570 × 10 12
2 p 6 4 d 3 / 2 2 p 6 3 p 1 / 2 o 7.7394 × 10 1 7.7337 × 10 1 7.7109 × 10 1 2.6019 × 10 12 2.5991 × 10 12 2.5939 × 10 12
2 p 6 4 d 3 / 2 2 p 6 3 p 3 / 2 o 1.6707 × 10 1 1.6686 × 10 1 1.6644 × 10 1 5.3593 × 10 11 5.3507 × 10 11 5.3422 × 10 11
2 p 6 4 d 5 / 2 2 p 6 3 p 3 / 2 o 1.4795 × 10 0 1.4776 × 10 0 1.4739 × 10 0 3.1763 × 10 12 3.1714 × 10 12 3.1664 × 10 12
2 p 6 4 d 5 / 2 2 p 6 4 p 3 / 2 o 1.0422 × 10 0 1.0413 × 10 0 1.0429 × 10 0 6.3672 × 10 9 6.4260 × 10 9 6.4332 × 10 9
2 p 6 4 f 5 / 2 o 2 p 6 3 d 3 / 2 3.7672 × 10 0 3.7192 × 10 0 3.7088 × 10 0 6.3671 × 10 12 6.2804 × 10 12 6.2731 × 10 12
2 p 6 4 f 5 / 2 o 2 p 6 3 d 5 / 2 2.7030 × 10 1 2.6688 × 10 1 2.6616 × 10 1 4.5224 × 10 11 4.4613 × 10 11 4.4568 × 10 11
2 p 6 4 f 7 / 2 o 2 p 6 3 d 5 / 2 5.4016 × 10 0 5.3327 × 10 0 5.3195 × 10 0 6.7902 × 10 12 6.6976 × 10 12 6.6925 × 10 12
2 p 6 5 s 1 / 2 2 p 6 3 p 1 / 2 o 2.4007 × 10 2 2.3596 × 10 2 2.2902 × 10 2 2.8831 × 10 11 2.8315 × 10 11 2.7520 × 10 11
2 p 6 5 s 1 / 2 2 p 6 3 p 3 / 2 o 5.2831 × 10 2 5.2310 × 10 2 5.0624 × 10 2 6.1262 × 10 11 6.0612 × 10 11 5.8737 × 10 11
2 p 6 5 p 1 / 2 o 2 p 6 3 d 3 / 2 1.7988 × 10 2 1.8635 × 10 2 1.8469 × 10 2 1.7377 × 10 11 1.7995 × 10 11 1.7856 × 10 11
2 p 6 5 p 1 / 2 o 2 p 6 4 s 1 / 2 2.1729 × 10 1 2.1910 × 10 1 2.1854 × 10 1 3.0679 × 10 11 3.0900 × 10 11 3.0858 × 10 11
2 p 6 5 p 3 / 2 o 2 p 6 3 d 3 / 2 3.2346 × 10 3 3.3520 × 10 3 3.3233 × 10 3 1.5744 × 10 10 1.6309 × 10 10 1.6189 × 10 10
2 p 6 5 p 3 / 2 o 2 p 6 3 d 5 / 2 2.9682 × 10 2 3.0719 × 10 2 3.0596 × 10 2 1.4343 × 10 11 1.4837 × 10 11 1.4796 × 10 11
2 p 6 5 p 3 / 2 o 2 p 6 4 s 1 / 2 3.8140 × 10 1 3.8496 × 10 1 3.8393 × 10 1 2.7469 × 10 11 2.7694 × 10 11 2.7655 × 10 11
2 p 6 5 d 3 / 2 2 p 6 3 p 1 / 2 o 2.2583 × 10 1 2.2407 × 10 1 2.2117 × 10 1 1.4590 × 10 12 1.4467 × 10 12 1.4297 × 10 12
2 p 6 5 d 3 / 2 2 p 6 3 p 3 / 2 o 4.7050 × 10 2 4.6625 × 10 2 4.6082 × 10 2 2.9388 × 10 11 2.9104 × 10 11 2.8799 × 10 11
2 p 6 5 d 5 / 2 2 p 6 3 p 3 / 2 o 4.1977 × 10 1 4.1603 × 10 1 4.1133 × 10 1 1.7505 × 10 12 1.7338 × 10 12 1.7163 × 10 12
2 p 6 5 f 5 / 2 o 2 p 6 3 d 3 / 2 6.6522 × 10 1 6.5090 × 10 1 6.4464 × 10 1 2.2964 × 10 12 2.2459 × 10 12 2.2275 × 10 12
2 p 6 5 f 5 / 2 o 2 p 6 3 d 5 / 2 4.7309 × 10 2 4.6302 × 10 2 4.5868 × 10 2 1.6217 × 10 11 1.5863 × 10 11 1.5737 × 10 11
2 p 6 5 f 7 / 2 o 2 p 6 3 d 5 / 2 9.4927 × 10 1 9.2872 × 10 1 9.2039 × 10 1 2.4420 × 10 12 2.3879 × 10 12 2.3699 × 10 12
2 p 6 6 s 1 / 2 2 p 6 3 p 1 / 2 o 1.0125 × 10 2 9.9558 × 10 3 9.1989 × 10 3 1.6703 × 10 11 1.6413 × 10 11 1.5186 × 10 11
2 p 6 6 s 1 / 2 2 p 6 3 p 3 / 2 o 2.1943 × 10 2 2.1559 × 10 2 2.0164 × 10 2 3.5135 × 10 11 3.4497 × 10 11 3.2310 × 10 11
2 p 6 6 p 1 / 2 o 2 p 6 3 d 3 / 2 6.7892 × 10 3 7.1053 × 10 3 6.8781 × 10 3 9.2015 × 10 10 9.6262 × 10 10 9.3303 × 10 10
2 p 6 6 p 1 / 2 o 2 p 6 4 s 1 / 2 6.4910 × 10 2 6.5733 × 10 2 6.4098 × 10 2 2.0141 × 10 11 2.0380 × 10 11 1.9899 × 10 11
2 p 6 6 p 3 / 2 o 2 p 6 3 d 3 / 2 1.2278 × 10 3 1.2863 × 10 3 1.2439 × 10 3 8.3510 × 10 9 8.7457 × 10 9 8.4683 × 10 9
2 p 6 6 p 3 / 2 o 2 p 6 3 d 5 / 2 1.1160 × 10 2 1.1666 × 10 2 1.1414 × 10 2 7.5439 × 10 10 7.8833 × 10 10 7.7229 × 10 10
2 p 6 6 p 3 / 2 o 2 p 6 4 s 1 / 2 1.1799 × 10 1 1.1962 × 10 1 1.1660 × 10 1 1.8447 × 10 11 1.8687 × 10 11 1.8241 × 10 11
2 p 6 6 d 3 / 2 2 p 6 3 p 1 / 2 o 1.0135 × 10 1 1.0042 × 10 1 9.7011 × 10 2 8.6642 × 10 11 8.5799 × 10 11 8.2985 × 10 11
2 p 6 6 d 3 / 2 2 p 6 3 p 3 / 2 o 2.0799 × 10 2 2.0576 × 10 2 1.9946 × 10 2 1.7267 × 10 11 1.7072 × 10 11 1.6569 × 10 11
2 p 6 6 d 5 / 2 2 p 6 3 p 3 / 2 o 1.8604 × 10 1 1.8410 × 10 1 1.7846 × 10 1 1.0304 × 10 12 1.0190 × 10 12 9.8906 × 10 11
2 p 6 6 f 5 / 2 o 2 p 6 3 d 3 / 2 2.4226 × 10 1 2.3571 × 10 1 2.3082 × 10 1 1.1317 × 10 12 1.1007 × 10 12 1.0793 × 10 12
2 p 6 6 f 5 / 2 o 2 p 6 3 d 5 / 2 1.7164 × 10 2 1.6703 × 10 2 1.6370 × 10 2 7.9703 × 10 10 7.7529 × 10 10 7.6086 × 10 10
2 p 6 6 f 7 / 2 o 2 p 6 3 d 5 / 2 3.4491 × 10 1 3.3545 × 10 1 3.2877 × 10 1 1.2015 × 10 12 1.1681 × 10 12 1.1464 × 10 12
Table 3. Wavelengths (in nm) of Na-like Kr ion calculated from the FAC-RCI, RMBPT, and RMCDHF-RCI methods are listed in columns labeled as λ FAC - RCI , λ RMBPT , and λ RMCDHF - RCI , respectively. The reported wavelengths from different methods are compared with the data available in the NIST database [27].
Transition
j j-Coupling
λ NIST [27] λ FAC RCI λ RMBPT λ RMCDHF RCI Transition λ NIST [27] λ FAC RCI λ RMBPT λ RMCDHF RCI
3 p 1 / 2 o 3 s 1 / 2 * 22.006422.059021.936021.9510 5 p 3 / 2 o 3 d 5 / 2 -1.85771.85811.8570
3 p 3 / 2 o 3 s 1 / 2 17.899417.936017.857017.8670 5 p 3 / 2 o 4 s 1 / 2 4.8114.81194.81464.8126
4 p 1 / 2 o 3 s 1 / 2 2.13692.13852.13832.1379 5 d 3 / 2 3 p 1 / 2 o 1.6071.60661.60711.6062
4 p 3 / 2 o 3 s 1 / 2 2.11852.11972.11942.1190 5 d 3 / 2 3 p 3 / 2 o -1.63391.63451.6335
5 p 1 / 2 o 3 s 1 / 2 -1.52741.52731.5268 5 d 5 / 2 3 p 3 / 2 o 1.6341.63271.63331.6323
5 p 3 / 2 o 3 s 1 / 2 1.52101.52261.52251.5220 5 f 5 / 2 o 3 d 3 / 2 1.7941.79451.79501.7937
6 p 1 / 2 o 3 s 1 / 2 -1.32631.32631.3257 5 f 5 / 2 o 3 d 5 / 2 -1.80091.80131.8800
6 p 3 / 2 o 3 s 1 / 2 -1.32431.32421.3237 5 f 7 / 2 o 3 d 5 / 2 -1.80031.80081.7995
7 p 1 / 2 o 3 s 1 / 2 -1.23011.23011.2296 6 s 1 / 2 3 p 1 / 2 o -1.42181.42231.4213
7 p 3 / 2 o 3 s 1 / 2 -1.22901.22901.2285 6 s 1 / 2 3 p 3 / 2 o -1.44321.44371.4427
4 p 1 / 2 o 3 d 3 / 2 -2.84812.84882.8472 6 p 1 / 2 o 3 d 3 / 2 -1.56871.56901.5680
4 p 3 / 2 o 3 d 3 / 2 -2.81472.81552.8139 6 p 1 / 2 o 4 s 1 / 2 -3.27843.27983.2776
4 p 1 / 2 o 4 s 1 / 2 -53.585053.849053.8810 6 p 3 / 2 o 3 d 3 / 2 -1.56581.56611.5651
4 p 3 / 2 o 3 d 5 / 2 -2.83042.83112.8139 6 p 3 / 2 o 3 d 5 / 2 -1.57061.57091.5700
4 p 3 / 2 o 4 s 1 / 2 -43.826044.003044.0710 6 p 3 / 2 o 4 s 1 / 2 -3.26593.26723.2650
3 d 3 / 2 3 p 1 / 2 o 14.089114.053014.073014.0680 6 d 3 / 2 3 p 1 / 2 o -1.39661.39711.3962
3 d 3 / 2 3 p 3 / 2 o 16.516016.464016.491016.4850 6 d 3 / 2 3 p 3 / 2 o -1.41731.41771.4168
3 d 5 / 2 3 p 3 / 2 o 15.992015.948015.972015.9660 6 d 5 / 2 3 p 3 / 2 o -1.41671.41721.4163
4 s 1 / 2 3 p 1 / 2 o 2.47662.47762.47832.4768 6 f 5 / 2 o 3 d 3 / 2 -1.54261.54291.5419
4 s 1 / 2 3 p 3 / 2 o 2.54162.54332.54392.5425 6 f 5 / 2 o 3 d 5 / 2 -1.54731.54761.5466
4 d 3 / 2 3 p 1 / 2 o 2.22572.22712.22752.2265 6 f 7 / 2 o 3 d 5 / 2 -1.54711.54741.5464
4 d 3 / 2 3 p 3 / 2 o -2.28012.28042.2794 7 s 1 / 2 3 p 1 / 2 o -1.30841.30881.3079
4 d 5 / 2 3 p 3 / 2 o 2.27432.27562.27592.2748 7 s 1 / 2 3 p 3 / 2 o -1.32651.32691.3260
4 d 5 / 2 4 p 3 / 2 o -42.659042.444042.4540 7 p 1 / 2 o 3 d 3 / 2 -1.43591.43621.4352
4 f 5 / 2 o 3 d 3 / 2 2.56212.56472.56582.5638 7 p 1 / 2 o 4 s 1 / 2 -2.74742.74842.7465
4 f 5 / 2 o 3 d 5 / 2 -2.57772.57882.5767 7 p 3 / 2 o 3 d 3 / 2 -1.43441.43471.4337
4 f 7 / 2 o 3 d 5 / 2 2.57282.57542.57662.5744 7 p 3 / 2 o 3 d 5 / 2 -1.43841.43871.4378
5 s 1 / 2 3 p 1 / 2 o -1.66651.66711.6660 7 p 3 / 2 o 4 s 1 / 2 -2.74192.74292.7410
5 s 1 / 2 3 p 3 / 2 o -1.69591.69661.6954 7 f 5 / 2 o 3 d 3 / 2 -1.42221.42251.4215
5 p 1 / 2 o 3 d 3 / 2 -1.85801.85841.8573 7 f 5 / 2 o 3 d 5 / 2 -1.42621.42651.4255
5 p 1 / 2 o 4 s 1 / 2 4.8594.86024.86304.8600 7 f 7 / 2 o 3 d 5 / 2 -1.42611.42641.4254
5 p 3 / 2 o 3 d 3 / 2 -1.85091.85131.8502
* The orbital 2 p 6 is common in the upper and lower levels of the transitions; hence, it is omitted in column 1.
Table 4. A comparison of experimental and theoretical wavelengths (in nm) of Kr 25 + ion is presented along with the details of the upper and lower levels involved in the transitions corresponding to the line emissions.
Upper-Level
j j-Coupling
Lower-Level
j j-Coupling
λ EXP λ NIST [27] λ NIST λ EXP λ FAC RCI
2 p 6 3 p ( 2 P 1 / 2 o ) 2 p 6 3 s ( 2 S 1 / 2 ) 22.007 ( ± 0.0001 ) * 22.006−0.00122.059
2 p 6 3 p ( 2 P 3 / 2 o ) 2 p 6 3 s ( 2 S 1 / 2 ) 17.899 ( ± 0.0002 ) 17.8990.00017.936
2 p 6 3 d ( 2 D 3 / 2 ) 2 p 6 3 p ( 2 P 3 / 2 o ) 16.513 ( ± 0.0095 ) 16.5160.00316.464
2 p 6 3 d ( 2 D 5 / 2 ) 2 p 6 3 p ( 2 P 3 / 2 o ) 15.989 ( ± 0.0003 ) 15.9920.00315.948
2 p 6 3 d ( 2 D 3 / 2 ) 2 p 6 3 p ( 2 P 1 / 2 o ) 14.087 ( ± 0.0003 ) 14.0890.00214.053
* The numbers in the parentheses represent the Gaussian fitting error associated with the emission line measured during a Kr seeding experiment conducted in LHD.
Disclaimer/Publisher’s Note: The statements, opinions and data contained in all publications are solely those of the individual author(s) and contributor(s) and not of MDPI and/or the editor(s). MDPI and/or the editor(s) disclaim responsibility for any injury to people or property resulting from any ideas, methods, instructions or products referred to in the content.

