
Review of the 1st EUV Light Sources Code Comparison Workshop

Abstract
:1. Introduction
2. Workshop Organization and Structure
3. Case Study 1: Atomic Kinetics of Tin Plasmas
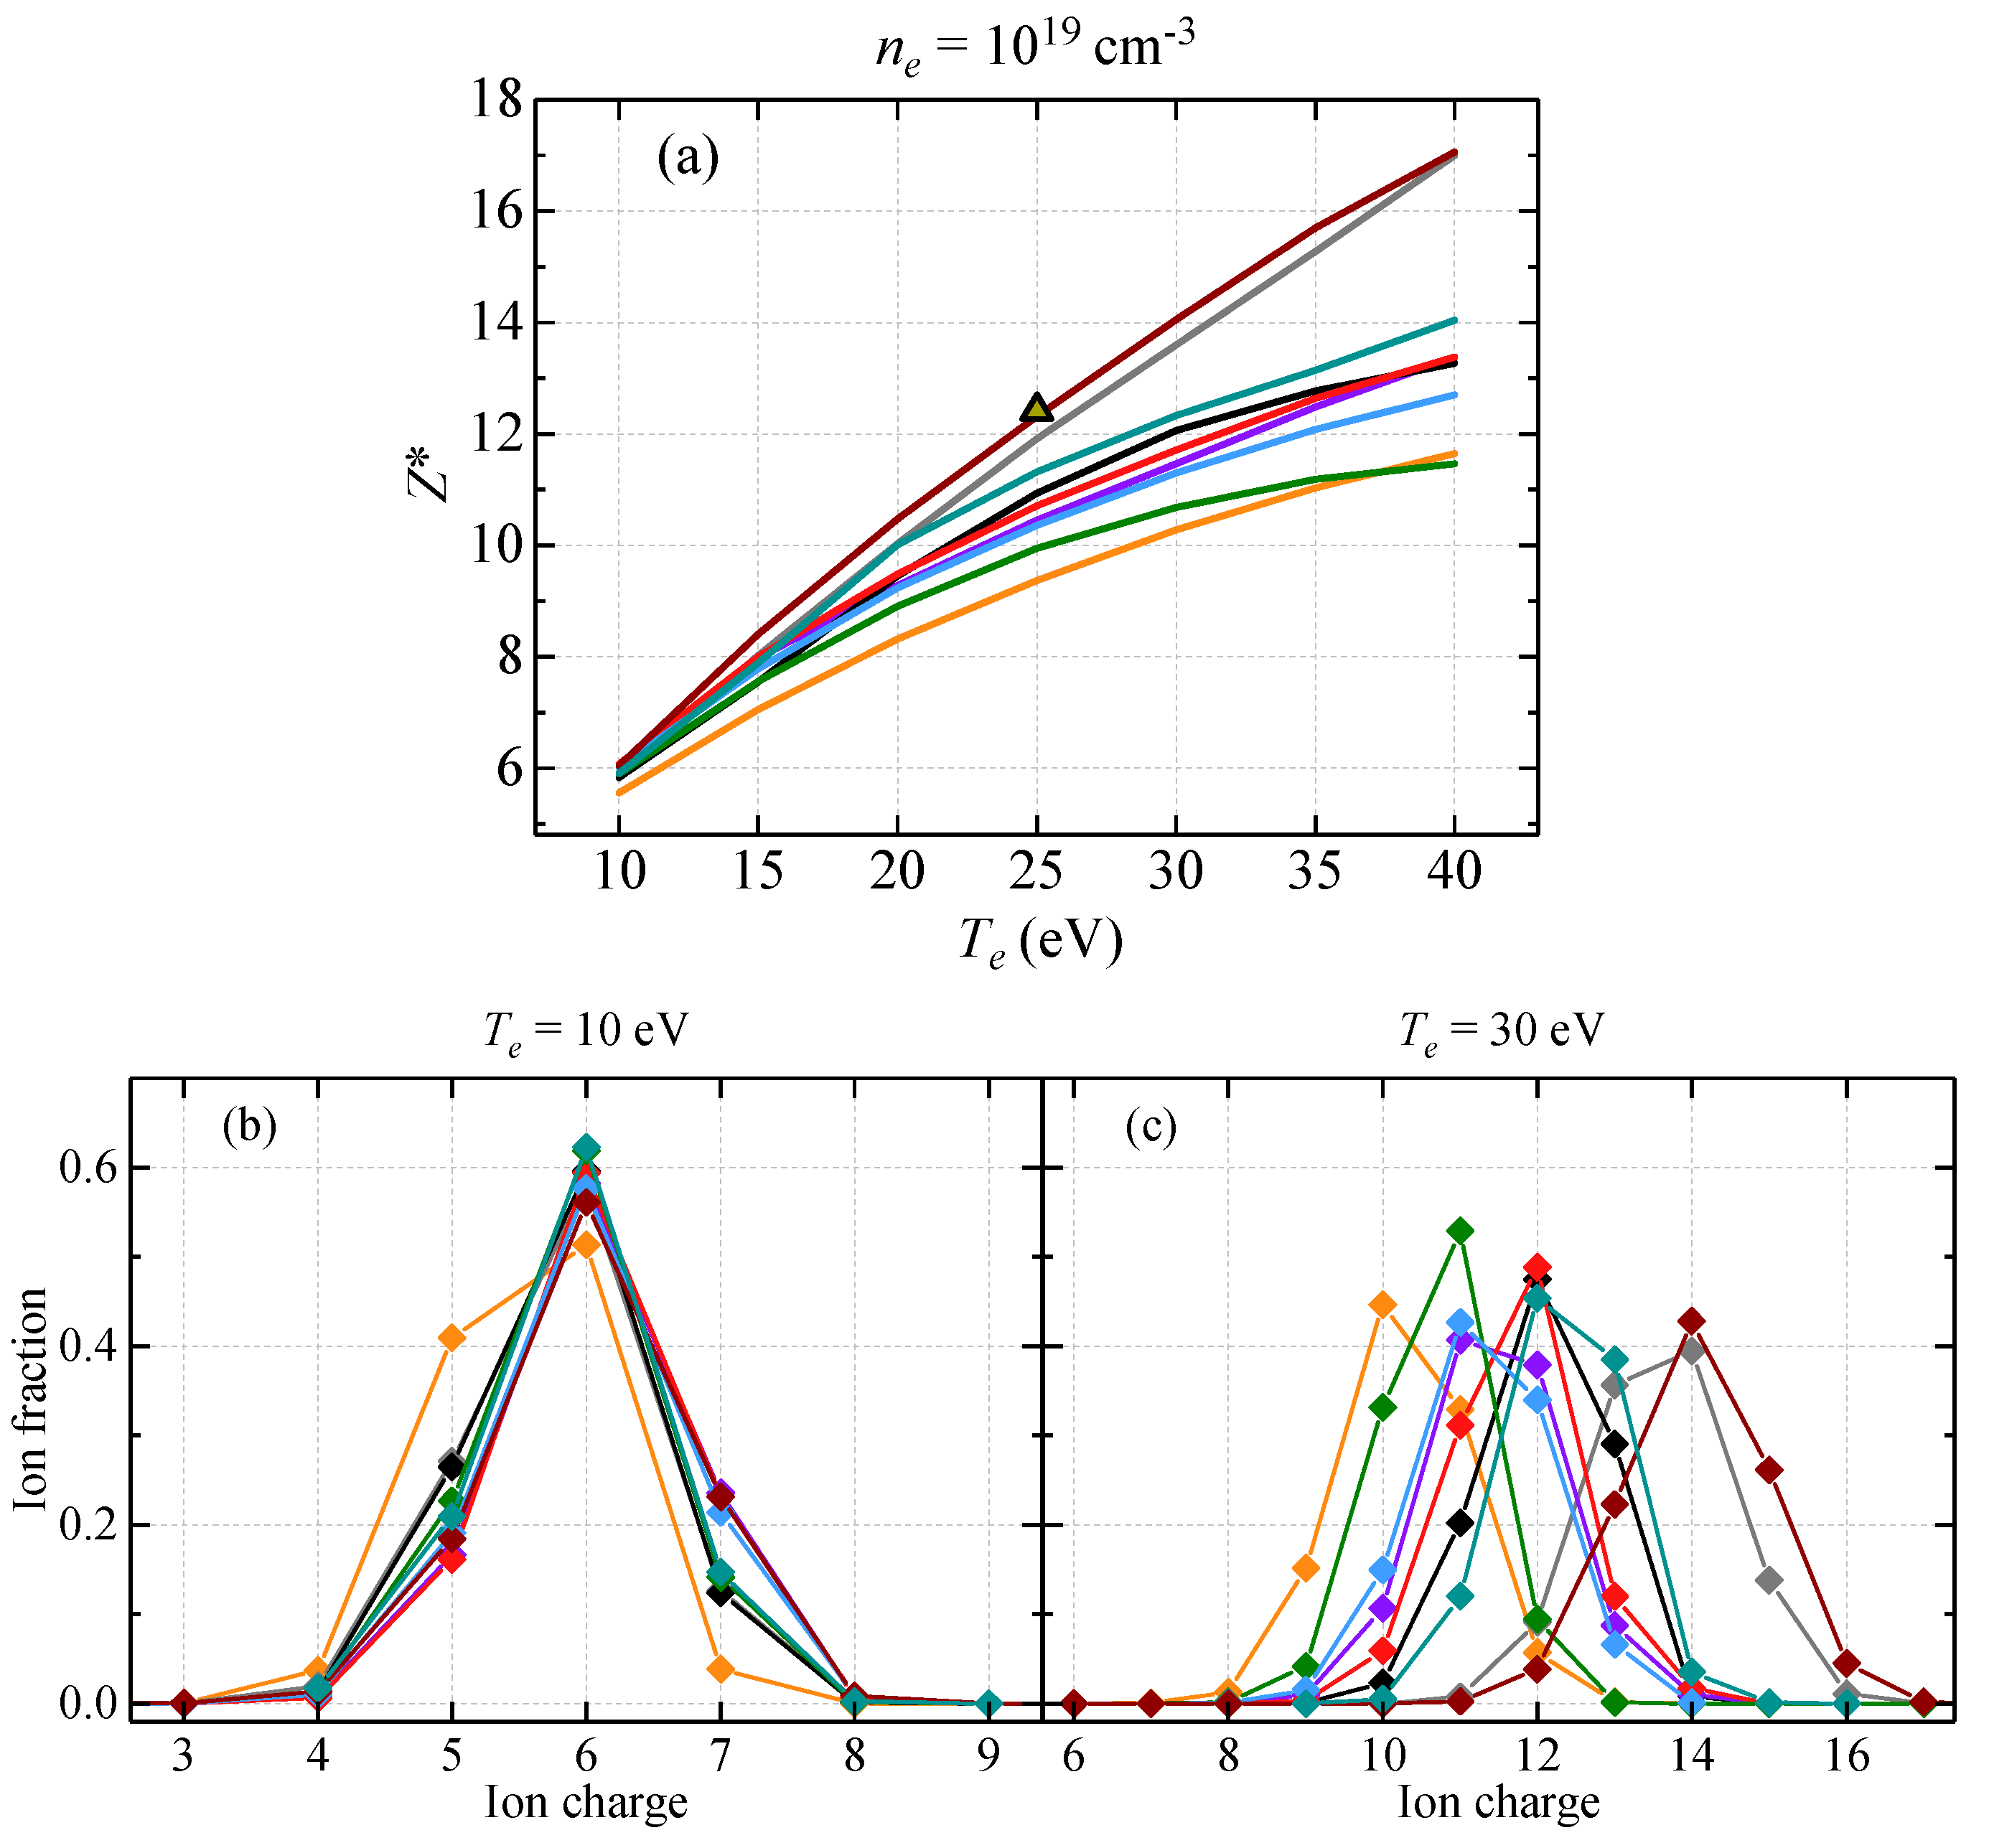
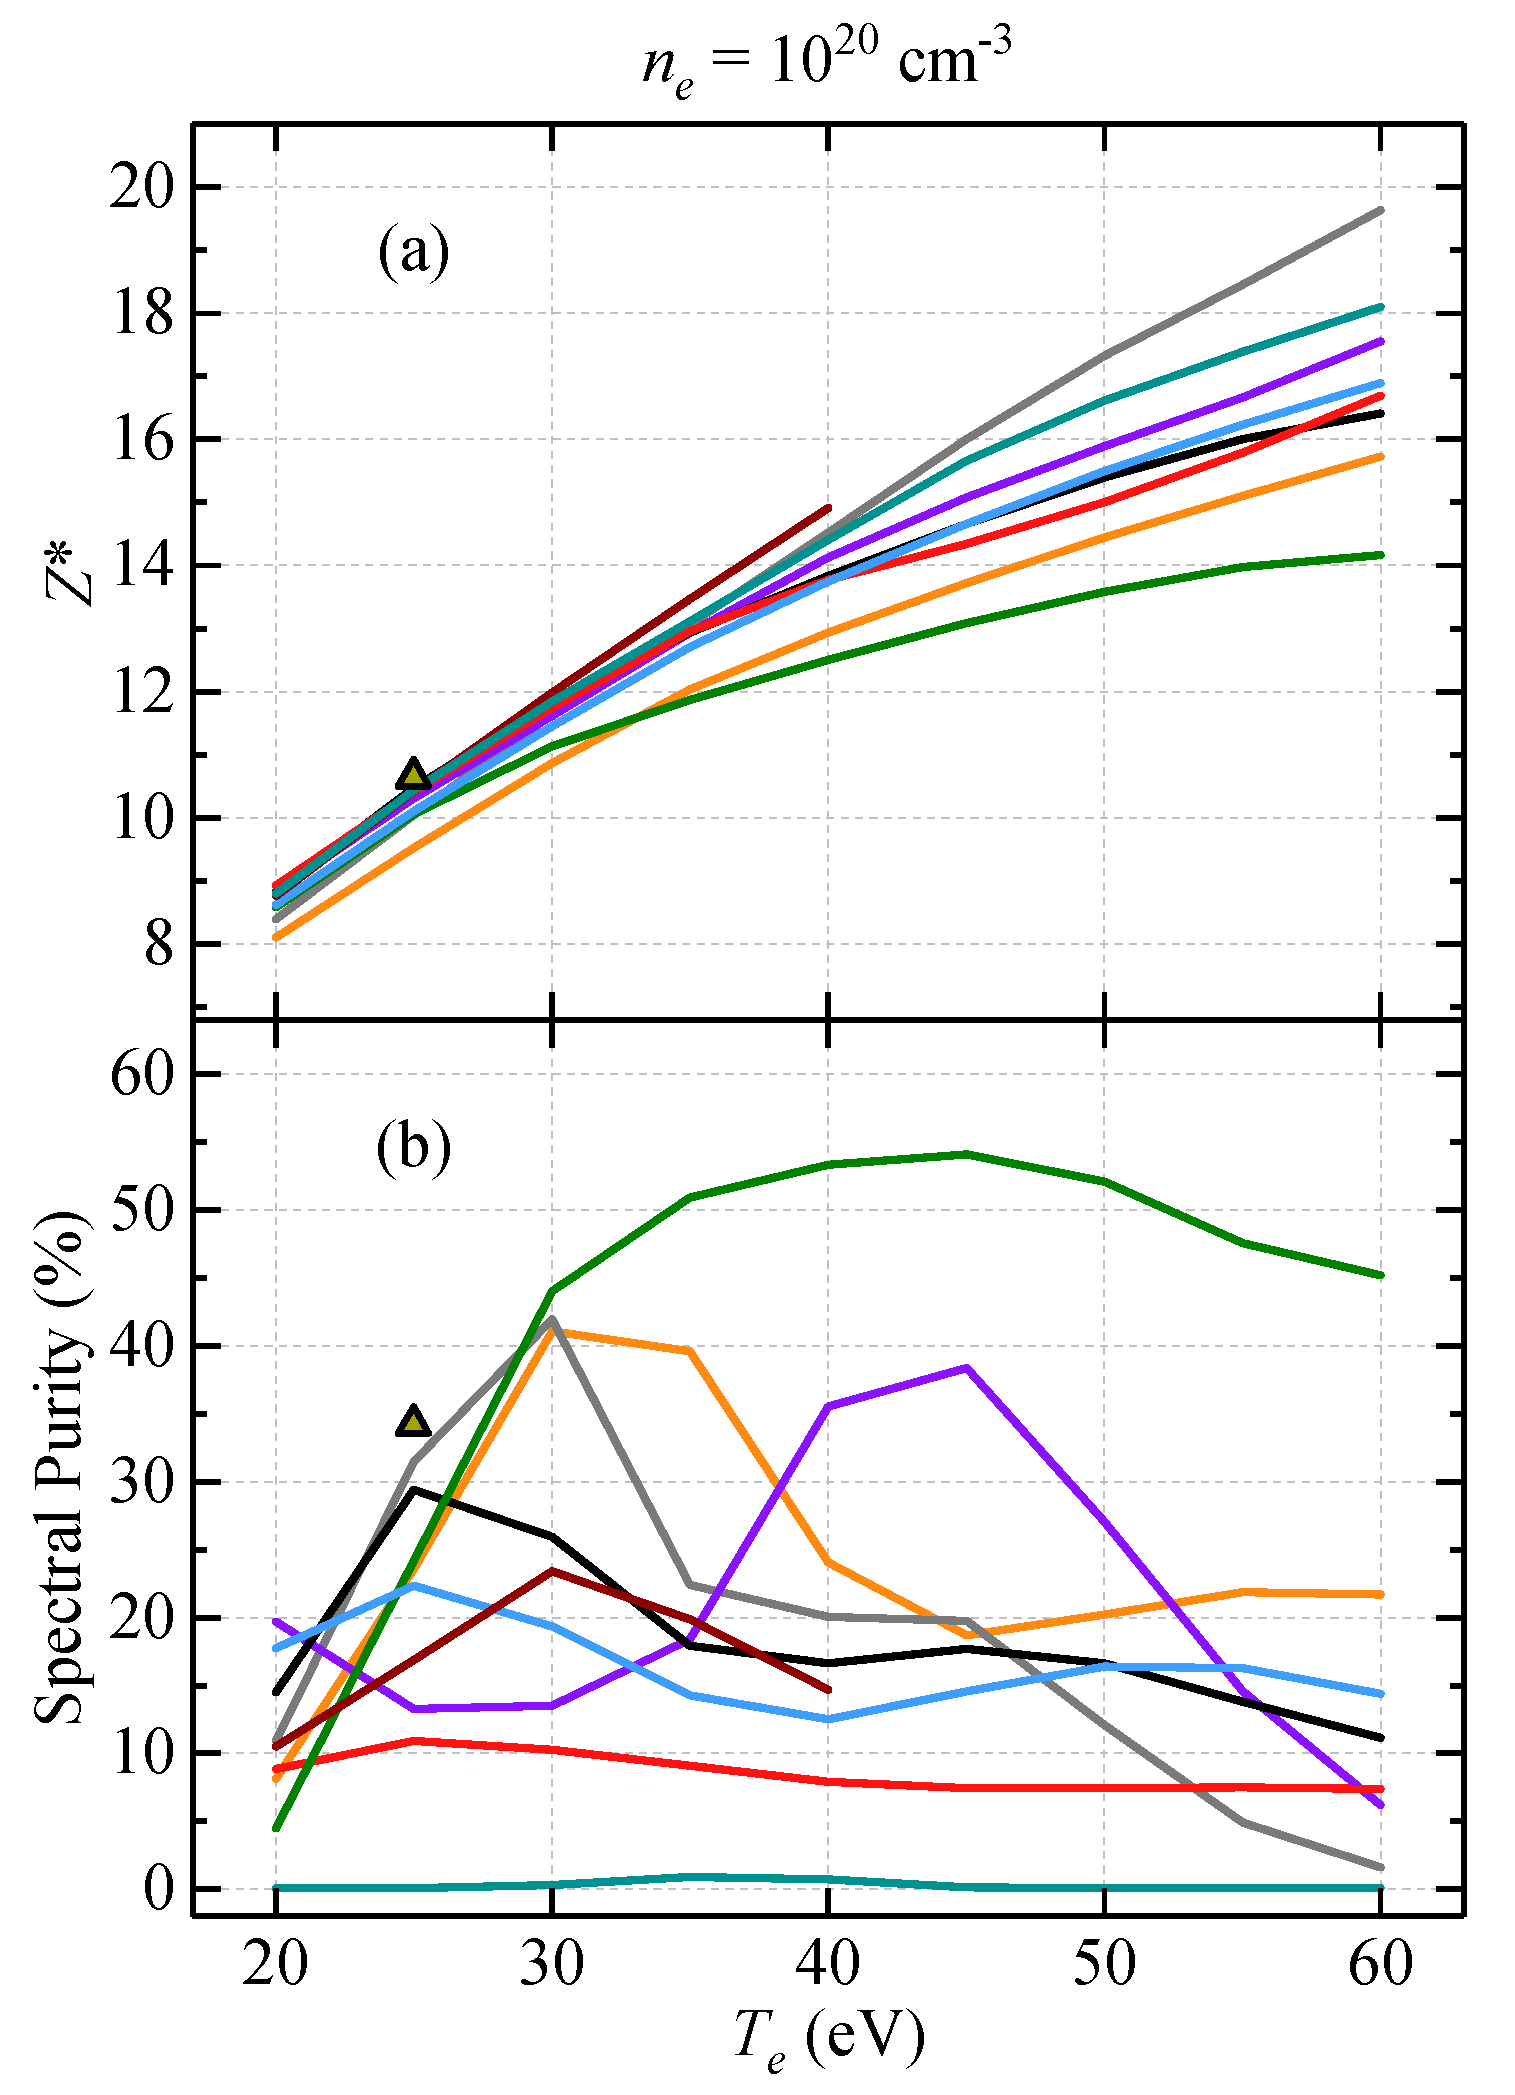
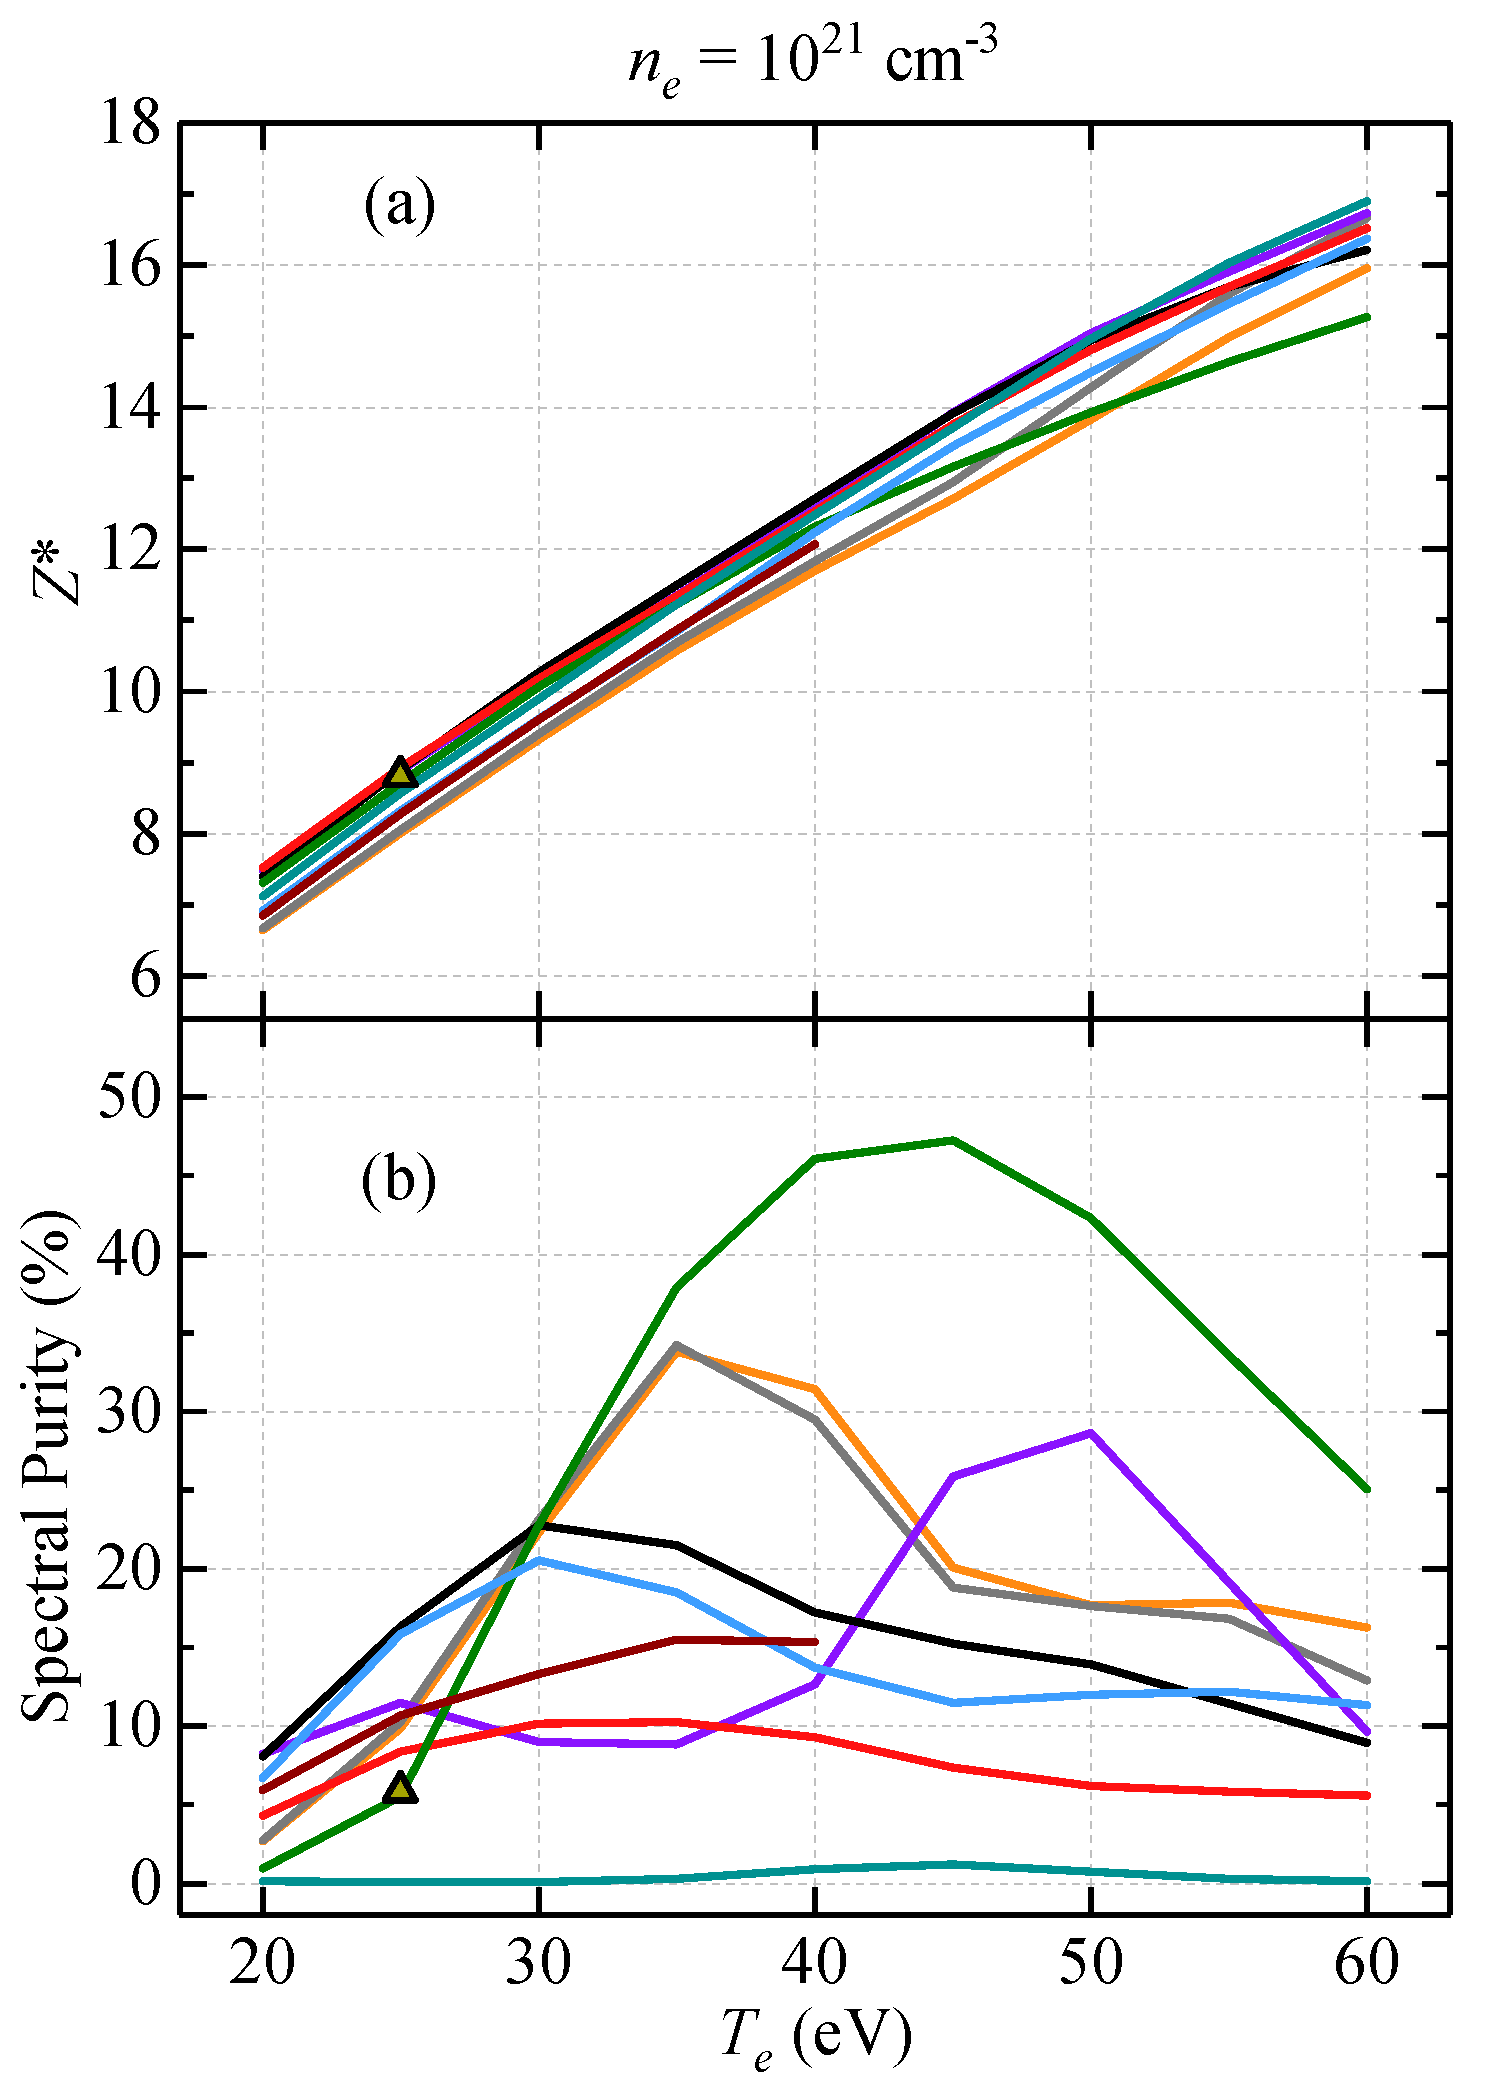
- The charge state distribution (CSD) and average charge state of the plasma.
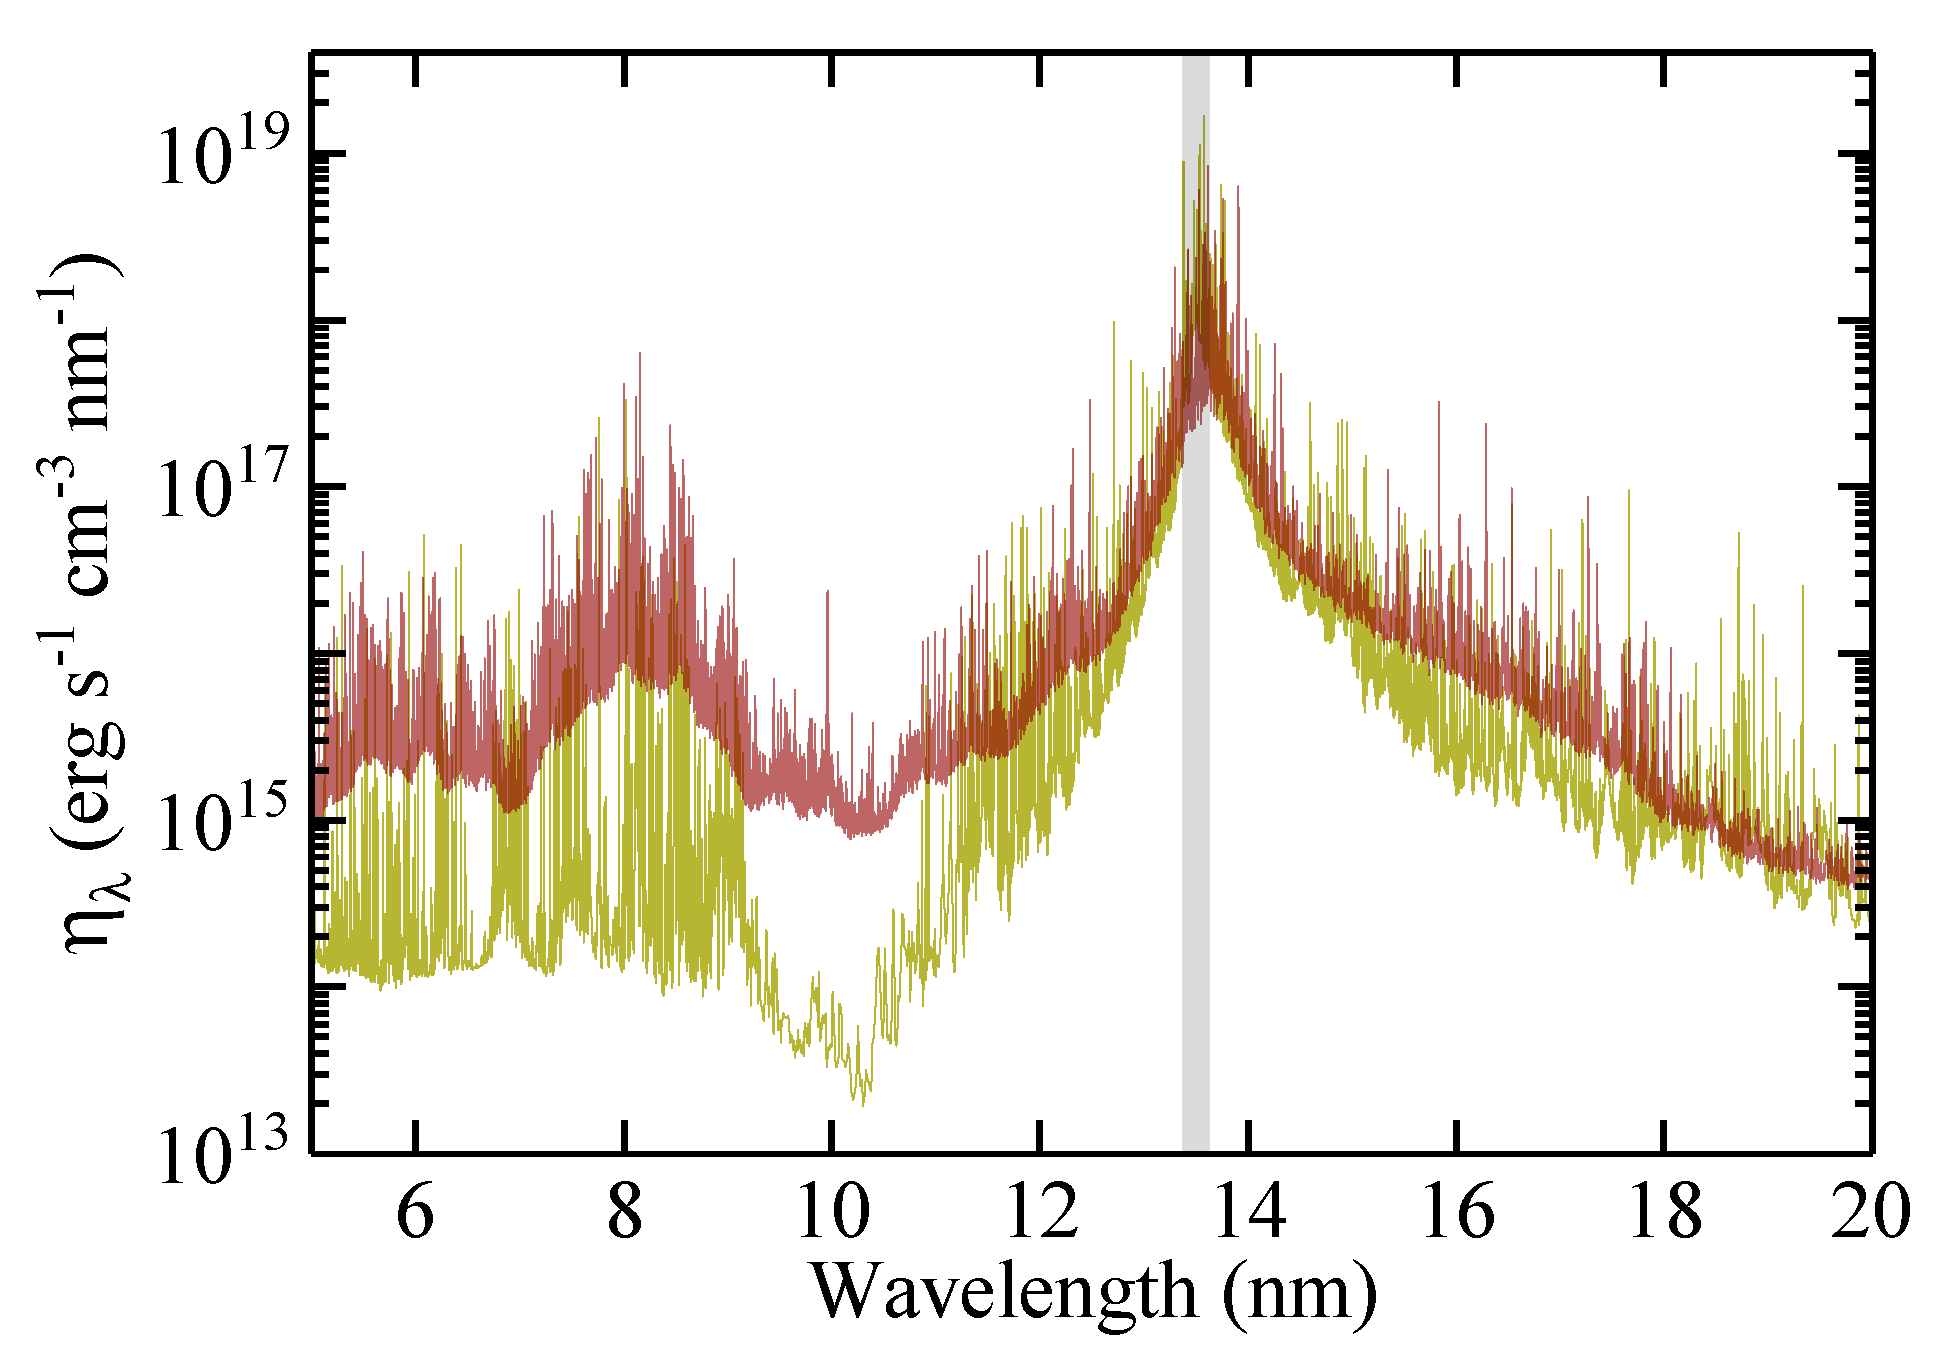
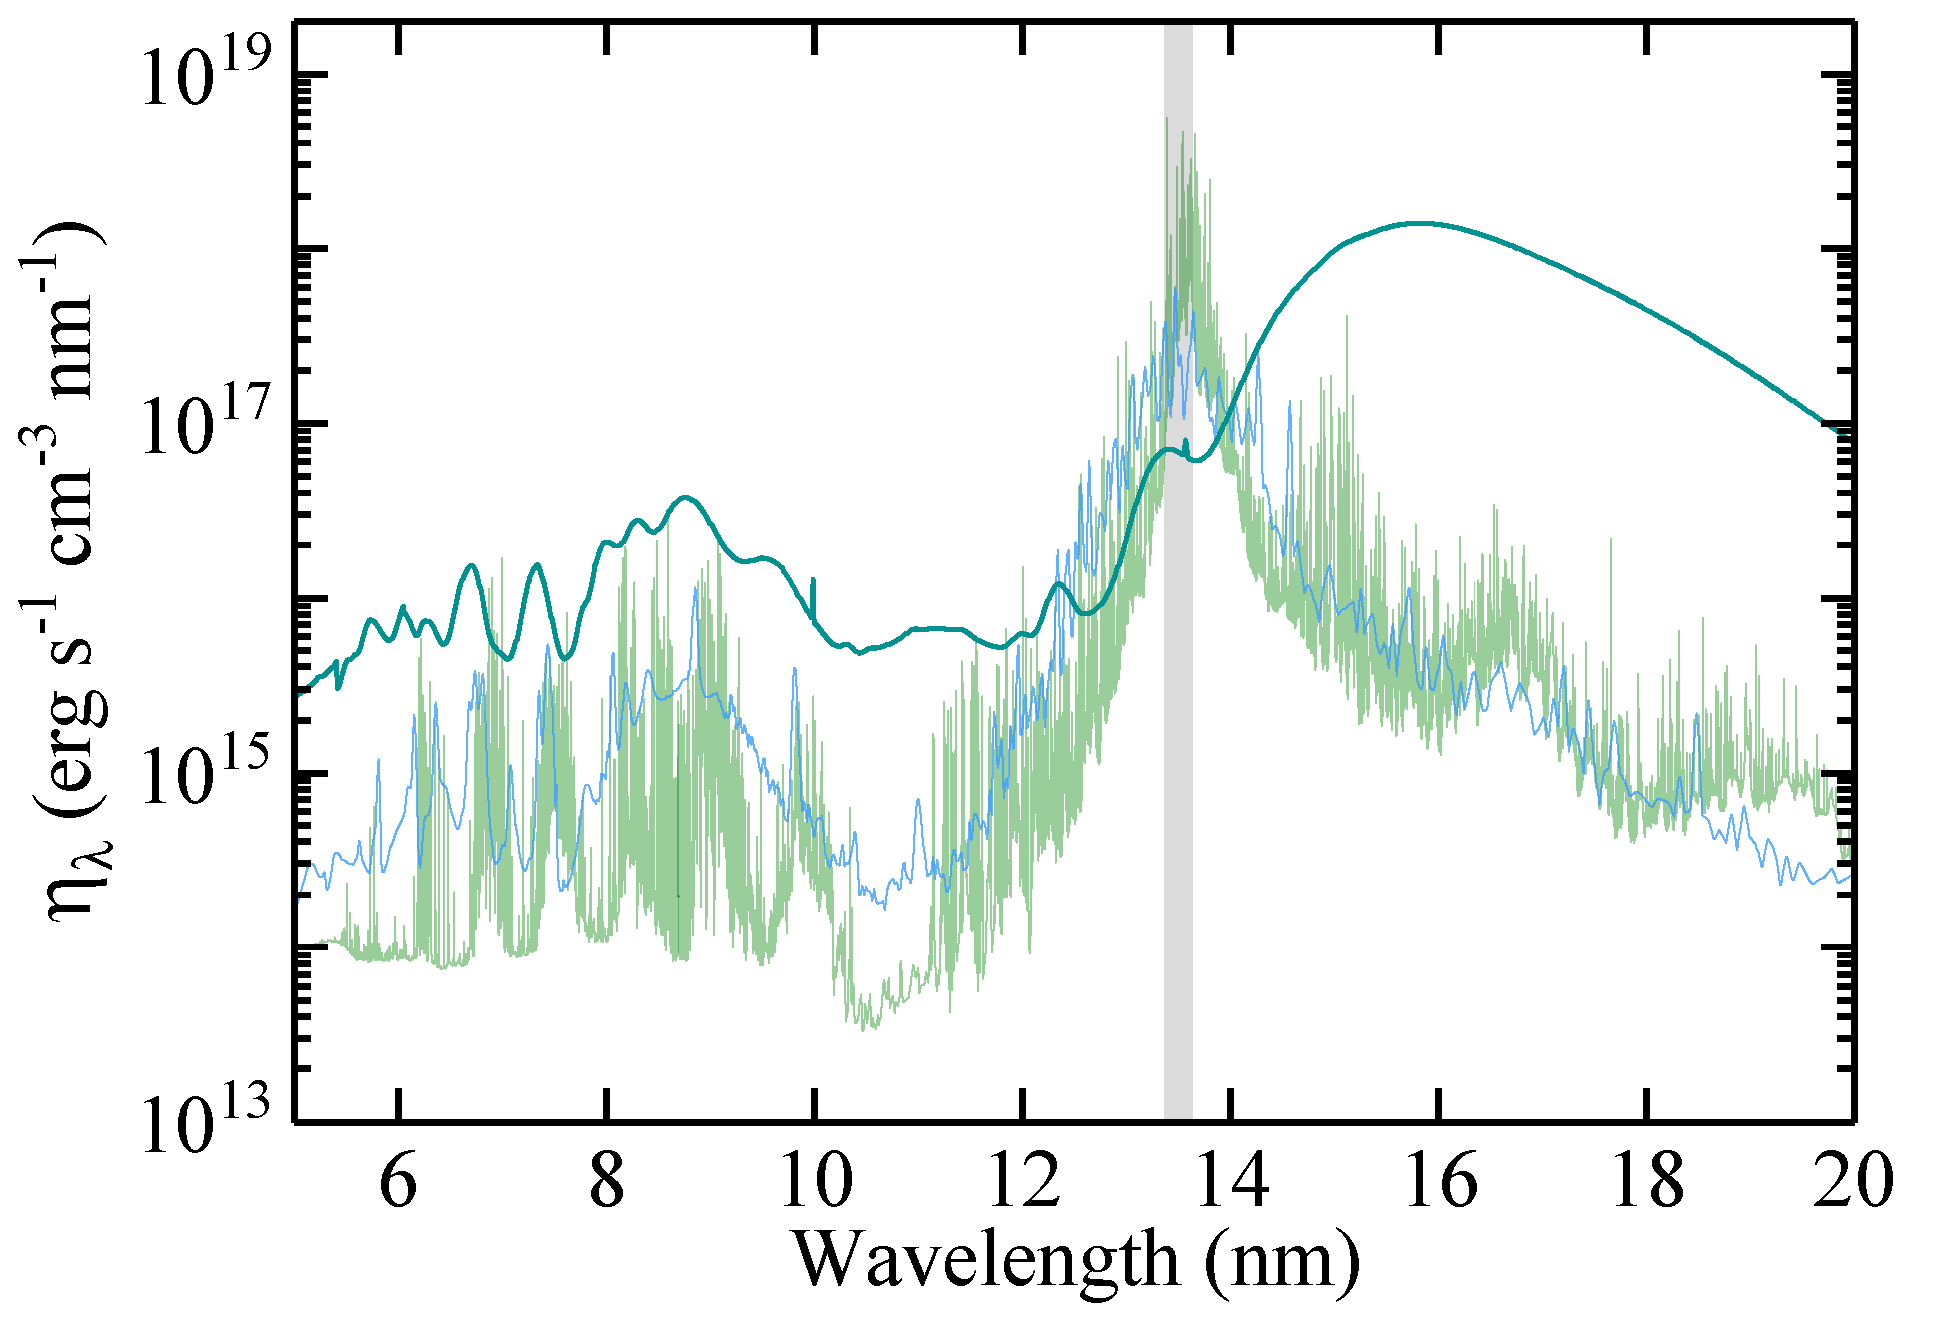
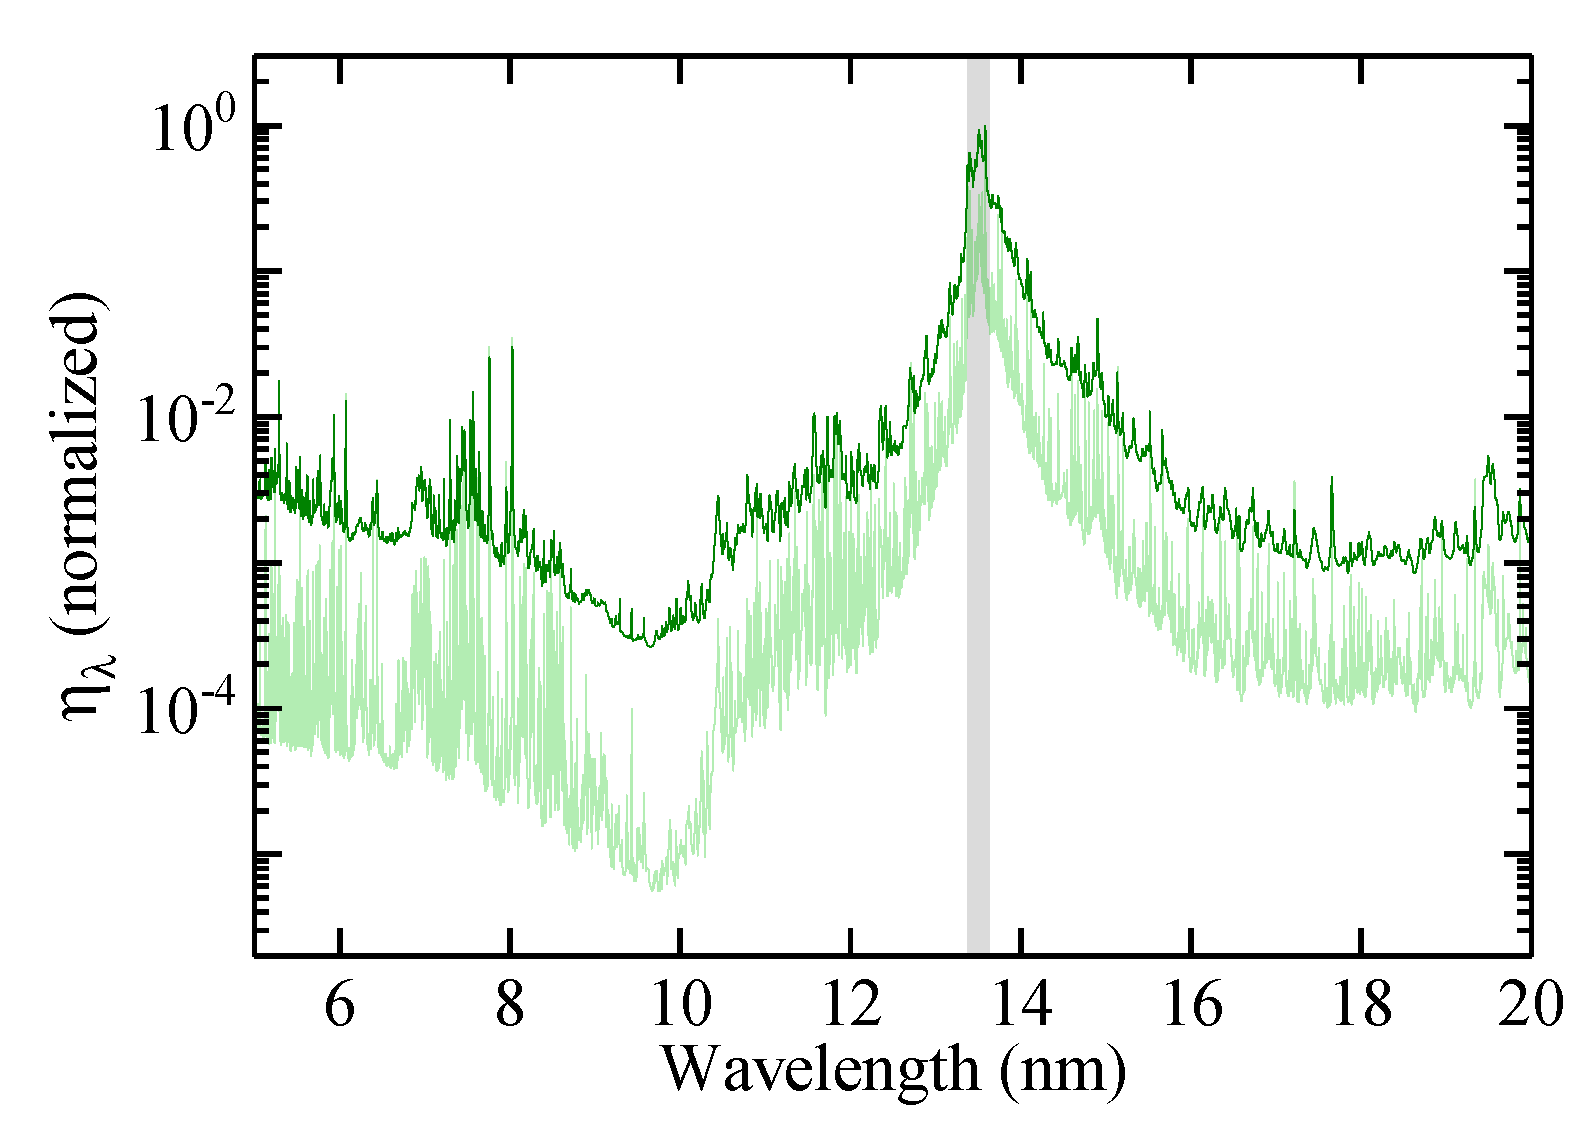
- The emission () and absorption () coefficients.
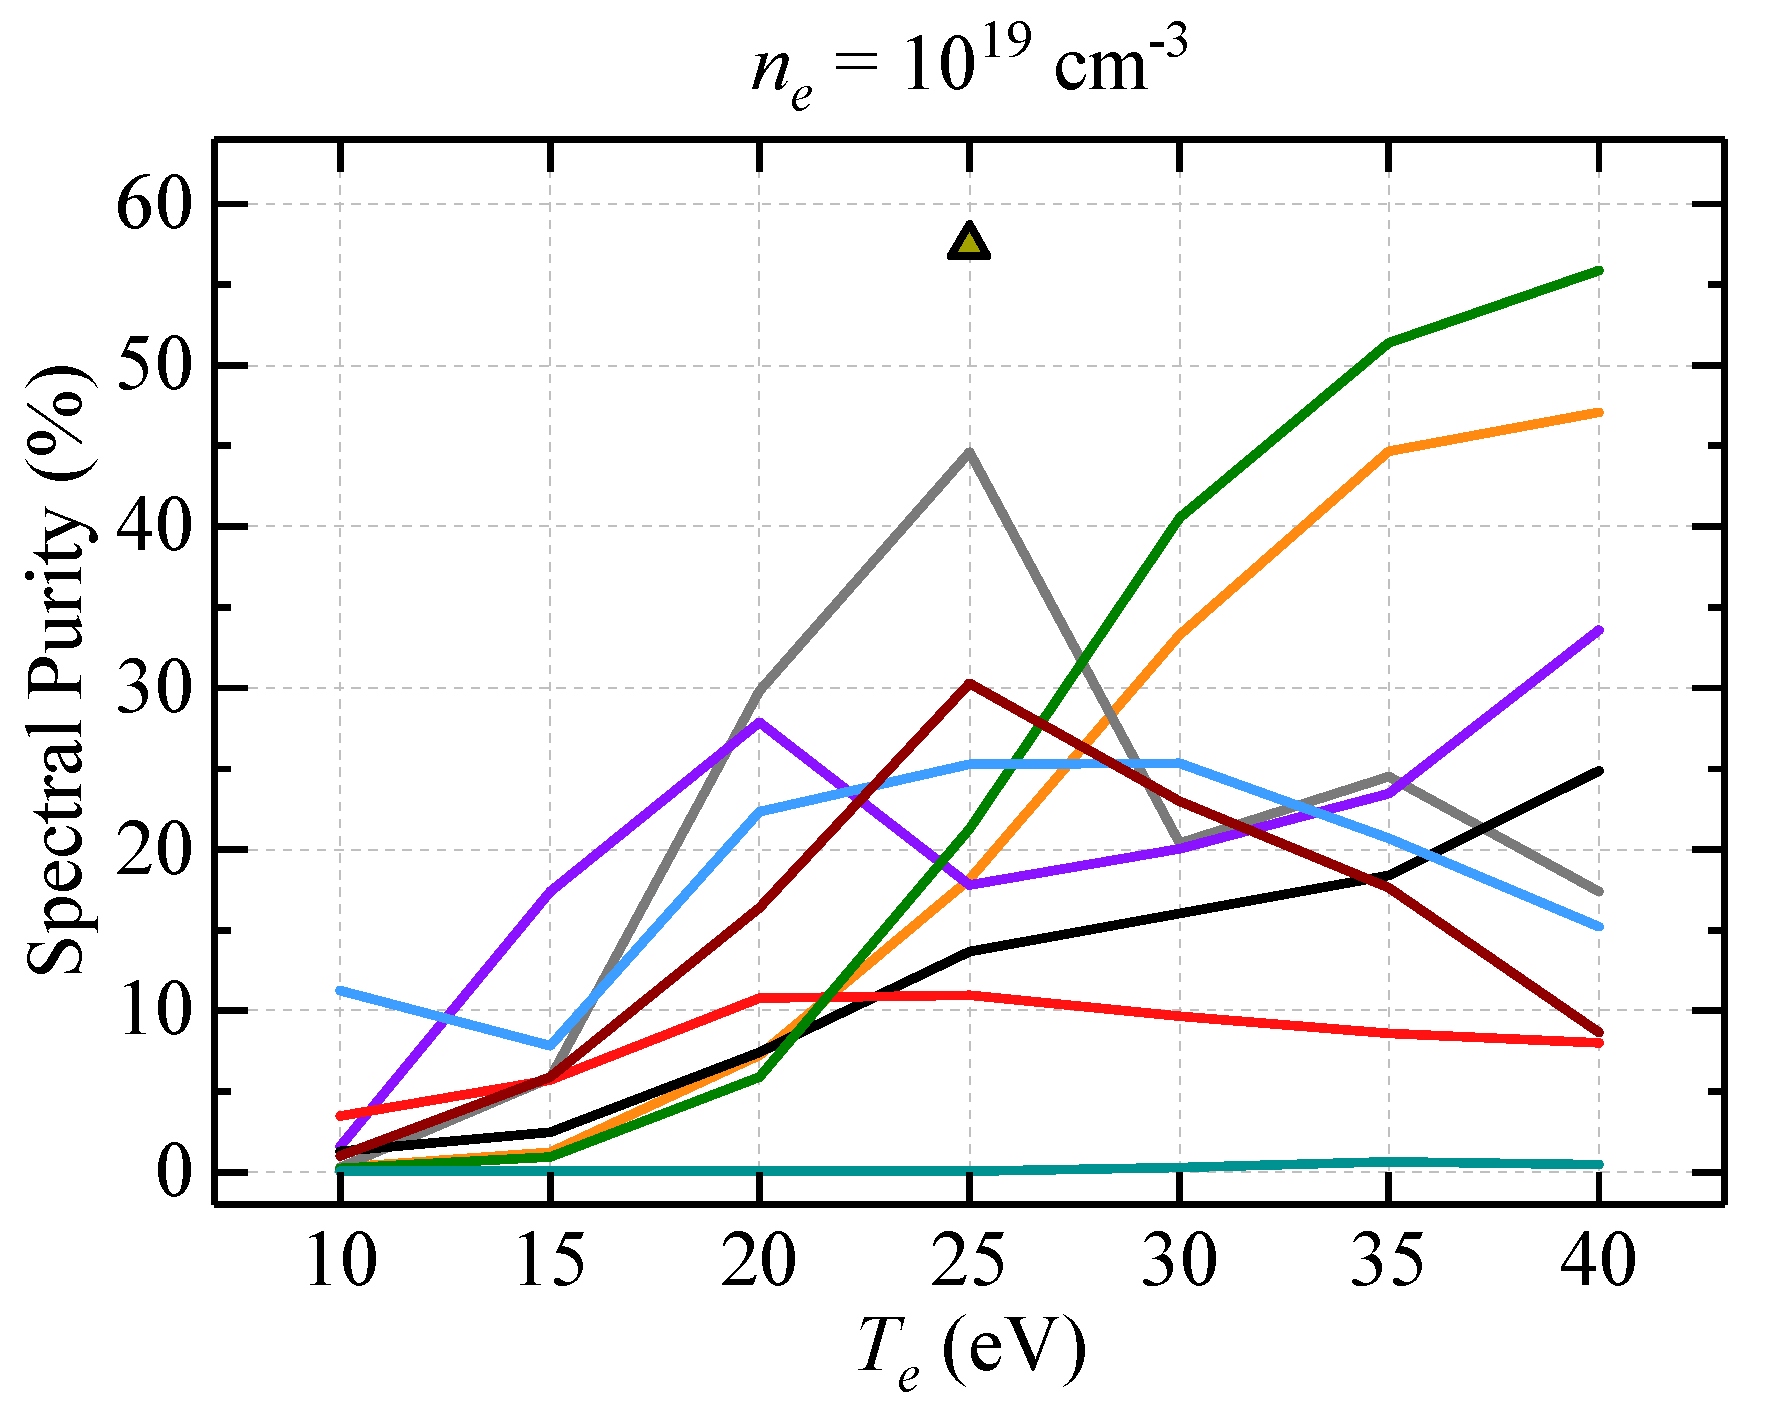
- The spectral purity (SP) of the plasma, defined as the ratio of the emissivity in the in-band region 13.5 ± 0.135 nm to the emissivity in the 5–20 nm region, i.e., .
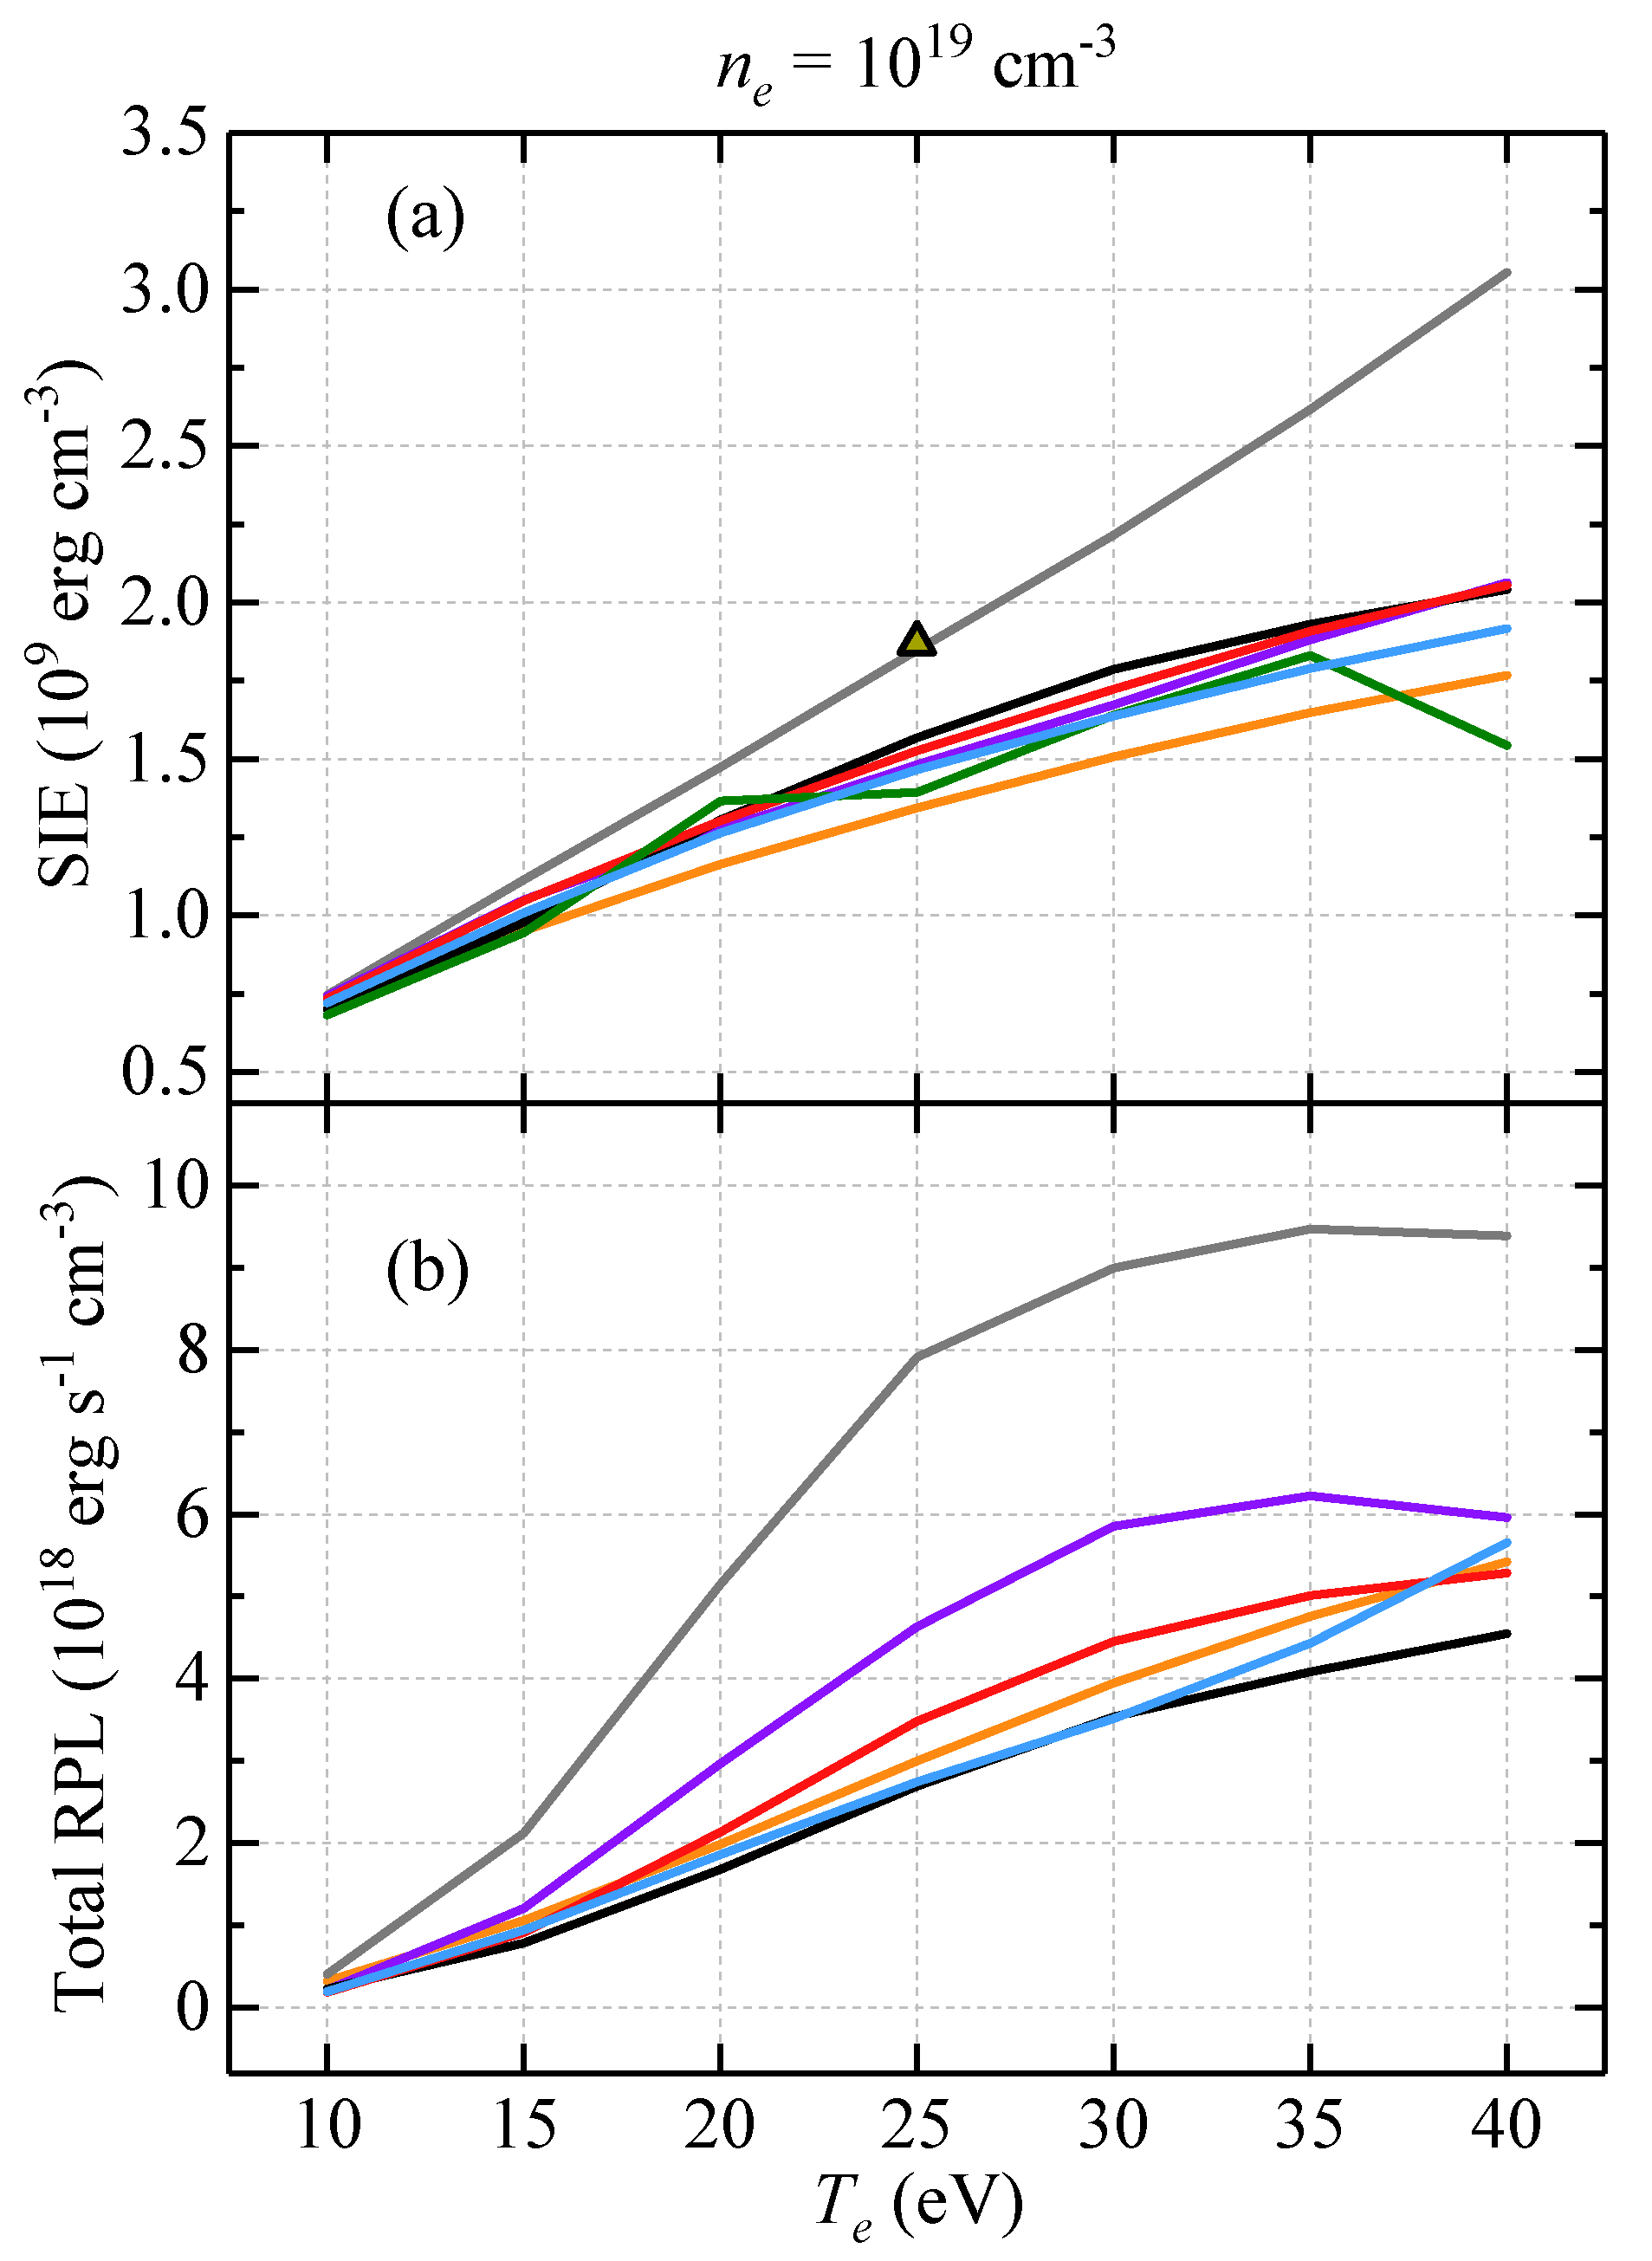
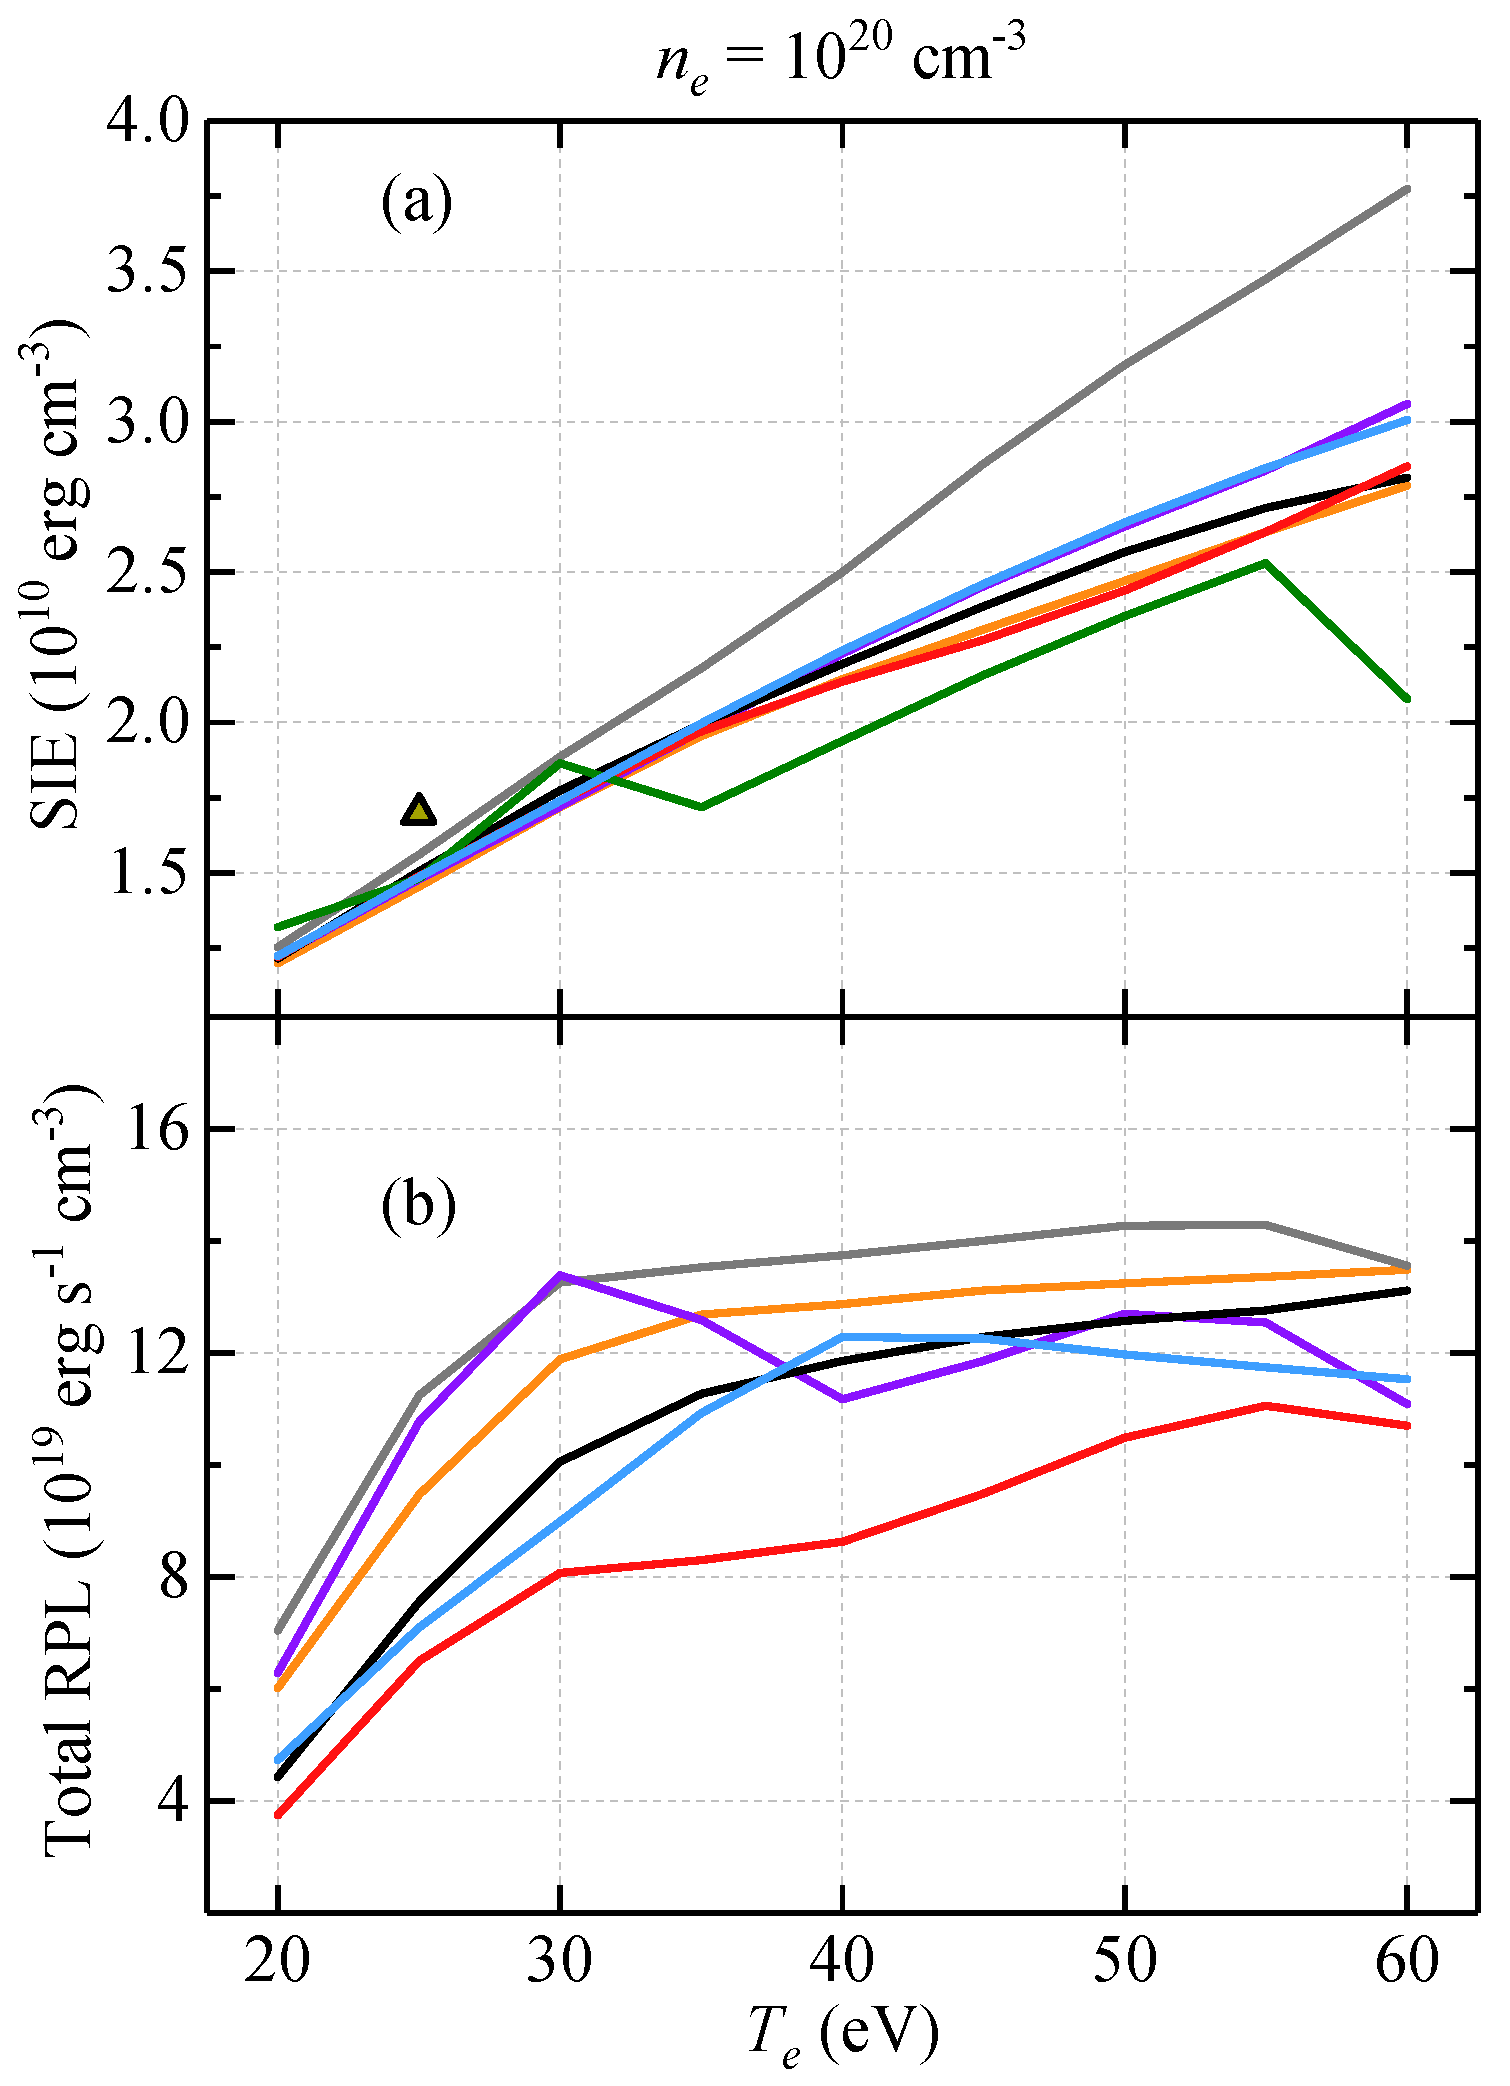
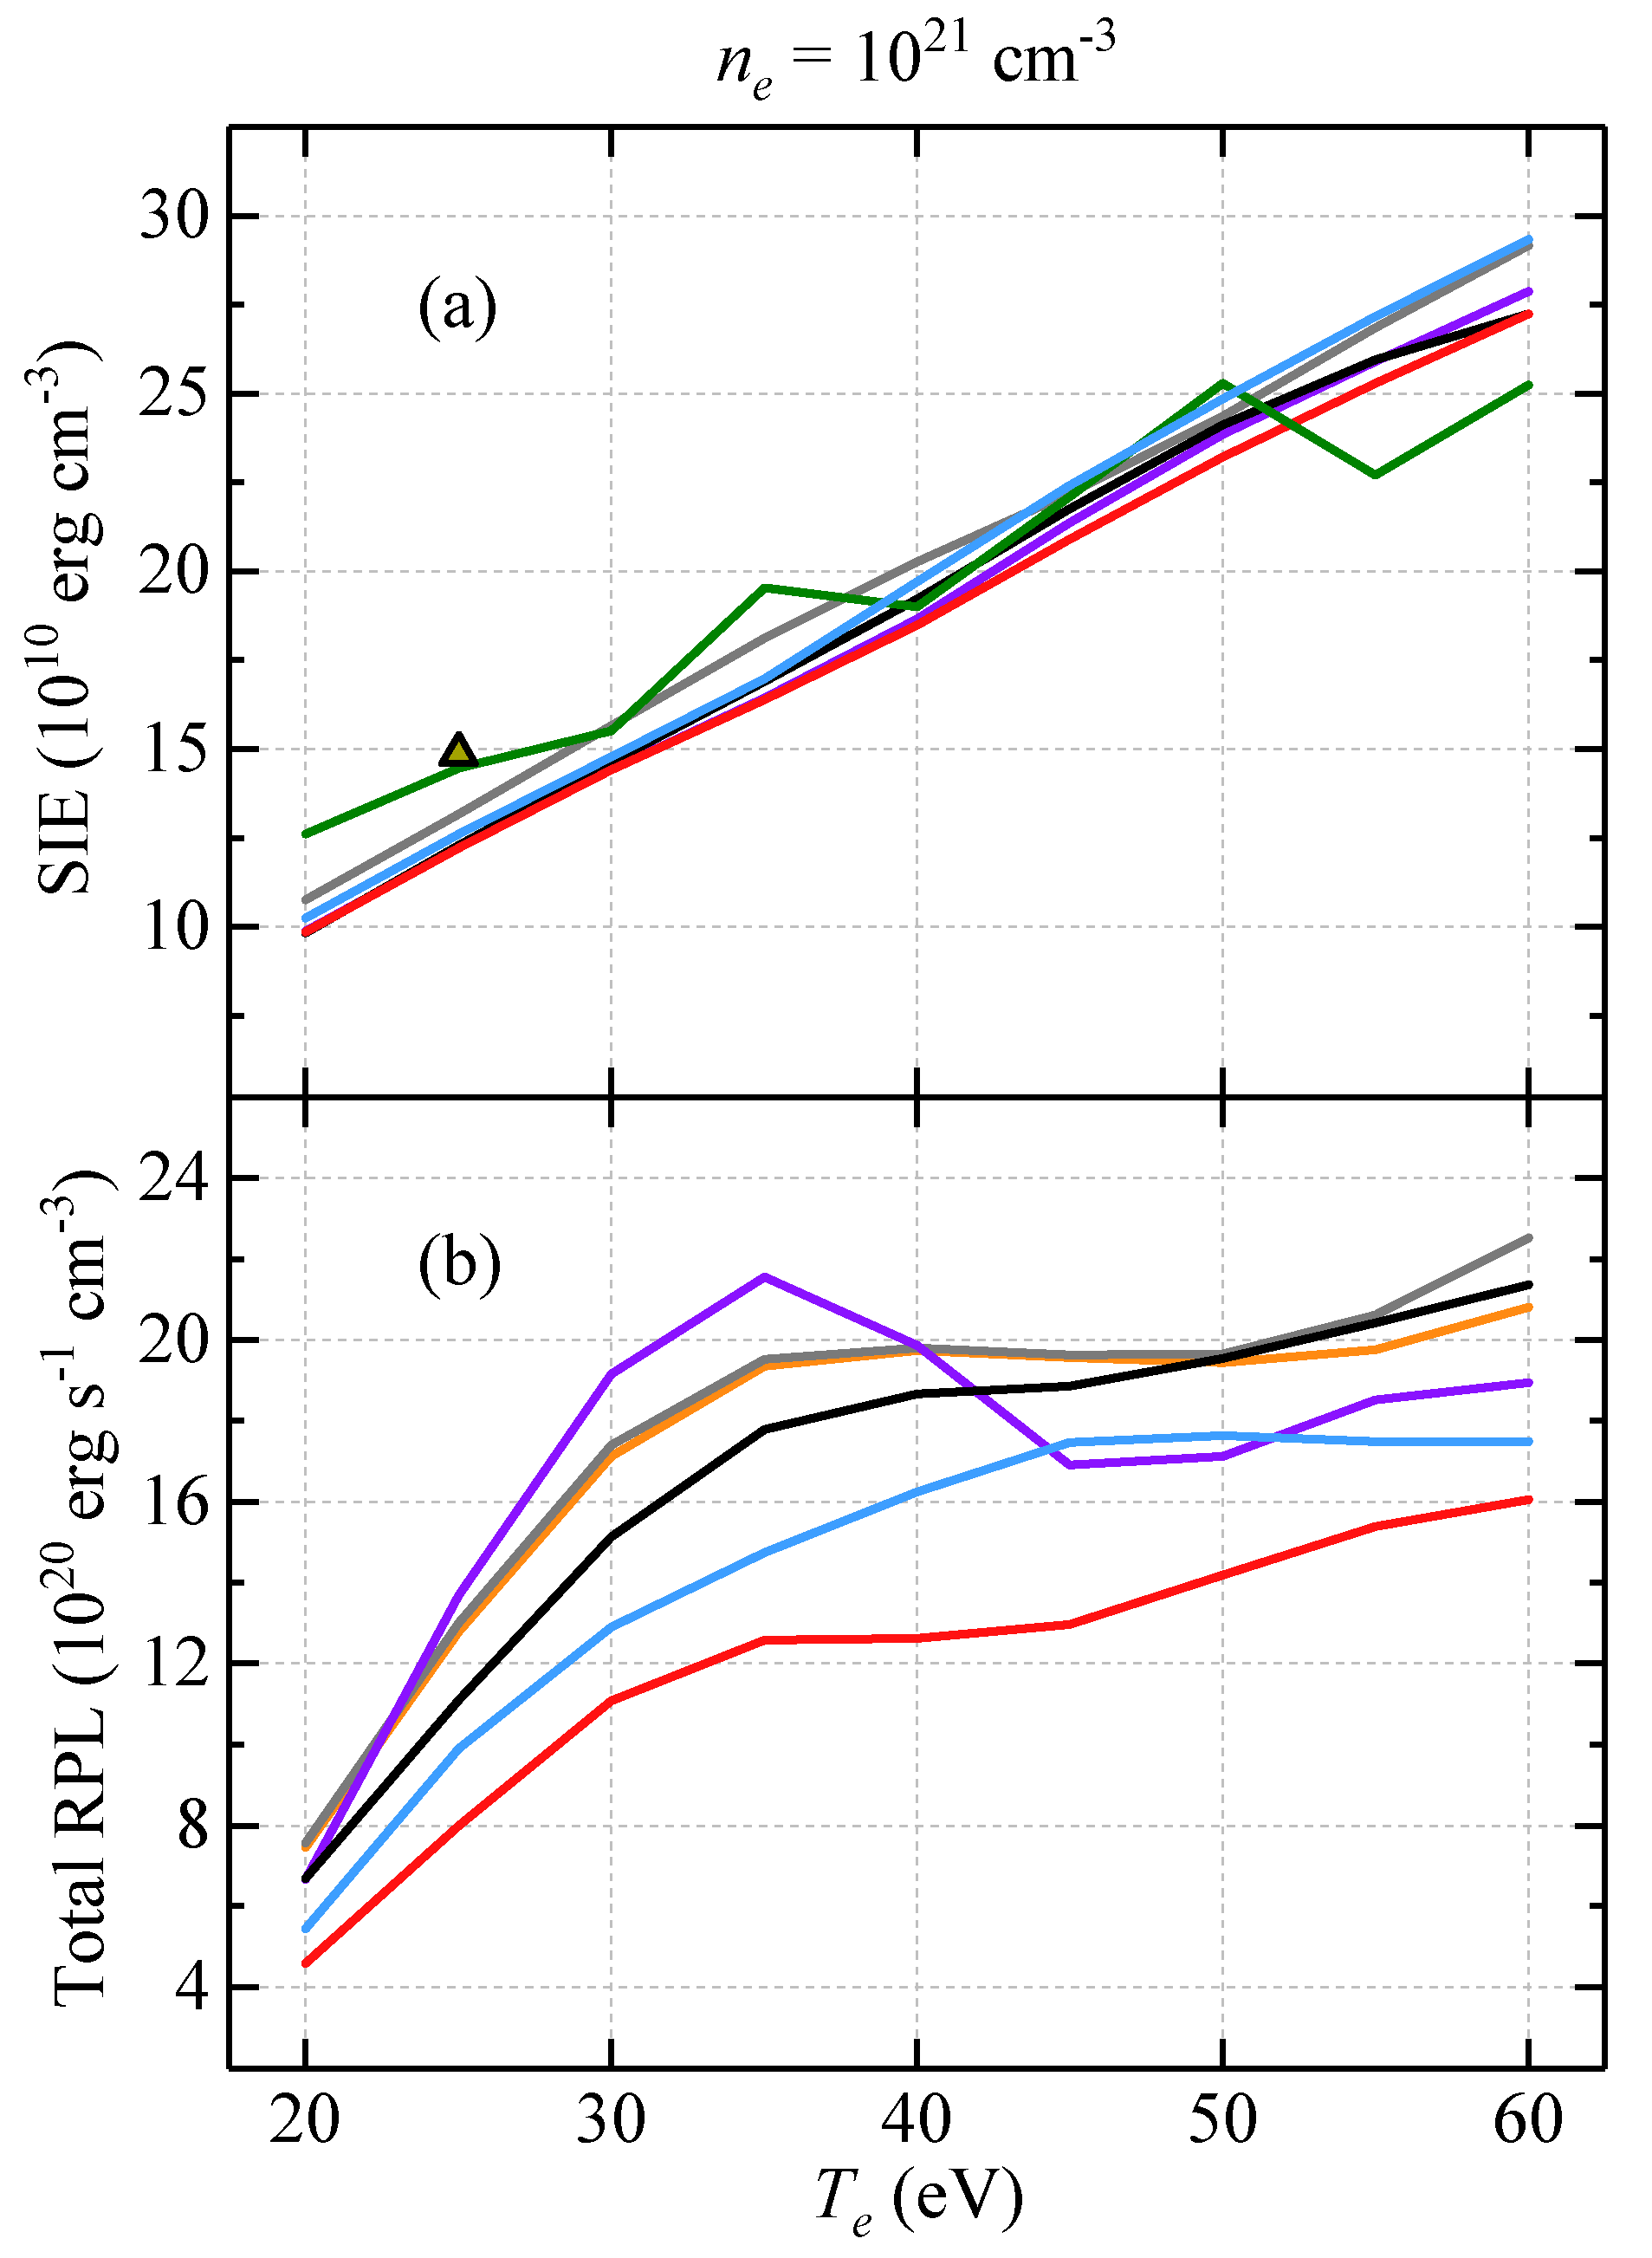
- The specific internal energy (SIE), defined as SIE = where the sum runs over all states j (levels, configurations, etc.) having energy and population density (simply “population” in the following) .
- Contributions to the radiative power losses (RPL): bound-bound, bound-free, and free-free transitions.

| (cm) | (eV) |
|---|---|
| 10 | 10, 15, 20, 25, 30, 35, 40 |
| 10, 10 | 20, 25, 30, 35, 40, 45, 50, 55, 60 |
3.1. Case 1: cm
3.2. Case 2: cm
3.3. Case 3: cm
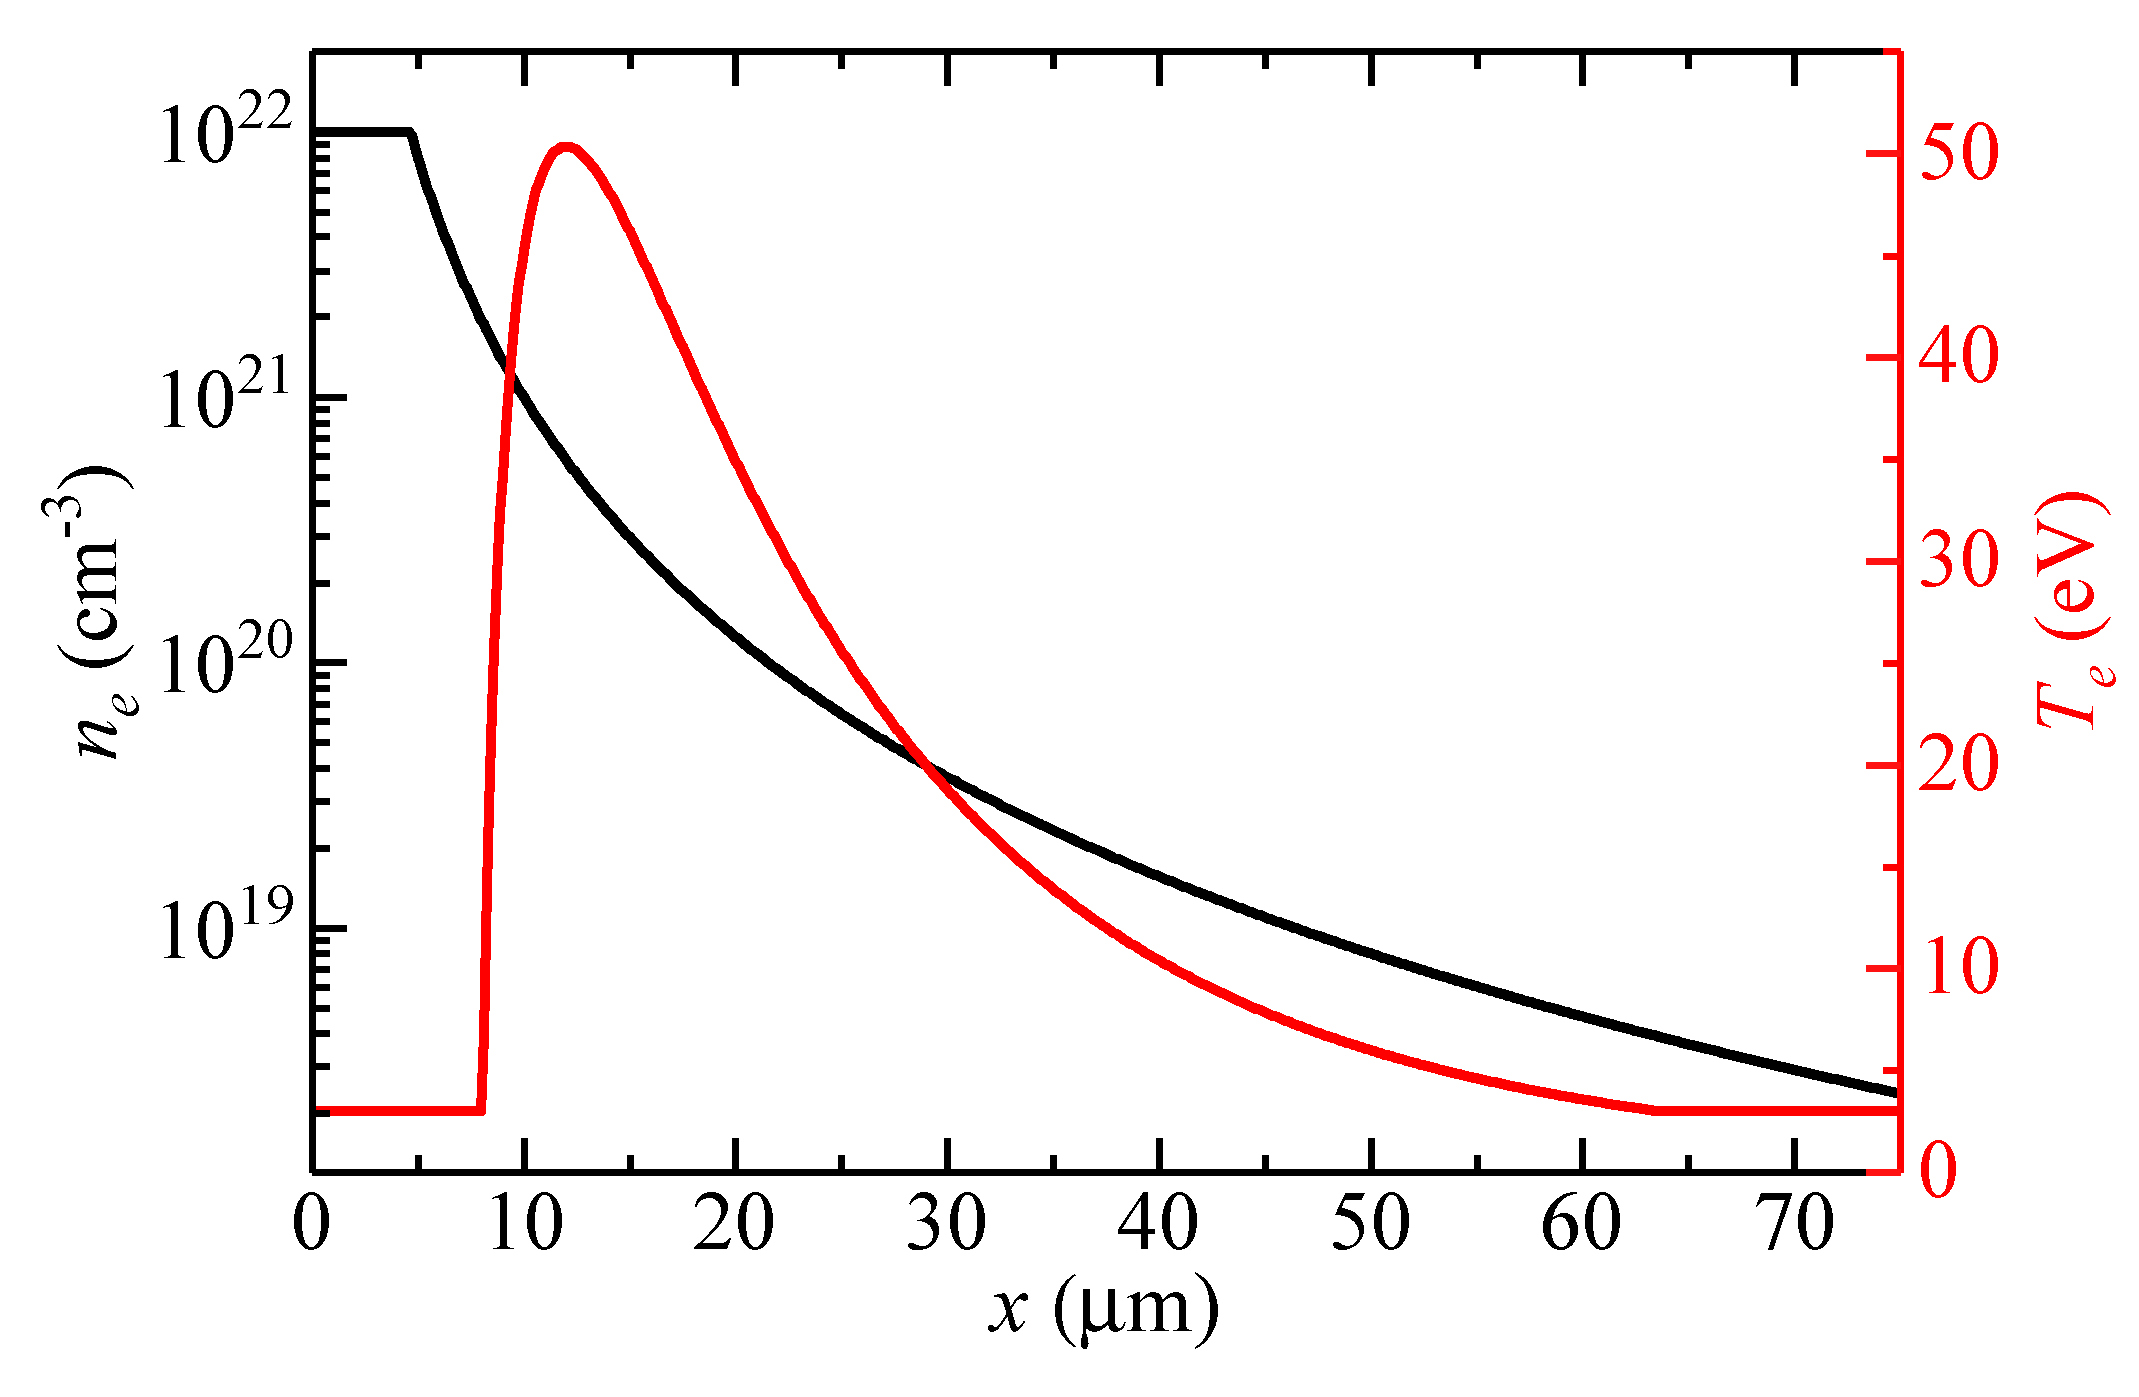
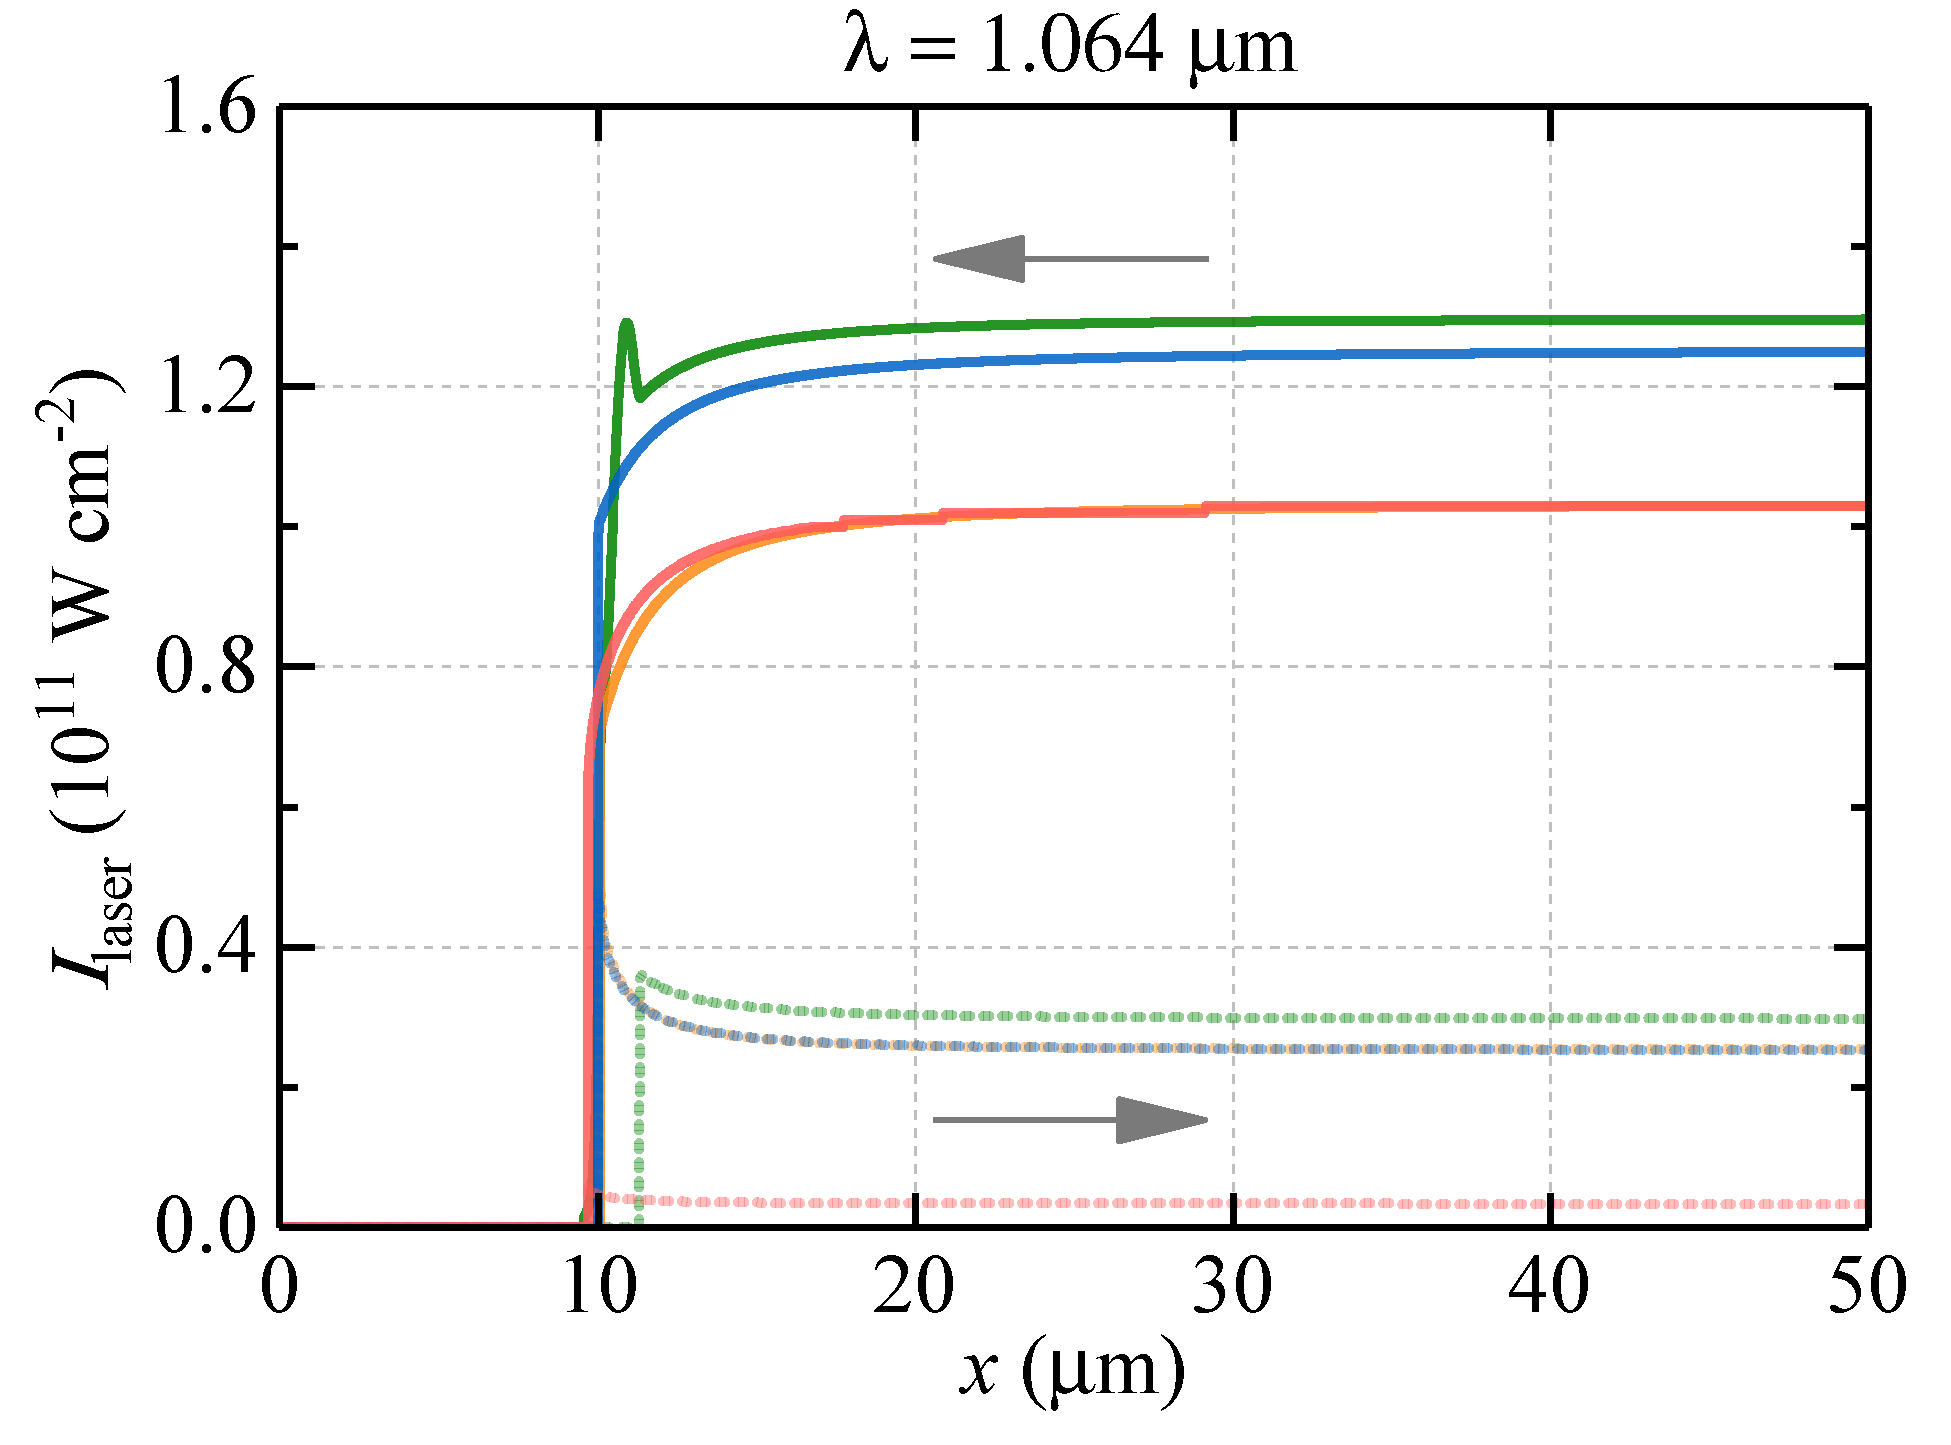
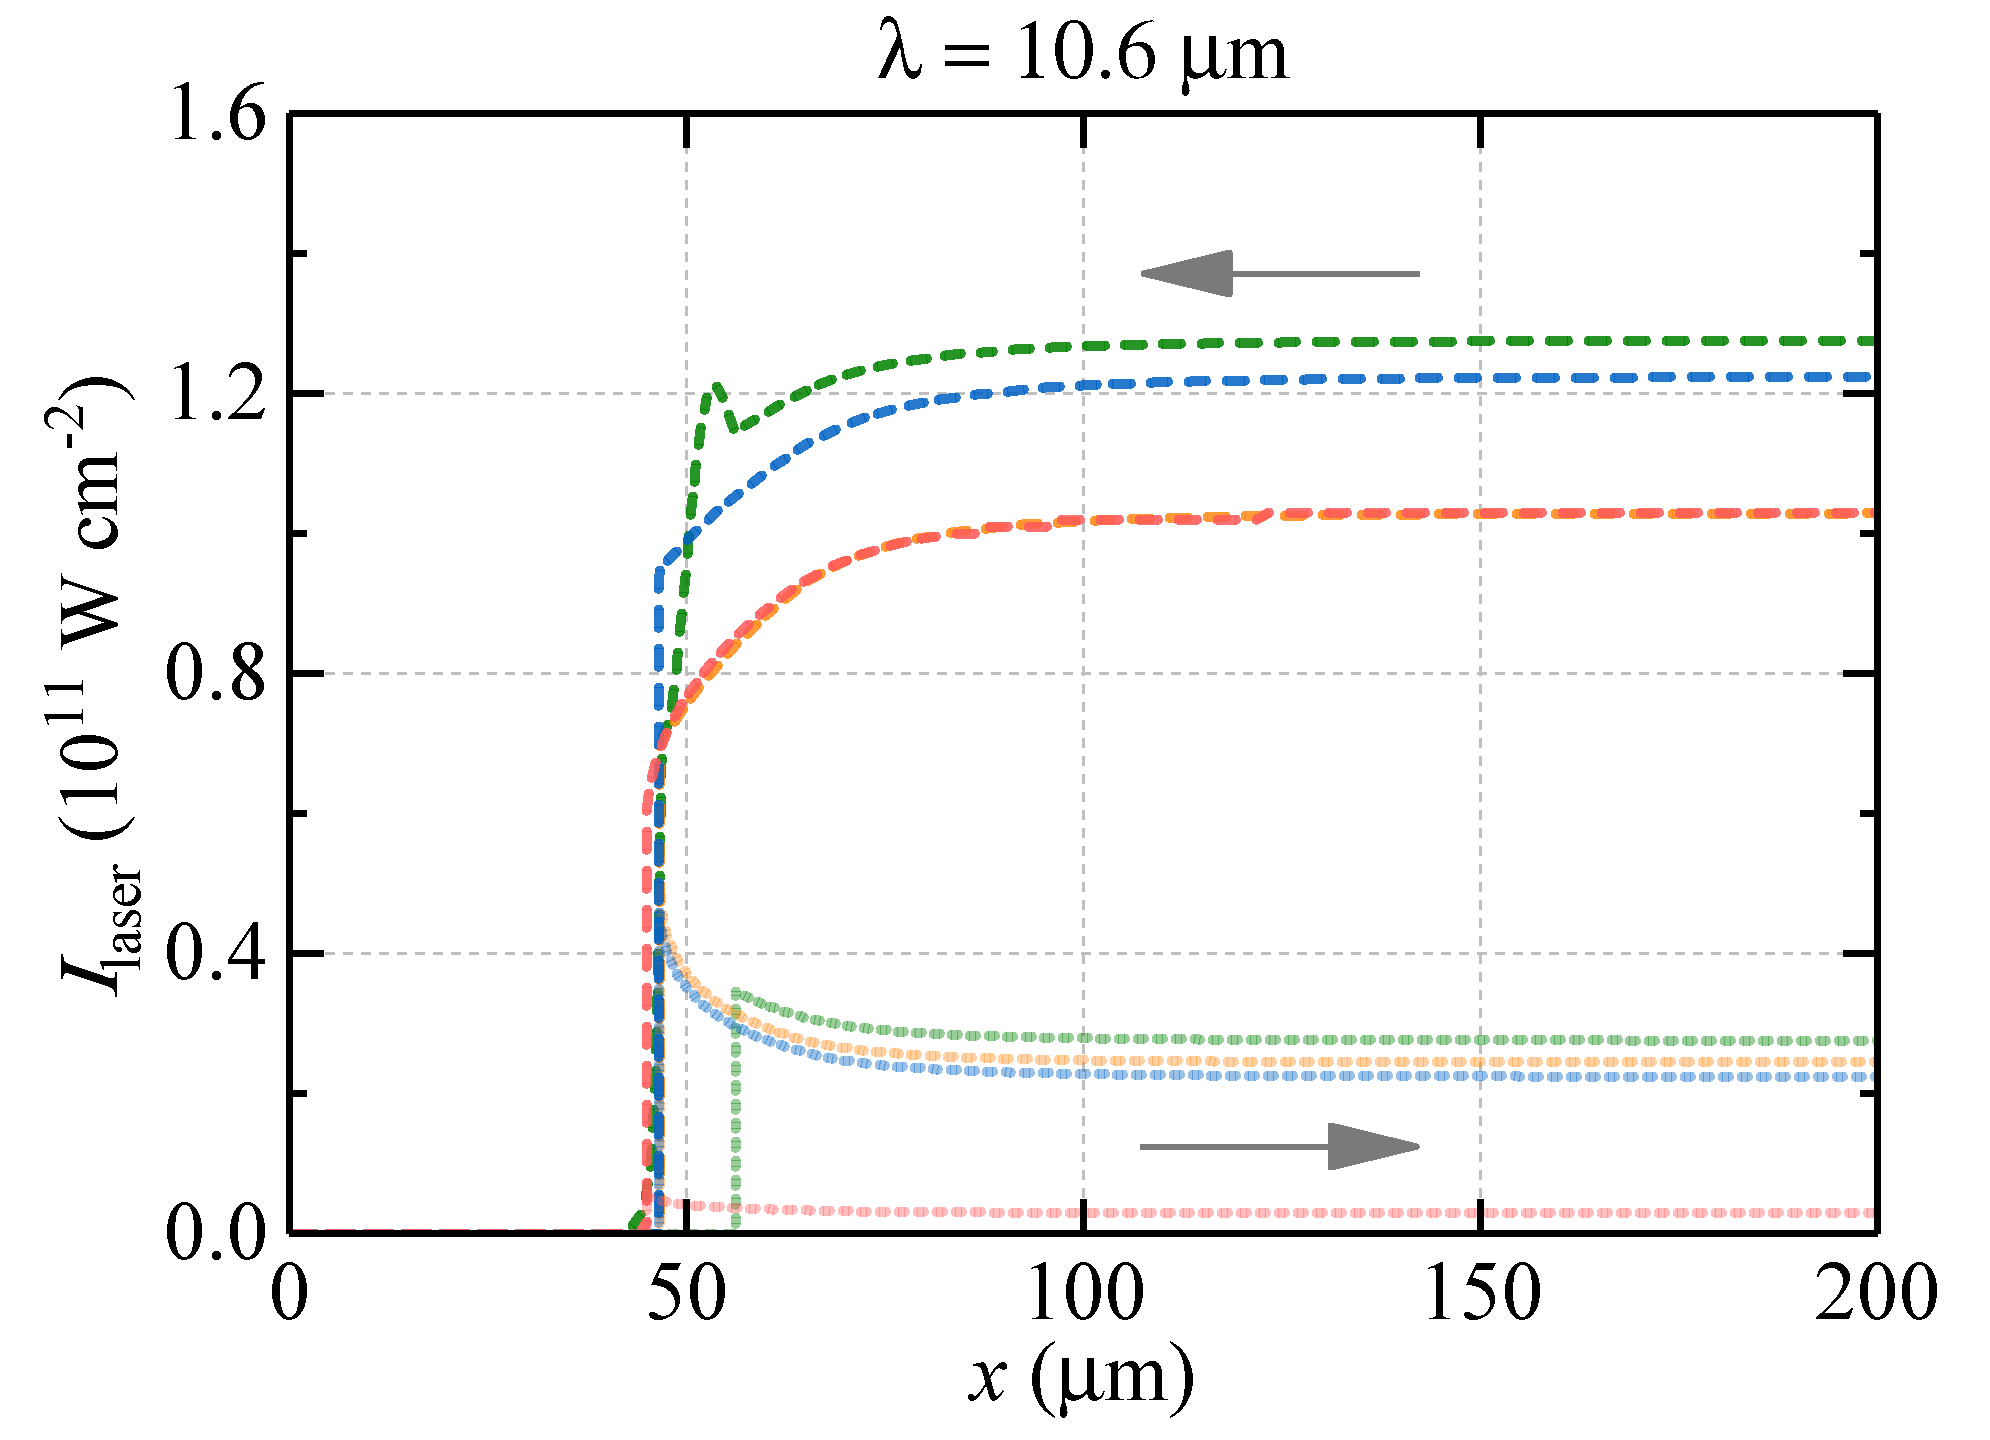
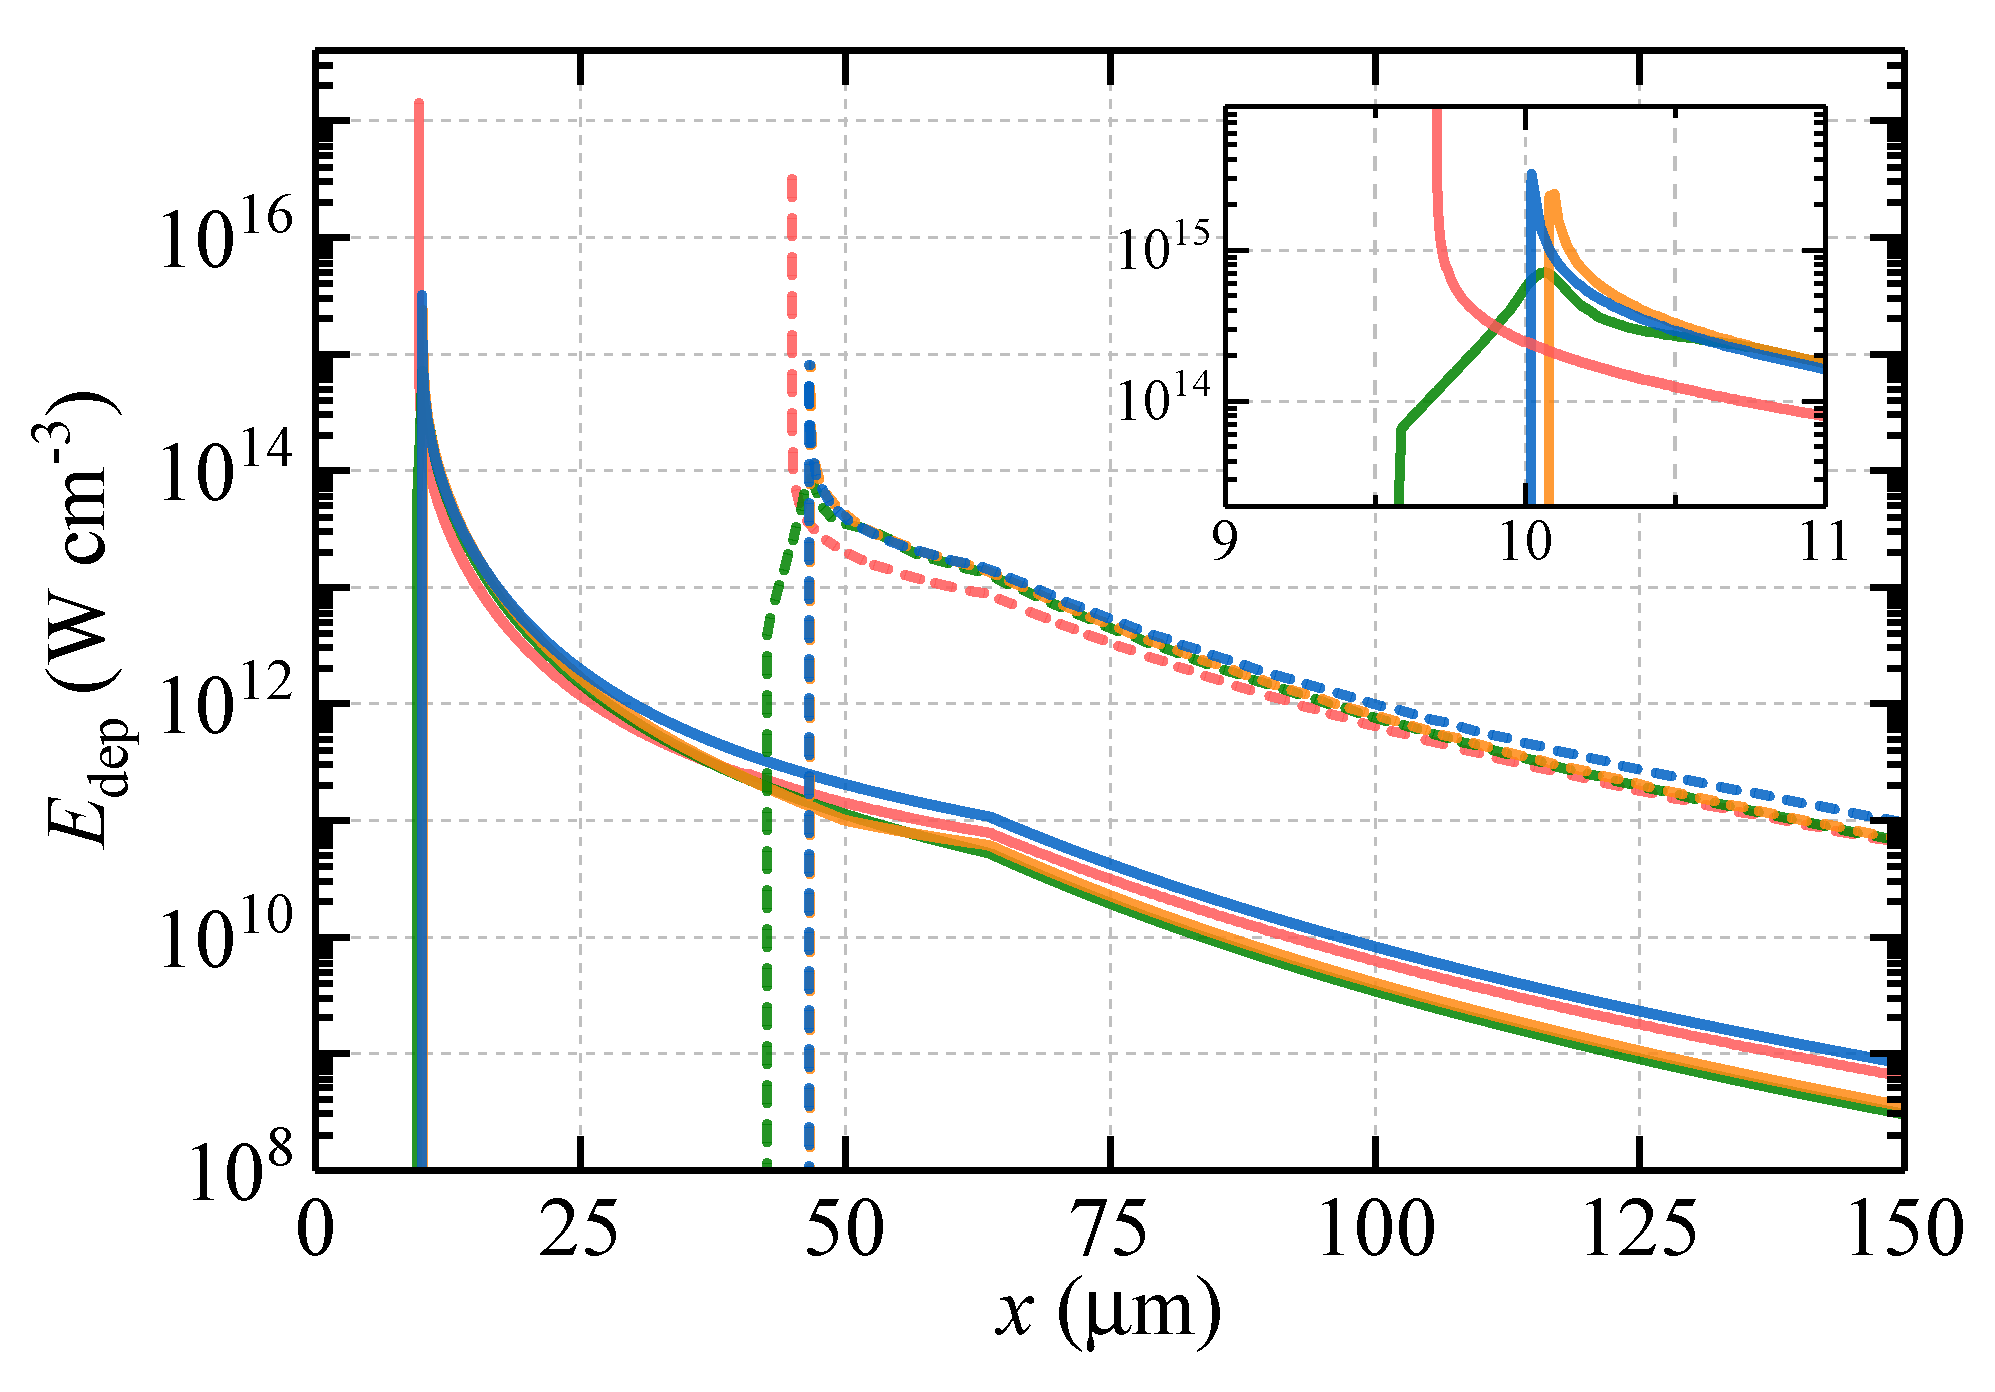
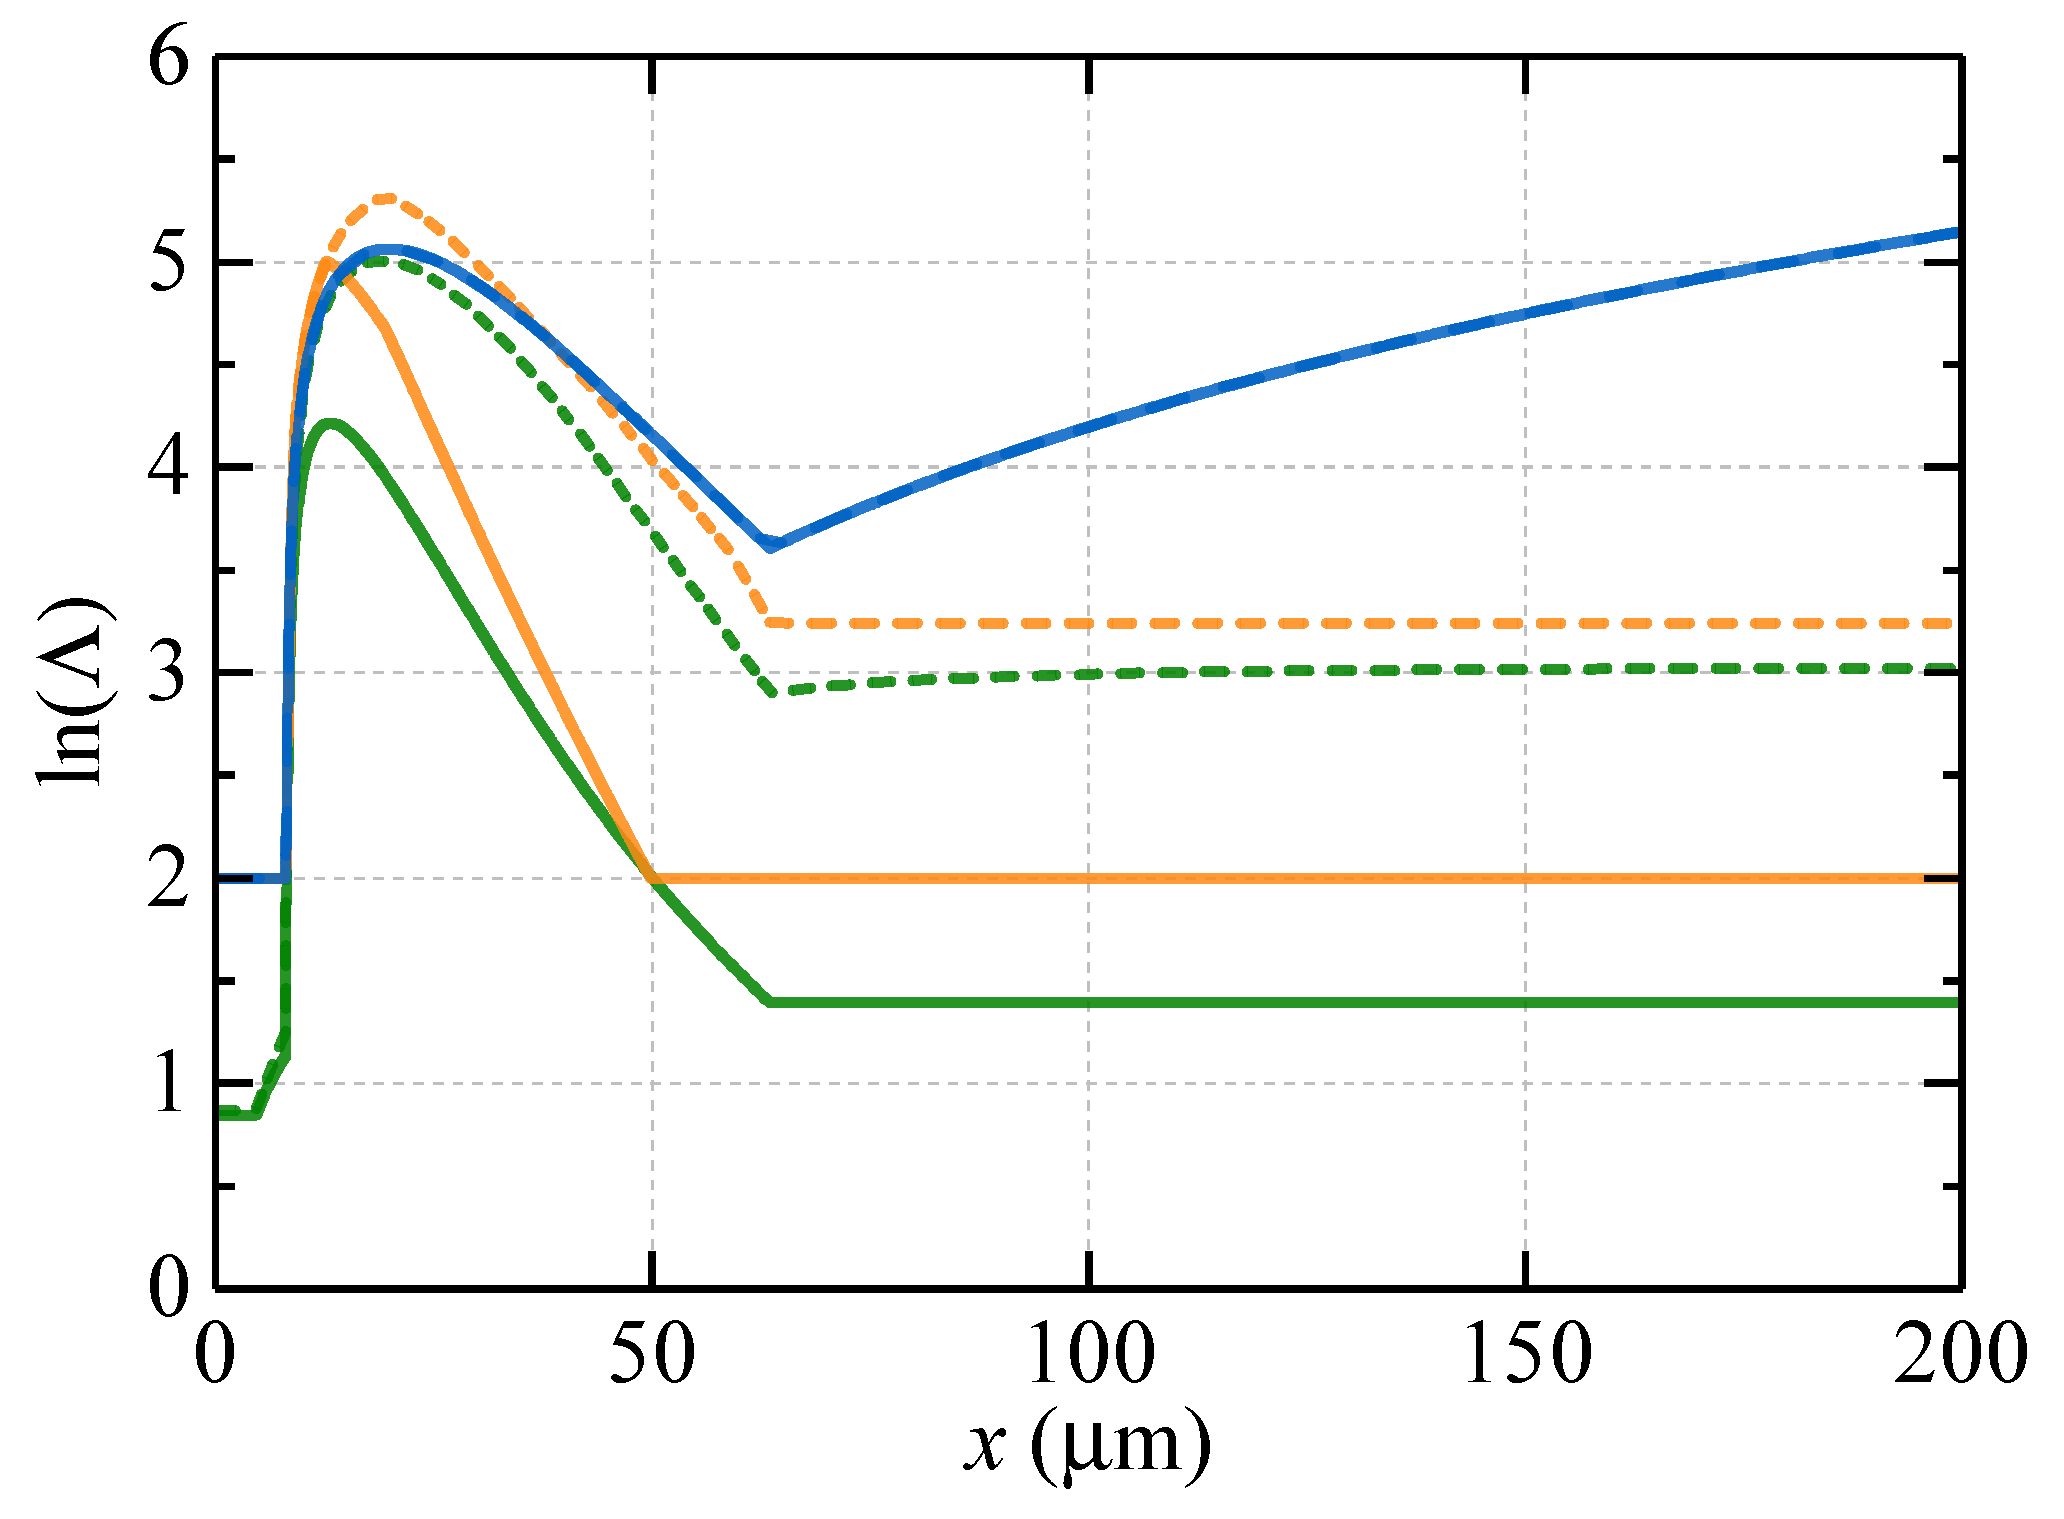
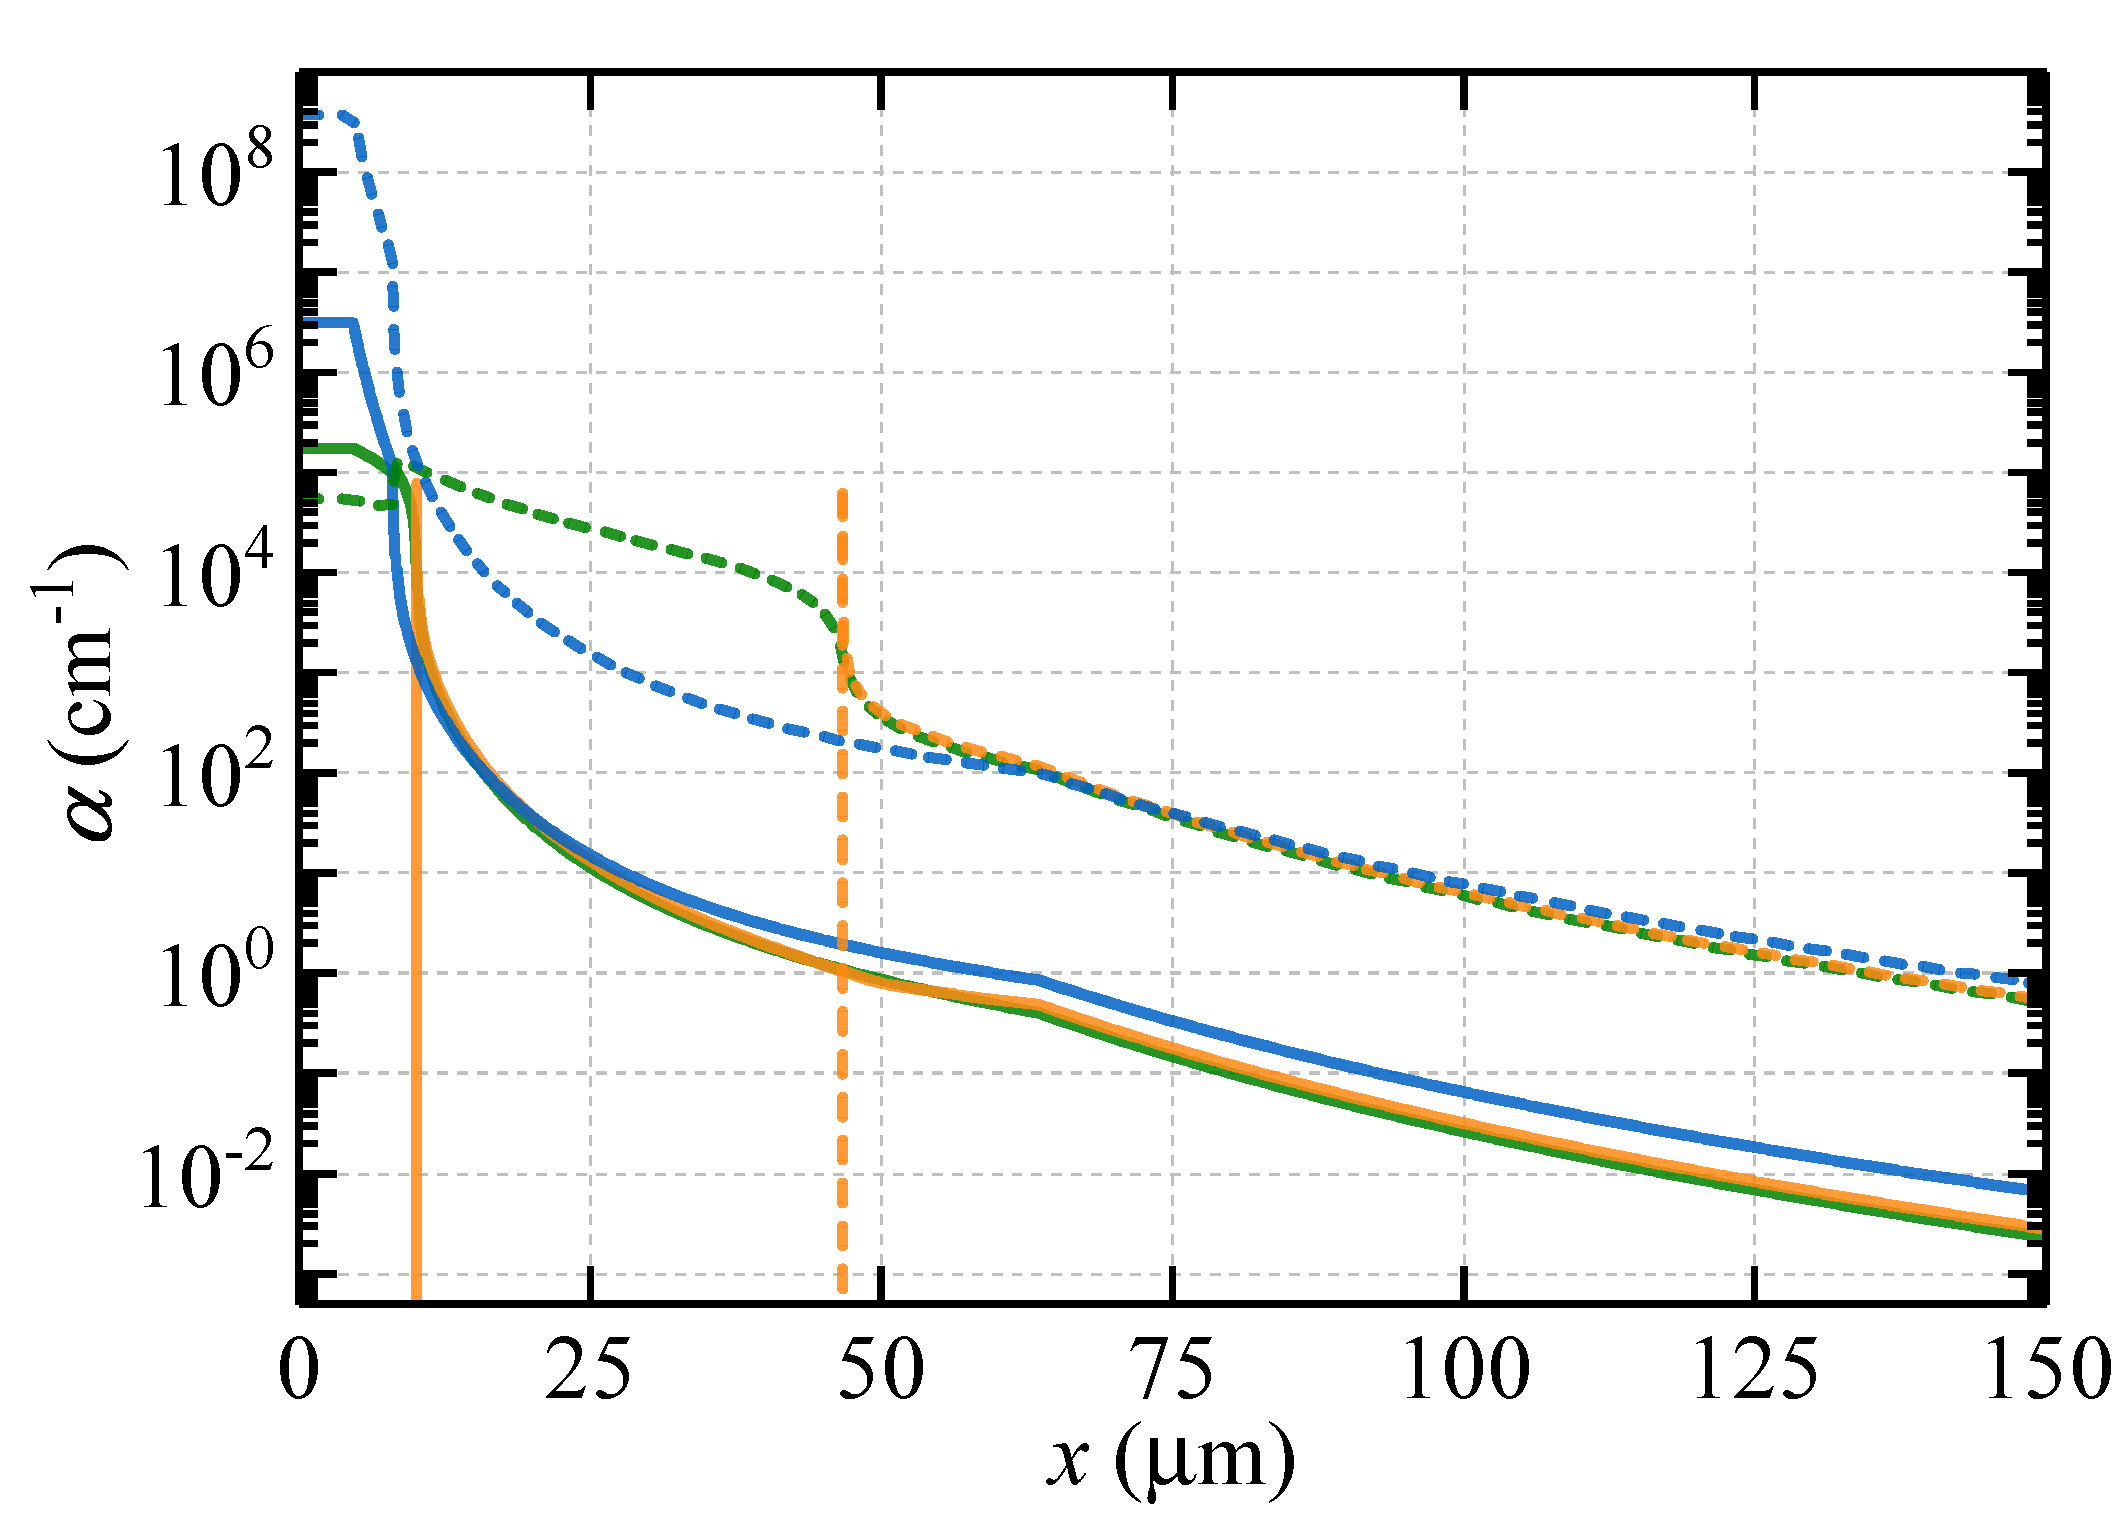
4. Case Study 2: Laser Absorption in a Fully Ionized Hydrogen Plasma
5. Discussion and Outlook
6. Conclusions
Author Contributions
Funding
Data Availability Statement
Acknowledgments
Conflicts of Interest
References
- Lindl, J. Development of the indirect-drive approach to inertial confinement fusion and the target physics basis for ignition and gain. Phys. Plasmas 1995, 2, 3933–4024. [Google Scholar] [CrossRef]
- Kline, J.L.; Batha, S.H.; Benedetti, L.R.; Bennett, D.; Bharkar, S.; Hopkins, L.B.; Biener, J.; Biener, M.M.; Bionta, R.; Bond, E.; et al. Progress of indirect drive inertial confinement fusion in the United States. Nucl. Fusion 2019, 59, 112018. [Google Scholar] [CrossRef]
- Zylstra, A.B.; Hurricane, O.A.; Callahan, D.A.; Kritcher, A.L.; Ralph, J.E.; Robey, H.F.; Ross, J.S.; Young, C.V.; Baker, K.L.; Casey, D.T.; et al. Burning plasma achieved in inertial fusion. Nature 2022, 601, 542. [Google Scholar] [CrossRef]
- Ralchenko, Y. (Ed.) Modern Methods in Collisional-Radiative Modeling of Plasmas; Springer: Cham, Switzerland, 2016; pp. 81–104. [Google Scholar]
- Foord, M.E.; Glenzer, S.H.; Thoe, R.S.; Wong, K.L.; Fournier, K.B.; Wilson, B.G.; Springer, P.T. Ionization Processes and Charge-State Distribution in a Highly Ionized High-Z Laser-Produced Plasma. Phys. Rev. Lett. 2000, 85, 992–995. [Google Scholar] [CrossRef]
- Heeter, R.F.; Hansen, S.B.; Fournier, K.B.; Foord, M.E.; Froula, D.H.; Mackinnon, A.J.; May, M.J.; Schneider, M.B.; Young, B.K.F. Benchmark Measurements of the Ionization Balance of Non-Local-Thermodynamic-Equilibrium Gold Plasmas. Phys. Rev. Lett. 2007, 99, 195001. [Google Scholar] [CrossRef]
- Piron, R.; Gilleron, F.; Aglitskiy, Y.; Chung, H.K.; Fontes, C.; Hansen, S.; Marchuk, O.; Scott, H.; Stambulchik, E.; Ralchenko, Y. Review of the 9th NLTE code comparison workshop. High Energy Density Phys. 2017, 23, 38–47. [Google Scholar] [CrossRef] [PubMed]
- Gaffney, J.A.; Hu, S.X.; Arnault, P.; Becker, A.; Benedict, L.X.; Boehly, T.R.; Celliers, P.M.; Ceperley, D.M.; Čertík, O.; Clérouin, J.; et al. A Review of Equation-of-State Models for Inertial Confinement Fusion Materials. High Energy Density Phys. 2018, 28, 7–24. [Google Scholar] [CrossRef]
- Grabowski, P.E.; Hansen, S.B.; Murillo, M.S.; Stanton, L.G.; Graziani, F.R.; Zylstra, A.B.; Baalrud, S.D.; Arnault, P.; Baczewski, A.D.; Benedict, L.X.; et al. Review of the first charged-particle transport coefficient comparison workshop. High Energy Density Phys. 2020, 37, 100905. [Google Scholar] [CrossRef]
- Bakshi, V. (Ed.) EUV Sources for Lithography; SPIE Press: Washington, DC, USA, 2006. [Google Scholar]
- O’Sullivan, G.; Li, B.; D’Arcy, R.; Dunne, P.; Hayden, P.; Kilbane, D.; McCormack, T.; Ohashi, H.; O’Reilly, F.; Sheridan, P.; et al. Spectroscopy of highly charged ions and its relevance to EUV and soft X-ray source development. J. Phys. B 2015, 48, 144025. [Google Scholar] [CrossRef]
- Versolato, O.O. Physics of laser-driven tin plasma sources of EUV radiation for nanolithography. Plasma Sources Sci. Technol. 2019, 28, 083001. [Google Scholar] [CrossRef]
- Fomenkov, I.; Brandt, D.; Ershov, A.; Schafgans, A.; Tao, Y.; Vaschenko, G.; Rokitski, S.; Kats, M.; Vargas, M.; Purvis, M.; et al. Light sources for high-volume manufacturing EUV lithography: Technology, performance, and power scaling. Adv. Opt. Technol. 2017, 6, 173–186. [Google Scholar] [CrossRef]
- Felix, N.M.; Attwood, D.T. EUV Lithography Perspective: From the beginning to HVM (Conference Presentation). In Proceedings of the Extreme Ultraviolet (EUV) Lithography XI, San Jose, CA, USA, 24–27 February 2020; Volume 11323. [Google Scholar]
- van de Kerkhof, M.A.; Liu, F.; Meeuwissen, M.; Zhang, X.; Bayraktar, M.; de Kruif, R.C.; Davydova, N.V. High-power EUV lithography: Spectral purity and imaging performance. J. Micro Nanolithogr. MEMS MOEMS 2020, 19, 033801. [Google Scholar] [CrossRef]
- Bajt, S.; Alameda, J.B.; Barbee, T.W., Jr.; Clift, W.M.; Folta, J.A.; Kaufmann, B.; Spiller, E.A. Improved reflectance and stability of Mo-Si multilayers. Opt. Eng. 2002, 41, 1797–1804. [Google Scholar] [CrossRef]
- White, J.; Hayden, P.; Dunne, P.; Cummings, A.; Murphy, N.; Sheridan, P.; O’Sullivan, G. Simplified modeling of 13.5 nm unresolved transition array emission of a Sn plasma and comparison with experiment. J. Appl. Phys. 2005, 98, 113301. [Google Scholar] [CrossRef]
- Poirier, M.; Blenski, T.; de Gaufridy de Dortan, F.; Gilleron, F. Modeling of EUV emission from xenon and tin plasma sources for nanolithography. J. Quant. Spectrosc. Radiat. Transfer 2006, 99, 482–492. [Google Scholar] [CrossRef]
- Novikov, V.G.; Ivanov, V.V.; Koshelev, K.N.; Krivtsun, V.M.; Solomyannaya, A.D. Calculation of tin emission spectra in discharge plasma: The influence of reabsorption in spectral lines. High Energy Density Phys. 2007, 3, 198–203. [Google Scholar] [CrossRef]
- Koike, F.; Fritzsche, S. Relativistic calculations for highly correlated atomic and highly charged ionic systems. Radiat. Phys. Chem. 2007, 76, 404–411. [Google Scholar] [CrossRef]
- Sasaki, A.; Sunahara, A.; Nishihara, K.; Nishikawa, T.; Fujima, K.; Kagawa, T.; Koike, F.; Tanuma, H. Atomic modeling of the plasma EUV sources. High Energy Density Phys. 2007, 3, 250–255. [Google Scholar] [CrossRef]
- Sasaki, A.; Sunahara, A.; Furukawa, H.; Nishihara, K.; Fujioka, S.; Nishikawa, T.; Koike, F.; Ohashi, H.; Tanuma, H. Modeling of radiative properties of Sn plasmas for extreme-ultraviolet source. J. Appl. Phys. 2010, 107, 113303. [Google Scholar] [CrossRef]
- Torretti, F.; Sheil, J.; Schupp, R.; Basko, M.M.; Bayraktar, M.; Meijer, R.A.; Witte, S.; Ubachs, W.; Hoekstra, R.; Versolato, O.O.; et al. Prominent radiative contributions from multiply-excited states in laser-produced tin plasma for nanolithography. Nat. Commun. 2020, 11, 2334. [Google Scholar] [CrossRef]
- MacFarlane, J.J.; Rettig, C.L.; Wang, P.; Golovkin, I.E.; Woodruff, P.R. Radiation-hydrodynamics, spectral, and atomic physics modeling of laser-produced plasma EUVL light sources. In Proceedings of the Emerging Lithographic Technologies IX, San Jose, CA, USA, 1–3 March 2005; Volume 5751, pp. 588–600. [Google Scholar]
- White, J.; O’Sullivan, G.; Zakharov, S.; Choi, P.; Zakharov, V.; Nishimura, H.; Fujioka, S.; Nishihara, K. Tin laser-produced plasma source modeling at 13.5 nm for extreme ultraviolet lithography. Appl. Phys. Lett. 2008, 92, 151501. [Google Scholar] [CrossRef]
- Nishihara, K.; Sunahara, A.; Sasaki, A.; Nunami, M.; Tanuma, H.; Fujioka, S.; Shimada, Y.; Fujima, K.; Furukawa, H.; Kato, T.; et al. Plasma physics and radiation hydrodynamics in developing an extreme ultraviolet light source for lithography. Phys. Plasmas 2008, 15, 056708. [Google Scholar] [CrossRef]
- Basko, M.M.; Novikov, V.G.; Grushin, A.S. On the structure of quasi-stationary laser ablation fronts in strongly radiating plasmas. Phys. Plasmas 2015, 22, 053111. [Google Scholar] [CrossRef]
- Basko, M. On the maximum conversion efficiency into the 13.5-nm extreme ultraviolet emission under a steady-state laser ablation of tin microspheres. Phys. Plasmas 2016, 23, 083114. [Google Scholar] [CrossRef]
- Su, M.; Min, Q.; Cao, S.; Sun, D.; Hayden, P.; O’Sullivan, G.; Dong, C. Evolution analysis of EUV radiation from laser-produced tin plasmas based on a radiation hydrodynamics model. Sci. Rep. 2017, 7, 45212. [Google Scholar] [CrossRef] [PubMed]
- Hemminga, D.J.; Poirier, L.; Basko, M.M.; Hoekstra, R.; Ubachs, W.; Versolato, O.O.; Sheil, J. High-energy ions from Nd:YAG laser ablation of tin microdroplets: Comparison between experiment and a single-fluid hydrodynamic model. Plasma Sources Sci. Technol. 2021, 30, 105006. [Google Scholar] [CrossRef]
- Cummings, A.; O’Sullivan, G.; Dunne, P.; Sokell, E.; Murphy, N.; White, J. Conversion efficiency of a laser-produced Sn plasma at 13.5nm, simulated with a one-dimensional hydrodynamic model and treated as a multi-component blackbody. J. Phys. D Appl. Phys. 2005, 38, 604–616. [Google Scholar] [CrossRef]
- Sizyuk, V.; Hassanein, A.; Sizyuk, T. Three-dimensional simulation of laser-produced plasma for extreme ultraviolet lithography applications. J. Appl. Phys. 2006, 100, 103106. [Google Scholar] [CrossRef]
- Sunahara, A.; Sasaki, A.; Nishihara, K. Two dimensional radiation hydrodynamic simulation for extreme ultra-violet emission from laser-produced tin plasmas. J. Physics Conf. Ser. 2008, 112, 042048. [Google Scholar] [CrossRef]
- Purvis, M.A.; Schafgans, A.; Brown, D.J.W.; Fomenkov, I.; Rafac, R.; Brown, J.; Tao, Y.; Rokitski, S.; Abraham, M.; Vargas, M.; et al. Advancements in predictive plasma formation modeling. In Proceedings of the Extreme Ultraviolet (EUV) Lithography VII, Bellingham, WA, USA, 18 March 2016; Volume 9776, pp. 159–170. [Google Scholar]
- Hassanein, A.; Sizyuk, T. Laser produced plasma sources for nanolithography—Recent integrated simulation and benchmarking. Phys. Plasmas 2013, 20, 053105. [Google Scholar] [CrossRef]
- Masnavi, M.; Parchamy, H. Calculation of the extreme-ultraviolet radiation conversion efficiency for a laser-produced tin plasma source. Phys. Open 2019, 1, 100003. [Google Scholar] [CrossRef]
- Mayer, P.; Brandt, D.C.; Fomenkov, I.; Purvis, M.; Brown, D. Laser produced plasma EUV sources for N5 HVM and beyond: Performance, availability and technology innovation. In Proceedings of the Extreme Ultraviolet (EUV) Lithography XII, Online Event, 22–25 February 2021; Volume 11609. [Google Scholar]
- Sizyuk, T.; Hassanein, A. Tuning laser wavelength and pulse duration to improve the conversion efficiency and performance of EUV sources for nanolithography. Phys. Plasmas 2020, 27, 103507. [Google Scholar] [CrossRef]
- Behnke, L.; Schupp, R.; Bouza, Z.; Bayraktar, M.; Mazzotta, Z.; Meijer, R.; Sheil, J.; Witte, S.; Ubachs, W.; Hoekstra, R.; et al. Extreme ultraviolet light from a tin plasma driven by a 2-µm-wavelength laser. Opt. Express 2021, 29, 4475–4487. [Google Scholar] [CrossRef]
- Tamer, I.; Reagan, B.A.; Galvin, T.; Galbraith, J.; Sistrunk, E.; Church, A.; Huete, G.; Neurath, H.; Spinka, T. Demonstration of a compact, multi-joule, diode-pumped Tm:YLF laser. Opt. Lett. 2021, 46, 5096–5099. [Google Scholar] [CrossRef]
- Yuan, Y.; Ma, Y.Y.; Wang, W.P.; Chen, S.J.; Cui, Y.; Zi, M.; Yang, X.H.; Zhang, G.B.; Leng, Y.X. Enhancing the conversion efficiency of extreme ultraviolet light sources using a 2 μm wavelength laser. Plasma Phys. Control. Fusion 2021, 64, 025001. [Google Scholar] [CrossRef]
- Hemminga, D.J.; Versolato, O.O.; Sheil, J. Simulations of plasmas driven by laser wavelengths in the 1.064— 10.6 µm range for their characterization as future extreme ultraviolet light sources. Phys. Plasmas 2023, 30, 033301. [Google Scholar] [CrossRef]
- Schupp, R.; Torretti, F.; Meijer, R.; Bayraktar, M.; Scheers, J.; Kurilovich, D.; Bayerle, A.; Eikema, K.; Witte, S.; Ubachs, W.; et al. Efficient Generation of Extreme Ultraviolet Light From Nd:YAG-Driven Microdroplet-Tin Plasma. Phys. Rev. Appl. 2019, 12, 014010. [Google Scholar] [CrossRef]
- Lee, R.W.; Nash, J.; Ralchenko, Y. Review of the NLTE kinetics code workshop. J. Quant. Spectrosc. Radiat. Transf. 1997, 58, 737–742. [Google Scholar] [CrossRef]
- Rubiano, J.; Florido, R.; Bowen, C.; Lee, R.; Ralchenko, Y. Review of the 4th NLTE Code Comparison Workshop. High Energy Density Phys. 2007, 3, 225–232. [Google Scholar] [CrossRef]
- Fontes, C.; Abdallah, J.; Bowen, C.; Lee, R.; Ralchenko, Y. Review of the NLTE-5 kinetics workshop. High Energy Density Phys. 2009, 5, 15–22. [Google Scholar] [CrossRef]
- Available online: https://euvlitho.com/code-comparison/code-comparison-2020/ (accessed on 9 October 2023).
- Hansen, S.; Chung, H.K.; Fontes, C.; Ralchenko, Y.; Scott, H.; Stambulchik, E. Review of the 10th Non-LTE code comparison workshop. High Energy Density Phys. 2020, 35, 100693. [Google Scholar] [CrossRef]
- Sasaki, A.; Murakami, I. Validation of Collisional Radiative Model of High-Z Multiple Charged Ions at NLTE Code Comparison Workshops. Plasma Fusion Res. 2013, 8, 2401021. [Google Scholar] [CrossRef]
- Magee, N.H.; Abdallah, J.; Colgan, J.; Hakel, P.; Kilcrease, D.P.; Mazevet, S.; Sherrill, M.; Fontes, C.J.; Zhang, H. Los Alamos opacities: Transition from LEDCOP to ATOMIC. AIP Conf. Proc. 2004, 730, 168–179. [Google Scholar]
- Hakel, P.; Sherrill, M.E.; Mazevet, S.; Abdallah, J., Jr.; Colgan, J.; Kilcrease, D.P.; Magee, N.H.; Fontes, C.J.; Zhang, H.L. The new Los Alamos opacity code ATOMIC. J. Quant. Spectrosc. Radiat. Transf. 2006, 99, 265–271. [Google Scholar] [CrossRef]
- Nikiforov, A.F.; Novikov, V.G.; Uvarov, V.B. Quantum-Statistical Models of Hot Dense Matter: Methods for Computation Opacity and Equation of State; Birkhäuser: Basel, Switzerland, 2006; Volume 37. [Google Scholar]
- Vichev, I.; Solomyannaya, A.; Grushin, A.; Kim, D. On certain aspects of the THERMOS toolkit for modeling experiments. High Energy Density Phys. 2019, 33, 100713. [Google Scholar] [CrossRef]
- MacFarlane, J.J.; Golovkin, I.E.; Woodruff, P.R.; Welch, D.R.; Oliver, B.V.; Mehlhorn, T.A.; Campbell, R.B. Simulation of the ionization dynamics of aluminium irradiated by intense short-pulse lasers. Inert. Fus. Sci. Appl. 2003, 457. [Google Scholar]
- Scott, H.A. Cretin—A radiative transfer capability for laboratory plasmas. J. Quant. Spectrosc. Radiat. Transf. 2001, 71, 689–701. [Google Scholar] [CrossRef]
- Frank, Y.; Louzon, E.; Mandelbaum, P.; Henis, Z. SEMILLAC: A new hybrid atomic model of hot dense plasmas. High Energy Density Phys. 2013, 9, 594–600. [Google Scholar] [CrossRef]
- Frank, Y.; Mandelbaum, P.; Henis, Z. SEMILLAC II: A new model for spectral behavior of hot plasmas. High Energy Density Phys. 2014, 12, 27–34. [Google Scholar] [CrossRef]
- Sunahara, A.; Johzaki, T.; Nagatomo, H.; Mima, K. Generation of pre-formed plasma and its reduction for fast-ignition. Laser Part. Beams 2012, 30, 95–102. [Google Scholar] [CrossRef]
- Sunahara, A. Development of Radiation Hydrodynamic code STAR for EUV plasmas. In Proceedings of the EUV Source Workshop, Dublin, Ireland, 3–7 November 2013. [Google Scholar]
- Basko, M.M.; Maruhn, J.A.; Tauschwitz, A. Development of a 2D radiation-hydrodynamics code RALEF for laser plasma simulations. GSI Rep. 2010, 1, 410. [Google Scholar]
- Basko, M.M.; Sasorov, P.V.; Murakami, M.; Novikov, V.G.; Grushin, A.S. One-dimensional study of the radiation-dominated implosion of a cylindrical tungsten plasma column. Plasma Phys. Control. Fusion 2012, 54, 055003. [Google Scholar] [CrossRef]
- MacFarlane, J.J.; Golovkin, I.E.; Woodruff, P.R. HELIOS-CR—A 1-D radiation-magnetohydrodynamics code with inline atomic kinetics modeling. J. Quant. Spectrosc. Radiat. Transf. 2006, 99, 381–397. [Google Scholar] [CrossRef]
- Torretti, F.; Liu, F.; Bayraktar, M.; Scheers, J.; Bouza, Z.; Ubachs, W.; Hoekstra, R.; Versolato, O. Spectral characterization of an industrial EUV light source for nanolithography. J. Phys. D Appl. Phys. 2019, 53, 055204. [Google Scholar] [CrossRef]
- Chung, H.K.; Bowen, C.; Fontes, C.; Hansen, S.; Ralchenko, Y. Comparison and analysis of collisional-radiative models at the NLTE-7 workshop. High Energy Density Phys. 2013, 9, 645–652. [Google Scholar] [CrossRef]
- Hansen, S. Balancing Detail and Completeness in Collisional-Radiative models. In Modern Methods in Collisional-Radiative Modeling of Plasmas; Ralchenko, Y., Ed.; Springer: Cham, Switzerland, 2016; pp. 1–15. [Google Scholar]
- de Gaufridy de Dortan, F. Influence of configuration interaction on satellite lines of xenon and tin in the EUV region. J. Phys. B 2007, 40, 599–615. [Google Scholar] [CrossRef]
- D’Arcy, R.; Ohashi, H.; Suda, S.; Tanuma, H.; Fujioka, S.; Nishimura, H.; Nishihara, K.; Suzuki, C.; Kato, T.; Koike, F.; et al. Transitions and the effects of configuration interaction in the spectra of Sn XV–Sn XVIII. Phys. Rev. A 2009, 79, 042509. [Google Scholar] [CrossRef]
- Ohashi, H.; Suda, S.; Tanuma, H.; Fujioka, S.; Nishimura, H.; Sasaki, A.; Nishihara, K. EUV emission spectra in collisions of multiply charged Sn ions with He and Xe. J. Phys. B At. Mol. Opt. Phys. 2010, 43, 065204. [Google Scholar] [CrossRef]
- D’Arcy, R.; Morris, O.; Ohashi, H.; Suda, S.; Tanuma, H.; Fujioka, S.; Nishimura, H.; Nishihara, K.; Suzuki, C.; Kato, T.; et al. Configuration interaction in charge exchange spectra of tin and xenon. Phys. Scr. 2011, T144, 014026. [Google Scholar] [CrossRef]
- Scheers, J.; Shah, C.; Ryabtsev, A.; Bekker, H.; Torretti, F.; Sheil, J.; Czapski, D.A.; Berengut, J.C.; Ubachs, W.; López-Urrutia, J.R.C.; et al. EUV spectroscopy of highly charged Sn13+-Sn15+ ions in an electron-beam ion trap. Phys. Rev. A 2020, 101, 062511. [Google Scholar] [CrossRef]
- Bouza, Z.; Scheers, J.; Ryabtsev, A.; Schupp, R.; Behnke, L.; Shah, C.; Sheil, J.; Bayraktar, M.; López-Urrutia, J.R.C.; Ubachs, W.; et al. EUV spectroscopy of Sn5+- Sn10+ ions in an electron beam ion trap and laser-produced plasmas. J. Phys. B At. Mol. Opt. Phys. 2020, 53, 195001. [Google Scholar] [CrossRef]
- Windberger, A.; Torretti, F.; Borschevsky, A.; Ryabtsev, A.; Dobrodey, S.; Bekker, H.; Eliav, E.; Kaldor, U.; Ubachs, W.; Hoekstra, R.; et al. Analysis of the fine structure of Sn11+-Sn14+ ions by optical spectroscopy in an electron-beam ion trap. Phys. Rev. A 2016, 94, 012506. [Google Scholar] [CrossRef]
- Filin, D.; Savukov, I.; Colgan, J. Relativistic Configuration-Interaction and Perturbation Theory Calculations of the Sn XV Emission Spectrum. Atoms 2021, 9, 96. [Google Scholar] [CrossRef]
- Sasaki, A.; Nishihara, K.; Murakami, M.; Koike, F.; Kagawa, T.; Nishikawa, T.; Fujima, K.; Kawamura, T.; Furukawa, H. Effect of the satellite lines and opacity on the extreme ultraviolet emission from high-density Xe plasmas. Appl. Phys. Lett. 2004, 85, 5857–5859. [Google Scholar] [CrossRef]
- Sheil, J.; Versolato, O.O.; Neukirch, A.J.; Colgan, J. Multiply-excited states and their contribution to opacity in CO2 laser-driven tin-plasma conditions. J. Phys. B At. Mol. Opt. Phys. 2021, 54, 035002. [Google Scholar] [CrossRef]
- Lee, Y.T.; More, R.M. An electron conductivity model for dense plasmas. Phys. Fluids 1984, 27, 1273–1286. [Google Scholar] [CrossRef]
- Skupsky, S. “Coulomb logarithm” for inverse-bremsstrahlung laser absorption. Phys. Rev. A 1987, 36, 5701–5712. [Google Scholar] [CrossRef]
- Scott, H.; Langer, S.; Frank, Y. Radiation-Hydrodynamics Modeling of LPP EUV Sources. In Photon Sources for Lithography and Metrology; Bakshi, V., Ed.; SPIE Press: Washington, DC, USA, 2023; pp. 71–110. [Google Scholar]


| Code | Contributors | Institution (Country) |
|---|---|---|
| Case study 1: Atomic kinetics | ||
| JATOM [49] | A. Sasaki, K. Nishihara, A. Sunahara | KPSI, ILE, CMUXE (Japan, USA) |
| ATOMIC [50,51] | J. Colgan | LANL (USA) |
| THERMOS [52,53] | I. Yu. Vichev, A. D. Solomyannaya, A. S. Grushin, D. A. Kim | KIAM (Russia) |
| PrismSPECT [54] | I. E. Golovkin | Prism Comp. (USA) |
| Cretin [55] | H. A. Scott | LLNL (USA) |
| SEMILLAC [56,57] | Y. Frank | L2X, LLNL (Israel, USA) |
| Case study 2: Laser absorption | ||
| STAR2D [58,59] | A. Sunahara, K. Nishihara, A. Sasaki | CMUXE, ILE, KPSI (USA, Japan) |
| RALEF-2D [60,61] | M. M. Basko | KIAM (Russia) |
| HELIOS [62] | I. E. Golovkin | Prism Comp. (USA) |
| Cretin [55] | H. A. Scott | LLNL (USA) |
Disclaimer/Publisher’s Note: The statements, opinions and data contained in all publications are solely those of the individual author(s) and contributor(s) and not of MDPI and/or the editor(s). MDPI and/or the editor(s) disclaim responsibility for any injury to people or property resulting from any ideas, methods, instructions or products referred to in the content. |
© 2023 by the authors. Licensee MDPI, Basel, Switzerland. This article is an open access article distributed under the terms and conditions of the Creative Commons Attribution (CC BY) license (https://creativecommons.org/licenses/by/4.0/).
Share and Cite
Sheil, J.; Versolato, O.; Bakshi, V.; Scott, H. Review of the 1st EUV Light Sources Code Comparison Workshop. Atoms 2023, 11, 130. https://doi.org/10.3390/atoms11100130
Sheil J, Versolato O, Bakshi V, Scott H. Review of the 1st EUV Light Sources Code Comparison Workshop. Atoms. 2023; 11(10):130. https://doi.org/10.3390/atoms11100130
Chicago/Turabian StyleSheil, John, Oscar Versolato, Vivek Bakshi, and Howard Scott. 2023. "Review of the 1st EUV Light Sources Code Comparison Workshop" Atoms 11, no. 10: 130. https://doi.org/10.3390/atoms11100130