
Generation of Highly Charged Au Ion in Laser-Produced Plasma for Water Window X-ray Radiation Sources
 , , and
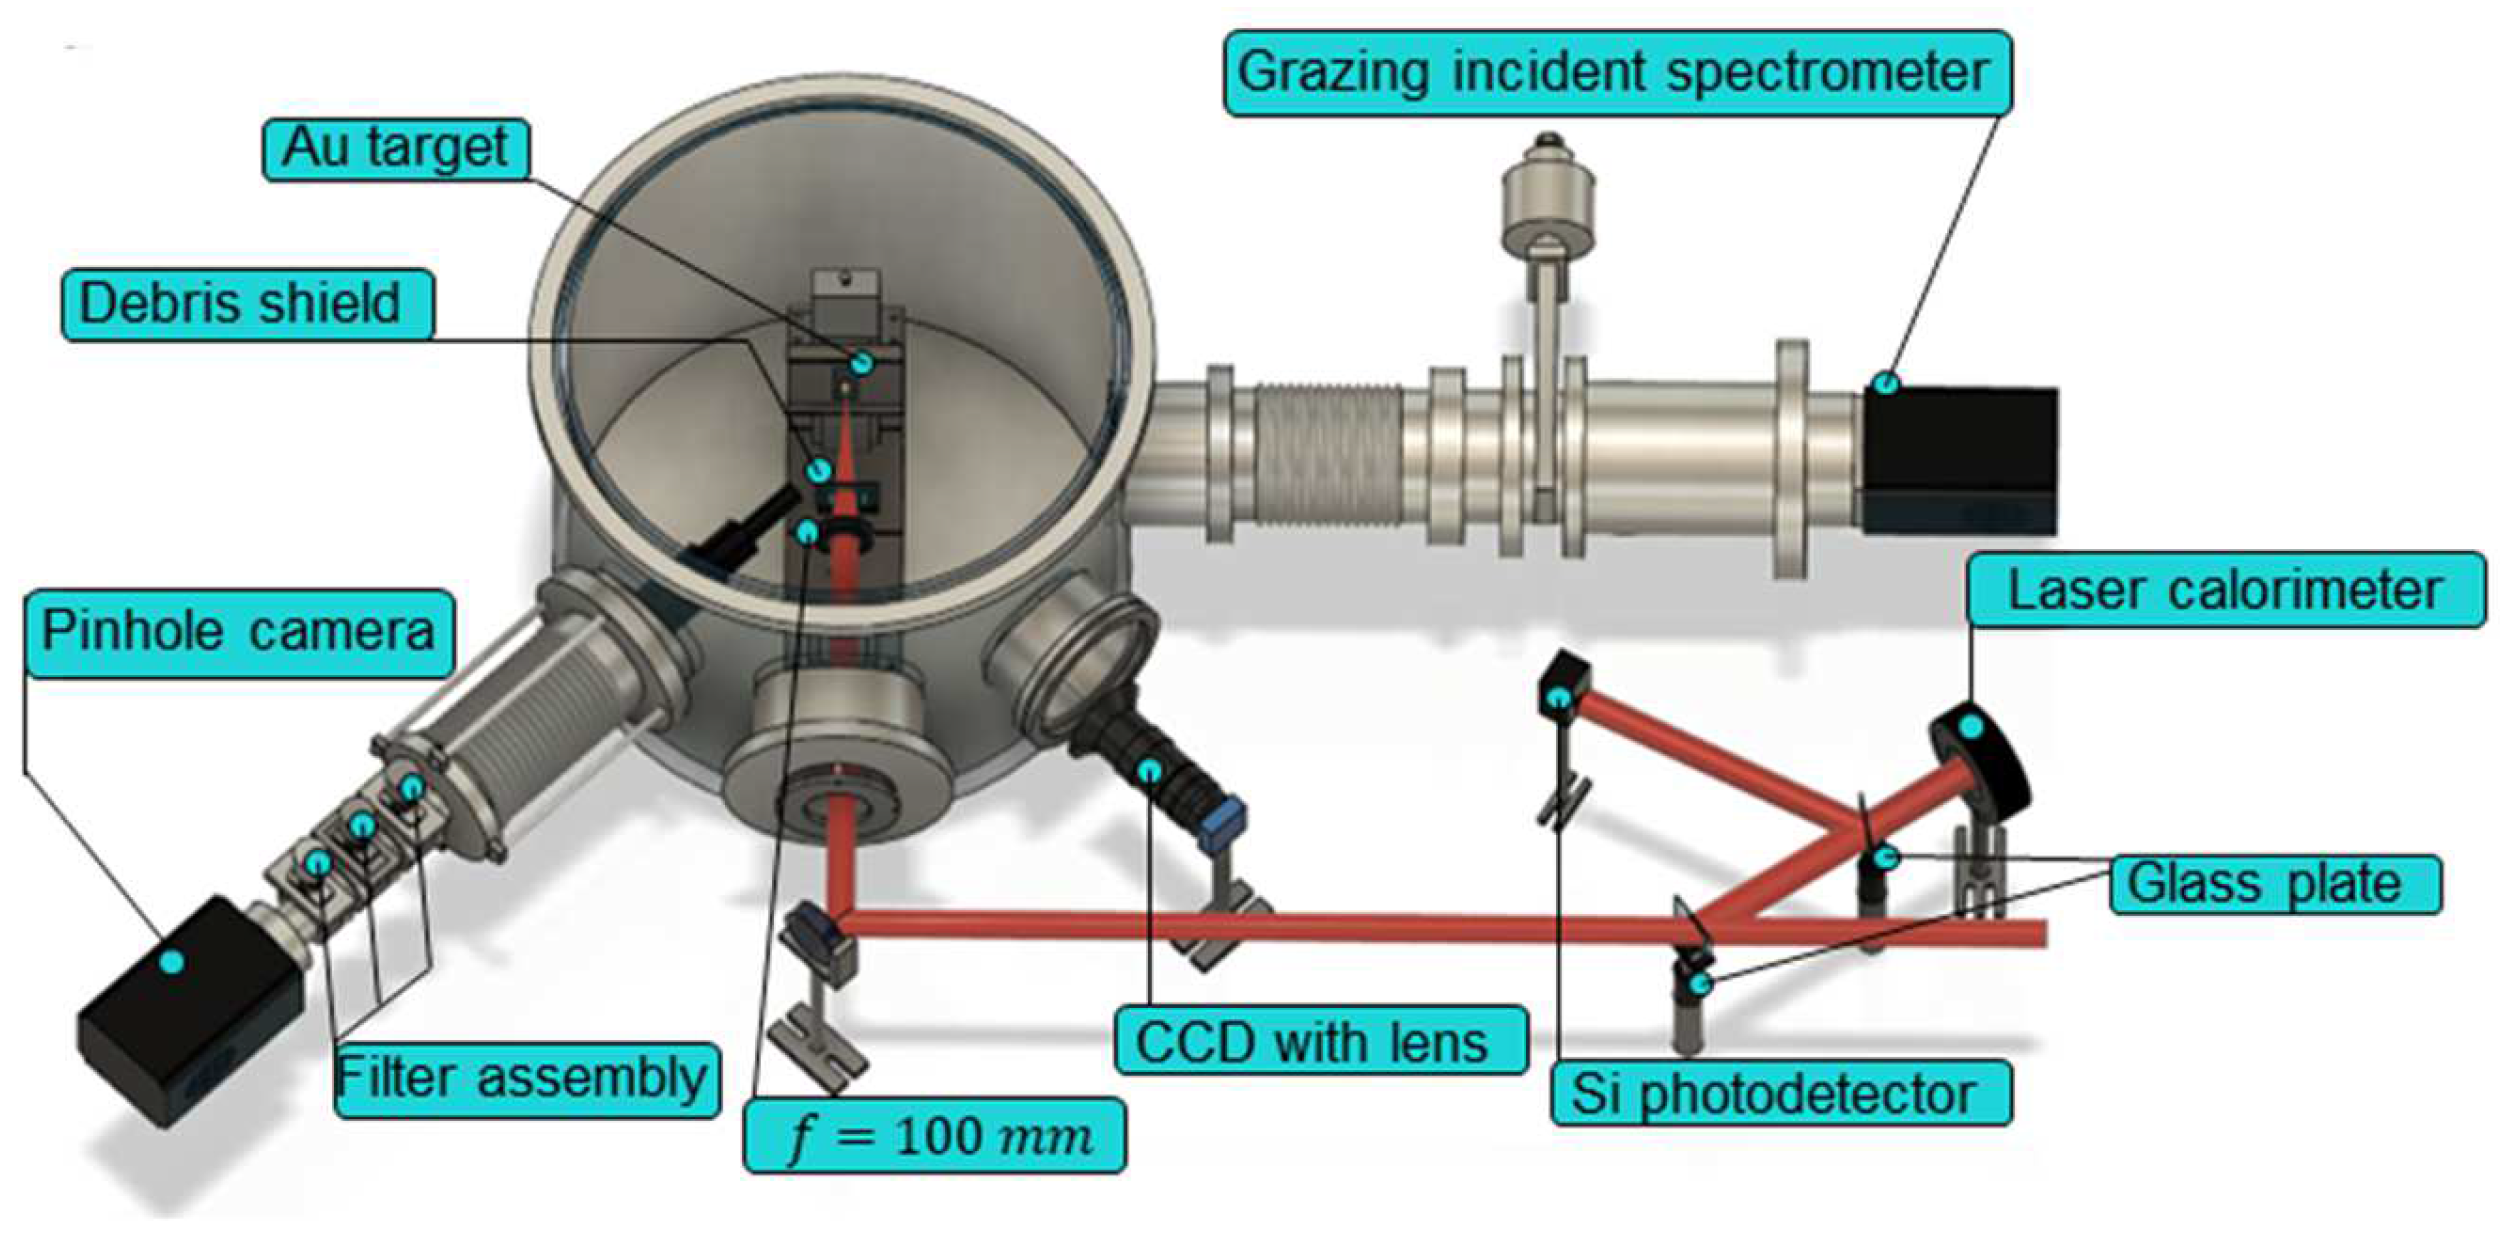
Abstract
:1. Introduction
2. Experimental Setup
3. Results and Discussions
4. Conclusions
Author Contributions
Funding
Institutional Review Board Statement
Informed Consent Statement
Data Availability Statement
Acknowledgments
Conflicts of Interest
References
- Gillaspy, J.D. Highly Charged Ions. J. Phys. B At. Mol. Opt. Phys. 2001, 34, R93. [Google Scholar] [CrossRef]
- Kozlov, M.G.; Safronova, M.S.; Crespo López-Urrutia, J.R.; Schmidt, P.O. Highly Charged Ions: Optical Clocks and Applications in Fundamental Physics. Rev. Mod. Phys. 2018, 90, 045005. [Google Scholar] [CrossRef] [Green Version]
- Gammino, S. Production of High-Intensity, Highly Charged Ions. arXiv 2014, arXiv:1410.7974. [Google Scholar]
- King, S.A.; Spieß, L.J.; Micke, P.; Wilzewski, A.; Leopold, T.; Benkler, E.; Lange, R.; Huntemann, N.; Surzhykov, A.; Yerokhin, V.A.; et al. An Optical Atomic Clock Based on a Highly Charged Ion. Nature 2022, 611, 43–47. [Google Scholar] [CrossRef] [PubMed]
- Huntemann, N.; Okhapkin, M.; Lipphardt, B.; Weyers, S.; Tamm, C.; Peik, E. High-Accuracy Optical Clock Based on the Octupole Transition in Yb + 171. Phys. Rev. Lett. 2012, 108, 090801. [Google Scholar] [CrossRef] [PubMed] [Green Version]
- Fahy, K.; Dunne, P.; McKinney, L.; O’Sullivan, G.; Sokell, E.; White, J.; Aguilar, A.; Pomeroy, J.M.; Tan, J.N.; Blagojević, B.; et al. UTA versus Line Emission for EUVL: Studies on Xenon Emission at the NIST EBIT. J. Phys. D Appl. Phys. 2004, 37, 3225–3232. [Google Scholar] [CrossRef]
- O’Sullivan, G.; Li, B.; D’Arcy, R.; Dunne, P.; Hayden, P.; Kilbane, D.; McCormack, T.; Ohashi, H.; O’Reilly, F.; Sheridan, P.; et al. Spectroscopy of Highly Charged Ions and Its Relevance to EUV and Soft X-ray Source Development. J. Phys. B At. Mol. Opt. Phys. 2015, 48, 144025. [Google Scholar] [CrossRef]
- Chao, W.; Harteneck, B.D.; Liddle, J.A.; Anderson, E.H.; Attwood, D.T. Soft X-ray Microscopy at a Spatial Resolution Better than 15 Nm. Nature 2005, 435, 1210–1213. [Google Scholar] [CrossRef] [PubMed]
- Kishimoto, M.; Kado, M.; Ishino, M.; Tamotsu, S.; Yasuda, K.; Shinohara, K. Development of Single Shot Soft X-ray Contact Microscopy System for Nano-Scale Dynamics Measurement of Living Biological Specimen. AIP Conf. Proc. 2012, 1465, 43–47. [Google Scholar] [CrossRef]
- Li, B.; Higashiguchi, T.; Otsuka, T.; Yugami, N.; Dunne, P.; Kilbane, D.; Sokell, E.; O’Sullivan, G. Analysis of Laser Produced Plasmas of Gold in the 1–7 Nm Region. J. Phys. B At. Mol. Opt. Phys. 2014, 47, 075001. [Google Scholar] [CrossRef]
- Kördel, M.; Dehlinger, A.; Seim, C.; Vogt, U.; Fogelqvist, E.; Sellberg, J.A.; Stiel, H.; Hertz, H.M. Laboratory Water-Window X-ray Microscopy. Opt. Soc. Am. 2020, 7, 658–674. [Google Scholar] [CrossRef]
- Maier, A.R.; Kajumba, N.; Guggenmos, A.; Werle, C.; Wenz, J.; Delbos, N.; Zeitler, B.; Dornmair, I.; Schmidt, J.; Gullikson, E.M.; et al. Water-Window X-ray Pulses from a Laser-Plasma Driven Undulator. Sci. Rep. 2020, 10, 5634. [Google Scholar] [CrossRef] [PubMed] [Green Version]
- Láska, L.; Badziak, J.; Boody, F.P.; Gammino, S.; Jungwirth, K.; Krása, J.; Pfeifer, M.; Rohlena, K.; Ullschmied, J.; Parys, P.; et al. Laser Production of Highly Charged Ions. Braz. J. Phys. 2004, 34, 1615–1620. [Google Scholar] [CrossRef]
- Woryna, E.; Parys, P.; Wołowski, J.; Láska, L.; Krása, J.; Mašek, K.; Pfeifer, M.; Králiková, B.; Skála, J.; Straka, P.; et al. Au49+, Pb50+, and Ta48+ Ions from Laser-Produced Plasmas. Appl. Phys. Lett. 1996, 69, 1547–1549. [Google Scholar] [CrossRef]
- Suckewer, S.; Morozov, A.; Goltsov, A.; Sokolov, A.V.; Scully, M.O. Development of a Compact X-ray Laser in the “water Window” at 4.0 Nm. Laser Phys. Lett. 2021, 18, 115001. [Google Scholar] [CrossRef]
- Eriksson, F.; Johansson, G.A.; Hertz, H.M.; Gullikson, E.M.; Kreissig, U.; Birch, J. 14.5% near-Normal Incidence Reflectance of Cr/Sc X-ray Multilayer Mirrors for the Water Window. Opt. Lett. 2003, 28, 2494. [Google Scholar] [CrossRef] [PubMed] [Green Version]
- Ohashi, H.; Higashiguchi, T.; Suzuki, Y.; Arai, G.; Otani, Y.; Yatagai, T.; Li, B.; Dunne, P.; O’Sullivan, G.; Jiang, W.; et al. Quasi-Moseley’s Law for Strong Narrow Bandwidth Soft X-ray Sources Containing Higher Charge-State Ions. Appl. Phys. Lett. 2014, 104, 234107. [Google Scholar] [CrossRef]
- Gu, M.F. The Flexible Atomic Code. Can. J. Phys. 2008, 86, 675–689. [Google Scholar] [CrossRef]
- John, C.; Kishimoto, M.; Matsumoto, Y.; Morishita, T.; Higashiguchi, T.; Endo, T.; Sunahara, A.; Johzaki, T.; Namba, S. Observation of Water-Window Soft X-ray Emission from Laser-Produced Au Plasma under Optically Thin Condition. High Energy Density Phys. 2020, 37, 100845. [Google Scholar] [CrossRef]


Publisher’s Note: MDPI stays neutral with regard to jurisdictional claims in published maps and institutional affiliations. |
© 2022 by the authors. Licensee MDPI, Basel, Switzerland. This article is an open access article distributed under the terms and conditions of the Creative Commons Attribution (CC BY) license (https://creativecommons.org/licenses/by/4.0/).
Share and Cite
Wang, J.; Kishimoto, M.; Johzaki, T.; Mizushima, K.; Kumeda, C.; Higashiguchi, T.; Sunahara, A.; Ohiro, H.; Yamasaki, K.; Namba, S. Generation of Highly Charged Au Ion in Laser-Produced Plasma for Water Window X-ray Radiation Sources. Atoms 2022, 10, 150. https://doi.org/10.3390/atoms10040150
Wang J, Kishimoto M, Johzaki T, Mizushima K, Kumeda C, Higashiguchi T, Sunahara A, Ohiro H, Yamasaki K, Namba S. Generation of Highly Charged Au Ion in Laser-Produced Plasma for Water Window X-ray Radiation Sources. Atoms. 2022; 10(4):150. https://doi.org/10.3390/atoms10040150
Chicago/Turabian StyleWang, Jiahao, Maki Kishimoto, Tomoyuki Johzaki, Kairi Mizushima, Chihiro Kumeda, Takeshi Higashiguchi, Atsushi Sunahara, Hikari Ohiro, Kotaro Yamasaki, and Shinichi Namba. 2022. "Generation of Highly Charged Au Ion in Laser-Produced Plasma for Water Window X-ray Radiation Sources" Atoms 10, no. 4: 150. https://doi.org/10.3390/atoms10040150