
High-Resolution Laboratory Measurements and Identification of Fe IX Lines near 171 Å
 ,
,  ,
,
Abstract
:1. Introduction
2. Experiment
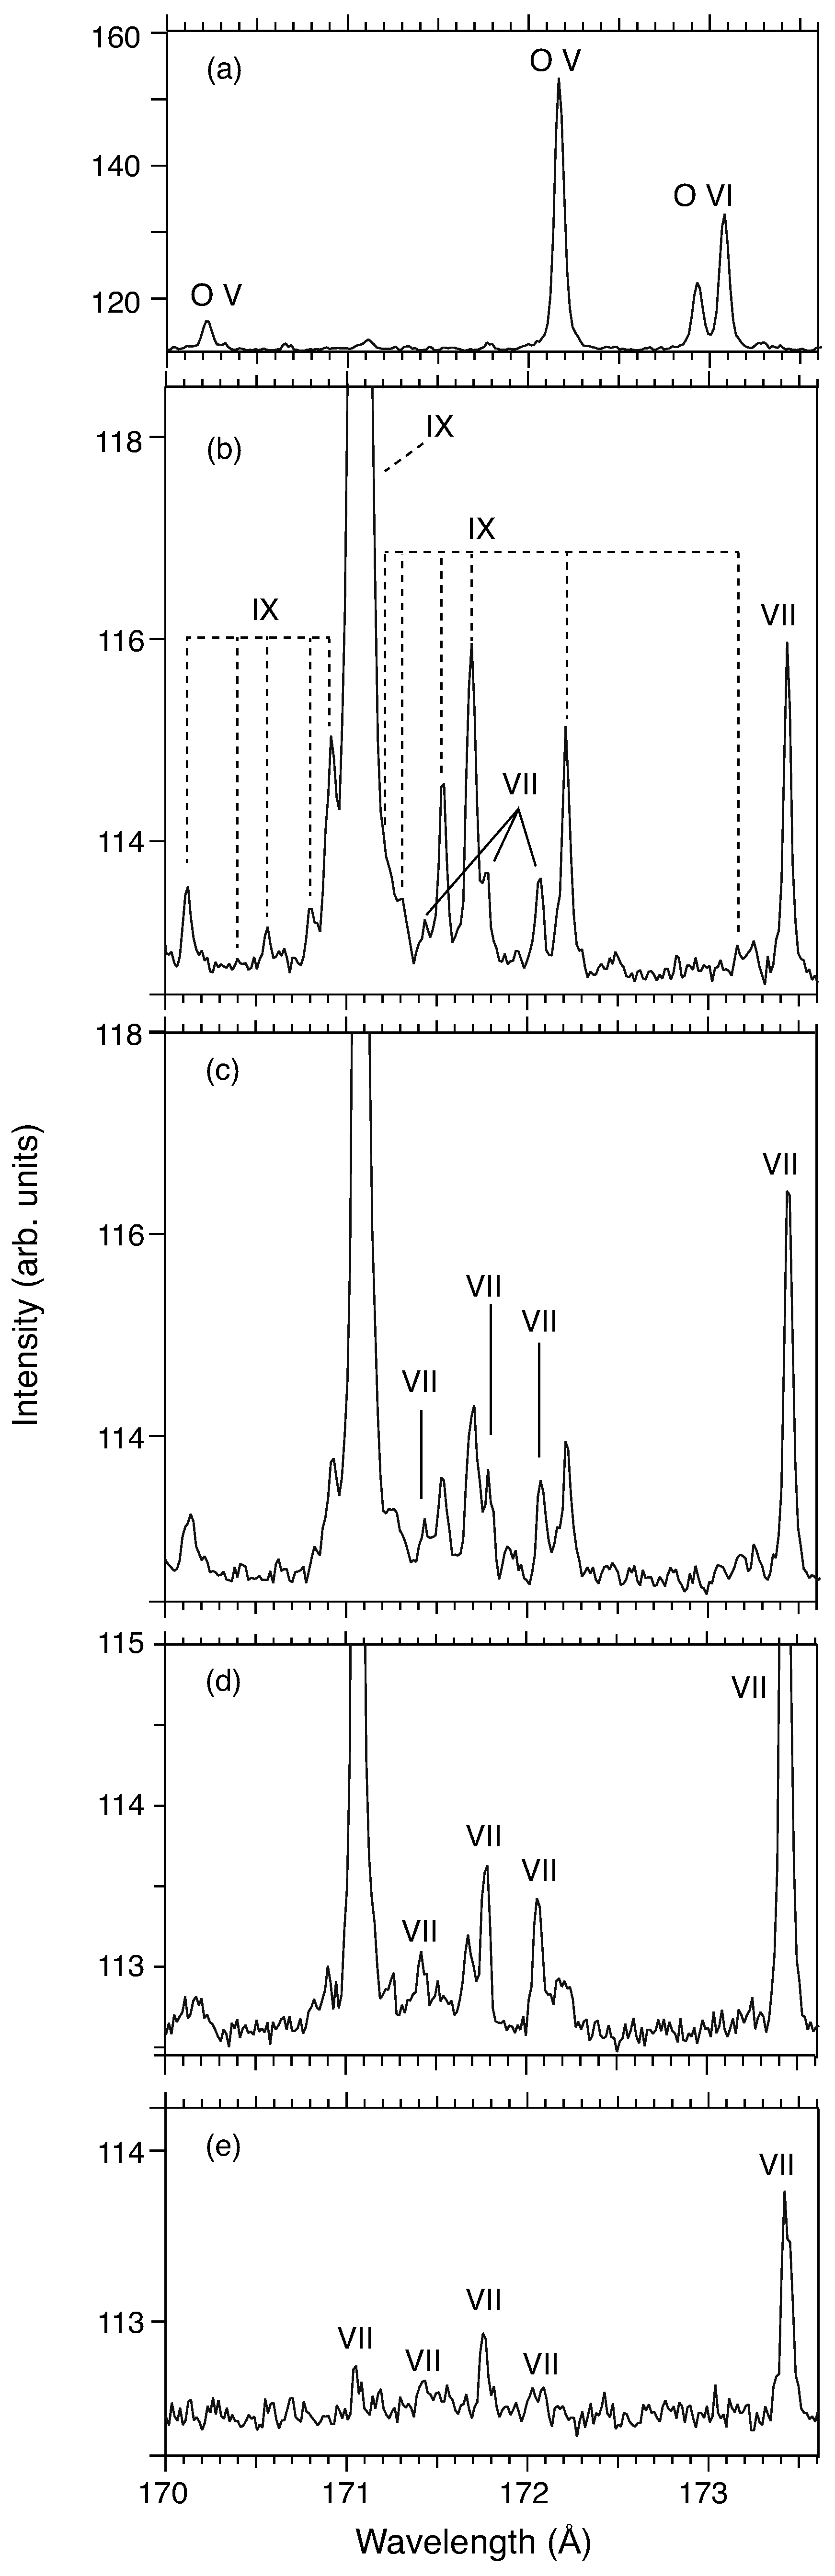
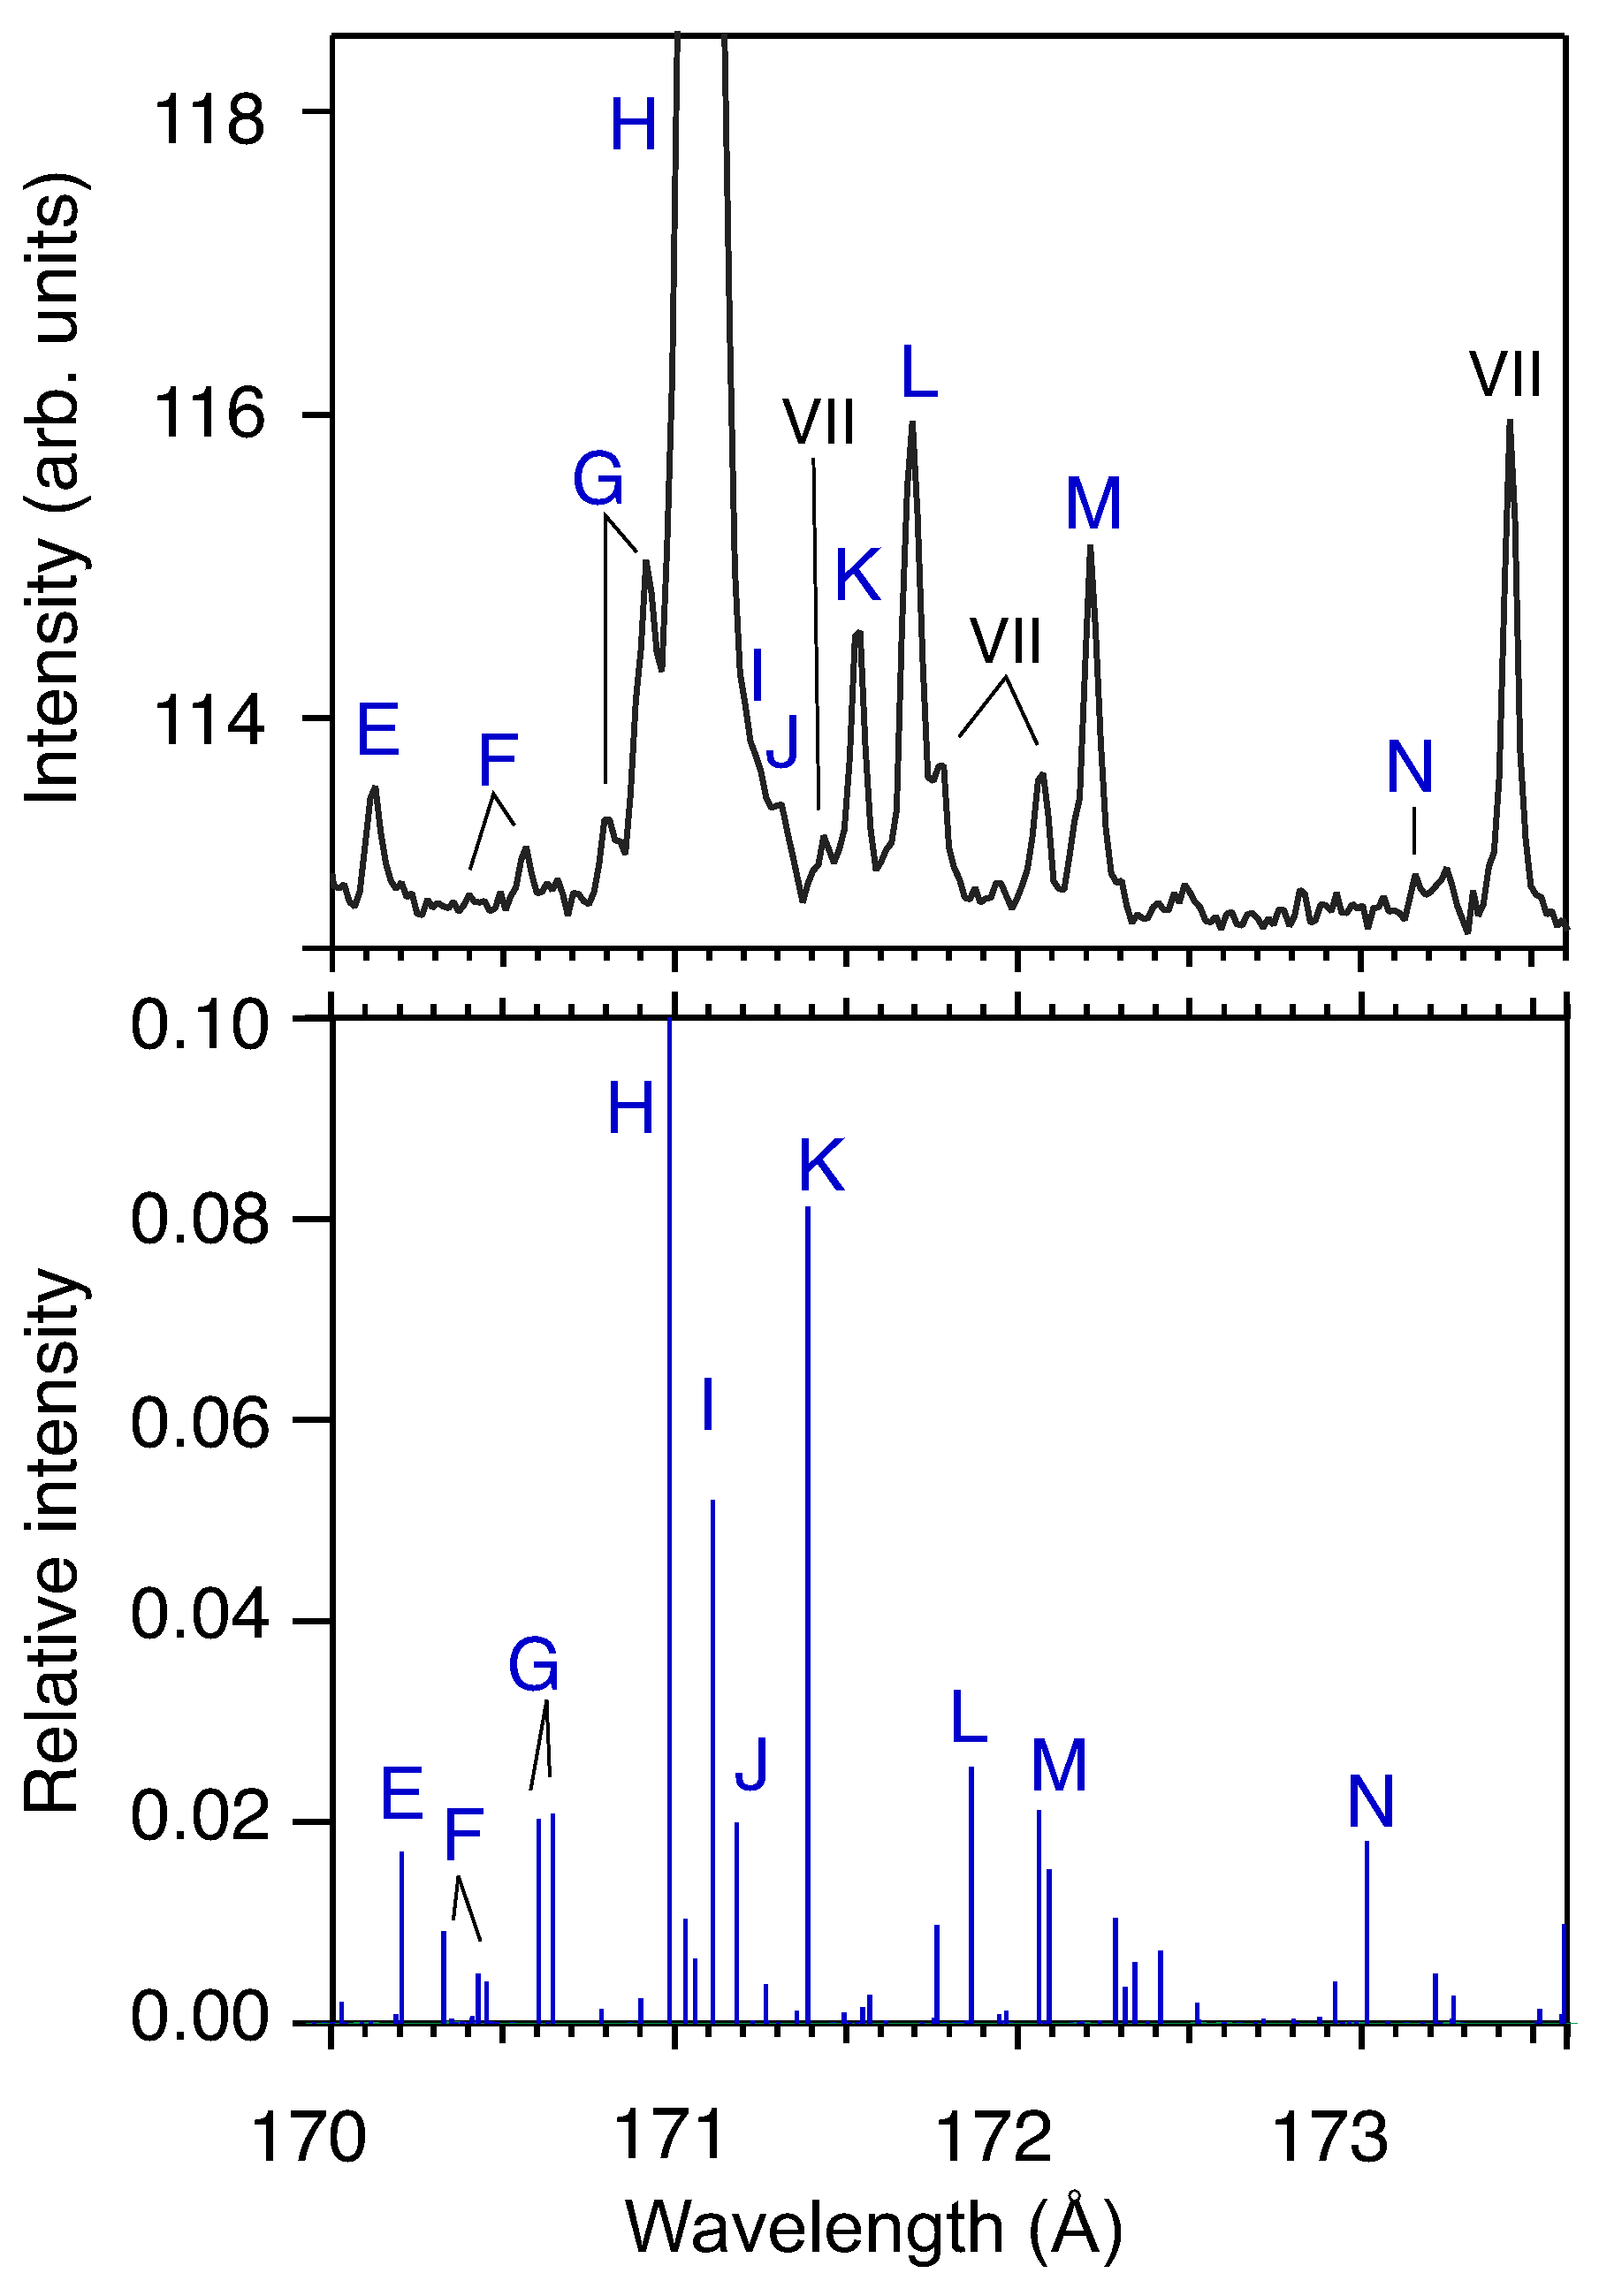
3. Results
4. Discussion
Author Contributions
Funding
Conflicts of Interest
References
- Lepson, J.; Beiersdorfer, P.; Clementson, J.; Bitter, M.; Hill, K.W.; Kaita, R.; Skinner, C.H.; Roquemore, L.; Zimmer, G. High-resolution time-resolved extreme ultraviolet spectroscopy on NSTX. Rev. Sci. Instrum. 2012, 83, 10D520. [Google Scholar] [CrossRef]
- Lepson, J.K.; Beiersdorfer, P.; Bitter, M.; Roquemore, A.L.; Kaita, R. Emission lines of iron in the 150–250 Å region on National Spherical Torus Experiment. Phys. Scr. 2013, T156, 014075. [Google Scholar] [CrossRef]
- Weller, M.E.; Beiersdorfer, P.; Soukhanovskii, V.A.; Magee, E.W.; Scotti, F. Three new extreme ultraviolet spectrometers on NSTX-U for impurity monitoring. Rev. Sci. Instrum. 2016, 87, 11E324. [Google Scholar] [CrossRef] [PubMed]
- Lepson, J.K.; Beiersdorfer, P.; Bitter, M.; Roquemore, A.L.; Kaita, R. Unusual emission lines of carbon in the 170-190 Å region on NSTX. AIP Conf. Ser. 2017, 1811, 190008. [Google Scholar] [CrossRef]
- Thomas, R.J.; Neupert, W.M. Extreme Ultraviolet Spectrum of a Solar Active Region from SERTS. Astrophys. J. 1994, 91, S461. [Google Scholar] [CrossRef]
- Brosius, J.W.; Davila, J.M.; Thomas, R.J. Solar Active Region and Quiet-Sun Extreme-Ultraviolet Spectra from SERTS-95. Astrophys. J. 1998, 119, S255. [Google Scholar] [CrossRef] [Green Version]
- Sirk, M.M.; Hurwitz, M.; Marchant, W. EUV Spectra of the Full Solar Disk: Analysis and Results of the Cosmic Hot Interstellar Plasma Spectrometer (CHIPS). Sol. Phys. 2010, 264, 287–309. [Google Scholar] [CrossRef] [Green Version]
- Lepson, J.; Beiersdorfer, P.; Hurwitz, M.; Sirk, M.M.; Kato, T.; Yamamoto, N. Iron emission lines in solar and laboratory plasmas. J. Phys. Conf. Ser. 2008, 130, 012014. [Google Scholar] [CrossRef]
- Raassen, A.J.J.; Mewe, R.; Audard, M.; Güdel, M.; Behar, E.; Kaastra, J.S.; van der Meer, R.L.J.; Foley, C.R.; Ness, J.U. High-resolution X-ray spectroscopy of Procyon by Chandra and XMM-Newton. Astron. Astrophys. 2002, 389, 228. [Google Scholar] [CrossRef]
- Raassen, A.J.J.; Ness, J.U.; Mewe, R.; van der Meer, R.L.J.; Burwitz, V.; Kaastra, J.S. Chandra-LETGS X-ray observation of alpha Centauri: A nearby (G2V + K1V) binary system. Astron. Astrophys. 2003, 400, 671–678. [Google Scholar] [CrossRef]
- Del Zanna, G.; Dere, K.P.; Young, P.R.; Landi, E. CHIANTI—An Atomic Database for Emission Lines. XVI. Version 10, Further Extensions. Astrophys. J. 2021, 909, 38. [Google Scholar] [CrossRef]
- Beiersdorfer, P.; Träbert, E. High-resolution Laboratory Measurements of Coronal Lines near the Fe IX Line at 171 Å. Astrophys. J. 2018, 854, 114. [Google Scholar] [CrossRef]
- Levine, M.A.; Marrs, R.E.; Bardsley, J.N.; Beiersdorfer, P.; Bennett, C.L.; Chen, M.H.; Cowan, T.; Dietrich, D.; Henderson, J.R.; Knapp, D.A.; et al. The use of an electron beam ion trap in the study of highly charged ions. Nucl. Instrum. Methods 1989, B43, 431. [Google Scholar] [CrossRef]
- Beiersdorfer, P. A “brief” history of spectroscopy on EBIT. Can. J. Phys. 2008, 86, 1. [Google Scholar] [CrossRef]
- Beiersdorfer, P.; Brown, G.V.; Drake, J.J.; Gu, M.F.; Kahn, S.M.; Lepson, J.K.; Liedahl, D.A.; Mauche, C.W.; Savin, D.W.; Utter, S.B.; et al. Emission Line Spectra from Low-Density Laboratory Plasmas. Rev. Mex. Astron. Astrofís. 2000, 9, 123. [Google Scholar]
- Beiersdorfer, P. Laboratory X-Ray Astrophysics. Ann. Rev. Astron. Astrophys. 2003, 41, 343. [Google Scholar] [CrossRef]
- Beiersdorfer, P.; Clementson, J.; Safronova, U.I. Tungsten Data for Current and Future Uses in Fusion and Plasma Science. Atoms 2015, 3, 260–272. [Google Scholar] [CrossRef] [Green Version]
- Chen, H.; Beiersdorfer, P.; Heeter, L.A.; Liedahl, D.A.; Naranjo-Rivera, K.L.; Träbert, E.; Gu, M.F.; Lepson, J.K. Experimental and Theoretical Evaluation of Density-sensitive N VI, Ar XIV, and Fe XXII Line Ratios. Astrophys. J. 2004, 611, 598. [Google Scholar] [CrossRef]
- Arthanayaka, T.; Beiersdorfer, P.; Brown, G.V.; Gu, M.F.; Hahn, M.; Hell, N.; Lockard, T.; Savin, D.W. Laboratory Calibrations of Fe XII-XIV Line-intensity Ratios for Electron Density Diagnostics. Astrophys. J. 2020, 890, 77. [Google Scholar] [CrossRef]
- Träbert, E.; Beiersdorfer, P.; Brown, G.V.; Hell, N.; Lepson, J.K.; Fairchild, A.J.; Hahn, M.; Savin, D.W. Laboratory search for Fe IX solar diagnostic lines at an electron beam ion trap. Atoms 2022, 10, 115. [Google Scholar] [CrossRef]
- Beiersdorfer, P.; Magee, E.W.; Brown, G.V.; Hell, N.; Träbert, E.; Widmann, K. Extended-range grazing-incidence spectrometer for high-resolution extreme ultraviolet measurements on an electron beam ion trap. Rev. Sci. Instrum. 2014, 85, 11E422. [Google Scholar] [CrossRef] [PubMed]
- Lepson, J.K.; Beiersdorfer, P.; Brown, G.V.; Kahn, S.M.; Liedahl, D.A.; Mauche, C.W.; Utter, S.B. Cataloguing Emission Line Spectra from Fe VII-Fe XXIV in the Extreme Ultraviolet. Rev. Mex. Astron. Astrofís. 2000, 9, 137. [Google Scholar]
- Lepson, J.K.; Beiersdorfer, P.; Brown, G.V.; Liedahl, D.A.; Brickhouse, N.S.; Dupree, A.K.; Kaastra, J.S.; Mewe, R.; Kahn, S.M. Emission Lines of Fe VII-Fe X in the Extreme Ultraviolet Region, 60–140 Å. Astrophys. J. 2002, 578, 648. [Google Scholar] [CrossRef]
- Lepson, J.K.; Beiersdorfer, P. Low-Energy Operation of the Lawrence Livermore Electron Beam Ion Traps: Atomic Spectroscopy of Si V, S VII and Ar IX. Phys. Scr. 2005, T120, 62. [Google Scholar] [CrossRef]
- Beiersdorfer, P.; Lepson, J.K.; Desai, P.; Díaz, F.; Ishikawa, Y. New Identifications of Fe IX, Fe X, Fe XI, Fe XII, and Fe XIII Lines in the Spectrum of Procyon Observed with the Chandra X-Ray Observatory. Astrophys. J. 2014, 210, 16. [Google Scholar] [CrossRef]


| Key | Lower Level | Upper Level | |
|---|---|---|---|
| E | 170.118 | ||
| F-1 | (J = 1) | 170.41 | |
| F-2 | (J = 1) | (J = 1) | 170.559 |
| F-3 | (J = 1) | (J = 1) | 170.559 |
| G-1 | 170.802 | ||
| G-2 | (J = 1) | 170.915 | |
| H | (J = 1) | 171.073 | |
| I | 171.235 | ||
| J | (J = 1) | 171.312 | |
| K | 171.532 | ||
| L | 171.690 | ||
| M-1 | 172.215 | ||
| M-2 | 172.215 | ||
| N | 173.16 |
Publisher’s Note: MDPI stays neutral with regard to jurisdictional claims in published maps and institutional affiliations. |
© 2022 by the authors. Licensee MDPI, Basel, Switzerland. This article is an open access article distributed under the terms and conditions of the Creative Commons Attribution (CC BY) license (https://creativecommons.org/licenses/by/4.0/).
Share and Cite
Beiersdorfer, P.; Lepson, J.K.; Brown, G.V.; Hell, N.; Träbert, E.; Hahn, M.; Savin, D.W. High-Resolution Laboratory Measurements and Identification of Fe IX Lines near 171 Å. Atoms 2022, 10, 148. https://doi.org/10.3390/atoms10040148
Beiersdorfer P, Lepson JK, Brown GV, Hell N, Träbert E, Hahn M, Savin DW. High-Resolution Laboratory Measurements and Identification of Fe IX Lines near 171 Å. Atoms. 2022; 10(4):148. https://doi.org/10.3390/atoms10040148
Chicago/Turabian StyleBeiersdorfer, Peter, Jaan K. Lepson, Gregory V. Brown, Natalie Hell, Elmar Träbert, Michael Hahn, and Daniel W. Savin. 2022. "High-Resolution Laboratory Measurements and Identification of Fe IX Lines near 171 Å" Atoms 10, no. 4: 148. https://doi.org/10.3390/atoms10040148