
Performance of a keV/u Ion Spectrometer for the FISIC Platform
 , , , , , , and
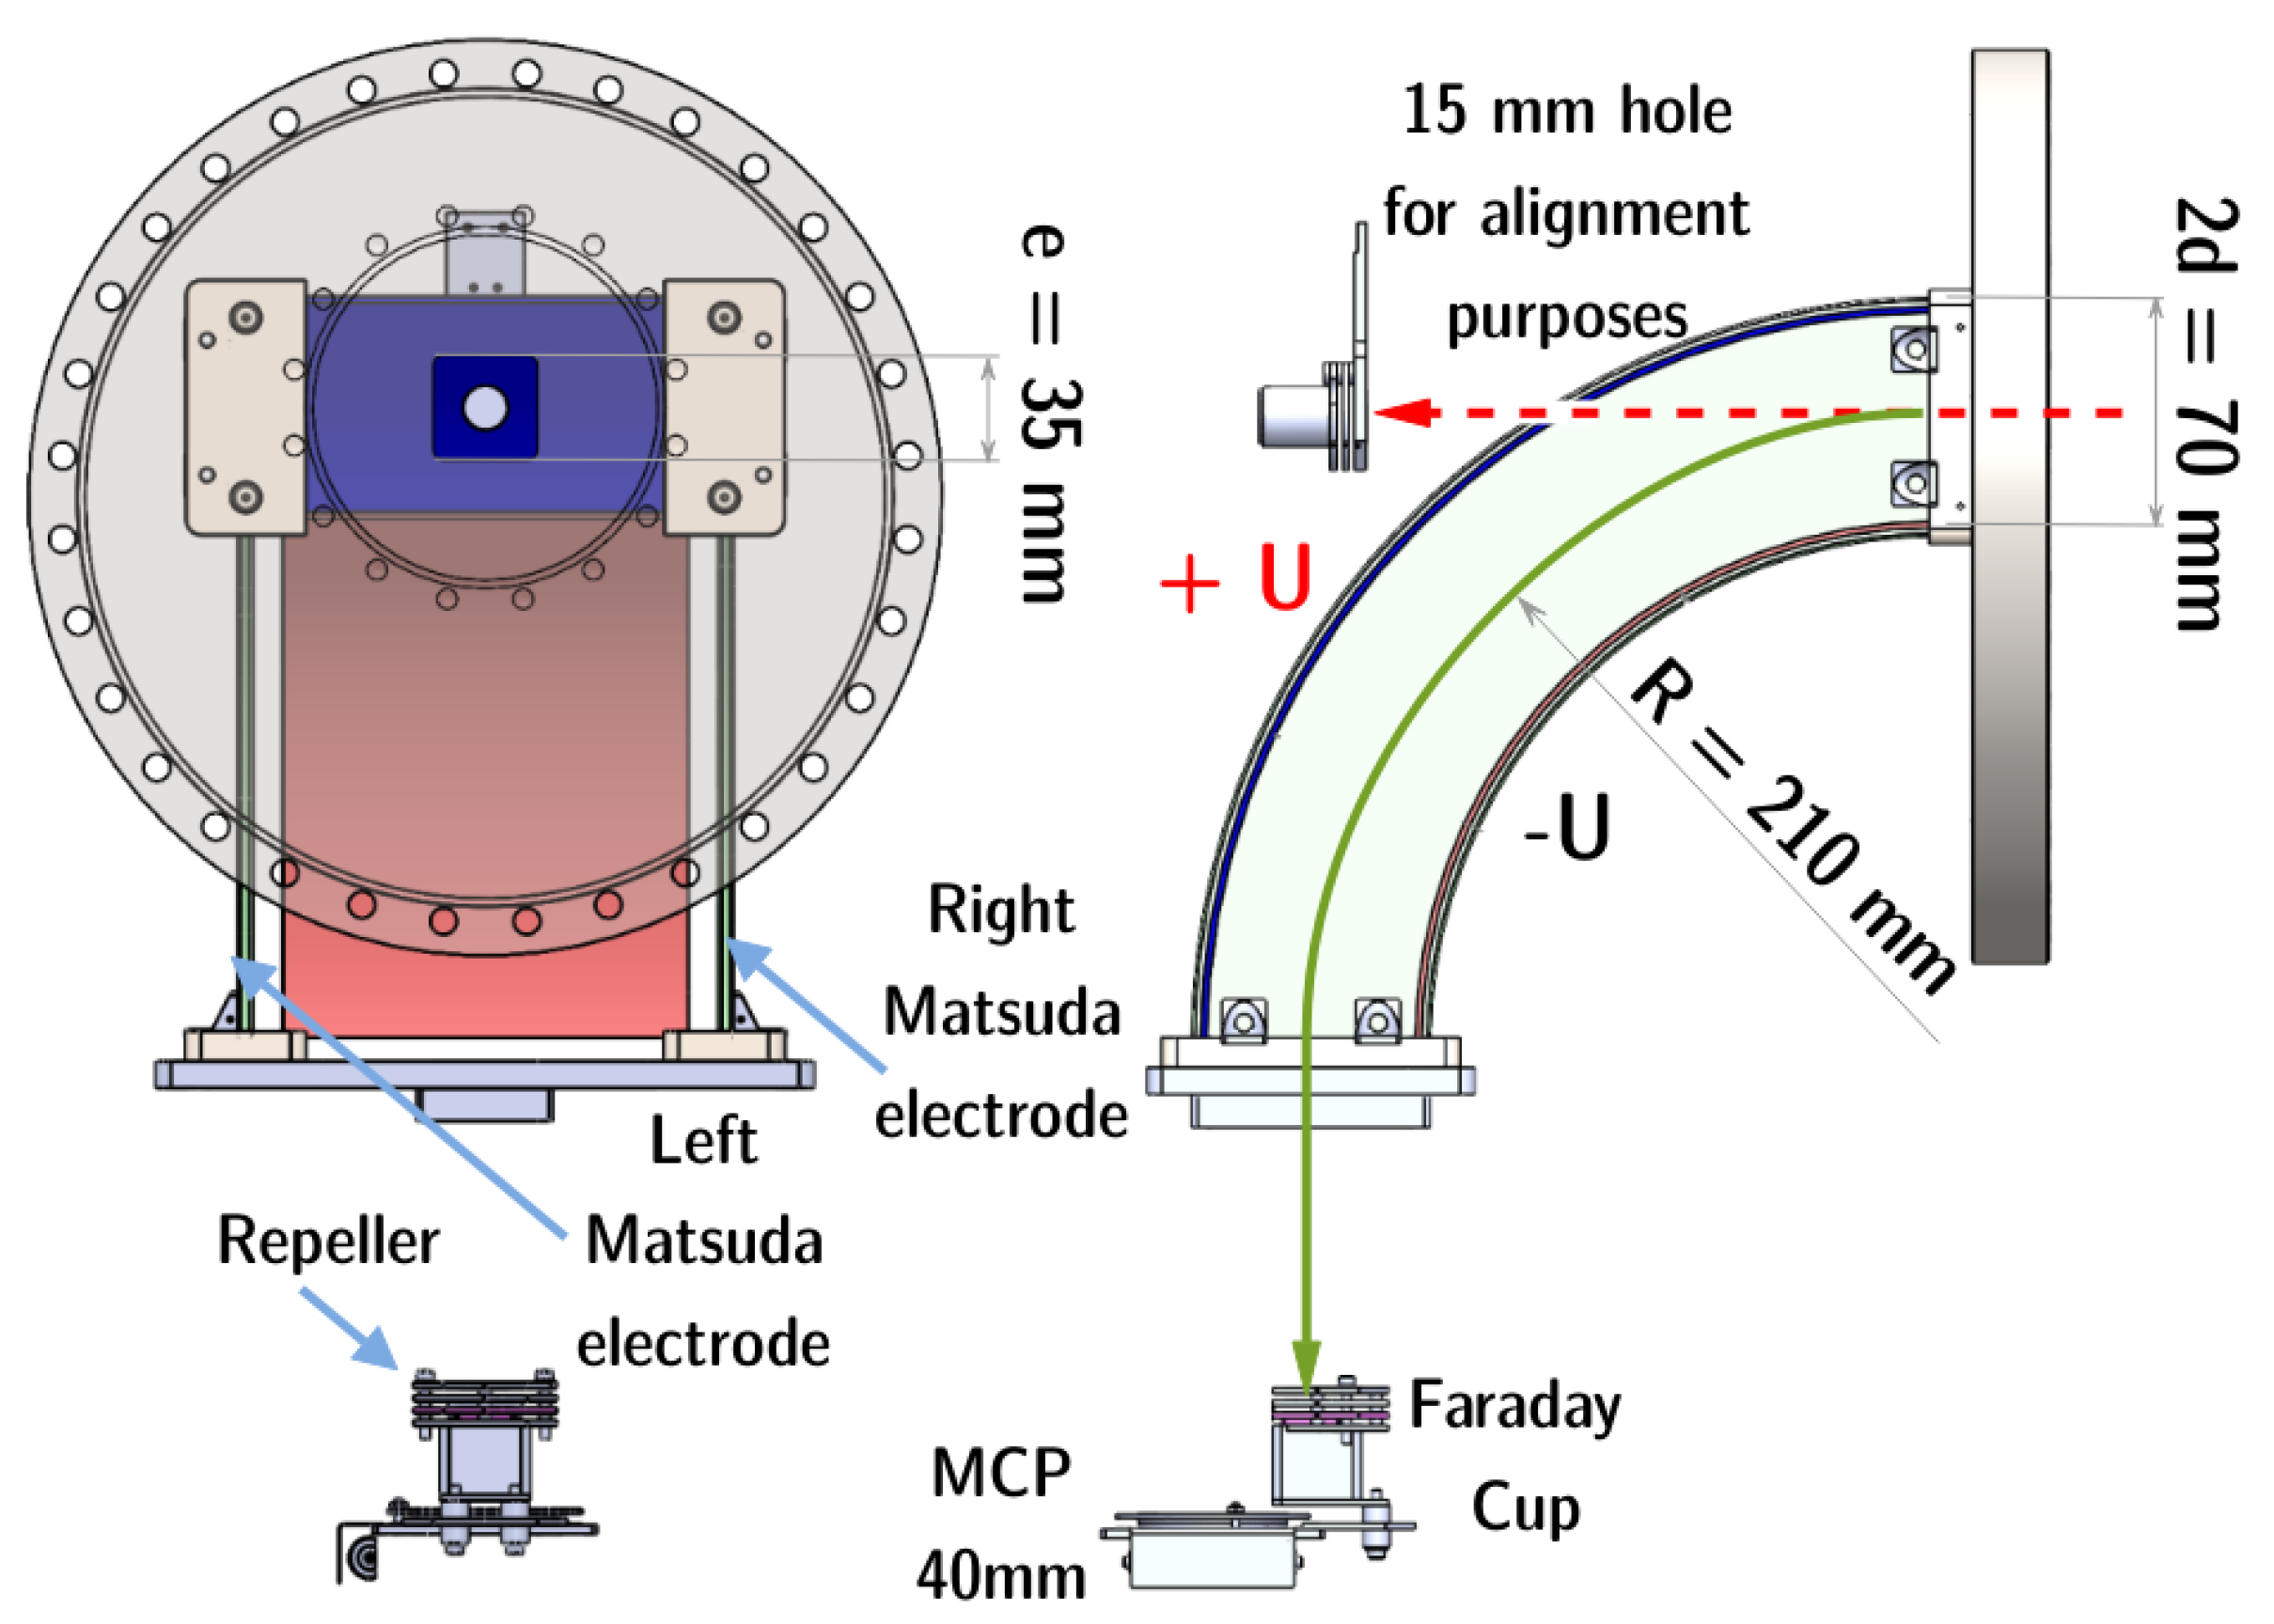
Abstract
:1. Introduction
2. Experiment and Results
2.1. Design of the Ion Spectrometer
2.2. The ARIBE Facility
2.3. Methodology
3. Results
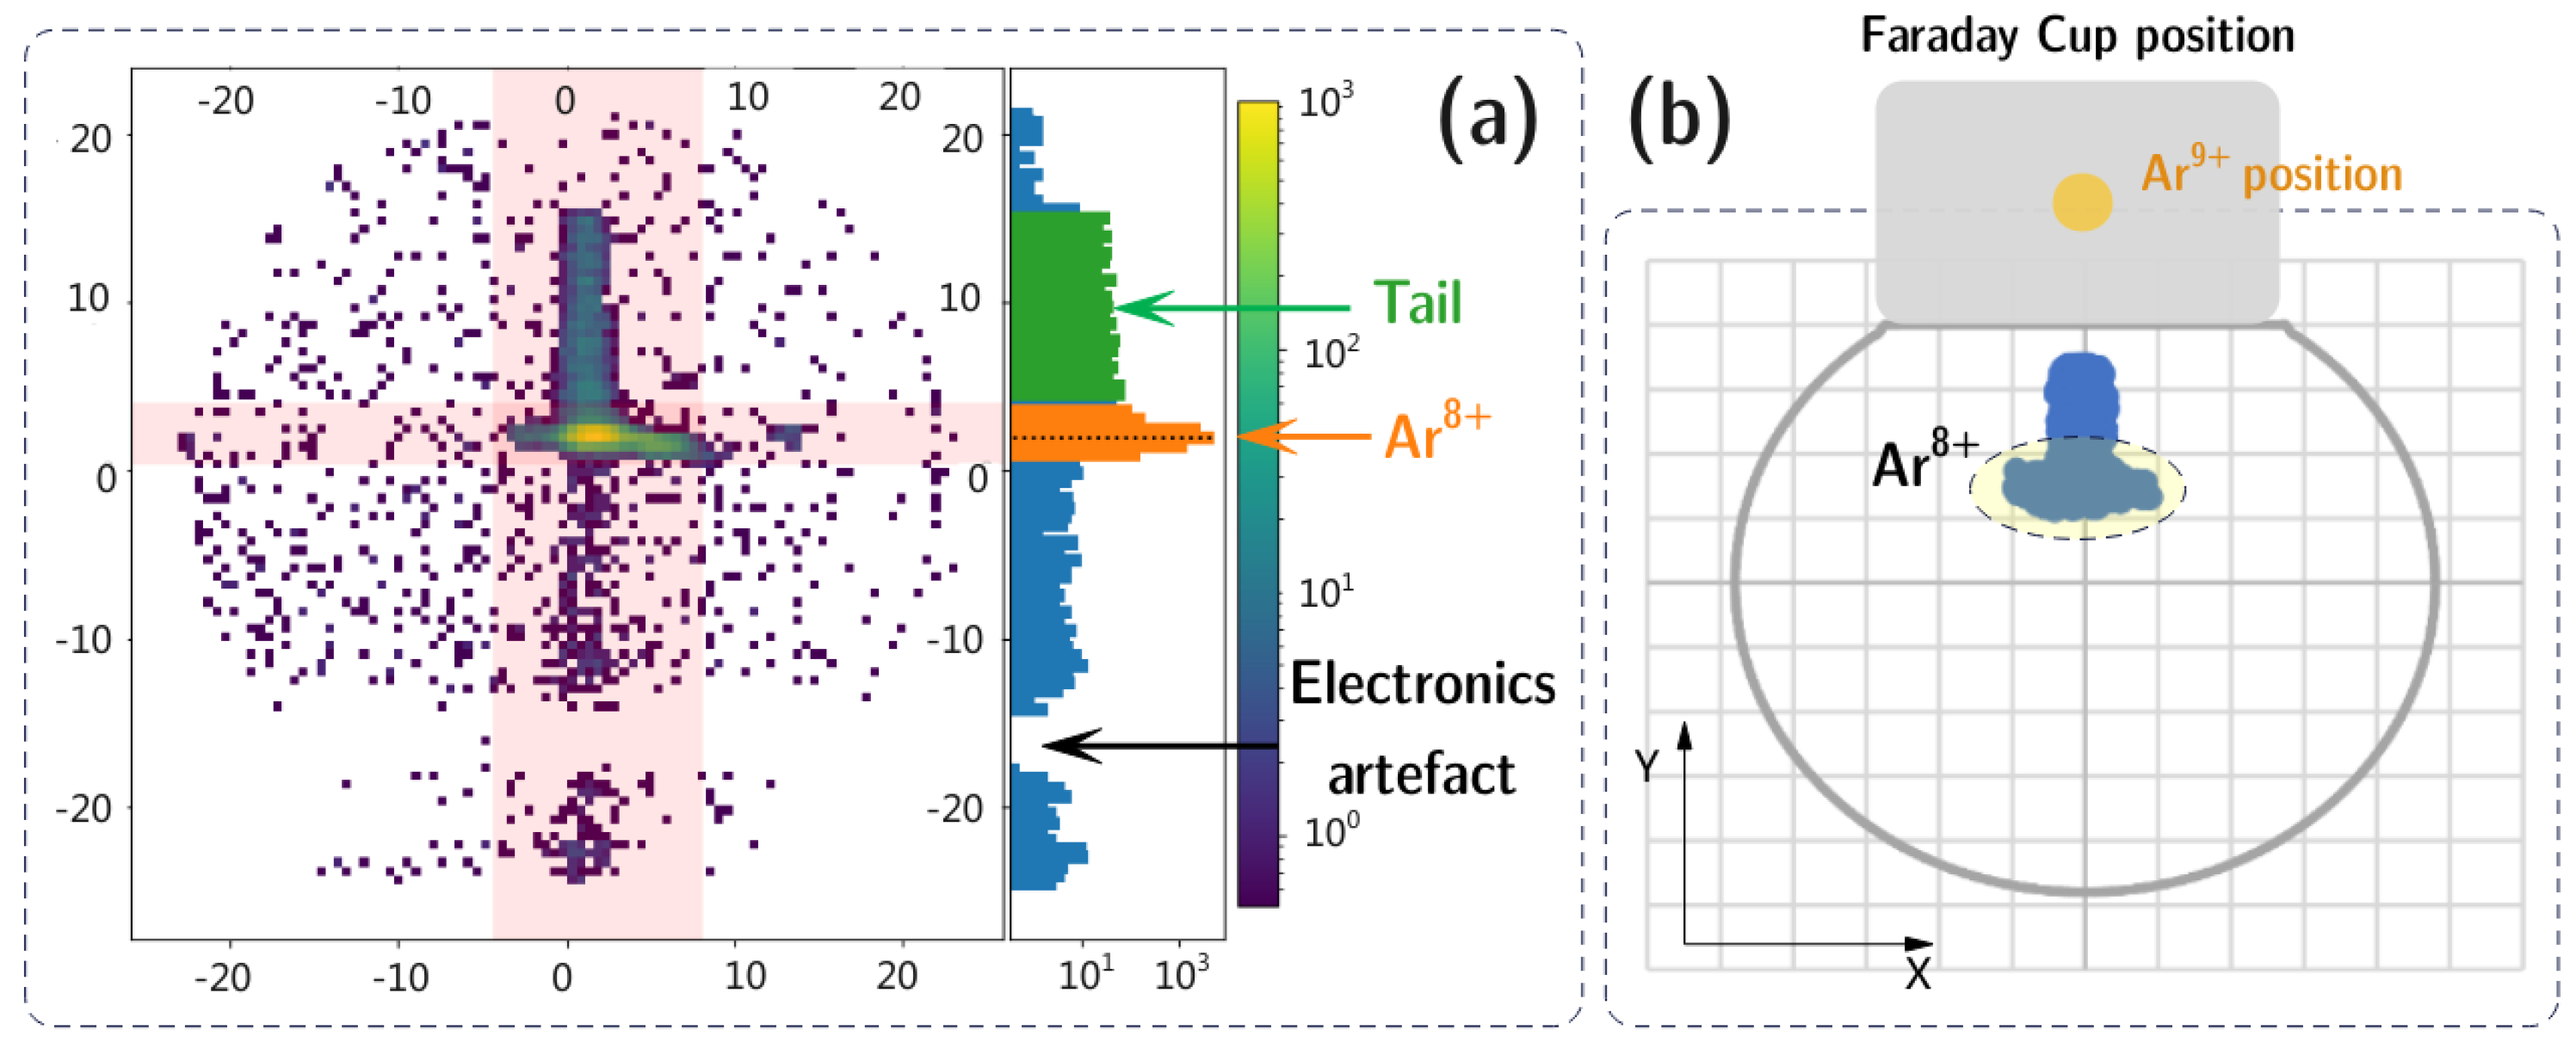
3.1. Results with Ar
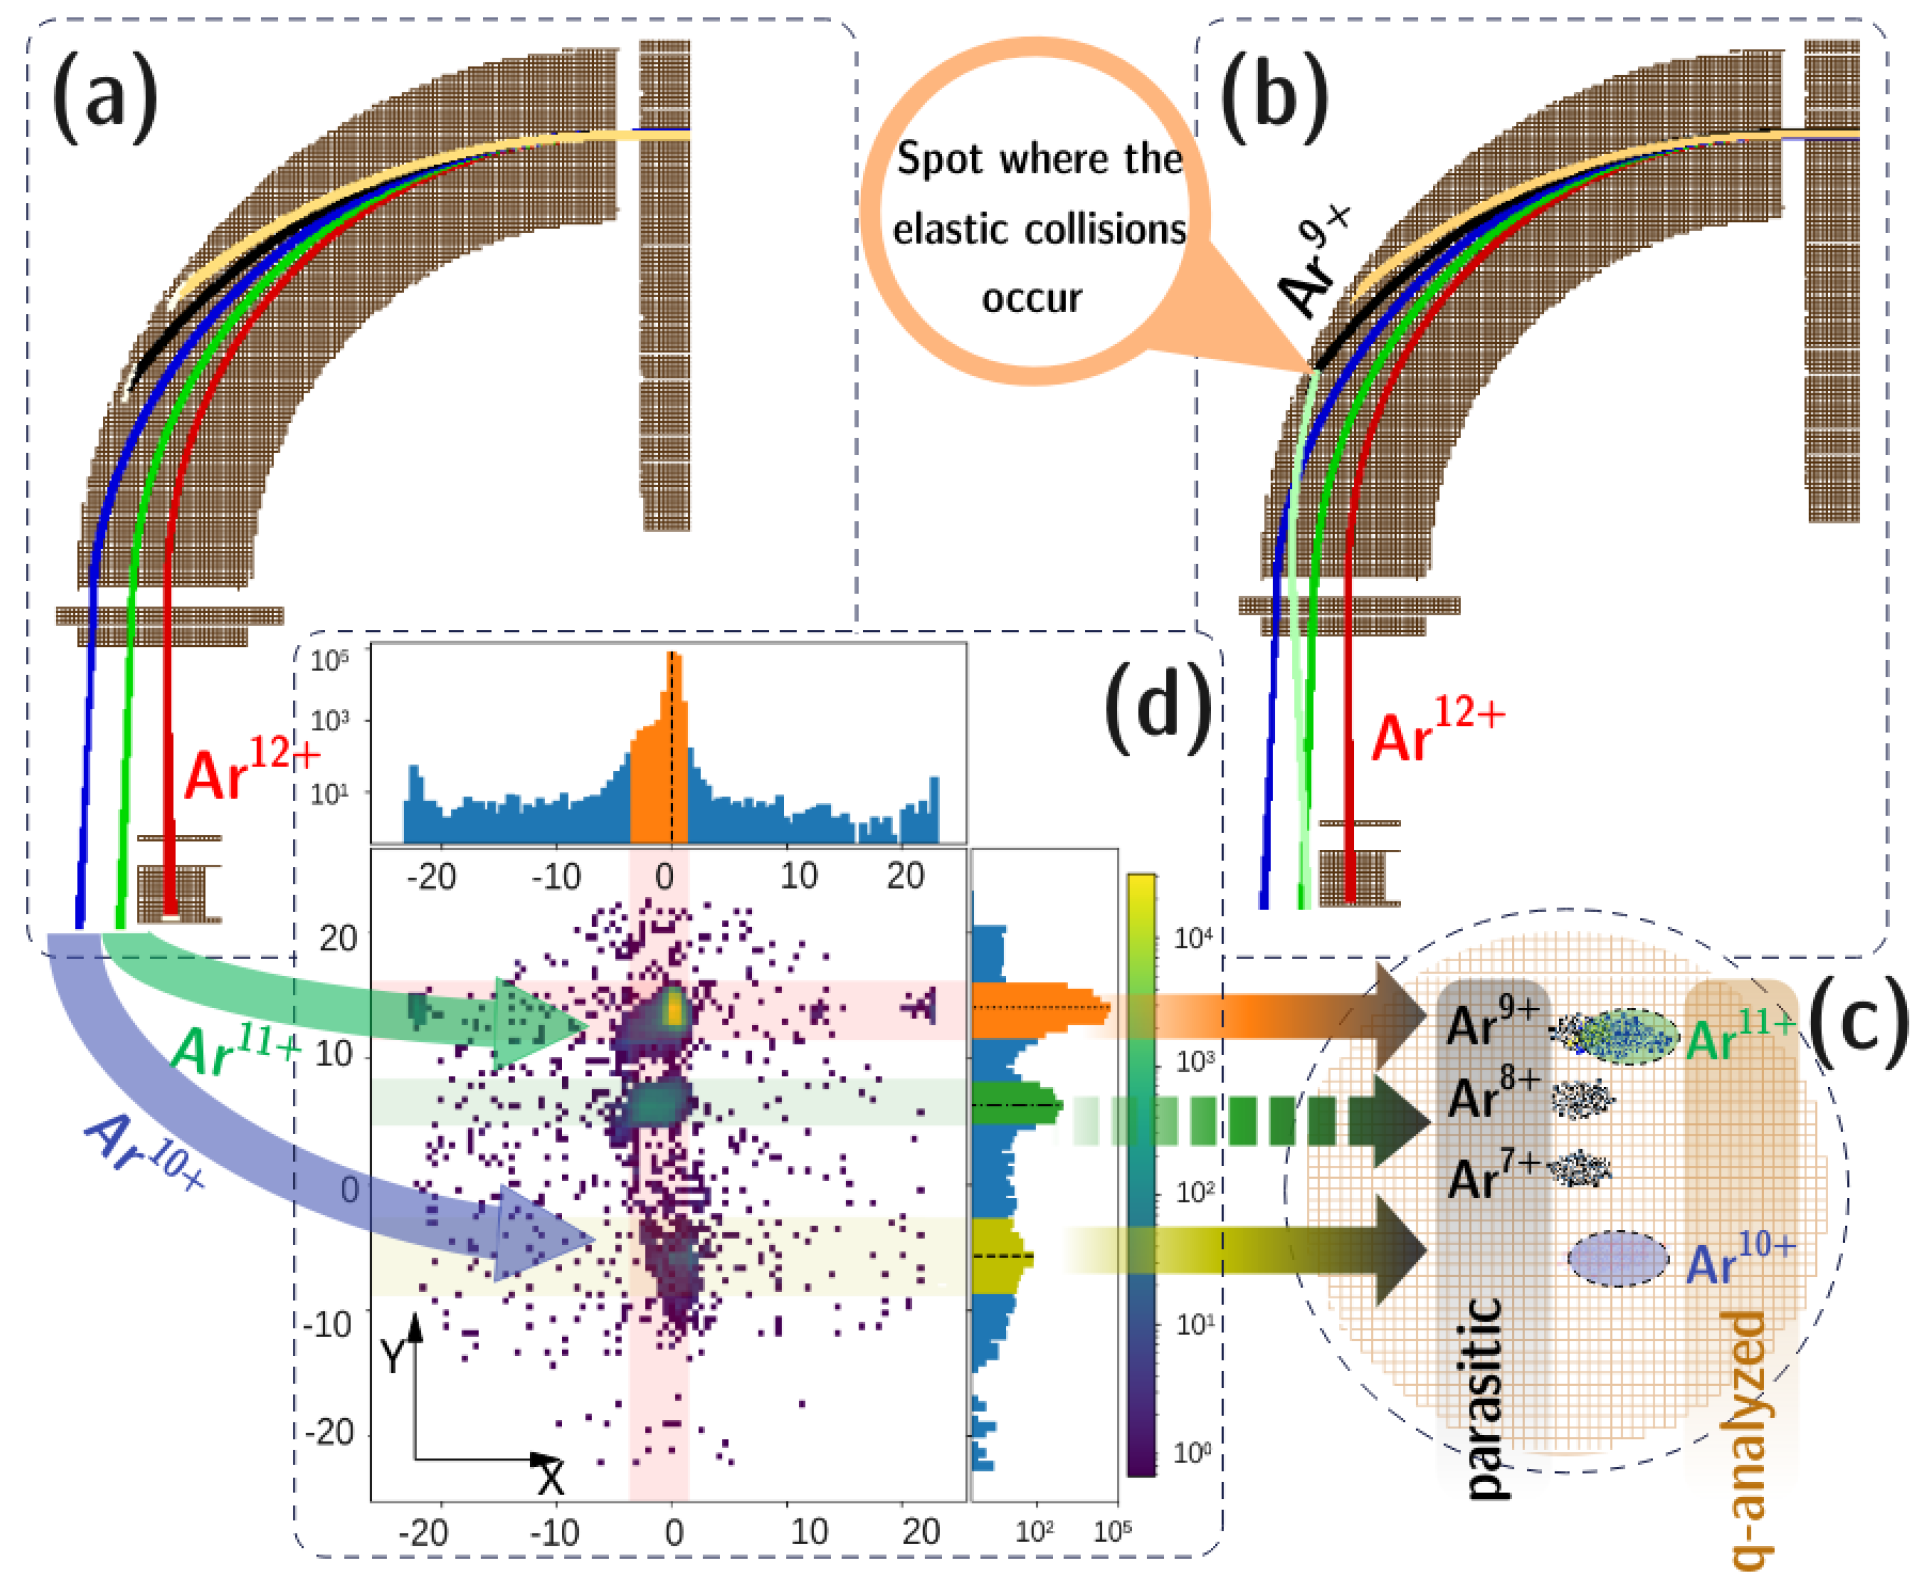
3.2. Results with Ar
4. Discussion and Conclusions
Author Contributions
Funding
Data Availability Statement
Conflicts of Interest
References
- Aumayr, F.; Ueda, K.; Sokell, E.; Schippers, S.; Sadeghpour, H.; Merkt, F.; Gallagher, T.F.; Dunning, F.B.; Scheier, P.; Echt, O.; et al. Roadmap on photonic, electronic and atomic collision physics: III. Heavy particles: With zero to relativistic speeds. J. Phys. B At. Mol. Opt. Phys. 2019, 52, 171003. [Google Scholar] [CrossRef]
- Lestinsky, M.; Andrianov, V.; Aur, B.; Bagnoud, V.; Bernhardt, D.; Beyer, H.; Bishop, S.; Blaum, K.; Bleile, A.; Borovik, A.; et al. Physics book: CRYRING@ESR. Eur. Phys. J. Spec. Top. 2016, 225, 797–882. [Google Scholar] [CrossRef] [Green Version]
- Bernigaud, V.; Kamalou, O.; Lawicki, A.; Capron, M.; Maisonny, R.; Manil, B.; Maunoury, L.; Rangama, J.; Rousseau, P.; Chesnel, J.Y.; et al. ARIBE: A low energy ion beam facility in Caen. Publ. l’Observatoire Astron. Beogr. 2008, 84, 83–86. [Google Scholar]
- SIMION 3D Suite. Available online: https://simion.com/ (accessed on 15 September 2022).
- Yavor, M. Chapter 6 Electrostatic Energy Analyzers. In Optics of Charged Particle Analyzers, Advances in Imaging and Electron Physics; Elsevier: Amsterdam, The Netherlands, 2009; Volume 157, pp. 213–258. [Google Scholar] [CrossRef]
- Matsuda, H. Electrostatic analyzer with variable focal length. J. Mass Spectrom. Soc. Jpn. 1961, 9, 8–14. [Google Scholar] [CrossRef]
- Wiza, J.L. Microchannel plate detectors. Nucl. Instrum. Methods 1979, 162, 587–601. [Google Scholar] [CrossRef]
- Schury, D.; Kumar, A.; Mery, A.; Chesnel, J.Y.; Levy, A.; Mace, S.; Prigent, C.; Ramillon, J.M.; Rangama, J.; Rousseau, P.; et al. An electrostatic in-line charge-state purification system for multicharged ions in the kiloelectronvolt energy range. Rev. Sci. Instrum. 2019, 90, 083306. [Google Scholar] [CrossRef] [PubMed] [Green Version]
- Caen, L. Fast Acquisition System for Nuclear Research. Available online: http://faster.in2p3.fr (accessed on 15 September 2022).
- Dahl, D.A. SIMION for the personal computer in reflection. Int. J. Mass Spectrom. 2000, 200, 3–25. [Google Scholar] [CrossRef]
- Van der Weg, W.; Bierman, D. Collisions of Ar+ ions with surface Cu atoms and charge exchange of scattered ions near the metal surface. Physica 1969, 44, 177–205. [Google Scholar] [CrossRef]
- Winter, H. Collisions of atoms and ions with surfaces under grazing incidence. Phys. Rep. 2002, 367, 387–582. [Google Scholar] [CrossRef]


Publisher’s Note: MDPI stays neutral with regard to jurisdictional claims in published maps and institutional affiliations. |
© 2022 by the authors. Licensee MDPI, Basel, Switzerland. This article is an open access article distributed under the terms and conditions of the Creative Commons Attribution (CC BY) license (https://creativecommons.org/licenses/by/4.0/).
Share and Cite
Jolly, M.; Voikopoulos, S.; Lamour, E.; Méry, A.; Bräuning-Demian, A.; Chesnel, J.-Y.; Gumberidze, A.; Lestinsky, M.; Macé, S.; Prigent, C.; et al. Performance of a keV/u Ion Spectrometer for the FISIC Platform. Atoms 2022, 10, 146. https://doi.org/10.3390/atoms10040146
Jolly M, Voikopoulos S, Lamour E, Méry A, Bräuning-Demian A, Chesnel J-Y, Gumberidze A, Lestinsky M, Macé S, Prigent C, et al. Performance of a keV/u Ion Spectrometer for the FISIC Platform. Atoms. 2022; 10(4):146. https://doi.org/10.3390/atoms10040146
Chicago/Turabian StyleJolly, Mariette, Spyridon Voikopoulos, Emily Lamour, Alain Méry, Angela Bräuning-Demian, Jean-Yves Chesnel, Alexandre Gumberidze, Michael Lestinsky, Stéphane Macé, Christophe Prigent, and et al. 2022. "Performance of a keV/u Ion Spectrometer for the FISIC Platform" Atoms 10, no. 4: 146. https://doi.org/10.3390/atoms10040146