


Zonal Chemical Signal Pathways Mediating Floral Induction in Apple
 , , , and
Abstract
:1. Introduction
2. Materials and Methods
2.1. Experimental Site and Crop Load Treatments
2.2. Apple Bud Preparation and Metabolomic Extraction
2.3. LCMS Methods for Untargeted and Targeted Analysis
2.4. Data Processing and Statistical Analyses
3. Results
4. Discussion
5. Conclusions
Supplementary Materials
Author Contributions
Funding
Institutional Review Board Statement
Informed Consent Statement
Data Availability Statement
Acknowledgments
Conflicts of Interest
References
- Milyaev, A.; Kofler, J.; Klaiber, I.; Czemmel, S.; Pfannstiel, J.; Flachowsky, H.; Stefanelli, D.; Hanke, M.-V.; Wünsche, J.-N. Toward Systematic Understanding of Flower Bud Induction in Apple: A Multi-Omics Approach. Front. Plant Sci. 2021, 12, 604810. [Google Scholar] [CrossRef] [PubMed]
- Milyaev, A.; Kofler, J.; Moya, Y.A.T.; Lempe, J.; Stefanelli, D.; Hanke, M.V.; Flachowsky, H.; von Wirén, N.; Wünsche, J.N. Profiling of phytohormones in apple fruit and buds regarding their role as potential regulators of flower bud formation. Tree Physiol. 2022, 42, 2319–2335. [Google Scholar] [CrossRef] [PubMed]
- Hanke, M.-V.; Henryk, b.; Flachowsky, H.; Peil, A.; Hättasch, C. No Flower no Fruit—Genetic Potentials to Trigger Flowering in Fruit Trees. Genes Genomes Genom. 2007, 1, 1–20. [Google Scholar]
- Guitton, B.; Kelner, J.J.; Velasco, R.; Gardiner, S.E.; Chagné, D.; Costes, E. Genetic control of biennial bearing in apple. J. Exp. Bot. 2012, 63, 131–149. [Google Scholar] [CrossRef] [PubMed]
- Kviklys, D.; Samuolienė, G. Relationships Among the Rootstock, Crop Load, and Sugar Hormone Signaling of Apple Tree, and Their Effects on Biennial Bearing. Front. Plant Sci. 2020, 11, 01213. [Google Scholar] [CrossRef] [PubMed]
- Arseneault, M.H. Crop Load Management of Apple by Chemical Fruitlet Thinning, Preharvest Drop Management, and Investigation of Abscission Physiology. Ph.D. Thesis, University of Guelph, Guelph, ON, Canada, 2016. [Google Scholar]
- Kofler, J.; Milyaev, A.; Würtz, B.; Pfannstiel, J.; Flachowsky, H.; Wünsche, J.N. Proteomic differences in apple spur buds from high and non-cropping trees during floral initiation. J. Proteom. 2022, 253, 104459. [Google Scholar] [CrossRef]
- Milyaev, A.; Kofler, J.; Pfannstiel, J.; Stefanelli, D.; Flachowsky, H.; Hanke, M.V.; Wünsche, J.N. Histological and proteomic approaches to study floral bud induction in relation to biennial bearing in apple. Acta Hortic. 2018, 1229, 277–283. [Google Scholar] [CrossRef]
- Dennis, F.G.; Neilsen, J.C. Physiological factors affecting biennial bearing in tree fruit: The role of seeds in apple. HortTechnology 1999, 9, 317–322. [Google Scholar] [CrossRef]
- Chan, B.G.; Cain, J.C. The effect of seed formation on subsequent flowering in apple. Proc. Amer. Soc. Hort. Sci. 1967, 91, 63–68. [Google Scholar]
- Nitsch, C.; Nitsch, J.P. The induction of flowering in vitro in stem segments of Plumbago indica L.—I. The production of vegetative buds. Planta 1967, 72, 355–370. [Google Scholar] [CrossRef]
- Hoad, G.V. The role of seed derived hormones in the control of flowering in apple. Symp. Growth Regul. Fruit Prod. 1978, 80, 93–104. [Google Scholar] [CrossRef]
- Guitton, B.; Kelner, J.-J.; Celton, J.-M.; Sabau, X.; Renou, J.-P.; Chagné, D.; Costes, E. Analysis of transcripts differentially expressed between fruited and deflowered ‘Gala’adult trees: A contribution to biennial bearing understanding in apple. BMC Plant Biol. 2016, 16, 55. [Google Scholar] [CrossRef] [PubMed]
- Jespersen, D.; Yu, J.; Huang, B. Metabolite Responses to Exogenous Application of Nitrogen, Cytokinin, and Ethylene Inhibitors in Relation to Heat-Induced Senescence in Creeping Bentgrass. PLoS ONE 2015, 10, e0123744. [Google Scholar] [CrossRef]
- Tao, X.; Wu, Q.; Huang, S.; Zhu, B.; Chen, F.; Liu, B.; Cai, L.; Mao, L.; Luo, Z.; Li, L.; et al. Exogenous abscisic acid regulates primary metabolism in postharvest cherry tomato fruit during ripening. Sci. Hortic. 2022, 299, 111008. [Google Scholar] [CrossRef]
- Meza, S.L.R.; de Castro Tobaruela, E.; Pascoal, G.B.; Magalhães, H.C.R.; Massaretto, I.L.; Purgatto, E. Induction of Metabolic Changes in Amino Acid, Fatty Acid, Tocopherol, and Phytosterol Profiles by Exogenous Methyl Jasmonate Application in Tomato Fruits. Plants 2022, 11, 366. [Google Scholar] [CrossRef] [PubMed]
- Bound, S.A.; Jones, K.M.; Koen, T.B.; Oakford, M.J. The thinning effect of benzyladenine on red ‘Fuji’ apple trees. J. Hortic. Sci. 1991, 66, 789–794. [Google Scholar] [CrossRef]
- Gupta, K.; Wani, S.H.; Razzaq, A.; Skalicky, M.; Samantara, K.; Gupta, S.; Pandita, D.; Goel, S.; Grewal, S.; Hejnak, V.; et al. Abscisic Acid: Role in Fruit Development and Ripening. Front. Plant Sci. 2022, 13, 817500. [Google Scholar] [CrossRef] [PubMed]
- Greene, D.W.; Schupp, J.R.; Edwin Winzeler, H. Effect of abscisic acid and benzyladenine on fruit set and fruit quality of apples. HortScience 2011, 46, 604–609. [Google Scholar] [CrossRef]
- Nichols, D.; Embree, C.; Cline, J.; Ju, H.Y. Blossom and fruitlet thinners affect crop load, fruit weight, seed number, and return bloom of ‘Northern Spy’ apple. HortScience 2004, 39, 1309–1312. [Google Scholar] [CrossRef]
- Reddy, P.; Plozza, T.; Ezernieks, V.; Stefanelli, D.; Scalisi, A.; Goodwin, I.; Rochfort, S. Metabolic Pathways for Observed Impacts of Crop Load on Floral Induction in Apple. Int. J. Mol. Sci. 2022, 23, 6019. [Google Scholar] [CrossRef]
- Belhassine, F.; Martinez, S.; Bluy, S.; Fumey, D.; Kelner, J.-J.; Costes, E.; Pallas, B. Impact of Within-Tree Organ Distances on Floral Induction and Fruit Growth in Apple Tree: Implication of Carbohydrate and Gibberellin Organ Contents. Front. Plant Sci. 2019, 10, 01233. [Google Scholar] [CrossRef] [PubMed]
- Xia, J.; Sinelnikov, I.V.; Han, B.; Wishart, D.S. MetaboAnalyst 3.0-making metabolomics more meaningful. Nucleic Acids Res. 2015, 43, W251–W257. [Google Scholar] [CrossRef] [PubMed]
- Kviklys, D.; Čeidaitė, A.; Lanauskas, J.; Uselis, N.; Samuolienė, G. The effect of rootstock on apple tree bearing stability in a cooler climate. Agric. Food Sci. 2016, 25, 81–88. [Google Scholar] [CrossRef]
- Tokuhisa, D.; Shinano, T.; Watanabe, T.; Yamamura, T.; Osaki, M. Promotion of root growth by the application of inosine. Soil Sci. Plant Nutr. 2010, 56, 272–280. [Google Scholar] [CrossRef]
- McLaughlin, J.M.; Greene, D.W. Fruit and Hormones Influence Flowering of Apple. II. Effects of Hormones. J. Am. Soc. Hortic. Sci. Jashs 1991, 116, 450–453. [Google Scholar] [CrossRef]
- Corbesier, L.; Prinsen, E.; Jacqmard, A.; Lejeune, P.; Van Onckelen, H.; Périlleux, C.; Bernier, G. Cytokinin levels in leaves, leaf exudate and shoot apical meristem of Arabidopsis thaliana during floral transition. J. Exp. Bot. 2003, 54, 2511–2517. [Google Scholar] [CrossRef]
- Eshghi, S.; Tafazoli, E. Possible role of cytokinins in flower induction in strawberry. Am. J. Plant Physiol. 2007, 2, 167–174. [Google Scholar] [CrossRef]
- He, Y.W.; Loh, C.S. Induction of early bolting in Arabidopsis thaliana by triacontanol, cerium and lanthanum is correlated with increased endogenous concentration of isopentenyl adenosine (iPAdos). J. Exp. Bot. 2002, 53, 505–512. [Google Scholar] [CrossRef]
- He, Y.W.; Loh, C.S. Cerium and lanthanum promote floral initiation and reproductive growth of Arabidopsis thaliana. Plant Sci. 2000, 159, 117–124. [Google Scholar] [CrossRef]
- Peer, W.A.; Murphy, A.S. Flavonoids as signal molecules: Targets of flavonoid action. In The Science of Flavonoids; Springer: New York, NY, USA, 2006; pp. 239–268. [Google Scholar] [CrossRef]
- Pelletier, M.K.; Burbulis, I.E.; Winkel-Shirley, B. Disruption of specific flavonoid genes enhances the accumulation of flavonoid enzymes and end-products in Arabidopsis seedlings. Plant Mol. Biol. 1999, 40, 45–54. [Google Scholar] [CrossRef]
- Kanehisa, M.; Goto, S. KEGG: Kyoto Encyclopedia of Genes and Genomes. Nucleic Acids Res. 2000, 28, 27–30. [Google Scholar] [CrossRef] [PubMed]
- APAL. Industry Statistics. Available online: https://apal.org.au/programs/industry-data/industry-stats/ (accessed on 17 May 2023).


| Identity | Compound Class | Retention Time (min) | Mass (m/z) [M − H]− | Molecular Formula | Mass Error (ppm) | VIP Score | Effect Size | * | p-Value | MS2 Ions | Metabolite Level |
|---|---|---|---|---|---|---|---|---|---|---|---|
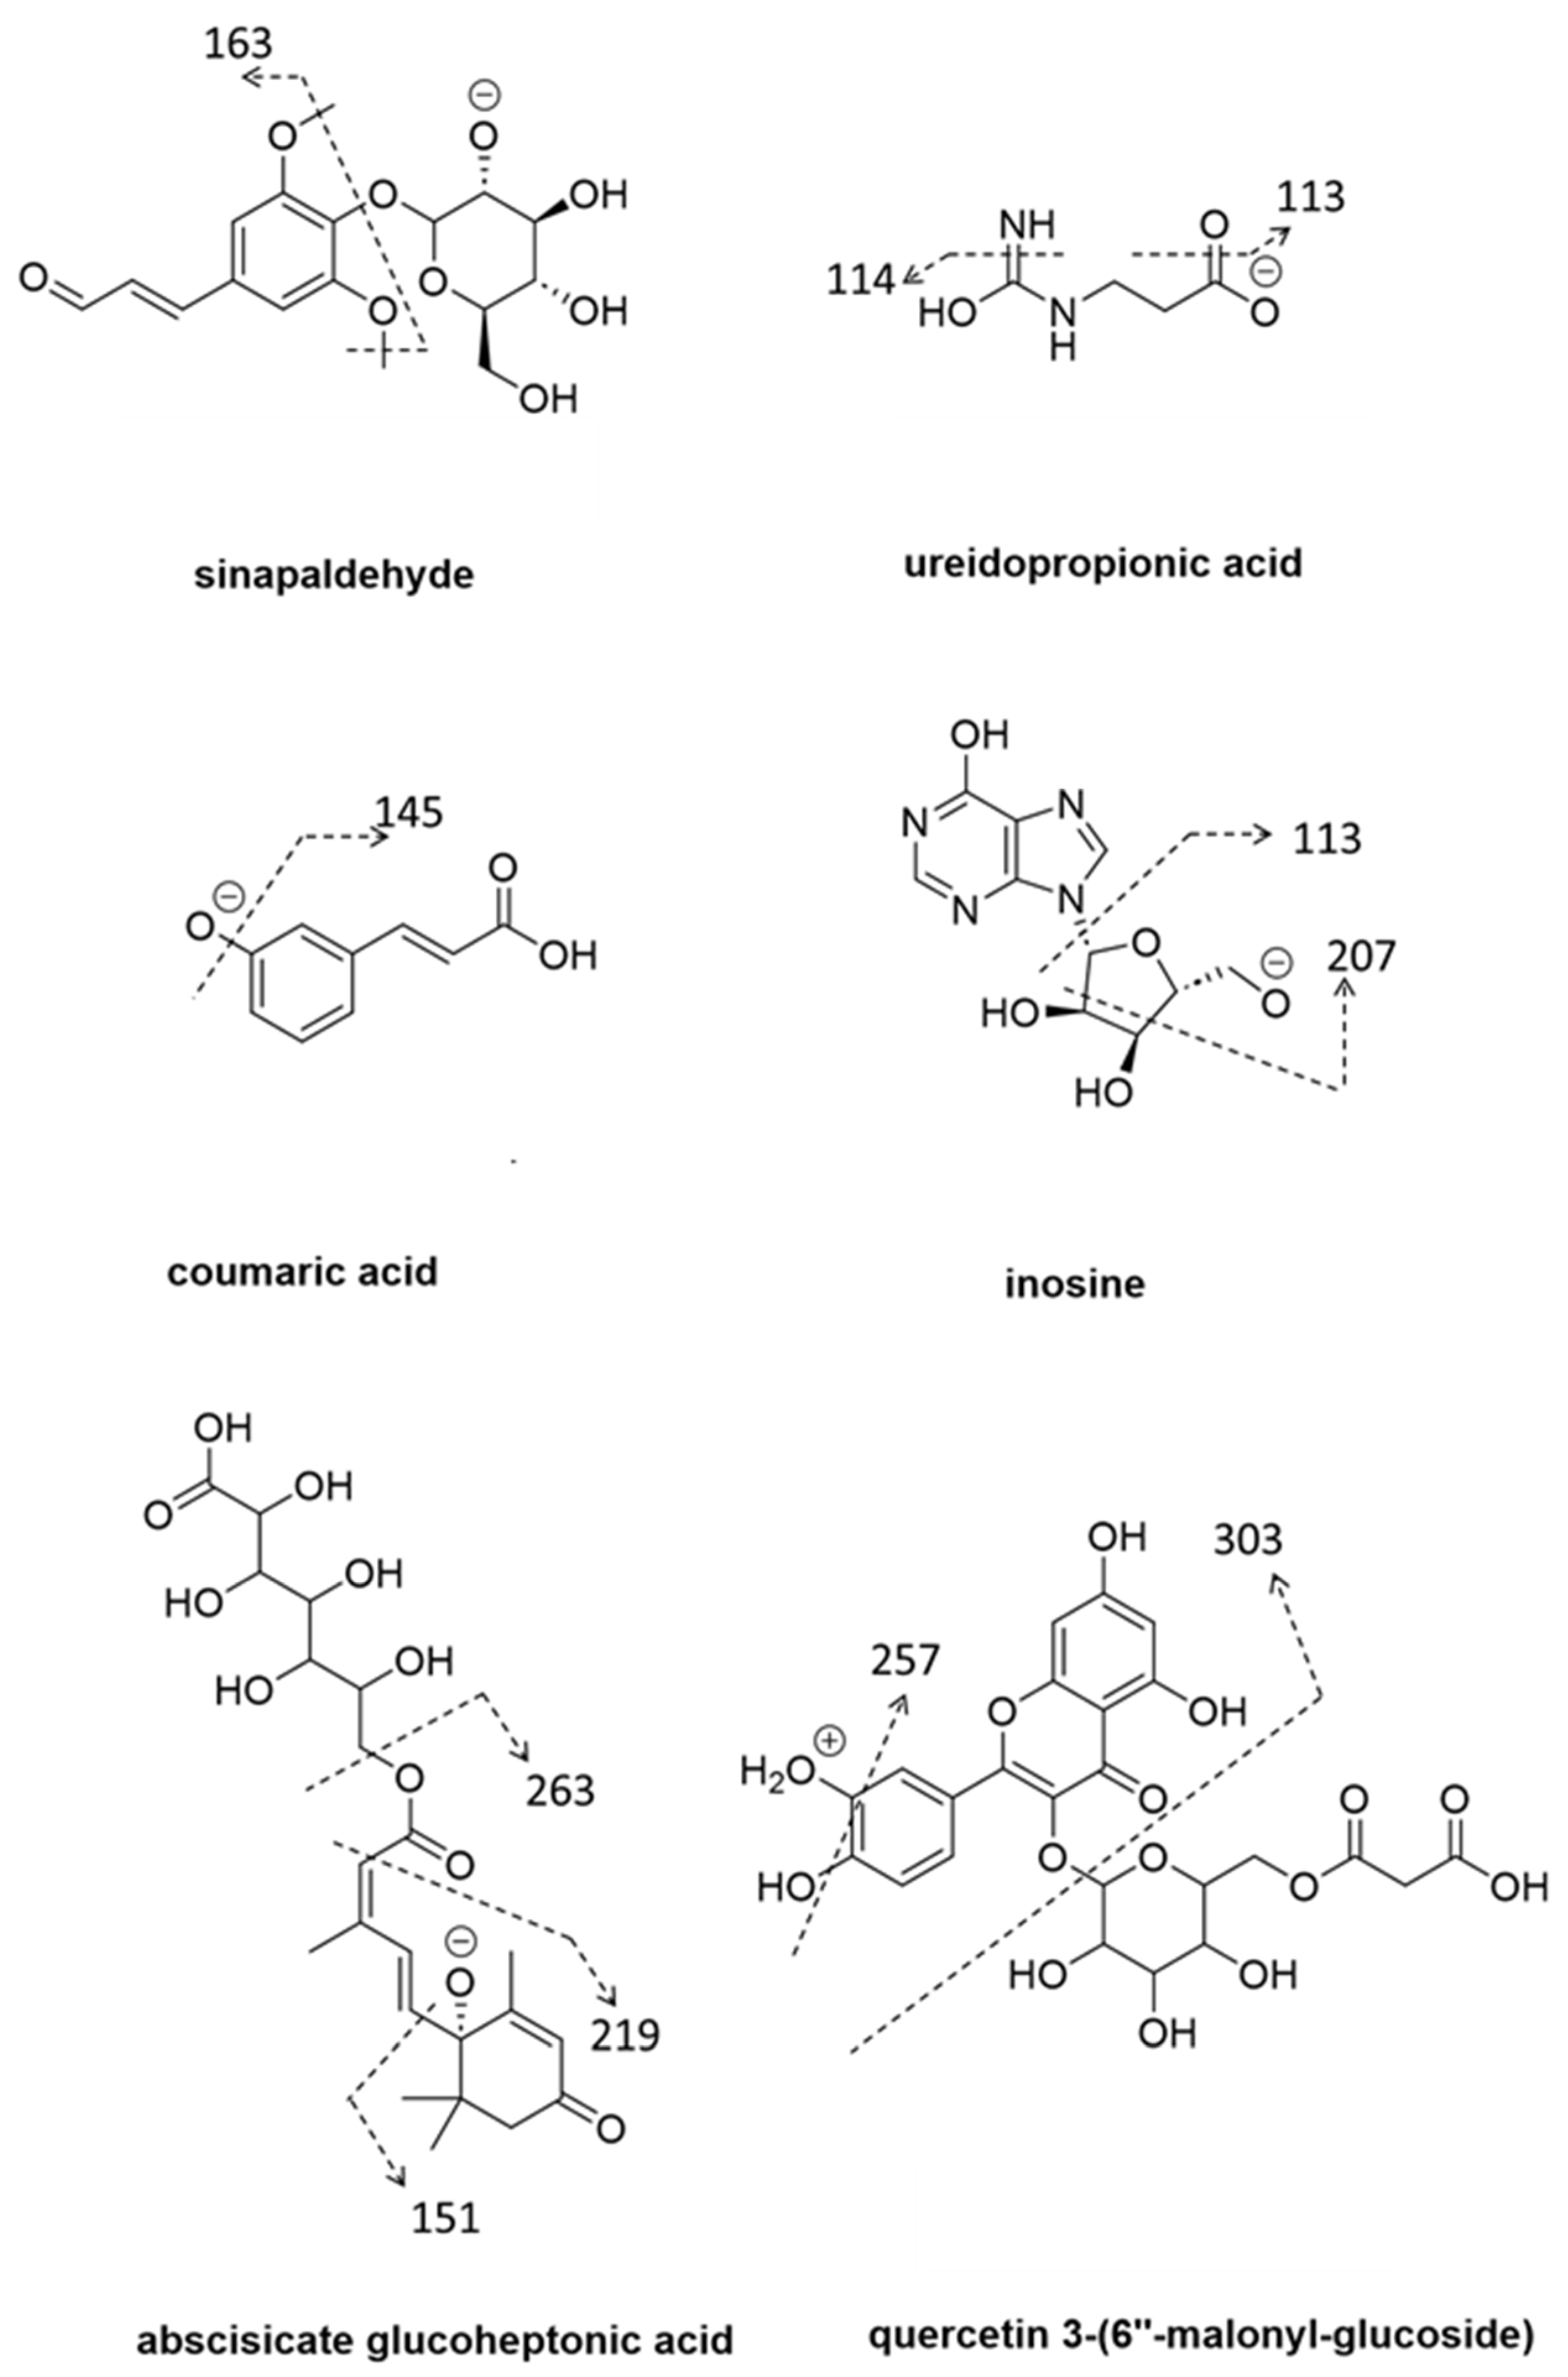
| coumaric acid derivative | phenylpropanoid | 3.85 | 429.1407 | C19H26O11 | −3.7 | 2.78 | 2.36 | ↑ | 6.7 × 10⁻⁷ | 361.1503, 265.0700, 163.0391, 145.0281, 117.0335, 59.0126 | 3 |
| coumaric acid derivative | phenylpropanoid | 3.78 | 459.1512 | C20H28O12 | −3.3 | 2.73 | 2.18 | ↑ | 8.9 × 10⁻⁵ | 265.0715, 235.0715, 205.0500, 163.0391, 145.0285, 119.0492, 117.0335, 89.0233, 59.0126 | 3 |
| sinapaldehyde | phenylpropanoid | 4.29 | 369.1195 | C17H22O9 | −4.1 | 2.51 | 1.88 | ↑ | 5.7 × 10⁻² | 359.1194, 163.0392, 145.0295, 117.0336 | 2 |
| coumaric acid derivative | phenylpropanoid | 5.57 | 473.1452 | C24H26O10 | −2.1 | 2.37 | 1.47 | ↑ | 2.7 × 10⁻³ | 307.0826, 273.0771, 165.0549, 150.0313, 145.0285, 123.0441, 117.0336 | 2 |
| coumaric acid derivative | phenylpropanoid | 4.57 | 383.1352 | C18H24O9 | −3.9 | 2.36 | 1.92 | ↑ | 1.7 × 10⁻¹ | 383.1356, 163.0391, 145.0286, 117.0335 | 2 |
| 2.20 | 206.9884 | 2.35 | 1.44 | ↓ | 1.7 × 10⁻¹ | ||||||
| coumaric acid derivative | phenylpropanoid | 5.38 | 487.1246 | C24H24O11 | −2.3 | 2.35 | 1.40 | ↑ | 5.5 × 10⁻⁴ | 341.0885, 179.0345, 161.0239, 145.0288, 135.0444, 117.0338 | 2 |
| coumarate diglucoside | phenylpropanoid | 3.70 | 489.1618 | C21H30O13 | −3.1 | 2.21 | 2.07 | ↑ | 2.5 × 10⁻⁴ | 163.0393, 145.0286, 119.0492 | 2 |
| 5.34 | 503.1557 | − | 2.18 | 1.31 | ↑ | 1.3 × 10⁻¹ | − | 5 | |||
| 3.09 | 427.0859 | − | 2.16 | 1.49 | ↑ | 1.0 × 10⁻¹ | − | 5 | |||
| 3.09 | 359.0990 | − | 2.15 | 1.54 | ↑ | 1.5 × 10⁻¹ | − | 5 | |||
| 1.32 | 209.0661 | − | 2.13 | 1.55 | ↑ | 6.0 × 10⁻³ | − | 5 | |||
| quercetin 3-(6″-malonyl-glucoside) | flavanol | 4.79 | 549.0890 | C24H22O15 | −2.7 | 2.09 | 1.85 | ↓ | 7.3 × 10⁻⁵ | As per + ve mode (Table 2) | 3 |
| 4.85 | 433.0469 | − | 2.07 | 1.48 | ↓ | 3.5 x10⁻⁵ | − | 5 | |||
| 4.42 | 307.1400 | − | 2.05 | 1.38 | ↑ | 2.1 x10⁻² | − | 5 | |||
| 5.06 | 475.1250 | − | 2.03 | 1.69 | ↑ | 1.1 × 10⁻¹ | − | 5 | |||
| 4.82 | 501.0649 | − | 2.01 | 1.15 | ↓ | 8.9 × 10⁻⁵ | − | 5 | |||
| abscisate glucoheptonic acid | abscisic acid | 4.81 | 471.1869 | C22H32O11 | −1.7 | 2.43 | 1.52 | ↑ | 3.8 x10⁻³ | 263.1291, 219.1391, 151.0755, 125.0600 | 2 |
| inosine derivative | cytokinin | 3.89 | 439.1827 | C19H28N4O8 | −0.9 | 2.42 | 1.22 | ↑ | 1.8 × 10⁻³ | 393.1770, 325.1147, 265.0931, 205.0712, 163.0604 | 3 |
| inosine diglucoside | cytokinin | 1.23 | 475.1781 | C29H24O3N4 | −3.4 | 2.18 | 2.62 | ↑ | 3.3 × 10⁻³ | 343.1250, 179.0551, 131.0452, 113.0346 | 2 |
| inosine derivative | cytokinin | 1.26 | 473.1625 | C19H28N3O11 | 3.2 | 2.01 | 2.16 | ↑ | 8.5 × 10⁻³ | 341.1106, 179.0556, 131.0453, 113.0347 | 3 |
| inosine | cytokinin | 1.27 | 267.0723 | C10H12N4O5 | 0.4 | 2.20 | 1.31 | ↑ | 2.8 × 10⁻³ | 249.0614, 207.0509, 191.0558, 175.0245, 113.0234, 85.0284 | 2 |
| ureidopropionic acid | cytokinin | 1.18 | 131.0452 | C4H8N2O3 | −0.8 | 2.00 | 2.10 | ↑ | 5.7 × 10⁻² | 114.0188, 113.0348, 95.0241 | 2 |
| Identity | Compound Class | Retention Time (min) | Mass (m/z) [M + H]+ | Molecular Formula | Mass Error (ppm) | VIP Score | Effect Size | * | p-Values | MS2 Ions | Metabolite Level |
|---|---|---|---|---|---|---|---|---|---|---|---|
| epicatechin-3′-O-glucuronide | flavanol | 3.85 | 453.1365 | C21H24O11 | 5.7 | 2.53 | 2.23 | ↑ | 3.7 × 10⁻⁶ | 291.0855, 147.0446, 139.0389, 123.0443 | 2 |
| cytokinin derivative | cytokinin | 4.81 | 449.1775 | C16H26N5O10 | −5.1 | 2.46 | 1.53 | ↑ | 1.4 × 10⁻¹ | 287.1249, 269.1140, 185.0420, 153.0185 | 2 |
| inosine diglucoside | cytokinin | 1.23 | 477.1919 | C29H24N4O3 | −0.4 | 2.39 | 3.14 | ↑ | 4.9 × 10⁻³ | 133.0608, 116.0344, 87.0556, 74.0241 | 2 |
| inosine derivative | cytokinin | 1.28 | 475.1765 | − | − | 2.39 | 3.07 | ↑ | 2.0 × 10⁻¹ | 133.0610, 116.0346, 87.0557, 74.0241 | 3 |
| 4.82 | 267.0431 | − | − | 2.31 | 1.14 | ↓ | 2.5 × 10⁻¹ | 5 | |||
| 5.57 | 497.1410 | − | − | 2.28 | 1.61 | ↑ | 2.4 × 10⁻³ | - | |||
| quercetin 3-(6″-malonyl-glucoside) | flavanol | 4.79 | 551.1024 | C24H22O15 | 1.3 | 2.26 | 1.90 | ↓ | 6.7 × 10⁻³ | 303.0497, 257.0431, 231.0494, 153.0187 | 2 |
| (2R)-3-(3,4-dihydroxyphenyl)-2-hydroxypropanoate | phenylpropanoid | 3.09 | 199.0601 | C9H10O5 | 0.0 | 2.25 | 1.49 | ↑ | 6.0 × 10⁻² | 155.0702, 140.0468, 123.0442, 95.0495 | 2 |
| flavanol | 4.83 | 454.0647 | − | − | 2.25 | 1.27 | ↓ | 5.3 × 10⁻³ | − | 5 | |
| 1.21 | 315.1392 | − | − | 2.25 | 2.34 | ↑ | 7.1 × 10⁻² | − | 5 | ||
| 4.57 | 407.1309 | − | − | 2.25 | 1.82 | ↑ | 7.8 × 10⁻³ | − | 2 | ||
| 4.82 | 671.1072 | − | − | 2.20 | 1.66 | ↓ | 5.8 × 10⁻³ | − | 5 | ||
| 9.61 | 537.3027 | − | − | 2.19 | 1.78 | ↑ | 9.6 × 10⁻⁴ | − | 5 | ||
| 1.82 | 256.1288 | − | − | 2.19 | 2.16 | ↑ | 1.7 × 10⁻² | − | 5 | ||
| ureidopropionic acid | cytokinin | 1.19 | 133.0606 | C4H7N2O3 | 2.18 | 2.70 | ↑ | 6.1 × 10⁻² | 116.0344, 87.0557, 74.0241 | 2 | |
| 1.34 | 256.1287 | − | 2.16 | 2.12 | ↑ | 3.1 × 10⁻² | − | 5 | |||
| 1.28 | 112.9999 | − | 2.15 | 1.68 | ↑ | 1.7 × 10⁻³ | − | 5 | |||
| 3.09 | 383.0949 | − | 2.15 | 1.42 | ↑ | 7.1 × 10⁻² | − | 5 | |||
| leucine | amino acid | 2.40 | 132.1020 | C6H13NO2 | −0.8 | 2.11 | 1.57 | ↑ | 6.3 × 10⁻² | 86.0968, 69.0703 | 2 |
| 1.27 | 85.0287 | C4H4O2 | −3.5 | 2.11 | 1.18 | ↓ | 9.3 × 10⁻⁵ | − | |||
| L-carnitine | amino acid | 1.25 | 162.1122 | 2.04 | 2.51 | ↑ | 9.5 × 10⁻² | 144.0656, 116.0709, 98.0604 | 2 | ||
| aspartyl-aspartate | dipeptide | 1.32 | 249.0713 | C8H12N2O7 | 1.7 | 2.02 | 2.62 | ↑ | 9.4 × 10⁻³ | 232.0450, 214.0347, 204.0502, 186.0398 | 2 |
| aminoisobutyrate | cytokinin | 1.22 | 104.0708 | C4H9NO2 | −1.9 | 2.02 | 1.78 | ↑ | 4.4 × 10⁻² | 87.0445, 60.0812, 58.0655 | 2 |
| 4.81 | 891.1567 | − | − | 2.02 | 1.29 | ↓ | 1.9 × 10⁻³ | − | |||
| methoxy coumarin | phenylpropanoid | 5.84 | 177.0546 | C10H8O3 | 0.0 | 2.00 | 1.27 | ↑ | 1.7 × 10⁻² | 145.0283, 117.0335, 89.0388 | 2 |
| Identity | Compound Class | Retention Time (min) | Mass (m/z) [M − H]− | Molecular Formula | Mass Error (ppm) | VIP Score | Effect Size | * | p-Value | MS2 Ions | Metabolite Level |
|---|---|---|---|---|---|---|---|---|---|---|---|
| quercetin-3-arabinoside | flavanol | 4.87 | 433.0775 | C20H18O11 | −2.3 | 2.3 | 1.2 | ↓ | 3.1 × 10⁻² | 300.0279, 271.0252, 255.0298, 243.0299 | 2 |
| naringenin glucoside | flavanol | 5.42 | 433.1147 | C21H22O10 | 4.1 | 2.2 | 1.5 | ↓ | 1.1 × 10⁻² | 271.0602, 255.0299, 253.0505, 151.0029, | 2 |
| coumaric acid | phenylpropanoid | 3.70 | 489.1618 | C21H30O13 | −3.1 | 2.2 | 1.6 | ↑ | 3.9 × 10⁻⁴ | 325.1147, 265.0719, 163.0393, 145.0286, | 2 |
| gingerol | phenolic | 8.70 | 293.1762 | C17H26O4 | −5.1 | 2.1 | 1.1 | ↓ | 2.1 × 10⁻¹ | 249.1861, 193.1593, 136.0885 | 2 |
| sinensin | flavanol | 5.17 | 449.1094 | C21H22O11 | −3.6 | 2.1 | 3.2 | ↓ | 1.0 × 10⁻² | 287.0566, 151.0028, 135.0442, 107.0128 | 2 |
| apigenin-O-(malonyl-glucoside) | flavanol | 5.17 | 517.0967 | C24H22O13 | 1.9 | 2.1 | 3.5 | ↓ | 3.6 × 10⁻¹ | - | 3 |
| dalpatein-apiofuranosyl-glucopyranoside | flavanol | 4.96 | 635.1596 | C29H32O16 | 1.7 | 2.1 | 1.6 | ↓ | 1.8 × 10⁻² | 589.1551, 567.1729, 463.0878, 316.0229 | 2 |
| tetrahydroxyanthraquinone | quinone | 3.70 | 375.0698 | C18H16O9 | −3.5 | 2.1 | 1.4 | ↓ | 1.9 × 10⁻⁴ | 357.0582, 201.0164, 189.0163, 179.0342, 161.0235, 135.0442 | 2 |
| hydroxycinnamate | phenylpropanoid | 5.57 | 473.1452 | C24H26O10 | −2.1 | 2.1 | 1.4 | ↑ | 1.5 × 10⁻² | 307.0826, 273.0771, 165.0549, 150.0313, 145.0285, 123.0441,117.0336 | 2 |
| coumarate glycoside | phenylpropanoid | 3.78 | 459.1512 | C20H28O12 | −3.3 | 2.0 | 1.6 | ↑ | 8.5 × 10⁻⁴ | 265.0715, 235.0715, 205.0500, 163.0391, 145.0285, 119.0492, 117.0335, 89.0233, 59.0126 | 2 |
| methoxy cinnamate | phenylpropanoid | 6.44 | 177.0550 | C10H10O3 | −2.3 | 2.0 | 1.8 | ↑ | 4.0 × 10⁻⁶ | 162.0315, 145.0267, 123.0442, 121.0286 | 2 |
| phenylpropanoid | 4.94 | 567.1719 | 2.0 | 1.5 | ↑ | 4.6 × 10⁻² | 273.0772, 167.0343, 123.0441, 81.0334 | 4 | |||
| hydroxycinnamate | phenylpropanoid | 3.85 | 429.1407 | C19H26O11 | −3.7 | 2.0 | 1.6 | ↑ | 2.8 × 10⁻⁴ | 361.1503, 265.0700, 163.0391, 145.0281, 117.0335 | 2 |
| - | 4.78 | 737.1725 | 2.0 | 2.8 | ↓ | 6.7 × 10⁻⁶ | 575.1197, 407.0775, 395.0775, 243.0297 | 5 |
| Identity | Compound Class | Retention Time (min) | Mass (m/z) [M + H]+ | Molecular Formula | Mass Error (ppm) | VIP Score | Effect Size | * | p-Value | MS2 Ions | Metabolite Level |
|---|---|---|---|---|---|---|---|---|---|---|---|
| naringenin | flavanol | 3.41 | 273.0756 | C15H12O5 | 0.4 | 2.56 | 2.14 | ↑ | 1.5 × 10⁻⁵ | 243.0650, 215.0702, 151.0389, 123.0442 | 2 |
| 1.44 | 247.0422 | − | − | 2.47 | 1.58 | ↑ | 1.3 × 10⁻⁴ | 229.0319, 173.0209, 97.0283 | 5 | ||
| 1.38 | 261.0577 | − | − | 2.44 | 1.57 | ↑ | 5.5 × 10⁻⁴ | − | 5 | ||
| 1.42 | 324.0341 | − | − | 2.42 | 1.75 | ↑ | 2.6 × 10⁻³ | − | 5 | ||
| 4.57 | 407.1309 | − | − | 2.34 | 1.46 | ↑ | 2.2 × 10⁻³ | − | 5 | ||
| 1.24 | 295.0784 | − | − | 2.25 | 1.69 | ↑ | 9.0 × 10⁻⁴ | − | 5 | ||
| flavanol derivative | flavanol | 5.42 | 435.1279 | C21H22O10 | 1.6 | 2.21 | 1.62 | ↓ | 1.4 × 10⁻² | 303.0498, 273.0754, 229.0493, 153.0181 | 3 |
| 4.81 | 891.1567 | − | − | 2.18 | 1.35 | ↓ | 1.9 × 10⁻² | − | |||
| hydroxycinnamic acid | phenylpropanoid | 3.80 | 165.0544 | C9H8O3 | 1.2 | 2.15 | 1.57 | ↑ | 5.7 × 10⁻³ | 147.0441, 119.0493, 91.0546 | 2 |
| 1.28 | 112.9999 | − | − | 2.14 | 1.67 | ↑ | 1.1 × 10⁻³ | − | 5 | ||
| 5.17 | 451.1233 | − | − | 2.11 | 2.03 | ↓ | 9.1 × 10⁻³ | − | 5 | ||
| 5.42 | 273.0756 | − | − | 2.11 | 1.55 | ↓ | 2.0 × 10⁻² | − | 5 | ||
| avicularin (flavanol glucoside) | flavanol | 4.89 | 435.0913 | C20H18O11 | 2.1 | 2.09 | 1.28 | ↓ | 9.7 × 10⁻² | 303.0498, 273.0757, 229.0494, 153.0182 | 2 |
| adenosine | cytokinin | 1.32 | 268.1035 | C10H13N5O4 | 1.9 | 2.08 | 2.60 | ↑ | 2.1 × 10⁻² | 245.2293, 136.0617, 91.0577, 77.0421 | 2 |
| unknown cytokinin derivative glucoside | cytokinin | 5.57 | 497.1410 | C19H22N5O11 | −4.2 | 2.06 | 1.44 | ↑ | 1.8 × 10⁻³ | 331.0780, 189.0524 | 3 |
| eriodictyol | flavanol | 5.17 | 289.0703 | C15H12O6 | 1.4 | 2.04 | 4.10 | ↓ | 2.2 × 10⁻² | 163.0390, 153.0182, 135.0441, 123.0442 | 2 |
| 5.74 | 277.0640 | − | − | 2.01 | 1.40 | ↑ | 1.9 × 10⁻³ | − | 5 | ||
| adenosine 5′-monophosphate | cytokinin | 1.32 | 348.0699 | − | − | 2.00 | 1.62 | ↑ | 3.1 × 10⁻³ | − | 2 |
| 3.69 | 491.1752 | − | − | 2.00 | 1.47 | ↑ | 5.5 × 10⁻⁴ | − |
Disclaimer/Publisher’s Note: The statements, opinions and data contained in all publications are solely those of the individual author(s) and contributor(s) and not of MDPI and/or the editor(s). MDPI and/or the editor(s) disclaim responsibility for any injury to people or property resulting from any ideas, methods, instructions or products referred to in the content. |
© 2024 by the authors. Licensee MDPI, Basel, Switzerland. This article is an open access article distributed under the terms and conditions of the Creative Commons Attribution (CC BY) license (https://creativecommons.org/licenses/by/4.0/).
Share and Cite
Reddy, P.; Plozza, T.; Scalisi, A.; Ezernieks, V.; Goodwin, I.; Rochfort, S. Zonal Chemical Signal Pathways Mediating Floral Induction in Apple. Metabolites 2024, 14, 251. https://doi.org/10.3390/metabo14050251
Reddy P, Plozza T, Scalisi A, Ezernieks V, Goodwin I, Rochfort S. Zonal Chemical Signal Pathways Mediating Floral Induction in Apple. Metabolites. 2024; 14(5):251. https://doi.org/10.3390/metabo14050251
Chicago/Turabian StyleReddy, Priyanka, Tim Plozza, Alessio Scalisi, Vilnis Ezernieks, Ian Goodwin, and Simone Rochfort. 2024. "Zonal Chemical Signal Pathways Mediating Floral Induction in Apple" Metabolites 14, no. 5: 251. https://doi.org/10.3390/metabo14050251