
Serum Uric Acid Levels Are Associated with the Echogenic Features of Carotid Plaque Vulnerability in Elderly Patients with Atherosclerotic Disease

 ,
,
Abstract
:1. Introduction
2. Materials and Methods
2.1. Subjects
2.2. Laboratory Analysis
2.3. Ultrasound Method
2.4. Plaque Echogenicity
2.5. Statistical Analysis
3. Results
4. Discussion
5. Conclusions
Author Contributions
Funding
Institutional Review Board Statement
Informed Consent Statement
Data Availability Statement
Conflicts of Interest
References
- Culleton, B.F.; Larson, M.G.; Kannel, W.B.; Levy, D. Serum uric acid and risk for cardiovascular disease and death: The Framingham Heart Study. Ann. Intern. Med. 1999, 131, 7–13. [Google Scholar] [CrossRef] [PubMed]
- Kimura, Y.; Tsukui, D.; Kono, H. Uric Acid in Inflammation and the Pathogenesis of Atherosclerosis. Int. J. Mol. Sci. 2021, 22, 12394. [Google Scholar] [CrossRef] [PubMed]
- Nardi, V.; Franchi, F.; Prasad, M.; Fatica, E.M.; Alexander, M.P.; Bois, M.C.; Lam, J.; Singh, R.J.; Meyer, F.B.; Lanzino, G.; et al. Uric Acid Expression in Carotid Atherosclerotic Plaque and Serum Uric Acid Are Associated with Cerebrovascular Events. Hypertension 2022, 79, 1814–1823. [Google Scholar] [CrossRef] [PubMed]
- Casiglia, E.; Tikhonoff, V.; Virdis, A.; Grassi, G.; Angeli, F.; Barbagallo, C.M.; Bombelli, M.; Cicero, A.F.G.; Cirillo, M.; Cirillo, P.; et al. Working Group on Uric Acid and Cardiovascular Risk of the Italian Society of Hypertension (SIIA). Serum uric acid/serum creatinine ratio as a predictor of cardiovascular events. Detection of prognostic cardiovascular cut-off values. J. Hypertens. 2023, 41, 180–186. [Google Scholar] [CrossRef] [PubMed]
- Al-Daghri, N.M.; Al-Attas, O.S.; Wani, K.; Sabico, S.; Alokail, M.S. Serum uric acid to creatinine ratio and risk of metabolic syndrome in Saudi type 2 diabetic patients. Sci. Rep. 2017, 7, 12104. [Google Scholar] [CrossRef]
- Ding, Z.; Fan, Y.; Yao, C.; Gu, L. The association between the serum uric acid to creatinine ratio and all-cause mortality in elderly hemodialysis patients. BMC Nephrol. 2022, 23, 177. [Google Scholar] [CrossRef]
- Ephraim, R.K.D.; Awuku, Y.A.; Numekevor, P.; Botchway, F.; Adoba, P.; Dadzie, E.K.; Abrefa, C.A.; Abaka-Yawson, A. Serum Uric acid is a better indicator of kidney impairment than serum uric acid to creatine ratio; a cross sectional study of type 2 diabetes mellitus patients. J. Diab. Metab. Dis. 2021, 20, 313–320. [Google Scholar] [CrossRef]
- Kocak, N.D.; Sasak, G.; Akturk, U.A.; Akgun, M.; Boga, S.; Sengul, A.; Gungor, S.; Arinc, S. Serum uric acid levels and uric acid/creatinine ratios in stable chronic obstructive pulmonary disease (COPD) patients: Are these parameters efficient predictors of patients at risk for exacerbation and/or severity of disease? Med. Sci. Monit. 2016, 22, 4169–4176. [Google Scholar] [CrossRef]
- Tao, J.; Shen, X.; Li, J.; Cha, E.; Gu, P.P.; Liu, J.; Zhu, W.; He, L.-L.; Li, G.-Q.; Wang, Z. Serum uric acid to creatinine ratio and metabolic syndrome in postmenopausal Chinese women. Medicine 2020, 99, e19959. [Google Scholar] [CrossRef]
- Desideri, G.; Borghi, C. Xanthine oxidase inhibition and cardiovascular protection: Don’t shoot in the dark. Eur. J. Int. Med. 2023. [Google Scholar] [CrossRef]
- Migdalski, A.; Jawien, A. New insight into biology, molecular diagnostics and treatment options of unstable carotid atherosclerotic plaque: A narrative review. Ann. Transl. Med. 2021, 9, 1207. [Google Scholar] [CrossRef] [PubMed]
- Brinjikji, W.; Huston, J., 3rd; Rabinstein, A.A.; Kim, G.M.; Lerman, A.; Lanzino, G. Contemporary carotid imaging: From degree of stenosis to plaque vulnerability. J. Neurosurg. 2016, 124, 27–42. [Google Scholar] [CrossRef] [PubMed]
- Naylor, R.; Rantner, B.; Ancetti, S.; de Borst, G.J.; De Carlo, M.; Halliday, A.; Kakkos, S.K.; Markus, H.S.; McCabe, D.J.H.; Sillesen, H.; et al. Editor’s Choice—European Society for Vascular Surgery (ESVS) 2023 Clinical Practice Guidelines on the Management of Atherosclerotic Carotid and Vertebral Artery Disease. Eur. J. Vasc. Endovasc. Surg. 2023, 65, 7–111. [Google Scholar] [CrossRef] [PubMed]
- Saba, L.; Saam, T.; Jäger, H.R.; Yuan, C.; Hatsukami, T.S.; Saloner, D.; Wasserman, B.A.; Bonati, L.H.; Wintermark, M. Imaging biomarkers of vulnerable carotid plaques for stroke risk prediction and their potential clinical implications. Lancet Neurol. 2019, 18, 559–572. [Google Scholar] [CrossRef]
- Carballo-Perich, L.; Puigoriol-Illamola, D.; Bashir, S.; Terceño, M.; Silva, U.Y.; Gubern-Mérida, C.; Serena, J. Clinical Parameters and Epigenetic Biomarkers of Plaque Vulnerability in Patients with Carotid Stenosis. Int. J. Mol. Sci. 2022, 23, 5149. [Google Scholar] [CrossRef]
- Mitchell, C.C.; Stein, J.H.; Cook, T.D.; Salamat, S.; Wang, X.; Varghese, T.; Jackson, D.C.; Sandoval Garcia, C.; Wilbrand, S.M.; Dempsey, R.J. Histopathologic Validation of Grayscale Carotid Plaque Characteristics Related to Plaque Vulnerability. Ultrasound Med. Biol. 2017, 43, 129–137. [Google Scholar] [CrossRef]
- Elatrozy, T.; Nicolaides, A.; Tegos, T.; Zarka, A.Z.; Griffin, M.; Sabetai, M. The effect of B-mode ultrasonic image standardisation on the echodensity of symptomatic and asymptomatic carotid bifurcation plaques. Int. Angiol. 1998, 17, 179–186. [Google Scholar]
- Salem, M.K.; Bown, M.J.; Sayers, R.D.; West, K.; Moore, D.; Nicolaides, A.; Robinson, T.G.; Naylor, A.R. Identification of patients with a histologically unstable carotid plaque using ultrasonic plaque image analysis. Eur. J. Vasc. Endovasc. Surg. 2014, 48, 118–125. [Google Scholar] [CrossRef]
- Nicolaides, A.N.; Kakkos, S.K.; Kyriacou, E.; Griffin, M.; Sabetai, M.; Thomas, D.J.; Tegos, T.; Geroulakos, G.; Labropoulos, N.; Doré, C.J.; et al. Asymptomatic internal carotid artery stenosis and cerebrovascular risk stratification. J. Vasc. Surg. 2010, 52, 1486–1496.e1-5. [Google Scholar] [CrossRef]
- Kakkos, S.K.; Griffin, M.B.; Nicolaides, A.N.; Kyriacou, E.; Sabetai, M.M.; Tegos, T.; Makris, G.C.; Thomas, D.J.; Geroulakos, G. Asymptomatic Carotid Stenosis and Risk of Stroke (ACSRS) Study Group. Asymptomatic Carotid Stenosis and Risk of Stroke (ACSRS) Study Group. The size of juxtaluminal hypoechoic area in ultrasound images of asymptomatic carotid plaques predicts the occurrence of stroke. J. Vasc. Surg. 2013, 57, 609–618. [Google Scholar]
- Rozalski, R.; Migdalski, A.; Gackowski, D.; Guz, J.; Siomek, A.; Foksinski, M.; Szpila, A.; Zarakowska, E.; Majer, M.; Jawien, A.; et al. Does morphology of carotid plaque depend on patient’s oxidative stress? Clin. Biochem. 2013, 46, 1030–1035. [Google Scholar] [CrossRef] [PubMed]
- Mastroiacovo, D.; Mengozzi, A.; Dentali, F.; Pomero, F.; Virdis, A.; Camerota, A.; Muselli, M.; Necozione, S.; Bocale, R.; Ferri, C.; et al. Enhanced Carotid Plaque Echolucency Is Associated with Reduced Cognitive Performance in Elderly Patients with Atherosclerotic Disease Independently on Metabolic Profile. Metabolites 2023, 13, 478. [Google Scholar] [CrossRef] [PubMed]
- Touboul, P.J.; Hennerici, M.G.; Meairs, S.; Adams, H.; Amarenco, P.; Bornstein, N.; Csiba, L.; Desvarieux, M.; Ebrahim, S.; Hernandez Hernandez, R.; et al. Mannheim carotid intima-media thickness and plaque consensus (2004–2006–2011). An update on behalf of the advisory board of the 3rd, 4th and 5th watching the risk symposia, at the 13th, 15th and 20th European Stroke Conferences, Mannheim, Germany, 2004, Brussels, Belgium, 2006, and Hamburg, Germany, 2011. Cerebrovasc. Dis. 2012, 34, 290–296. [Google Scholar] [PubMed]
- Inker, L.A.; Eneanya, N.D.; Coresh, J.; Tighiouart, H.; Wang, D.; Sang, Y.; Crews, D.C.; Doria, A.; Estrella, M.M.; Froissart, M.; et al. for the Chronic Kidney Disease Epidemiology Collaboration. New Creatinine- and Cystatin C-Based Equations to Estimate GFR without Race. N. Engl. J. Med. 2021, 385, 1737–1749. [Google Scholar] [CrossRef]
- Sprynger, M.; Rigo, F.; Moonen, M.; Aboyans, V.; Edvardsen, T.; De Alcantara, M.L.; Brodmann, M.; Naka, K.; Kownator, S.; Simova, I.; et al. Focus on echovascular imaging assessment of arterial disease: Complement to the ESC guidelines (PARTIM 1) in collaboration with the working group on aorta and peripheral vascular diseases. Eur. Heart J. Cardiovasc. Imaging 2018, 19, 1195–1221. [Google Scholar] [CrossRef]
- Griffin, M.; Nicolaides, A.; Kyriacou, E. Normalisation of ultrasonic images of atherosclerotic plaques and reproducibility of grey scale median using dedicated software. Int. Angiol. 2007, 26, 372–377. [Google Scholar]
- Moriwaki, Y. Effects on uric acid metabolism of the drugs except the antihyperuricemics. J. Bioequivalence Bioavailab. 2014, 6, 010–017. [Google Scholar] [CrossRef]
- Desideri, G.; Virdis, A.; Casiglia, E.; Borghi, C. Exploration into uric and cardiovascular disease: Uric Acid Right for Heart Health (URRAH) project. A study protocol for a retrospective observational study. High Blood Press. Cardiovasc. Prev. 2018, 25, 197–202. [Google Scholar] [CrossRef]
- Virdis, A.; Masi, S.; Casiglia, E.; Tikhonoff, V.; Cicero, A.F.G.; Ungar, A.; Rivasi, G.; Salvetti, M.; Barbagallo, C.M.; Bombelli, M.; et al. Identification of the uric acid thresholds predicting an increased total and cardiovascular mortality over 20 years. Hypertension 2020, 75, 302–308. [Google Scholar] [CrossRef]
- Casiglia, E.; Tikhonoff, V.; Virdis, A.; Masi, S.; Barbagallo, C.M.; Bombelli, M.; Cirillo, M.; Cirillo, P.; Desideri, G.; D’Elia, L.; et al. Serum uric acid and fatal myocardial infarction: Detection of prognostic cut-off values: The URRAH (Uric Acid Right for Heart Health) study. J. Hypertens. 2020, 38, 412–419. [Google Scholar] [CrossRef]
- Tikhonoff, V.; Casiglia, E.; Spinella, P.; Barbagallo, C.M.; Bombelli, M.; Cicero, A.F.G.; Cirillo, M.; Cirillo, P.; Desideri, G.; D’Elia, L.; et al. Identification of a plausible serum uric acid cut-off value as prognostic marker of stroke: The Uric Acid Right for Heart Health (URRAH) study. J. Hum. Hypertens. 2021, 36, 976–982. [Google Scholar] [CrossRef] [PubMed]
- Muiesan, M.L.; Salvetti, M.; Virdis, A.; Masi, S.; Casiglia, E.; Tikhonoff, V.; Barbagallo, C.M.; Bombelli, M.; Cicero, A.F.G.; Cirillo, M.; et al. Serum uric acid predicts heart failure in a large Italian cohort: Search for a cut-off value the Uric Acid Right for Heart Health study. J. Hypertens. 2021, 39, 62–69. [Google Scholar] [CrossRef] [PubMed]
- Masulli, M.; D’Elia, L.; Angeli, F.; Barbagallo, C.M.; Bilancio, G.; Bombelli, M.; Bruno, B.; Casiglia, E.; Cianci, R.; Cicero, A.F.G.; et al. Serum uric acid levels threshold for mortality in diabetic individuals: The Uric Acid Right for Heart Health (URRAH) project. Nutr. Metab. Cardiovasc. Dis. 2022, 32, 1245–1252. [Google Scholar] [CrossRef] [PubMed]
- Ungar, A.; Rivasi, G.; Di Bari, M.; Virdis, A.; Casiglia, E.; Masi, S.; Mengozzi, A.; Barbagallo, C.M.; Bombelli, M.; Bruno, B.; et al. The association of uric acid with mortality modifies at old age: Data from the Uric Acid Right for Heart Health (URRAH) study. J. Hypertens. 2022, 40, 704–711. [Google Scholar] [CrossRef]
- Desideri, G.; Rajzer, M.; Gerritsen, M.; Nurmohamed, M.T.; Giannattasio, C.; Tausche, A.K.; Borghi, C. Effects of intensive urate lowering therapy with febuxostat in comparison with allopurinol on pulse wave velocity in patients with gout and increased cardiovascular risk: The FORWARD study. Eur. Heart J. Cardiovasc. Pharmacother. 2022, 8, 236–242. [Google Scholar] [CrossRef] [PubMed]
- El-Barghouty, N.; Levine, T.; Ladva, S.; Flanagan, A.; Nicolaides, A. Histological verification of computerised carotid plaque characterisation. Eur. J. Vasc. Endovasc. Surg. 1996, 11, 414–416. [Google Scholar] [CrossRef]
- Grønholdt, M.L.; Nordestgaard, B.G.; Wiebe, B.M.; Wilhjelm, J.E.; Sillesen, H. Echo-Lucency of Computerized Ultrasound Images of Carotid Atherosclerotic Plaques Are Associated with Increased Levels of Triglyceride-Rich Lipoproteins as Well as Increased Plaque Lipid Content. Circulation 1998, 97, 34–40. [Google Scholar] [CrossRef]
- Polito, L.; Bortolotti, M.; Battelli, M.G.; Bolognesi, A. Xanthine oxidoreductase: A leading actor in cardiovascular disease drama. Redox Biol. 2021, 48, 102195. [Google Scholar] [CrossRef]
- Ganji, M.; Nardi., V.; Prasad, M.; Jordan, K.L.; Bois, M.C.; Franchi, F.; Zhu, X.Y.; Tang, H.; Young, M.D.; Lerman, L.O.; et al. Carotid Plaques from Symptomatic Patients Are Characterized by Local Increase in Xanthine Oxidase Expression. Stroke 2021, 52, 2792–2801. [Google Scholar] [CrossRef]
- Sabetai, M.M.; Tegos, T.J.; Nicolaides, A.N.; Dhanjil, S.; Pare, G.J.; Stevens, J.M. Reproducibility of computer-quantified carotid plaque echogenicity: Can we overcome the subjectivity? Stroke 2000, 31, 2189–2196. [Google Scholar] [CrossRef]
- Steffel, C.N.; Brown, R.; Korcarz, C.E.; Varghese, T.; Stein, J.H.; Wilbrand, S.M.; Dempsey, R.J.; Mitchell, C.C. Influence of Ultrasound System and Gain on Grayscale Median Values. J. Ultrasound Med. 2019, 38, 307–319. [Google Scholar] [CrossRef] [PubMed]


| Age | 72.7 ± 5.9 |
| Gender (males/females) | 58/50 |
| BMI (kg/m2) | 27.5 ± 4.1 |
| Total cholesterol (mg/L) | 196.9 ± 46.6 |
| HDL-C (mg/dL) | 47.9 ± 12.5 |
| LDL-C (mg/dL) | 118.3 ± 44.1 |
| Triglyceride (mg/dL) | 156.0 ± 69.2 |
| SBP (mmHg) | 139.2 ± 14.7 |
| DBP (mmHg) | 78.5 ± 7.6 |
| GSM | 31.5 ± 13.7 |
| NASCET (%) | 44.4 ± 20.9 |
| Hypertension, n (%) | 88 (81.5%) |
| Hypercholesterolemia, n (%) | 79 (73.2%) |
| Diabetes mellitus, n (%) | 22 (20.4%) |
| Smoking, n (%) | 16 (14.8%) |
| Creatinine (mg/dL) | 1.0 ± 0.2 |
| eGFR (mL/min/1.73 m2) | 71.1 ± 16.7 |
| SUA (mg/dL) | 6.1 ± 1.8 |
| SUA/SCr ratio | 6.2 ± 2.1 |
| Coefficient | p-Value | |
|---|---|---|
| Age | −0.076 | 0.434 |
| BMI | 0.053 | 0.585 |
| Total cholesterol | −0.082 | 0.399 |
| HDL-C | 0.060 | 0.541 |
| LDL-C | −0.037 | 0.706 |
| Triglyceride | −0.109 | 0.262 |
| SBP | −0.072 | 0.459 |
| DBP | 0.028 | 0.776 |
| NASCET | −0.187 | 0.050 |
| Creatinine | 0.147 | 0.129 |
| eGFR | −0.075 | 0.441 |
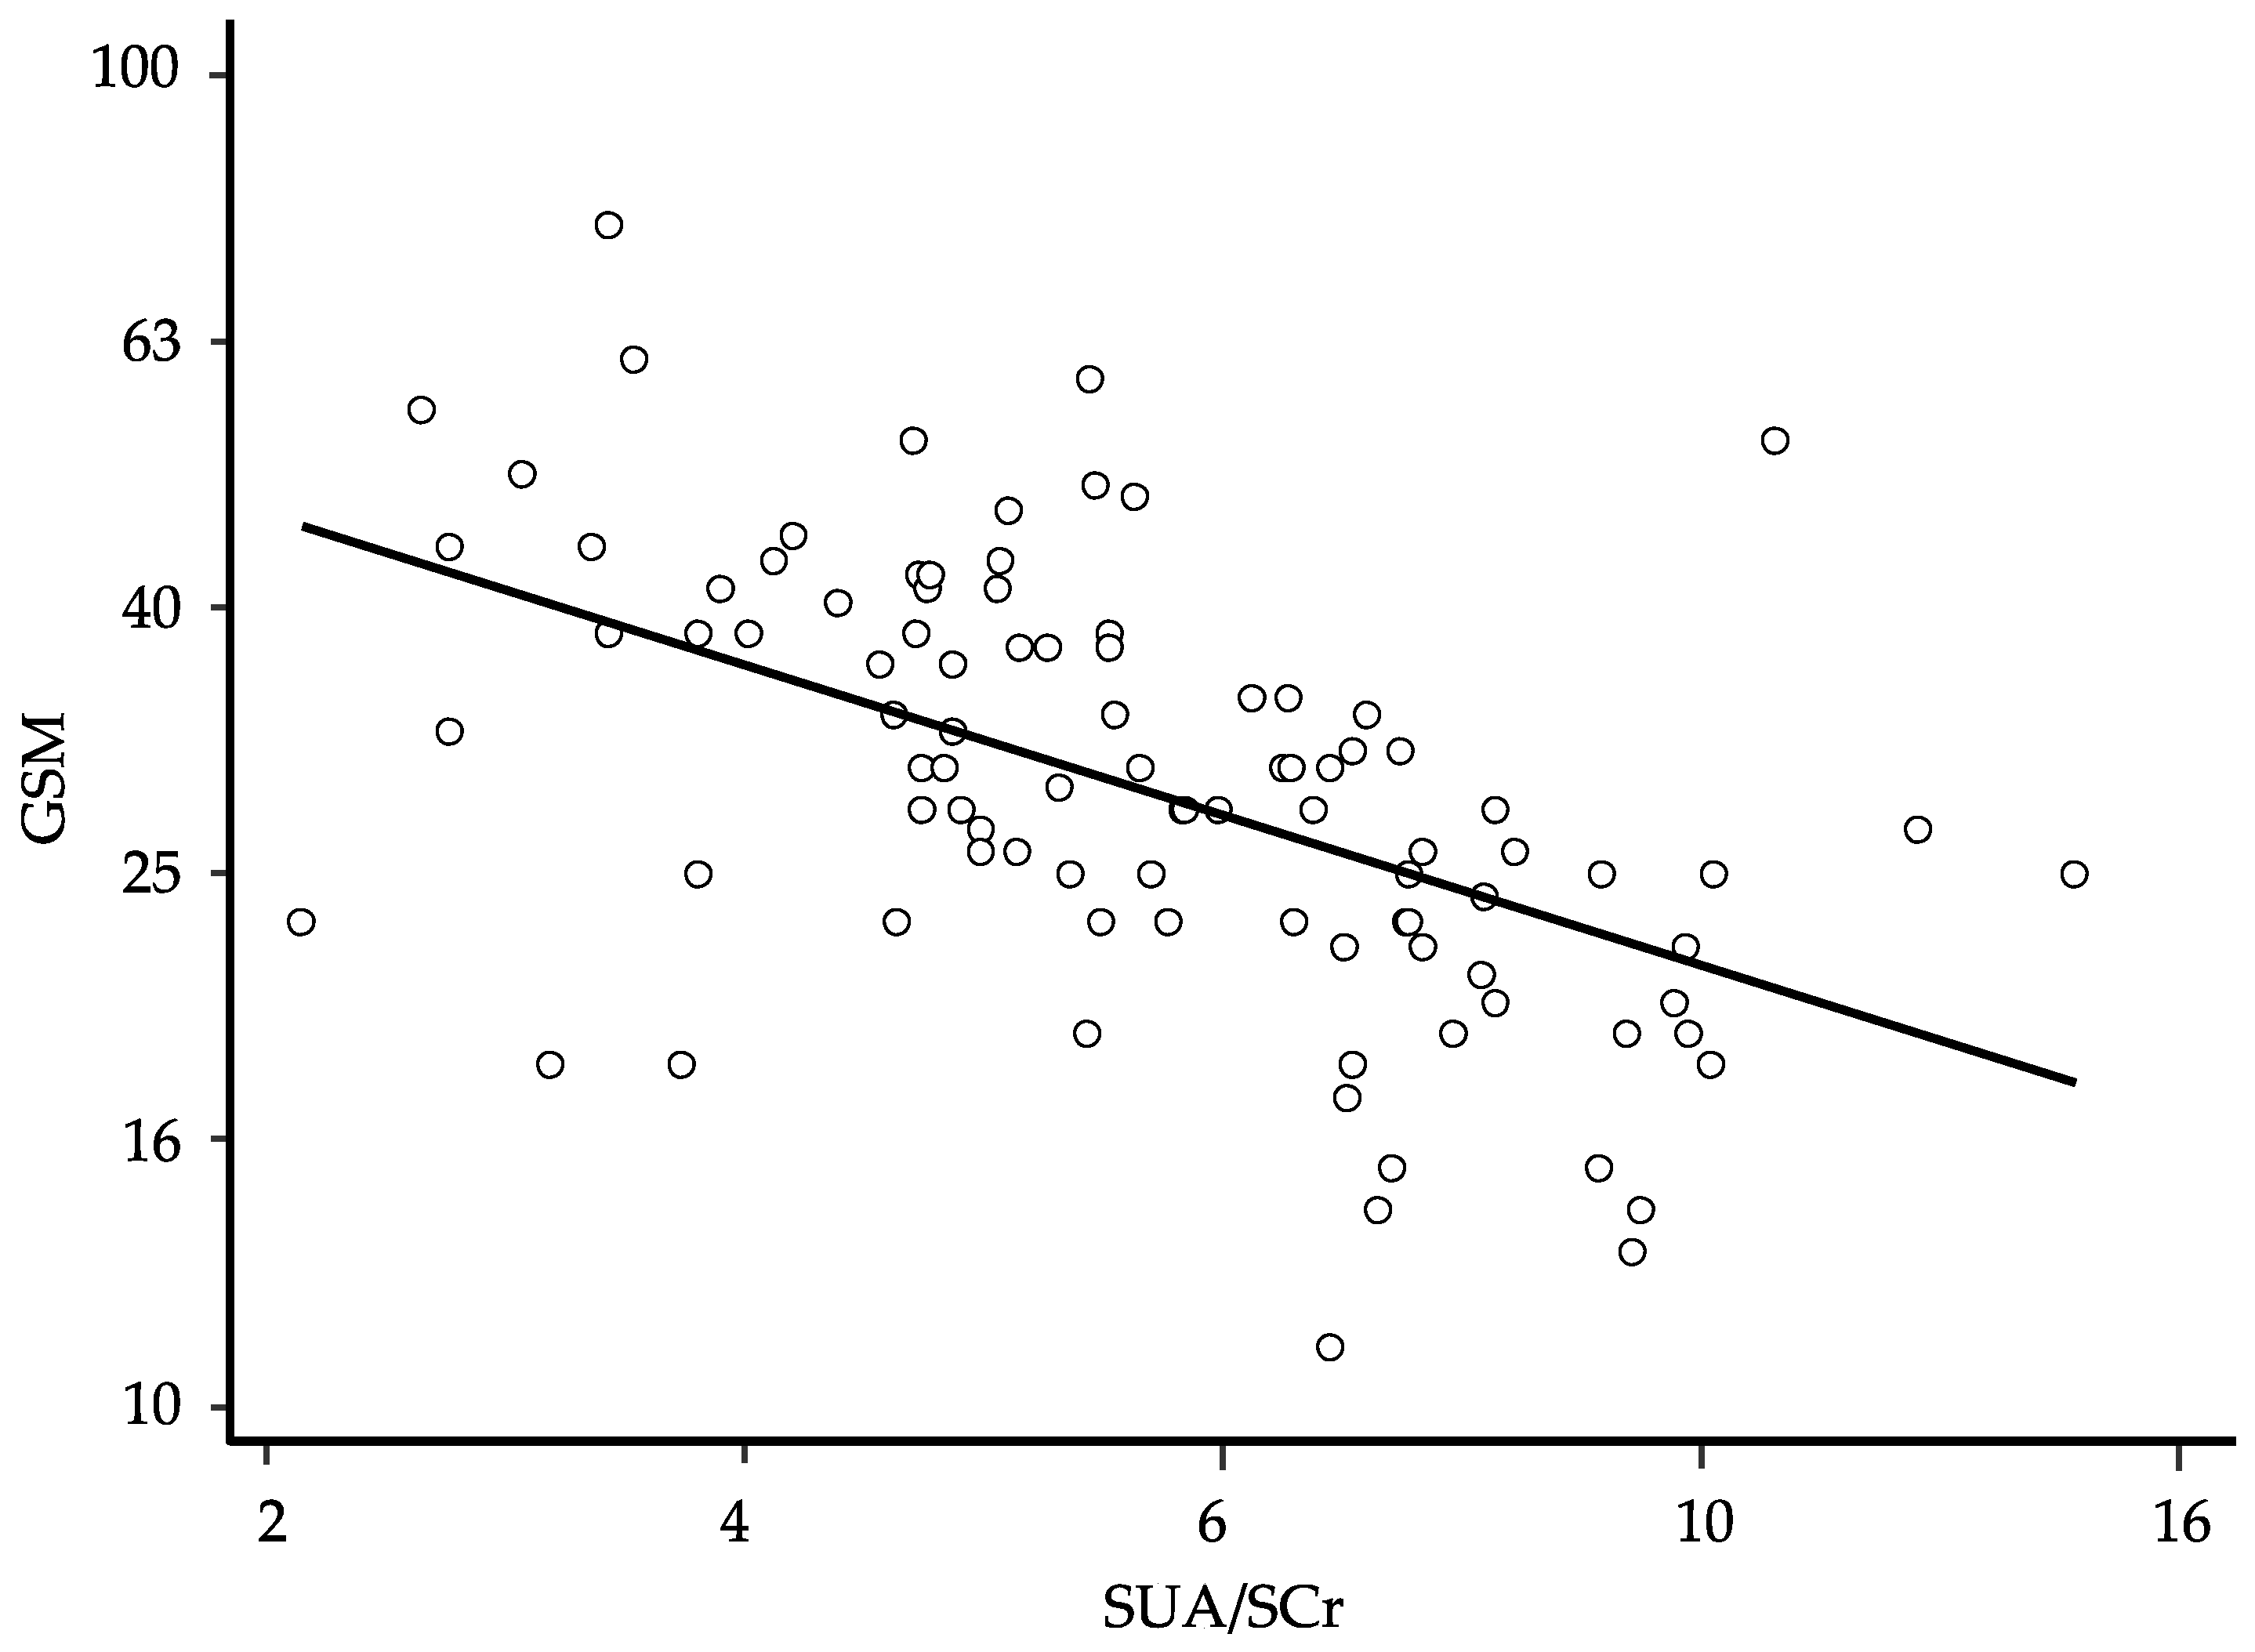
| SUA | −0.439 | <0.0001 |
| SUA/SCr ratio | −0.497 | <0.0001 |
| Age | 72.7 ± 5.9 |
| Gender (males/females) | 53/45 |
| BMI (kg/m2) | 27.6 ± 4.0 |
| Total cholesterol (mg/L) | 197.5 ± 47.6 |
| HDL-C (mg/dL) | 47.8 ± 12.1 |
| LDL-C (mg/dL) | 119.1 ± 44.9 |
| Triglyceride (mg/dL) | 155.2 ± 70.2 |
| SBP (mmHg) | 139.5 ± 15.1 |
| DBP (mmHg) | 78.6 ± 7.4 |
| GSM | 30.9 ± 11.8 |
| NASCET (%) | 44.3 ± 20.9 |
| Hypertension, n (%) | 81 (82.7%) |
| Hypercholesterolemia, n (%) | 70 (71.4%) |
| Diabetes mellitus, n (%) | 19 (19.4%) |
| Smoking, n (%) | 11 (11.2%) |
| Creatinine (mg/dL) | 1.0 ± 0.2 |
| eGFR (mL/min/1.73 m2) | 72.1 ± 16.6 |
| SUA (mg/dL) | 6.0 ± 1.7 |
| SUA/SCr ratio | 6.2 ± 2.2 |
| Coefficient | 95% CI | p-Value | Semi-Partial R2 | |
|---|---|---|---|---|
| Gender | −0.068 | −0.122; −0.143 | 0.014 | 0.042 |
| SUA/SCr ratio | −0.600 | −0.777; −0.424 | <0.0001 | 0.303 |
| NASCET | −0.208 | −0.335; −0.082 | 0.002 | 0.071 |
| Baseline | Follow-Up | p | |
|---|---|---|---|
| Age | 71.0 ± 5.6 | 74.2 ± 5.8 | <0.0001 |
| BMI (kg/m2) | 27.7 ± 4.1 | 27.8 ± 4.2 | 0.689 |
| Total cholesterol (mg/dL) | 209.1 ± 49.9 | 198.5 ± 42. | 0.068 |
| HDL-C (mg/dL) | 50.6 ± 13.0 | 48.6 ± 12.0 | 0.089 |
| LDL-C (mg/dL) | 129.2 ± 500 | 120.9 ± 37.5 | 0.104 |
| Triglyceride (mg/dL) | 151.8 ± 62.9 | 149.5 ± 53.7 | 0.886 |
| SBP (mmHg) | 138.6 ± 15.4 | 136.4 ± 14.6 | 0.485 |
| DBP (mmHg) | 79.5 ± 8.1 | 77.2 ± 7.1 | 0.040 |
| GSM | 32.4 ± 10.5 | 32.1 ± 10.3 | 0.599 |
| NASCET score | 32.7 ± 12.6 | 37.6 ± 13.5 | <0.0001 |
| Creatinine (mg/dL) | 1.0 ± 0.2 | 1.0 ± 0.2 | 0.266 |
| eGFR (ml/min/1.73 m2) | 69.4 ± 17.3 | 67.2 ± 16.0 | 0.018 |
| SUA (mg/dL) | 5.6 ± 1.5 | 5.5 ± 1.2 | 0.770 |
| SUA/SCr ratio | 5.8 ± 1.9 | 5.6 ± 1.7 | 0.637 |
| Coefficient | p-Value | |
|---|---|---|
| Age | −0.117 | 0.404 |
| BMI | 0.160 | 0.253 |
| Total cholesterol | 0.007 | 0.963 |
| HDL-C | −0.010 | 0.943 |
| LDL-C | 0.018 | 0.901 |
| Triglyceride | −0.072 | 0.610 |
| SBP | −0.056 | 0.693 |
| DBP | 0.129 | 0.357 |
| NASCET | −0.170 | 0.248 |
| Creatinine | 0.143 | 0.308 |
| eGFR | 0.065 | 0.645 |
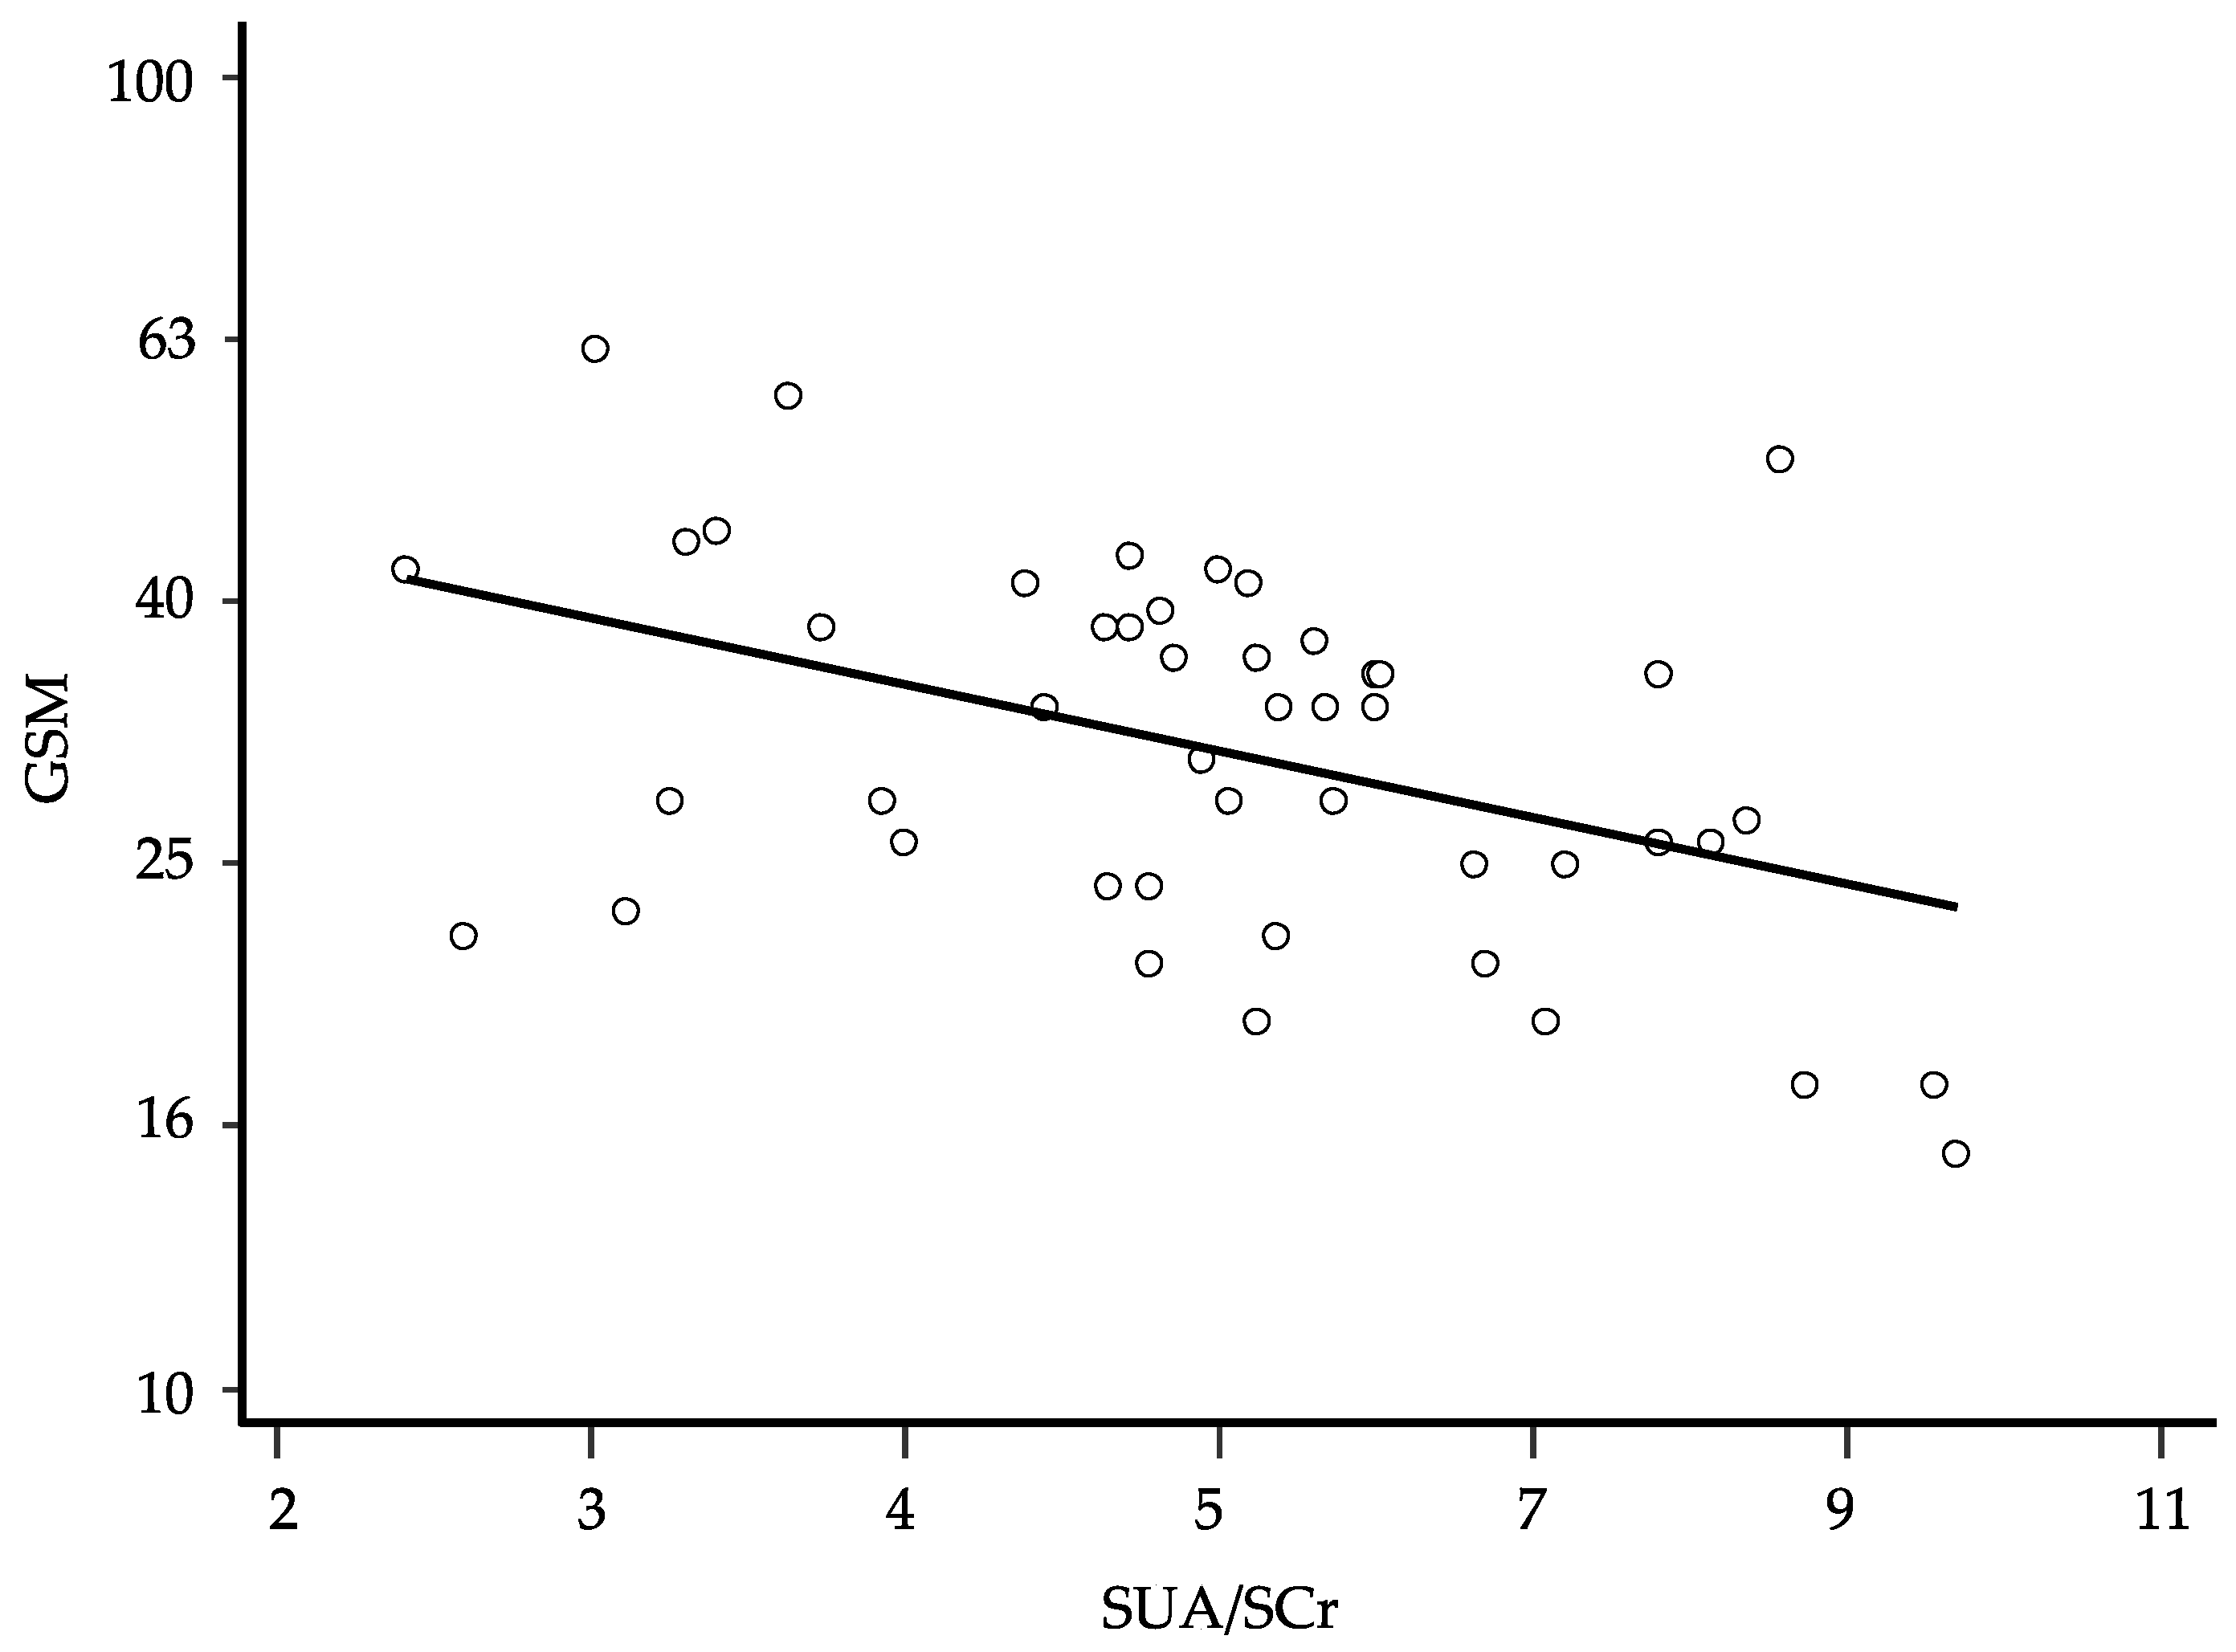
| SUA (mg/dL) | −0.361 | 0.008 |
| SUA/SCr ratio | −0.375 | 0.006 |
| Coefficient | 95% CI | p-Value | Semi-Partial R2 | |
|---|---|---|---|---|
| Gender (female) | −0.087 | −0.155; −0.018 | 0.014 | 0.092 |
| SUA/SCr ratio | −0.584 | −0.848; −0.319 | <0.0001 | 0.280 |
| NASCET | −0.273 | −0.489; −0.058 | 0.014 | 0.093 |
Disclaimer/Publisher’s Note: The statements, opinions and data contained in all publications are solely those of the individual author(s) and contributor(s) and not of MDPI and/or the editor(s). MDPI and/or the editor(s) disclaim responsibility for any injury to people or property resulting from any ideas, methods, instructions or products referred to in the content. |
© 2023 by the authors. Licensee MDPI, Basel, Switzerland. This article is an open access article distributed under the terms and conditions of the Creative Commons Attribution (CC BY) license (https://creativecommons.org/licenses/by/4.0/).
Share and Cite
Mastroiacovo, D.; Ettorre, E.; Mengozzi, A.; Virdis, A.; Camerota, A.; Muselli, M.; Necozione, S.; Bocale, R.; Ferri, C.; Desideri, G. Serum Uric Acid Levels Are Associated with the Echogenic Features of Carotid Plaque Vulnerability in Elderly Patients with Atherosclerotic Disease. Metabolites 2023, 13, 693. https://doi.org/10.3390/metabo13060693
Mastroiacovo D, Ettorre E, Mengozzi A, Virdis A, Camerota A, Muselli M, Necozione S, Bocale R, Ferri C, Desideri G. Serum Uric Acid Levels Are Associated with the Echogenic Features of Carotid Plaque Vulnerability in Elderly Patients with Atherosclerotic Disease. Metabolites. 2023; 13(6):693. https://doi.org/10.3390/metabo13060693
Chicago/Turabian StyleMastroiacovo, Daniela, Evaristo Ettorre, Alessandro Mengozzi, Agostino Virdis, Antonio Camerota, Mario Muselli, Stefano Necozione, Raffaella Bocale, Claudio Ferri, and Giovambattista Desideri. 2023. "Serum Uric Acid Levels Are Associated with the Echogenic Features of Carotid Plaque Vulnerability in Elderly Patients with Atherosclerotic Disease" Metabolites 13, no. 6: 693. https://doi.org/10.3390/metabo13060693