
Protein Intake Is Associated with Blood Pressure and Cholesterol Levels in Italian Older Adults: A Cross-Sectional Study

 , , , ,
Abstract
:1. Introduction
2. Experimental Design
3. Procedure
3.1. Participants
3.2. Statistical Analysis
4. Results
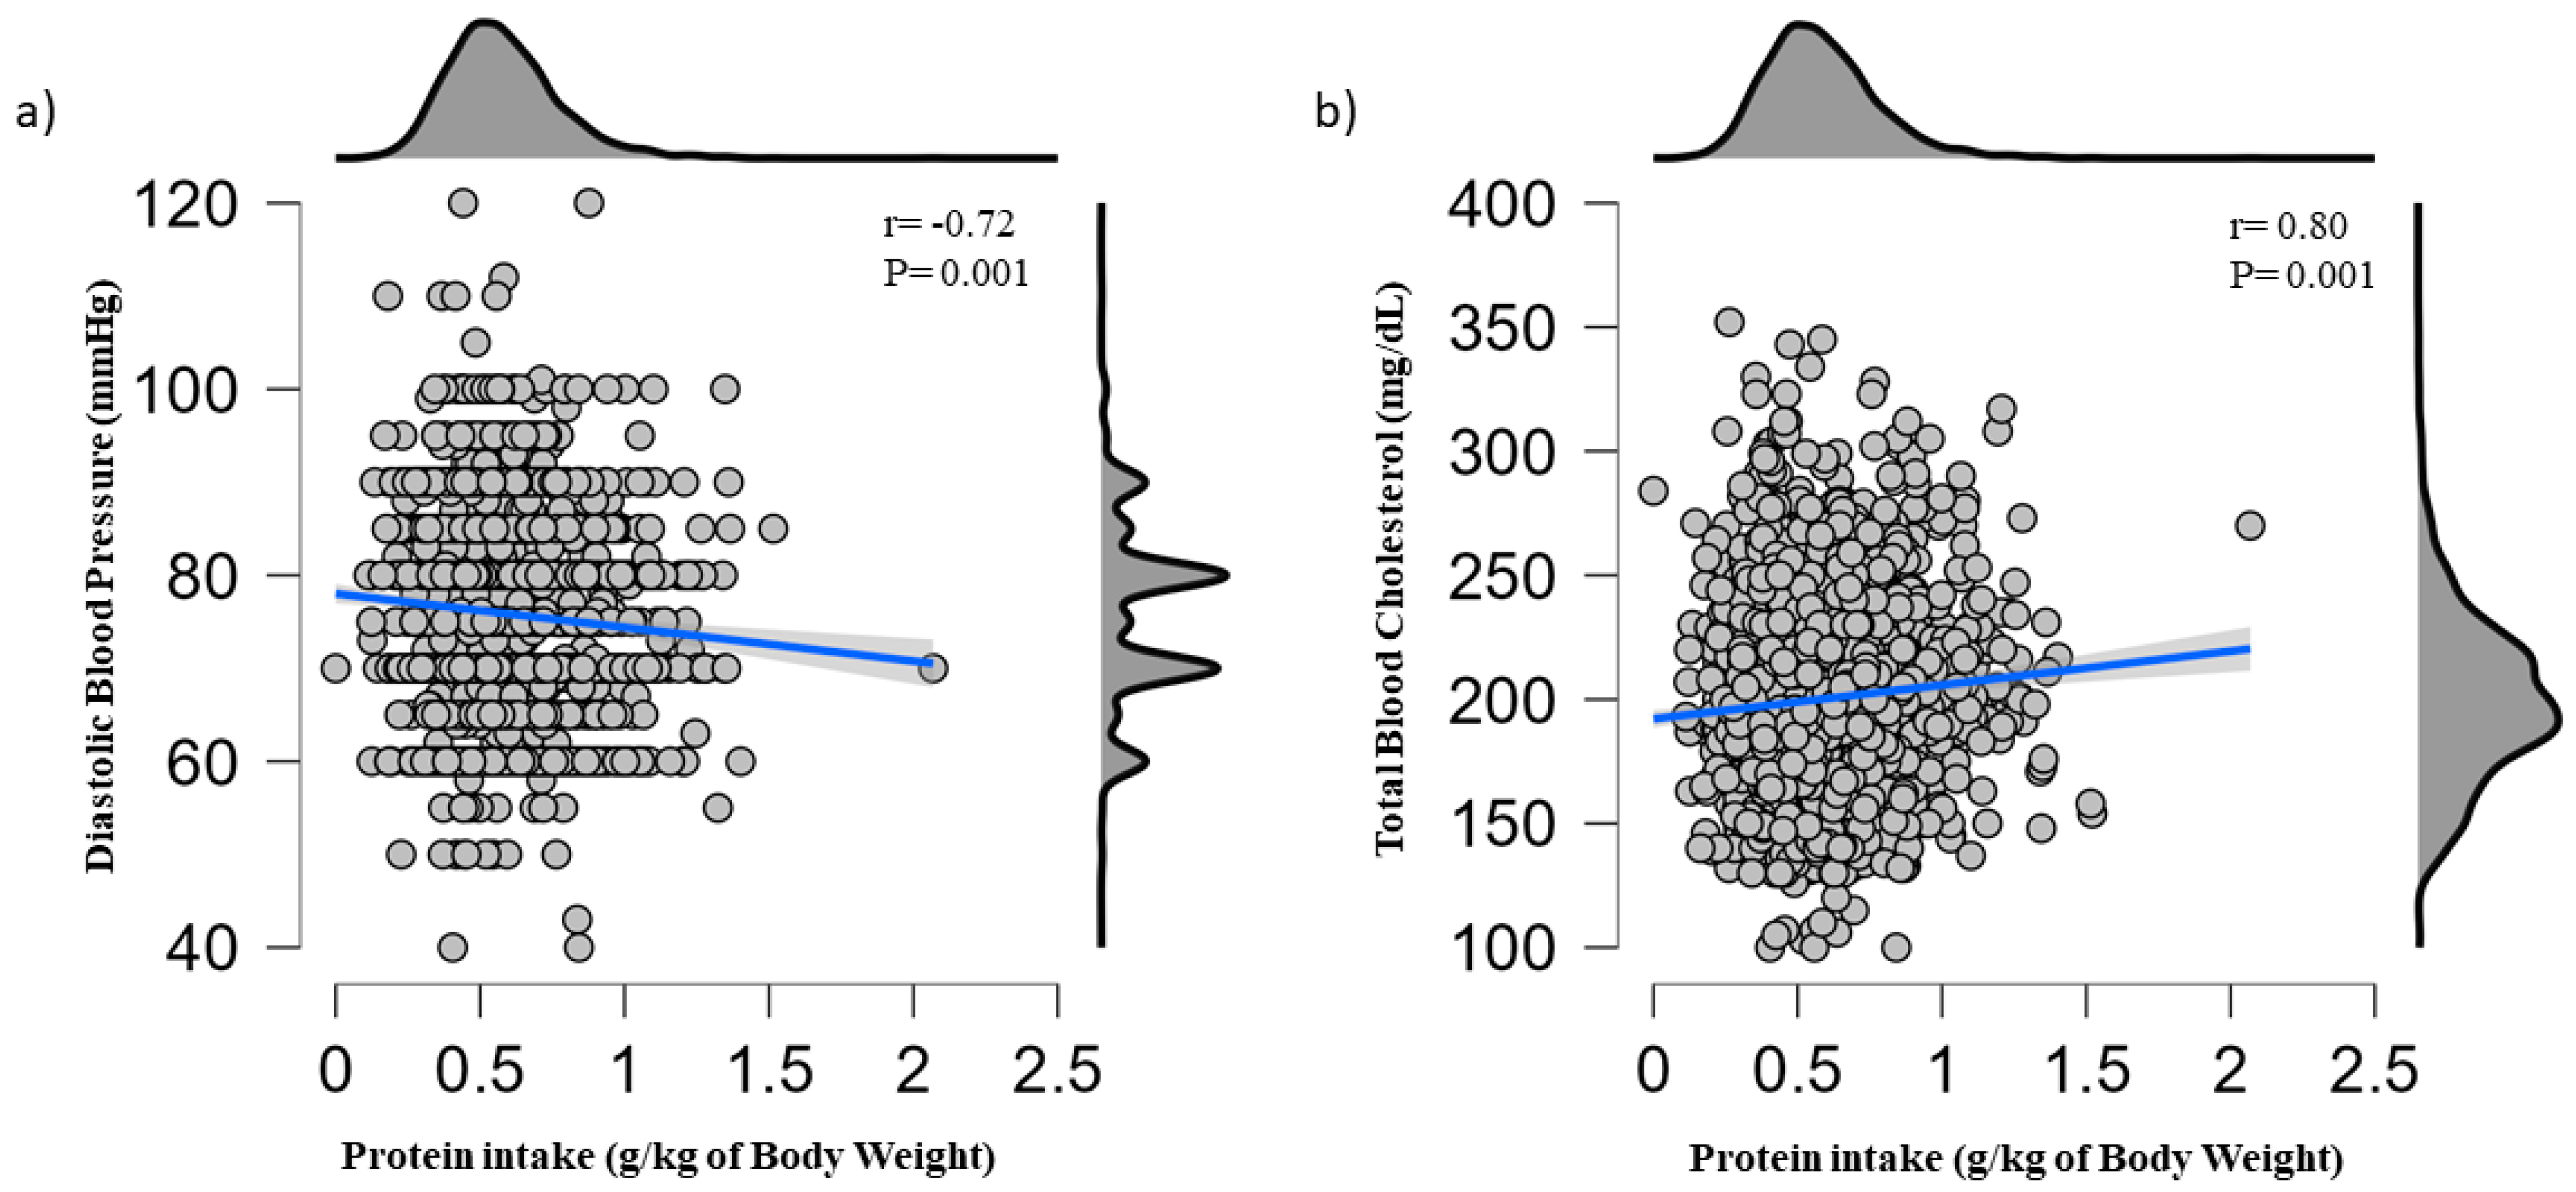
4.1. Association of Protein Intake with Cardiovascular Risk Factors
4.2. Linear Regression
5. Discussion
Author Contributions
Funding
Institutional Review Board Statement
Informed Consent Statement
Data Availability Statement
Conflicts of Interest
References
- World Health Organization—Cardiovascular Diseases (CVDs). Available online: https://www.who.int/news-room/fact-sheets/detail/cardiovascular-diseases-(cvds) (accessed on 13 February 2023).
- Yazdanyar, A.; Newman, A.B. The Burden of Cardiovascular Disease in the Elderly: Morbidity, Mortality, and Costs. Clin. Geriatr. Med. 2009, 25, 563–577, vii. [Google Scholar] [CrossRef] [PubMed] [Green Version]
- Rodgers, J.L.; Jones, J.; Bolleddu, S.I.; Vanthenapalli, S.; Rodgers, L.E.; Shah, K.; Karia, K.; Panguluri, S.K. Cardiovascular Risks Associated with Gender and Aging. J. Cardiovasc. Dev. Dis. 2019, 6, 19. [Google Scholar] [CrossRef] [PubMed] [Green Version]
- Lazzeroni, D.; Villatore, A.; Souryal, G.; Pili, G.; Peretto, G. The Aging Heart: A Molecular and Clinical Challenge. Int. J. Mol. Sci. 2022, 23, 16033. [Google Scholar] [CrossRef] [PubMed]
- Cardiovascular Disease—Centers for Disease Control and Prevention. Available online: https://www.cdc.gov/globalhealth/healthprotection/ncd/cardiovascular-diseases.html (accessed on 13 February 2023).
- Rozga, M.; Jones, K.; Robinson, J.; Yahiro, A. Nutrition and Physical Activity Interventions for the General Population with and without Cardiometabolic Risk: A Scoping Review. Public Health Nutr. 2021, 24, 4718–4736. [Google Scholar] [CrossRef]
- Pescatello, L.S.; MacDonald, H.V.; Lamberti, L.; Johnson, B.T. Exercise for Hypertension: A Prescription Update Integrating Existing Recommendations with Emerging Research. Curr. Hypertens. Rep. 2015, 17, 87. [Google Scholar] [CrossRef] [Green Version]
- Abdelhafiz, A.H.; Sinclair, A.J. Diabetes, Nutrition, and Exercise. Clin. Geriatr. Med. 2015, 31, 439–451. [Google Scholar] [CrossRef]
- Martín-Peláez, S.; Fito, M.; Castaner, O. Mediterranean Diet Effects on Type 2 Diabetes Prevention, Disease Progression, and Related Mechanisms. A Review. Nutrients 2020, 12, 2236. [Google Scholar] [CrossRef]
- Sofi, F.; Macchi, C.; Abbate, R.; Gensini, G.F.; Casini, A. Mediterranean Diet and Health Status: An Updated Meta-Analysis and a Proposal for a Literature-Based Adherence Score. Public Health Nutr. 2013, 17, 2769–2782. [Google Scholar] [CrossRef] [Green Version]
- Bach-Faig, A.; Berry, E.M.; Lairon, D.; Reguant, J.; Trichopoulou, A.; Dernini, S.; Medina, F.X.; Battino, M.; Belahsen, R.; Miranda, G.; et al. Mediterranean Diet Pyramid Today. Science and Cultural Updates. Public Health Nutr. 2011, 14, 2274–2284. [Google Scholar] [CrossRef] [Green Version]
- Lagiou, P.; Sandin, S.; Lof, M.; Trichopoulos, D.; Adami, H.-O.; Weiderpass, E. Low Carbohydrate-High Protein Diet and Incidence of Cardiovascular Diseases in Swedish Women: Prospective Cohort Study. BMJ 2012, 344, e4026. [Google Scholar] [CrossRef] [Green Version]
- Abukhodair, A.W.; Abukhudair, W.; Alqarni, M.S. The Effects of L-Arginine in Hypertensive Patients: A Literature Review. Cureus 2021, 13, e20485. [Google Scholar] [CrossRef] [PubMed]
- Altorf-van der Kuil, W.; Engberink, M.F.; De Neve, M.; van Rooij, F.J.A.; Hofman, A.; van’t Veer, P.; Witteman, J.C.M.; Franco, O.H.; Geleijnse, J.M. Dietary Amino Acids and the Risk of Hypertension in a Dutch Older Population: The Rotterdam Study. Am. J. Clin. Nutr. 2013, 97, 403–410. [Google Scholar] [CrossRef] [PubMed] [Green Version]
- Stamler, J.; Elliott, P.; Kesteloot, H.; Nichols, R.; Claeys, G.; Dyer, A.R.; Stamler, R. Inverse Relation of Dietary Protein Markers with Blood Pressure. Findings for 10,020 Men and Women in the INTERSALT Study. INTERSALT Cooperative Research Group. INTERnational Study of SALT and Blood Pressure. Circulation 1996, 94, 1629–1634. [Google Scholar] [CrossRef] [PubMed]
- Hruby, A.; Jacques, P.F. Dietary Protein and Changes in Markers of Cardiometabolic Health across 20 Years of Follow-up in Middle-Aged Americans. Public Health Nutr. 2018, 21, 2998–3010. [Google Scholar] [CrossRef] [Green Version]
- Sekgala, M.D.; Opperman, M.; Mpahleni, B.; Mchiza, Z.J.-R. Association between Macronutrient and Fatty Acid Consumption and Metabolic Syndrome: A South African Taxi Driver Survey. Int. J. Environ. Res. Public Health 2022, 19, 15452. [Google Scholar] [CrossRef]
- Kohansal, A.; Zangene, A.; Turki Jalil, A.; Hooshang, H.; Leilami, K.; Gerami, S.; Najafi, M.; Nouri, M.; Faghih, S. Association between Plant and Animal Proteins Intake with Lipid Profile and Anthropometric Indices: A Cross-Sectional Study. Nutr. Health, 2022; Online ahead of print. [Google Scholar] [CrossRef]
- Buendia, J.R.; Bradlee, M.L.; Singer, M.R.; Moore, L.L. Diets Higher in Protein Predict Lower High Blood Pressure Risk in Framingham Offspring Study Adults. Am. J. Hypertens. 2015, 28, 372–379. [Google Scholar] [CrossRef] [Green Version]
- Liu, L.; Ikeda, K.; Sullivan, D.H.; Ling, W.; Yamori, Y. Epidemiological Evidence of the Association between Dietary Protein Intake and Blood Pressure: A Meta-Analysis of Published Data. Hypertens. Res. 2002, 25, 689–695. [Google Scholar] [CrossRef] [Green Version]
- Altorf-van der Kuil, W.; Engberink, M.F.; Vedder, M.M.; Boer, J.M.A.; Verschuren, W.M.M.; Geleijnse, J.M. Sources of Dietary Protein in Relation to Blood Pressure in a General Dutch Population. PLoS ONE 2012, 7, e30582. [Google Scholar] [CrossRef] [Green Version]
- Altorf-van der Kuil, W.; Engberink, M.F.; Geleijnse, J.M.; Boer, J.M.A.; Monique Verschuren, W.M. Sources of Dietary Protein and Risk of Hypertension in a General Dutch Population. Br. J. Nutr. 2012, 108, 1897–1903. [Google Scholar] [CrossRef] [Green Version]
- Tielemans, S.M.A.J.; Kromhout, D.; Altorf-van der Kuil, W.; Geleijnse, J.M. Associations of Plant and Animal Protein Intake with 5-Year Changes in Blood Pressure: The Zutphen Elderly Study. Nutr. Metab. Cardiovasc. Dis. 2014, 24, 1228–1233. [Google Scholar] [CrossRef]
- Liu, R.; Dang, S.; Yan, H.; Wang, D.; Zhao, Y.; Li, Q.; Liu, X. Association between Dietary Protein Intake and the Risk of Hypertension: A Cross-Sectional Study from Rural Western China. Hypertens. Res. 2013, 36, 972–979. [Google Scholar] [CrossRef] [PubMed] [Green Version]
- Mente, A.; Dehghan, M.; Rangarajan, S.; McQueen, M.; Dagenais, G.; Wielgosz, A.; Lear, S.; Li, W.; Chen, H.; Yi, S.; et al. Association of Dietary Nutrients with Blood Lipids and Blood Pressure in 18 Countries: A Cross-Sectional Analysis from the PURE Study. Lancet Diabetes Endocrinol. 2017, 5, 774–787. [Google Scholar] [CrossRef] [Green Version]
- Pasiakos, S.M.; Lieberman, H.R.; Fulgoni, V.L. Higher-Protein Diets Are Associated with Higher HDL Cholesterol and Lower BMI and Waist Circumference in US Adults. J. Nutr. 2015, 145, 605–614. [Google Scholar] [CrossRef] [Green Version]
- Bauer, J.; Biolo, G.; Cederholm, T.; Cesari, M.; Cruz-Jentoft, A.J.; Morley, J.E.; Phillips, S.; Sieber, C.; Stehle, P.; Teta, D.; et al. Evidence-Based Recommendations for Optimal Dietary Protein Intake in Older People: A Position Paper from the Prot-Age Study Group. J. Am. Med. Dir. Assoc. 2013, 14, 542–559. [Google Scholar] [CrossRef] [PubMed]
- Volpi, E.; Campbell, W.W.; Dwyer, J.T.; Johnson, M.A.; Jensen, G.L.; Morley, J.E.; Wolfe, R.R. Is the Optimal Level of Protein Intake for Older Adults Greater than the Recommended Dietary Allowance? J. Gerontol. A Biol. Sci. Med. Sci. 2013, 68, 677–681. [Google Scholar] [CrossRef] [PubMed] [Green Version]
- Landi, F.; Calvani, R.; Martone, A.M.; Salini, S.; Zazzara, M.B.; Candeloro, M.; Coelho-Junior, H.J.; Tosato, M.; Picca, A.; Marzetti, E. Normative Values of Muscle Strength across Ages in a “real World” Population: Results from the Longevity Check-up 7+ Project. J. Cachexia. Sarcopenia Muscle 2020, 11, 1562–1569. [Google Scholar] [CrossRef] [PubMed]
- Landi, F.; Calvani, R.; Picca, A.; Tosato, M.; D’Angelo, E.; Martone, A.M.; Serafini, E.; Ortolani, E.; Savera, G.; Salini, S.; et al. Relationship between Cardiovascular Health Metrics and Physical Performance in Community-Living People: Results from the Longevity Check-up (Lookup) 7+ Project. Sci. Rep. 2018, 8, 16353. [Google Scholar] [CrossRef] [PubMed] [Green Version]
- Landi, F.; Calvani, R.; Martone, A.M.; D’angelo, E.; Serafini, E.; Ortolani, E.; Savera, G.; Picca, A.; Tosato, M.; Salini, S.; et al. Daily Meat Consumption and Variation with Aging in Community-Dwellers: Results from Longevity Check-up 7 + Project. J. Gerontol. Geriatr. 2019, 67, 62–66. [Google Scholar]
- Marzetti, E.; Calvani, R.; Picca, A.; Sisto, A.; Tosato, M.; Martone, A.M.; Ortolani, E.; Salini, S.; Pafundi, T.; Santoliquido, A.; et al. Prevalence of Dyslipidaemia and Awareness of Blood Cholesterol Levels among Community-Living People: Results from the Longevity Check-up 7+ (Lookup 7+) Cross-Sectional Survey. BMJ Open 2018, 8, e021627. [Google Scholar] [CrossRef] [Green Version]
- Landi, F.; Calvani, R.; Picca, A.; Tosato, M.; Martone, A.M.; Ortolani, E.; Sisto, A.; D’angelo, E.; Serafini, E.; Desideri, G.; et al. Body Mass Index Is Strongly Associated with Hypertension: Results from the Longevity Check-up 7+ Study. Nutrients 2018, 10, 1976. [Google Scholar] [CrossRef] [Green Version]
- Landi, F.; Calvani, R.; Picca, A.; Tosato, M.; Martone, A.M.; Ortolani, E.; Salini, S.; Pafundi, T.; Savera, G.; Pantanelli, C.; et al. Cardiovascular Health Metrics, Muscle Mass and Function among Italian Community-Dwellers: The Lookup 7+ Project. Eur. J. Public Health 2018, 28, 766–772. [Google Scholar] [CrossRef] [PubMed]
- von Elm, E.; Altman, D.G.; Egger, M.; Pocock, S.J.; Gøtzsche, P.C.; Vandenbroucke, J.P. STROBE Initiative The Strengthening the Reporting of Observational Studies in Epidemiology (STROBE) Statement: Guidelines for Reporting Observational Studies. Int. J. Surg. 2014, 12, 1495–1499. [Google Scholar] [CrossRef] [PubMed] [Green Version]
- Chobanian, A.V.; Bakris, G.L.; Black, H.R.; Cushman, W.C.; Green, L.A.; Izzo, J.L.; Jones, D.W.; Materson, B.J.; Oparil, S.; Wright, J.T.; et al. Seventh Report of the Joint National Committee on Prevention, Detection, Evaluation, and Treatment of High Blood Pressure. Hypertension 2003, 42, 1206–1252. [Google Scholar] [CrossRef] [Green Version]
- Landi, F.; Calvani, R.; Tosato, M.; Martone, A.M.; Picca, A.; Ortolani, E.; Savera, G.; Salini, S.; Ramaschi, M.; Bernabei, R.; et al. Animal-Derived Protein Consumption Is Associated with Muscle Mass and Strength in Community-Dwellers: Results from the Milan Expo Survey. J. Nutr. Health Aging 2017, 21, 1050–1056. [Google Scholar] [CrossRef] [PubMed]
- Umesawa, M.; Sato, S.; Imano, H.; Kitamura, A.; Shimamoto, T.; Yamagishi, K.; Tanigawa, T.; Iso, H. Relations between Protein Intake and Blood Pressure in Japanese Men and Women: The Circulatory Risk in Communities Study (CIRCS). Am. J. Clin. Nutr. 2009, 90, 377–384. [Google Scholar] [CrossRef] [PubMed] [Green Version]
- Hodgson, J.M.; Zhu, K.; Lewis, J.R.; Kerr, D.; Meng, X.; Solah, V.; Devine, A.; Binns, C.W.; Woodman, R.J.; Prince, R.L. Long-Term Effects of a Protein-Enriched Diet on Blood Pressure in Older Women. Br. J. Nutr. 2012, 107, 1664–1672. [Google Scholar] [CrossRef] [Green Version]
- He, J.; Yu, S.; Fang, A.; Shen, X.; Li, K. Association between Protein Intake and the Risk of Hypertension among Chinese Men and Women: A Longitudinal Study. Nutrients 2022, 14, 1276. [Google Scholar] [CrossRef]
- Mehrabani, S.; Asemi, M.; Najafian, J.; Sajjadi, F.; Maghroun, M.; Mohammadifard, N. Association of Animal and Plant Proteins Intake with Hypertension in Iranian Adult Population: Isfahan Healthy Heart Program. Adv. Biomed. Res. 2017, 6, 112. [Google Scholar] [CrossRef]
- Tayyem, R.; Hijjawi, N.S.; Al-Awwad, N.; Nimer, N.A.; Agraib, L.M.; Allehdan, S.S.; Al-Radaideh, A.M. Association between Intakes of Macro- and Micro- Nutrients and Serum Lipid Profiles among Jordanian Adults: A Preliminary Study. Prog. Nutr. 2018, 20, 361–371. [Google Scholar] [CrossRef]
- Clifton, P.M.; Bastiaans, K.; Keogh, J.B. High Protein Diets Decrease Total and Abdominal Fat and Improve CVD Risk Profile in Overweight and Obese Men and Women with Elevated Triacylglycerol. Nutr. Metab. Cardiovasc. Dis. 2009, 19, 548–554. [Google Scholar] [CrossRef]
- Dong, J.-Y.; Zhang, Z.-L.; Wang, P.-Y.; Qin, L.-Q. Effects of High-Protein Diets on Body Weight, Glycaemic Control, Blood Lipids and Blood Pressure in Type 2 Diabetes: Meta-Analysis of Randomised Controlled Trials. Br. J. Nutr. 2013, 110, 781–789. [Google Scholar] [CrossRef] [PubMed] [Green Version]
- Pan, A.; Sun, Q.; Bernstein, A.M.; Schulze, M.B.; Manson, J.E.; Willett, W.C.; Hu, F.B. Red Meat Consumption and Risk of Type 2 Diabetes: 3 Cohorts of US Adults and an Updated Meta-Analysis. Am. J. Clin. Nutr. 2011, 94, 1088–1096. [Google Scholar] [CrossRef] [PubMed] [Green Version]
- Pan, A.; Sun, Q.; Bernstein, A.M.; Schulze, M.B.; Manson, J.E.; Stampfer, M.J.; Willett, W.C.; Hu, F.B. Red Meat Consumption and Mortality: Results from 2 Prospective Cohort Studies. Arch. Intern. Med. 2012, 172, 555–563. [Google Scholar] [CrossRef] [PubMed] [Green Version]
- Diarz, E.J.; Leyaro, B.J.; Kivuyo, S.L.; Ngowi, B.J.; Msuya, S.E.; Mfinanga, S.G.; Bonfoh, B.; Mahande, M.J. Red Meat Consumption and Its Association with Hypertension and Hyperlipidaemia among Adult Maasai Pastoralists of Ngorongoro Conservation Area, Tanzania. PLoS ONE 2020, 15, e0233777. [Google Scholar] [CrossRef]
- Tani, S.; Atsumi, W.; Imatake, K.; Suzuki, Y.; Yagi, T.; Takahashi, A.; Matsumoto, N.; Okumura, Y. Associations of Higher Fish Consumption and Lifestyle with Lower Monocyte/HDL-C Ratio in a Japanese Population: Implication for the Anti-Atherosclerotic Effect of Fish Consumption. J. Cardiol. 2022, 80, 402–409. [Google Scholar] [CrossRef]
- Blachier, F.; Lancha, A.H.; Boutry, C.; Tomé, D. Alimentary Proteins, Amino Acids and Cholesterolemia. Amino Acids 2010, 38, 15–22. [Google Scholar] [CrossRef]
- Hirche, F.; Schröder, A.; Knoth, B.; Stangl, G.I.; Eder, K. Effect of Dietary Methionine on Plasma and Liver Cholesterol Concentrations in Rats and Expression of Hepatic Genes Involved in Cholesterol Metabolism. Br. J. Nutr. 2006, 95, 879–888. [Google Scholar] [CrossRef] [Green Version]
- Aoyama, Y.; Amano, N.; Yoshida, A. Cholesterol Synthesis and Degradation in Normal Rats Fed a Cholesterol-Free Diet with Excess Cystine. Lipids 1999, 34, 583–589. [Google Scholar] [CrossRef]
- Mizushima, S.; Nara, Y.; Sawamura, M.; Yamori, Y. Effects of Oral Taurine Supplementation on Lipids and Sympathetic Nerve Tone. Adv. Exp. Med. Biol. 1996, 403, 615–622. [Google Scholar] [CrossRef]
- Yamori, Y.; Murakami, S.; Ikeda, K.; Nara, Y. Fish and Lifestyle-Related Disease Prevention: Experimental and Epidemiological Evidence for Anti-Atherogenic Potential of Taurine. Clin. Exp. Pharmacol. Physiol. 2004, 31 (Suppl. S2), S20–S23. [Google Scholar] [CrossRef]
- Choi, M.-J.; Kim, J.-H.; Chang, K.J. The Effect of Dietary Taurine Supplementation on Plasma and Liver Lipid Concentrations and Free Amino Acid Concentrations in Rats Fed a High-Cholesterol Diet. Adv. Exp. Med. Biol. 2006, 583, 235–242. [Google Scholar] [CrossRef] [PubMed]
- Zhang, Y.; Guo, K.; LeBlanc, R.E.; Loh, D.; Schwartz, G.J.; Yu, Y.-H. Increasing Dietary Leucine Intake Reduces Diet-Induced Obesity and Improves Glucose and Cholesterol Metabolism in Mice via Multimechanisms. Diabetes 2007, 56, 1647–1654. [Google Scholar] [CrossRef] [PubMed] [Green Version]
- Zhao, Y.; Dai, X.; Zhou, Z.; Zhao, G.; Wang, X.; Xu, M. Leucine Supplementation via Drinking Water Reduces Atherosclerotic Lesions in ApoE Null Mice. Acta Pharmacol. Sin. 2016, 37, 196–203. [Google Scholar] [CrossRef] [PubMed]
- Hao, Z.; Xu, G.; Yuan, M.; Tan, R.; Xia, Y.; Liu, Y.; Yin, X. Leucine Supplementation in Middle-Aged Male Mice Improved Aging-Induced Vascular Remodeling and Dysfunction via Activating the Sirt1-Foxo1 Axis. Nutrients 2022, 14, 3856. [Google Scholar] [CrossRef]
- Wang, Z.; Huang, Q.; Wang, L.; Jiang, H.; Wang, Y.; Wang, H.; Zhang, J.; Zhai, F.; Zhang, B. Moderate Intake of Lean Red Meat Was Associated with Lower Risk of Elevated Blood Pressure in Chinese Women: Results from the China Health and Nutrition Survey, 1991–2015. Nutrients 2020, 12, 1369. [Google Scholar] [CrossRef]
- Wang, L.; Manson, J.E.; Buring, J.E.; Sesso, H.D. Meat Intake and the Risk of Hypertension in Middle-Aged and Older Women. J. Hypertens. 2008, 26, 215–222. [Google Scholar] [CrossRef] [PubMed]
- Golzarand, M.; Bahadoran, Z.; Mirmiran, P.; Azizi, F. Protein Foods Group and 3-Year Incidence of Hypertension: A Prospective Study From Tehran Lipid and Glucose Study. J. Ren. Nutr. 2016, 26, 219–225. [Google Scholar] [CrossRef]
- Alterovitz, S.S.R.; Mendelsohn, G.A. Relationship Goals of Middle-Aged, Young-Old, and Old-Old Internet Daters: An Analysis of Online Personal Ads. J. Aging Stud. 2013, 27, 159–165. [Google Scholar] [CrossRef]
- Igl, W.; Kamal-Eldin, A.; Johansson, A.; Liebisch, G.; Gnewuch, C.; Schmitz, G.; Gyllensten, U. Animal Source Food Intake and Association with Blood Cholesterol, Glycerophospholipids and Sphingolipids in a Northern Swedish Population. Int. J. Circumpolar Health 2013, 72, 21162. [Google Scholar] [CrossRef] [Green Version]
- Meng, S.; Cui, Z.; Li, M.; Li, T.; Wu, F.; Kang, T.; Meng, H. Associations between Dietary Animal and Plant Protein Intake and Cardiometabolic Risk Factors-A Cross-Sectional Study in China Health and Nutrition Survey. Nutrients 2021, 13, 336. [Google Scholar] [CrossRef]


| Quintiles of Daily Protein Intake (g/kg of Body Weight) | |||||
|---|---|---|---|---|---|
| ≤0.42 (n = 681) | 0.43−0.52 (n = 680) | 0.53−0.60 (n = 682) | 0.61−0.70 (n = 680) | ≥0.71 (n = 681) | |
| Age, years | 72.1 ± 5.4 | 72.6 ± 5.8 | 72.7 ± 5.7 | 73.1 ± 5.6 a | 73.1 ± 5.7 a |
| Weight, kg | 79.3 ± 13.4 | 74.7 ± 12.6 a | 71.3 ± 10.9 ab | 67.9 ± 10.5 abc | 60.6 ± 9.8 abcd |
| Height, m | 1.66 ± 0.9 | 1.65 ± 0.9 | 1.63 ± 0.8 ab | 1.61 ± 0.9 abc | 1.58 ± 0.8 abcd |
| BMI, kg/m2 | 28.6 ± 4.4 | 27.1 ± 4.1 a | 26.5 ± 3.6 ab | 25.9 ± 3.5 abc | 24.0 ± 3.2 abcd |
| Sex, female | 295, 43.3 | 290, 42.6 | 357, 52.3 | 405, 59.5 | 528, 77.5 * |
| Energy intake, kcal | 388.1 ± 104.6 | 492.2 ± 95.2 a | 546.7 ± 98.3 ab | 612.2 ± 103.9 abc | 688.4 ± 124.8 abcd |
| Protein, g | 27.2 ± 6.3 | 35.0 ± 5.9 a | 39.7 ± 6.0 ab | 44.6 ± 7.0 abc | 51.9 ± 8.6 abcd |
| Protein, g/kg | 0.34 ± 0.06 | 0.47 ± 0.02 a | 0.56 ± 0.02 ab | 0.65 ± 0.02 abc | 0.85 ± 0.14 abcd |
| Calcium, mg | 178.3 ± 100.9 | 235.0 ± 107.6 a | 284.0 ± 116.2 ab | 331.7 ± 120.7 abc | 383.5 ± 126.4 abcd |
| Magnesium, mg | 32.6 ± 10.0 | 39.6 ± 10.0 a | 44.0 ± 9.8 ab | 48.3 ± 10.3 abc | 54.3 ± 11.2 abcd |
| Sodium, mg | 417.2 ± 195.4 | 559.1 ± 217.3 a | 619.7 ± 230.9 ab | 722.7 ± 251.5 abc | 825.9 ± 317.1 abcd |
| Potassium, mg | 356.9 ± 100.4 | 449.4 ± 102.6 a | 503.7 ± 104.3 ab | 555.9 ± 118.1 abc | 641.6 ± 144.3 abcd |
| SBP, mmHg | 130.9 ± 15.0 | 130.4 ± 14.9 | 131.7 ± 17.0 | 130.2 ± 16.0 | 130.0 ± 17.2 |
| DBP, mmHg | 76.4 ± 9.3 | 76.5 ± 9.8 | 76.3 ± 9.5 | 75.6 ± 9.4 | 74.6 ± 9.7 abc |
| Total blood cholesterol, mg/dL | 199.3 ± 34.3 | 196.8 ± 33.2 | 196.9 ± 31.4 | 201.3 ± 31.5 | 205.4 ± 33.8 abc |
| Blood glucose, mg/dL | 107.7 ± 27.0 | 107.7 ± 26.0 | 107.2 ± 25.5 | 105.5 ± 22.5 | 105.4 ± 24.8 |
| Smoking, yes | 105, 15.4 | 101, 14.8 | 84, 12.3 | 88, 12.4 | 71, 10.4 * |
| Physical activity, yes | 135, 19.8 | 167, 24.5 | 182, 26.6 | 165, 24.2 | 164, 24.0 * |
| Antihypertensive drug(s), yes | 405, 12.0 | 377, 11.2 | 373, 11.1 | 355, 10.5 | 310, 9.2 * |
| Cholesterol-lowering drug(s), yes | 235, 34.5 | 230, 33.8 | 232, 34.0 | 218, 32.0 | 209, 30.6 |
| Antidiabetic drug(s), yes | 65, 9.5 | 63, 9.2 | 53, 7.7 | 58, 8.5 | 40, 5.8 |
| Tertiles of Daily Protein Intake (g/kg of Body Weight) | |||
|---|---|---|---|
| ≤0.79 (n = 2993) | 0.80−0.99 (n = 304) | ≥1.00 (n = 107) | |
| Age, years | 72.6 ± 5.6 | 72.9 ± 5.8 | 74.6 ± 6.5 ab |
| Weight, kg | 72.5 ± 12.6 | 59.9 ± 8.7 a | 52.5 ± 7.5 ab |
| Height, m | 1.64 ± 0.9 | 1.58 ± 0.7 a | 1.55 ± 0.8 ab |
| BMI, kg/m2 | 26.8 ± 4.0 | 23.8 ± 3.1 a | 21.7 ± 2.8 ab |
| Sex, female | 1526, 50.9 | 237, 77.9 | 87, 81.3 * |
| Energy intake, kcal | 521.0 ± 133.4 | 695.0 ± 118.9 a | 791.2 ± 117.1 ab |
| Protein, g | 37.6 ± 9.4 | 52.2 ± 7.9 a | 59.8 ± 8.7 ab |
| Protein, g/kg | 0.52 ± 0.13 | 0.87 ± 0.05 a | 1.14 ± 0.14 ab |
| Calcium, mg | 266.0 ± 128.3 | 381.5 ± 125.2 a | 457.9 ± 110.3 ab |
| Magnesium, mg | 42.0 ± 11.8 | 54.0 ± 10.8 a | 62.9 ± 9.8 ab |
| Sodium, mg | 595.3 ± 259.4 | 833.2 ± 306.5 a | 962.2 ± 363.8 ab |
| Potassium, mg | 477.4 ± 133.9 | 646.7 ± 139.6 a | 739.1 ± 146.9 ab |
| SBP, mmHg | 130.7 ± 15.8 | 129.2 ± 16.3 | 131.2 ± 18.4 |
| DBP, mmHg | 76.1 ± 9.5 | 74.1 ± 9.3 a | 74.6 ± 10.2 |
| Total blood cholesterol, mg/dL | 199.1 ± 32.7 | 205.7 ± 33.7 a | 209.6 ± 35.9 ab |
| Blood glucose, mg/dL | 106.9 ± 25.1 | 104.0 ± 21.3 | 108.9 ± 37.7 |
| Smoking, yes | 404, 13.4 | 35, 11.5 | 7, 6.5 |
| Physical activity, yes | 714, 23.8 | 65, 21.3 | 24, 22.4 |
| Antihypertensive drug(s), yes | 1631, 55.5 | 137, 45.0 | 32, 30.0 * |
| Cholesterol-lowering drug(s), yes | 997, 33.3 | 85, 30.0 | 31, 29.0 |
| Antidiabetic drug(s), yes | 252, 8.4 | 16, 5.2 | 10, 9.3 |
| Unadjusted β (95% CI) | Adjusted * β (95% CI) | Unadjusted β (95% CI) | Adjusted * β (95% CI) | Unadjusted β (95% CI) | Adjusted * β (95% CI) | Unadjusted β (95% CI) | Adjusted * β (95% CI) | ||||
|---|---|---|---|---|---|---|---|---|---|---|---|
| SPB, mmHg | |||||||||||
| ≤0.42 g/kg of BW | 1.0 (Reference) | 1.0 (Reference) | ≤0.79 g/kg of BW | 1.0 (Reference) | 1.0 (Reference) | 0.80−0.99 g/kg of BW | 1.0 (Reference) | 1.0 (Reference) | Protein intake g/kg of BW | −1.546 (−4.431, 1.339) | −2.031 (−9.593, 5.531) |
| ≥0.71 g/kg of BW | −0.227 (−0.667, 0.212) | −0.284 (−1.332, 0.764) | ≥1.00 g/kg of BW | −0.427 (−1.705, 0.851) | 1.031 (−1.488, 3.549) | ≥1.00 g/kg of BW | −0.183 (−1.149, 0.782) | 0.287 (−0.891, 1.464) | |||
| DBP, mmHg | |||||||||||
| ≤0.42 g/kg of BW | 1.0 (Reference) | 1.0 (Reference) | ≤0.79 g/kg of BW | 1.0 (Reference) | 1.0 (Reference) | 0.80−0.99 g/kg of BW | 1.0 (Reference) | 1.0 (Reference) | Protein intake, g/kg of BW | −3.661 (−5.380, −1.943) | −4.925 (−9.455, −0.394) |
| ≥0.71 g/kg of BW | −0.437 (−0.696, −0.178) | −0.236 (−0.864, 0.392) | ≥1.00 g/kg of BW | −1.259 (−2.025, −0.494) | 3.258 (−0.009, 6.525) | ≥1.00 g/kg of BW | −0.838 (−1.417, −0.259) | −0.168 (−0.877, 0.542) |
| Unadjusted β (95% CI) | Adjusted * β (95% CI) | Unadjusted β (95% CI) | Adjusted * β (95% CI) | Unadjusted β (95% CI) | Adjusted * β (95% CI) | Unadjusted β (95% CI) | Adjusted * β (95% CI) | ||||
|---|---|---|---|---|---|---|---|---|---|---|---|
| Cholesterol, mg/dL | |||||||||||
| ≤0.42 g/kg of BW | 1.0 (Reference) | 1.0 (Reference) | ≤0.79 g/kg of BW | 1.0 (Reference) | 1.0 (Reference) | 0.80−0.99 g/kg of BW | 1.0 (Reference) | 1.0 (Reference) | Protein intake, g/kg of BW | 14.085 (8.188, 19.983) | 17.139 (2.021, 32.256) |
| ≥0.71 g/kg of BW | 1.521 (0.595, 2.446) | −0.881 (−3.061, 1.298) | ≥1.00 g/kg of BW | 5.818 (3.174, 8.462) | −0.418 (−1.381, 0.546) | ≥1.00 g/kg of BW | 4.122 (2.212, 6.218) | 2.400 (−0.012, 4.812) |
| Unadjusted β (95% CI) | Adjusted * β (95% CI) | Unadjusted β (95% CI) | Adjusted * β (95% CI) | Unadjusted β (95% CI) | Adjusted * β (95% CI) | Unadjusted β (95% CI) | Adjusted * β (95% CI) | ||||
|---|---|---|---|---|---|---|---|---|---|---|---|
| Glucose, mg/dL | |||||||||||
| ≤0.42 g/kg of BW | 1.0 (Reference) | 1.0 (Reference) | ≤0.79 g/kg of BW | 1.0 (Reference) | 1.0 (Reference) | 0.80−0.99 g/kg of BW | 1.0 (Reference) | 1.0 (Reference) | Protein intake, g/kg of BW | −4.384 (−8.841, 0.073) | −7.362 (−18.472, 3.748) |
| ≥0.71 g/kg of BW | −0.579 (−1.275, 0.116) | 0.078 (−1.475, 1.630) | ≥1.00 g/kg of BW | −0.560 (−2.561, 1.441) | 0.412 (−1.189, 2.012) | ≥1.00 g/kg of BW | −0.116 (−1.627, 1.396) | 0.624 (−1.142, 2.391) |
Disclaimer/Publisher’s Note: The statements, opinions and data contained in all publications are solely those of the individual author(s) and contributor(s) and not of MDPI and/or the editor(s). MDPI and/or the editor(s) disclaim responsibility for any injury to people or property resulting from any ideas, methods, instructions or products referred to in the content. |
© 2023 by the authors. Licensee MDPI, Basel, Switzerland. This article is an open access article distributed under the terms and conditions of the Creative Commons Attribution (CC BY) license (https://creativecommons.org/licenses/by/4.0/).
Share and Cite
Coelho-Júnior, H.J.; Calvani, R.; Picca, A.; Tosato, M.; Savera, G.; Landi, F.; Marzetti, E. Protein Intake Is Associated with Blood Pressure and Cholesterol Levels in Italian Older Adults: A Cross-Sectional Study. Metabolites 2023, 13, 431. https://doi.org/10.3390/metabo13030431
Coelho-Júnior HJ, Calvani R, Picca A, Tosato M, Savera G, Landi F, Marzetti E. Protein Intake Is Associated with Blood Pressure and Cholesterol Levels in Italian Older Adults: A Cross-Sectional Study. Metabolites. 2023; 13(3):431. https://doi.org/10.3390/metabo13030431
Chicago/Turabian StyleCoelho-Júnior, Hélio José, Riccardo Calvani, Anna Picca, Matteo Tosato, Giulia Savera, Francesco Landi, and Emanuele Marzetti. 2023. "Protein Intake Is Associated with Blood Pressure and Cholesterol Levels in Italian Older Adults: A Cross-Sectional Study" Metabolites 13, no. 3: 431. https://doi.org/10.3390/metabo13030431