
Digesta and Plasma Metabolomics of Rainbow Trout Strains with Varied Tolerance of Plant-Based Diets Highlights Potential for Non-Lethal Assessments of Enteritis Development

 , ,
, ,  and
and
Abstract
:
1. Introduction
2. Results
2.1. Fish Growth
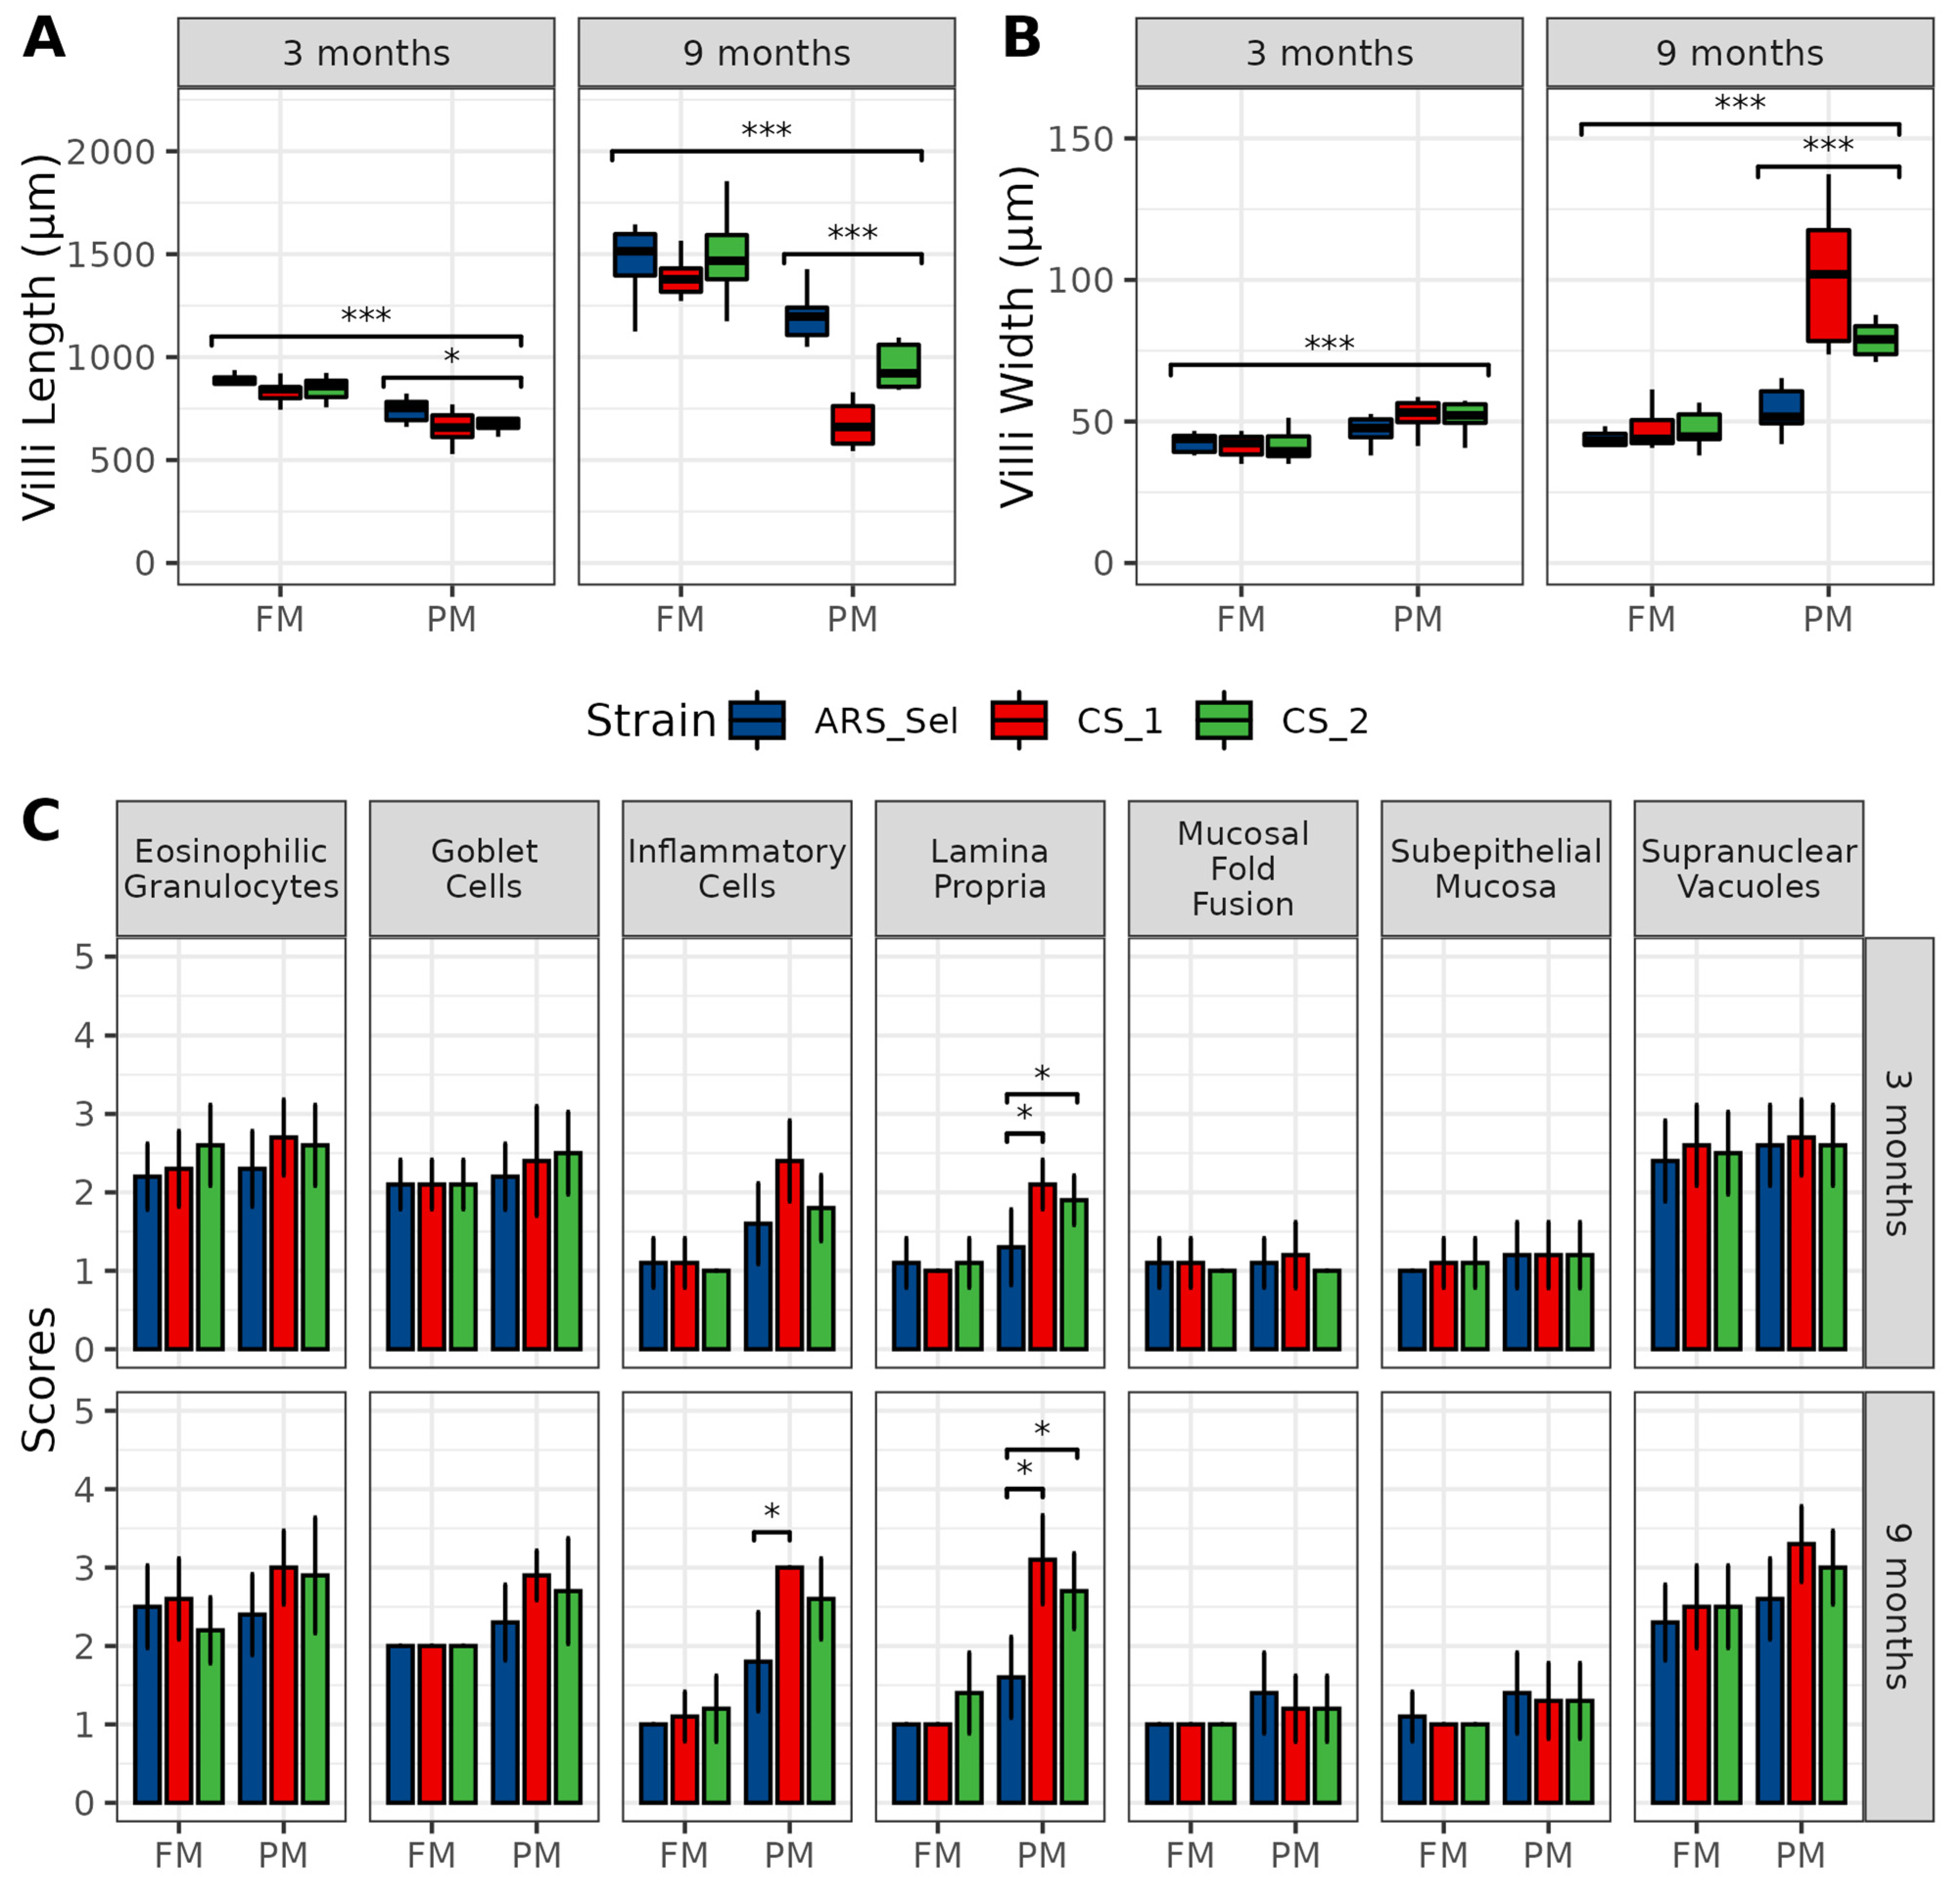
2.2. Intestinal Histology
2.3. Plasma and Digesta Metabolome Analysis
3. Discussion
4. Material and Methods
4.1. Animal Experiment
4.2. Histological Analysis
4.3. Sample Processing
4.4. NMR Acquisition
4.5. Metabolite Profiling
4.6. Statistical Analyses
5. Conclusions
Supplementary Materials
Author Contributions
Funding
Institutional Review Board Statement
Informed Consent Statement
Data Availability Statement
Acknowledgments
Conflicts of Interest
References
- Turchini, G.M.; Trushenski, J.T.; Glencross, B.D. Thoughts for the Future of Aquaculture Nutrition: Realigning Perspectives to Reflect Contemporary Issues Related to Judicious Use of Marine Resources in Aquafeeds. N. Am. J. Aquac. 2019, 81, 13–39. [Google Scholar] [CrossRef]
- FAO. The State World Fish Aquaculture 2020. Sustainability in Action; FAO: Rome, Italy, 2020. [Google Scholar]
- Panserat, S.; Hortopan, G.A.; Plagnes-Juan, E.; Kolditz, C.; Lansard, M.; Skiba-Cassy, S.; Esquerré, D.; Geurden, I.; Médale, F.; Kaushik, S.; et al. Differential gene expression after total replacement of dietary fish meal and fish oil by plant products in rainbow trout (Oncorhynchus mykiss) liver. Aquaculture 2009, 294, 123–131. [Google Scholar] [CrossRef] [Green Version]
- Glencross, B.; Blyth, D.; Tabrett, S.; Bourne, N.; Irvin, S.; Anderson, M.; Fox-Smith, T.; Smullen, R. An assessment of cereal grains and other starch sources in diets for barramundi (Lates calcarifer)—Implications for nutritional and functional qualities of extruded feeds. Aquac. Nutr. 2012, 18, 388–399. [Google Scholar] [CrossRef]
- Gatesoupe, F.-J.; Fauconneau, B.; Deborde, C.; Madji Hounoum, B.; Jacob, D.; Moing, A.; Corraze, G.; Médale, F. Intestinal microbiota in rainbow trout, Oncorhynchus mykiss, fed diets with different levels of fish-based and plant ingredients: A correlative approach with some plasma metabolites. Aquac. Nutr. 2018, 24, 1563–1576. [Google Scholar] [CrossRef]
- Lazzarotto, V.; Médale, F.; Larroquet, L.; Corraze, G. Long-term dietary replacement of fishmeal and fish oil in diets for rainbow trout (Oncorhynchus mykiss): Effects on growth, whole body fatty acids and intestinal and hepatic gene expression. PLoS ONE 2018, 13, e0190730. [Google Scholar] [CrossRef] [Green Version]
- Kokou, F.; Fountoulaki, E. Aquaculture waste production associated with antinutrient presence in common fish feed plant ingredients. Aquaculture 2018, 495, 295–310. [Google Scholar] [CrossRef]
- Bansemer, M.S.; Forder, R.E.A.; Howarth, G.S.; Suitor, G.M.; Bowyer, J.; Stone, D.A.J. The effect of dietary soybean meal and soy protein concentrate on the intestinal mucus layer and development of subacute enteritis in Yellowtail Kingfish (Seriola lalandi) at suboptimal water temperature. Aquac. Nutr. 2015, 21, 300–310. [Google Scholar] [CrossRef]
- Krogdahl, Å.; Gajardo, K.; Kortner, T.M.; Penn, M.; Gu, M.; Berge, G.M.; Bakke, A.M. Soya Saponins Induce Enteritis in Atlantic Salmon (Salmo salar L.). J. Agric. Food Chem. 2015, 63, 3887–3902. [Google Scholar] [CrossRef]
- Ding, Z.; Zhang, Y.; Ye, J.; Du, Z.; Kong, Y. An evaluation of replacing fish meal with fermented soybean meal in the diet of Macrobrachium nipponense: Growth, nonspecific immunity, and resistance to Aeromonas hydrophila. Fish Shellfish Immunol. 2015, 44, 295–301. [Google Scholar] [CrossRef]
- Balasubramanian, M.N.; Panserat, S.; Dupont-Nivet, M.; Quillet, E.; Montfort, J.; Le Cam, A.; Medale, F.; Kaushik, S.J.; Geurden, I. Molecular pathways associated with the nutritional programming of plant-based diet acceptance in rainbow trout following an early feeding exposure. BMC Genom. 2016, 17, 449. [Google Scholar] [CrossRef] [Green Version]
- Kause, A.; Kiessling, A.; Martin, S.A.M.; Houlihan, D.; Ruohonen, K. Genetic improvement of feed conversion ratio via indirect selection against lipid deposition in farmed rainbow trout (Oncorhynchus mykiss Walbaum). Br. J. Nutr. 2016, 116, 1656–1665. [Google Scholar] [CrossRef] [Green Version]
- De Verdal, H.; Komen, H.; Quillet, E.; Chatain, B.; Allal, F.; Benzie, J.A.H.; Vandeputte, M. Improving feed efficiency in fish using selective breeding: A review. Rev. Aquac. 2018, 10, 833–851. [Google Scholar] [CrossRef]
- Vandeputte, M.; Bugeon, J.; Bestin, A.; Desgranges, A.; Allamellou, J.-M.; Tyran, A.-S.; Allal, F.; Dupont-Nivet, M.; Haffray, P. First Evidence of Realized Selection Response on Fillet Yield in Rainbow Trout Oncorhynchus mykiss, Using Sib Selection or Based on Correlated Ultrasound Measurements. Front. Genet. 2019, 10, 1225. [Google Scholar] [CrossRef]
- Kamalam, B.S.; Médale, F.; Larroquet, L.; Corraze, G.; Panserat, S. Metabolism and fatty acid profile in fat and lean rainbow trout lines fed with vegetable oil: Effect of carbohydrates. PLoS ONE 2013, 8, e76570. [Google Scholar] [CrossRef] [Green Version]
- Song, X.; Marandel, L.; Dupont-Nivet, M.; Quillet, E.; Geurden, I.; Panserat, S. Hepatic glucose metabolic responses to digestible dietary carbohydrates in two isogenic lines of rainbow trout. Biol. Open 2018, 7, bio032896. [Google Scholar] [CrossRef] [Green Version]
- Overturf, K.; Barrows, F.T.; Hardy, R.W. Effect and interaction of rainbow trout strain (Oncorhynchus mykiss) and diet type on growth and nutrient retention. Aquac. Res. 2013, 44, 604–611. [Google Scholar] [CrossRef]
- Venold, F.F.; Penn, M.H.; Krogdahl, Å.; Overturf, K. Severity of soybean meal induced distal intestinal inflammation, enterocyte proliferation rate, and fatty acid binding protein (Fabp2) level differ between strains of rainbow trout (Oncorhynchus mykiss). Aquaculture 2012, 364–365, 281–292. [Google Scholar] [CrossRef]
- Abernathy, J.; Brezas, A.; Snekvik, K.R.; Hardy, R.W.; Overturf, K. Integrative functional analyses using rainbow trout selected for tolerance to plant diets reveal nutrigenomic signatures for soy utilization without the concurrence of enteritis. PLoS ONE 2017, 12, e0180972. [Google Scholar]
- Blaufuss, P.C.; Bledsoe, J.W.; Gaylord, T.G.; Sealey, W.M.; Overturf, K.E.; Powell, M.S. Selection on a plant-based diet reveals changes in oral tolerance, microbiota and growth in rainbow trout (Oncorhynchus mykiss) when fed a high soy diet. Aquaculture 2020, 525, 735287. [Google Scholar] [CrossRef]
- Brezas, A.; Hardy, R.W. Improved performance of a rainbow trout selected strain is associated with protein digestion rates and synchronization of amino acid absorption. Sci. Rep. 2020, 10, 4678. [Google Scholar] [CrossRef] [Green Version]
- Lee, S.; Small, B.C.; Patro, B.; Overturf, K.; Hardy, R.W. The dietary lysine requirement for optimum protein retention differs with rainbow trout (Oncorhynchus mykiss Walbaum) strain. Aquaculture 2020, 514, 734483. [Google Scholar] [CrossRef]
- Jarak, I.; Tavares, L.; Palma, M.; Rito, J.; Carvalho, R.A.; Viegas, I. Response to dietary carbohydrates in European seabass (Dicentrarchus labrax) muscle tissue as revealed by NMR-based metabolomics. Metabolomics 2018, 14, 95. [Google Scholar] [CrossRef]
- Cheng, K.; Müllner, E.; Moazzami, A.A.; Carlberg, H.; Brännäs, E.; Pickova, J. Metabolomics Approach To Evaluate a Baltic Sea Sourced Diet for Cultured Arctic Char (Salvelinus alpinus L.). J. Agric. Food Chem. 2017, 65, 5083–5090. [Google Scholar] [CrossRef]
- Palma, M.; Trenkner, L.H.; Rito, J.; Tavares, L.C.; Silva, E.; Glencross, B.D.; Jones, J.G.; Wade, N.M.; Viegas, I. Limitations to Starch Utilization in Barramundi (Lates calcarifer) as Revealed by NMR-Based Metabolomics. Front. Physiol. 2020, 11, 205. [Google Scholar] [CrossRef]
- Roques, S.; Deborde, C.; Richard, N.; Skiba-Cassy, S.; Moing, A.; Fauconneau, B. Metabolomics and fish nutrition: A review in the context of sustainable feed development. Rev. Aquac. 2018, 12, 261–282. [Google Scholar] [CrossRef] [Green Version]
- Palma, M.; Tavares, L.; Rito, J.; Henriques, L.; Silva, J.; Ozório, R.; Pardal, M.; Magnoni, L.; Viegas, I. Metabolic Effects of Dietary Glycerol Supplementation in Muscle and Liver of European Seabass and Rainbow Trout by 1H NMR Metabolomics. Metabolites 2019, 9, 202. [Google Scholar] [CrossRef] [Green Version]
- Roques, S.; Deborde, C.; Richard, N.; Sergent, L.; Kurz, F.; Skiba-Cassy, S.; Fauconneau, B.; Moing, A. Characterizing alternative feeds for rainbow trout (O. mykiss) by 1H NMR metabolomics. Metabolomics 2018, 14, 155. [Google Scholar] [CrossRef] [Green Version]
- Prathomya, P.; Prisingkorn, W.; Jakovlić, I.; Deng, F.-Y.; Zhao, Y.-H.; Wang, W.-M. 1H NMR-based metabolomics approach reveals metabolic alterations in response to dietary imbalances in Megalobrama amblycephala. Metabolomics 2017, 13, 17. [Google Scholar] [CrossRef]
- Casu, F.; Watson, A.M.; Yost, J.; Leffler, J.W.; Gaylord, T.G.; Barrows, F.T.; Sandifer, P.A.; Denson, M.R.; Bearden, D.W. Metabolomics Analysis of Effects of Commercial Soy-based Protein Products in Red Drum (Sciaenops ocellatus). J. Proteome Res. 2017, 16, 2481–2494. [Google Scholar] [CrossRef] [PubMed]
- Louvado, A.; Coelho, F.J.R.C.; Palma, M.; Tavares, L.C.; Ozório, R.O.A.; Magnoni, L.; Viegas, I.; Gomes, N.C.M. Effect of glycerol feed-supplementation on seabass metabolism and gut microbiota. Appl. Microbiol. Biotechnol. 2020, 104, 8439–8453. [Google Scholar] [CrossRef]
- Coronado, M.; Solis, C.J.; Hernandez, P.P.; Feijóo, C.G. Soybean Meal-Induced Intestinal Inflammation in Zebrafish Is T Cell-Dependent and Has a Th17 Cytokine Profile. Front. Immunol. 2019, 10, 610. [Google Scholar] [CrossRef] [PubMed]
- Li, P.; Mai, K.; Trushenski, J.; Wu, G. New developments in fish amino acid nutrition: Towards functional and environmentally oriented aquafeeds. Amino Acids 2009, 37, 43–53. [Google Scholar] [CrossRef]
- Alami-Durante, H.; Bazin, D.; Cluzeaud, M.; Fontagné-Dicharry, S.; Kaushik, S.; Geurden, I. Effect of dietary methionine level on muscle growth mechanisms in juvenile rainbow trout (Oncorhynchus mykiss). Aquaculture 2018, 483, 273–285. [Google Scholar] [CrossRef]
- Coutinho, F.; Simões, R.; Monge-Ortiz, R.; Furuya, W.M.; Pousão-Ferreira, P.; Kaushik, S.; Oliva-Teles, A.; Peres, H. Effects of dietary methionine and taurine supplementation to low-fish meal diets on growth performance and oxidative status of European sea bass (Dicentrarchus labrax) juveniles. Aquaculture 2017, 479, 447–454. [Google Scholar] [CrossRef]
- Latimer, M.N.; Cleveland, B.M.; Biga, P.R. Dietary methionine restriction: Effects on glucose tolerance, lipid content and micro-RNA composition in the muscle of rainbow trout. Comp. Biochem. Physiol. Toxicol. Pharmacol. CBP 2018, 208, 47–52. [Google Scholar] [CrossRef] [PubMed]
- Zhang, W.; Tan, B.; Ye, G.; Wang, J.; Dong, X.; Yang, Q.; Chi, S.; Liu, H.; Zhang, S.; Zhang, H. Identification of potential biomarkers for soybean meal-induced enteritis in juvenile pearl gentian grouper, Epinephelus lanceolatus♂ × Epinephelus fuscoguttatus♀. Aquaculture 2019, 512, 734337. [Google Scholar] [CrossRef]
- Ringø, E.; Zhou, Z.; Vecino, J.L.G.; Wadsworth, S.; Romero, J.; Krogdahl, Å.; Olsen, R.E.; Dimitroglou, A.; Foey, A.; Davies, S.; et al. Effect of dietary components on the gut microbiota of aquatic animals. A never-ending story? Aquac. Nutr. 2016, 22, 219–282. [Google Scholar] [CrossRef] [Green Version]
- Bakke-McKellep, A.M.; Penn, M.H.; Salas, P.M.; Refstie, S.; Sperstad, S.; Landsverk, T.; Ringø, E.; Krogdahl, Å. Effects of dietary soyabean meal, inulin and oxytetracycline on intestinal microbiota and epithelial cell stress, apoptosis and proliferation in the teleost Atlantic salmon (Salmo salar L.). Br. J. Nutr. 2007, 97, 699–713. [Google Scholar] [CrossRef] [Green Version]
- Merrifield, D.L.; Dimitroglou, A.; Bradley, G.; Baker, R.T.M.; Davies, S.J. Soybean meal alters autochthonous microbial populations, microvilli morphology and compromises intestinal enterocyte integrity of rainbow trout, Oncorhynchus mykiss (Walbaum). J. Fish Dis. 2009, 32, 755–766. [Google Scholar] [CrossRef]
- Leary, S.; Underwood, W.; Anthony, R.; Cartner, S.; Corey, D.; Grandin, T.; Greenacre, C.; Gwatney-Brant, S.; McCrackin, M.; Meyer, R.; et al. AVMA Guidelines for the Euthanasia of Animals: 2013 Edition; American Veterinary Medical Association: Schaumburg, IL, USA, 2013. [Google Scholar]
- Ravanbakhsh, S.; Liu, P.; Bjorndahl, T.C.; Mandal, R.; Grant, J.R.; Wilson, M.; Eisner, R.; Sinelnikov, I.; Hu, X.; Luchinat, C.; et al. Accurate, Fully-Automated NMR Spectral Profiling for Metabolomics. PLoS ONE 2015, 10, e0124219. [Google Scholar] [CrossRef] [Green Version]
- Mercier, P.; Lewis, M.J.; Chang, D.; Baker, D.; Wishart, D.S. Towards automatic metabolomic profiling of high-resolution one-dimensional proton NMR spectra. J. Biomol. NMR 2011, 49, 307–323. [Google Scholar] [CrossRef]
- Sumner, L.W.; Amberg, A.; Barrett, D.; Beale, M.H.; Beger, R.; Daykin, C.A.; Fan, T.W.M.; Fiehn, O.; Goodacre, R.; Griffin, J.L.; et al. Proposed minimum reporting standards for chemical analysis: Chemical Analysis Working Group (CAWG) Metabolomics Standards Initiative (MSI). Metabolomics 2007, 3, 211–221. [Google Scholar] [CrossRef] [Green Version]
- Chong, J.; Soufan, O.; Li, C.; Caraus, I.; Li, S.; Bourque, G.; Wishart, D.S.; Xia, J. MetaboAnalyst 4.0: Towards more transparent and integrative metabolomics analysis. Nucleic Acids Res. 2018, 46, W486–W494. [Google Scholar] [CrossRef] [Green Version]
- Xia, J.; Wishart, D.S. Using metaboanalyst 3.0 for comprehensive metabolomics data analysis. Curr. Protoc. Bioinform. 2016, 55, 14.10.1–14.10.91. [Google Scholar] [CrossRef]
- Emwas, A.-H.; Roy, R.; McKay, R.T.; Tenori, L.; Saccenti, E.; Gowda, G.A.N.; Raftery, D.; Alahmari, F.; Jaremko, L.; Jaremko, M.; et al. NMR Spectroscopy for Metabolomics Research. Metabolites 2019, 9, 123. [Google Scholar] [CrossRef] [Green Version]
- Grootveld, M.; Percival, B.; Gibson, M.; Osman, Y.; Edgar, M.; Molinari, M.; Mather, M.L.; Casanova, F.; Wilson, P.B. Progress in low-field benchtop NMR spectroscopy in chemical and biochemical analysis. Anal. Chim. Acta 2019, 1067, 11–30. [Google Scholar] [CrossRef] [PubMed] [Green Version]
- Percival, B.C.; Grootveld, M.; Gibson, M.; Osman, Y.; Molinari, M.; Jafari, F.; Sahota, T.; Martin, M.; Casanova, F.; Mather, M.L.; et al. Low-Field, Benchtop NMR Spectroscopy as a Potential Tool for Point-of-Care Diagnostics of Metabolic Conditions: Validation, Protocols and Computational Models. High-Throughput 2019, 8, 2. [Google Scholar] [CrossRef] [Green Version]
- Izquierdo-Garcia, J.L.; Comella-del-Barrio, P.; Campos-Olivas, R.; Villar-Hernández, R.; Prat-Aymerich, C.; De Souza-Galvão, M.L.; Jiménez-Fuentes, M.A.; Ruiz-Manzano, J.; Stojanovic, Z.; González, A.; et al. Discovery and validation of an NMR-based metabolomic profile in urine as TB biomarker. Sci. Rep. 2020, 10, 22317. [Google Scholar] [CrossRef] [PubMed]


| Strain | Diet | 3 Months | 9 Months |
|---|---|---|---|
| ARS_Sel | FM | 167.7 ± 31.79 | 936.8 ± 349.5 |
| PM | 192.2 ± 25.51 | 742.8 ± 124.4 | |
| CS_1 | FM | 188.0 ± 29.71 | 872.0 ± 162.7 |
| PM | 167.0 ± 28.69 | 587.9 ± 133.6 | |
| CS_2 | FM | 152.7 ± 15.20 | 1013 ± 179.0 |
| PM | 154.7 ± 23.58 | 725.6 ± 126.0 | |
| Two-way ANOVA | Strain | 0.004 | 0.078 |
| Diet | 0.790 | <0.001 | |
| Strain:Diet | 0.030 | 0.340 | |
| Tukey’s HSD (Strain) | ARS_Sel vs. CS_1 | 0.953 | NA |
| ARS_Sel vs. CS_2 | 0.007 | ||
| CS_1 vs. CS_2 | 0.016 | ||
| Tukey’s HSD (Strain:Diet) | CS_1:FM vs. CS_2:FM | 0.045 | NA |
| ARS_Sel:PM vs. CS_2:FM | 0.017 | ||
| CS_2:PM vs. ARS_Sel:PM | 0.027 |
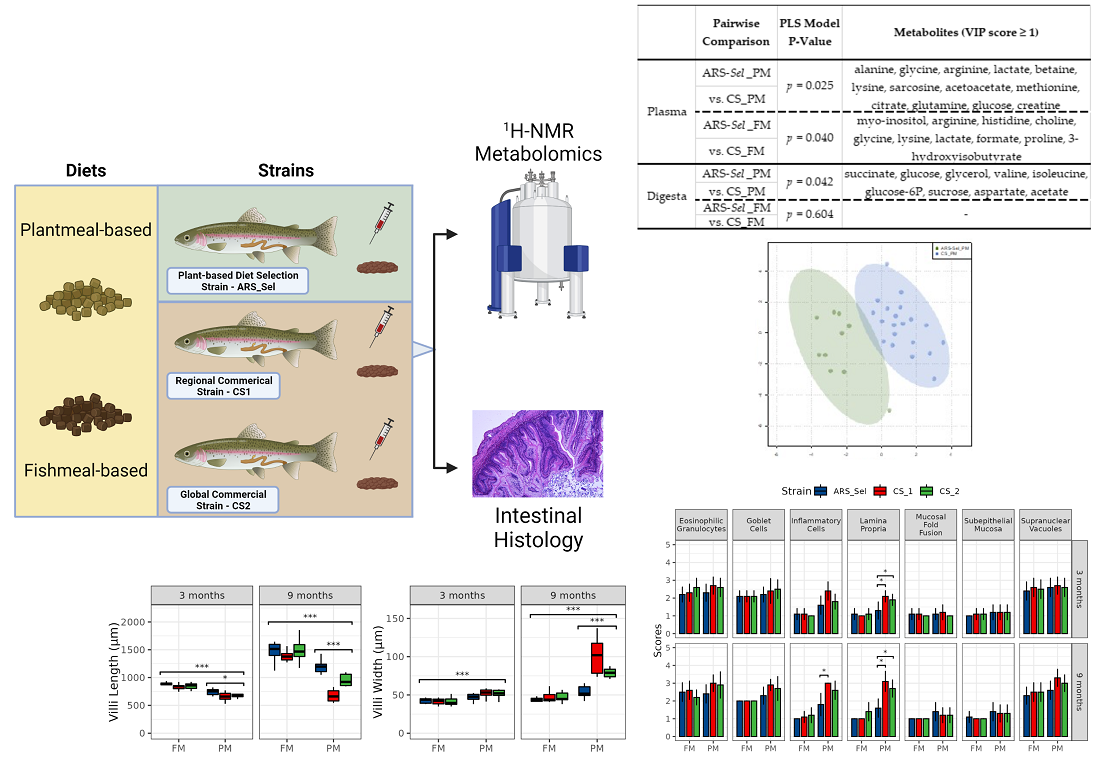
| Pairwise Comparison | PLS Permutation Test | Metabolites (VIP Score ≥ 1) | Figure | |
|---|---|---|---|---|
| Plasma | ARS-Sel_PM vs. CS_PM | p = 0.025 | alanine, glycine, arginine, lactate, betaine, lysine, sarcosine, acetoacetate, methionine, citrate, glutamine, glucose, creatine | Figure 2 |
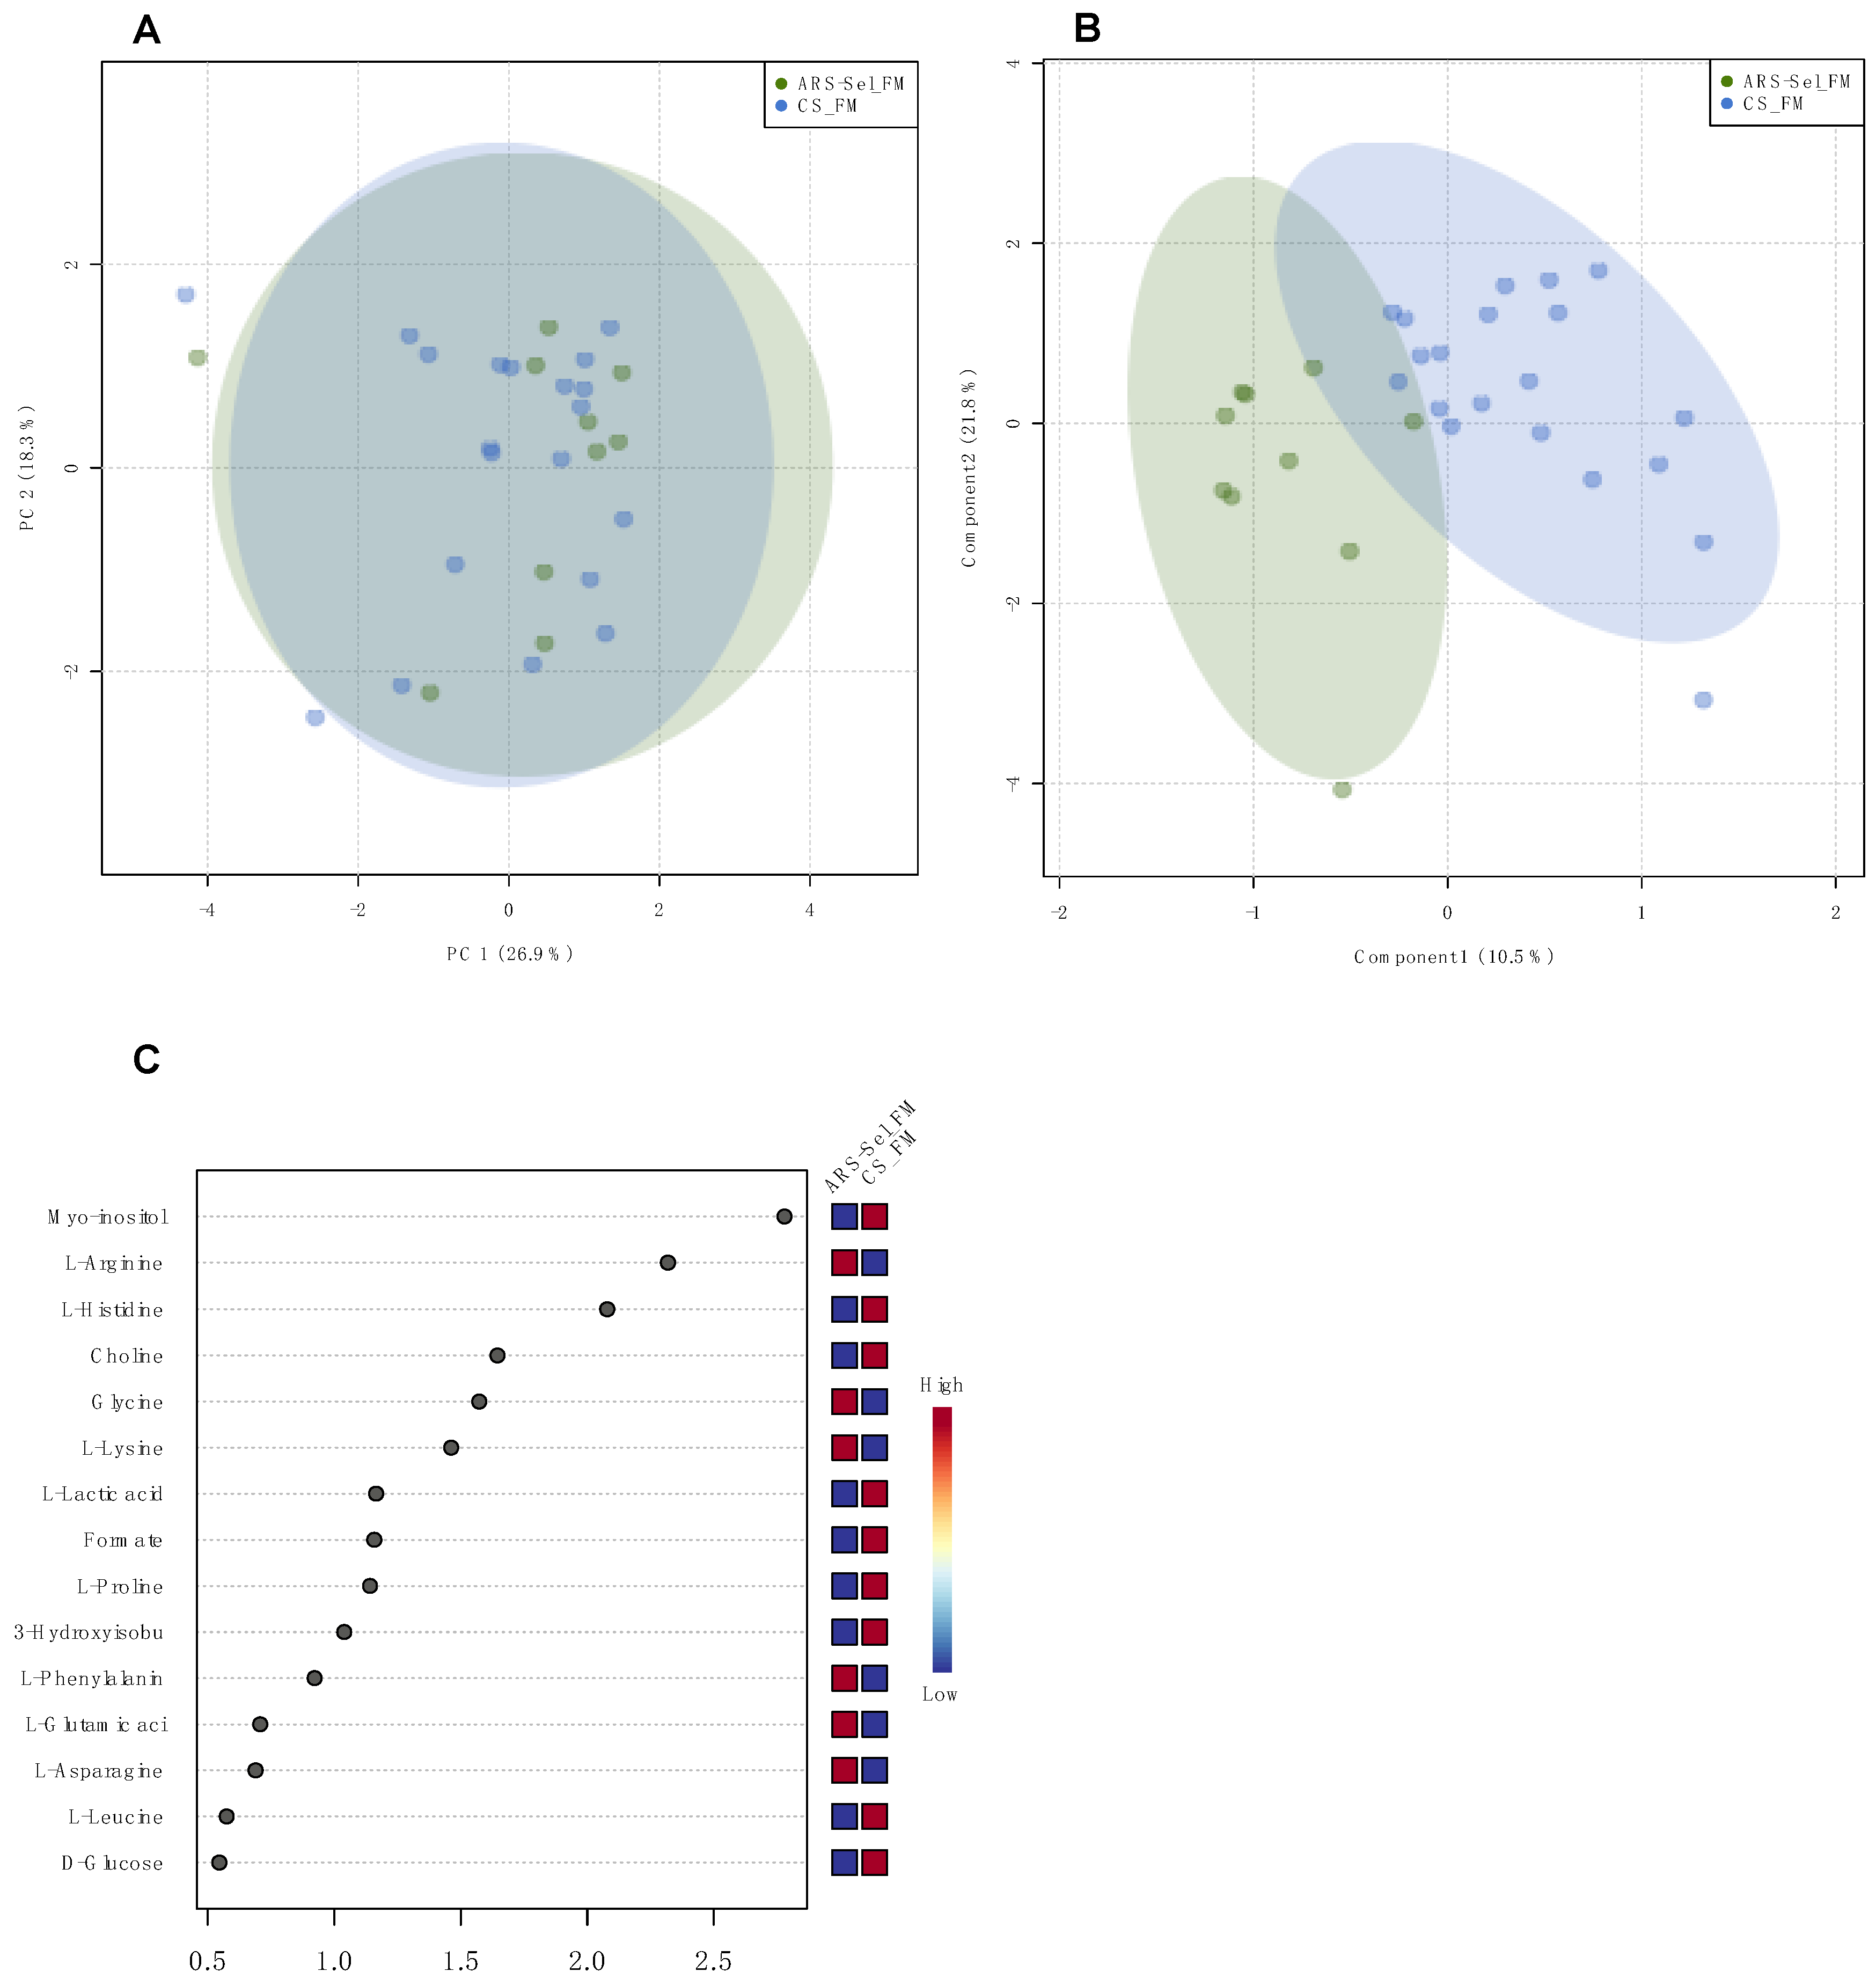
| ARS-Sel_FM vs. CS_FM | p = 0.040 | myo-inositol, arginine, histidine, choline, glycine, lysine, lactate, formate, proline, 3-hydroxyisobutyrate | Figure 3 | |
| Digesta | ARS-Sel_PM vs. CS_PM | p = 0.042 | succinate, glucose, glycerol, valine, isoleucine, glucose-6P, sucrose, aspartate, acetate | Figure 4 |
| ARS-Sel_FM vs. CS_FM | p = 0.604 | - | Figure S3 |
| Ingredient (%) | PM | FM |
|---|---|---|
| Soybean meal a | 25 | -- |
| Soy protein concentrate b | 23.43 | -- |
| Corn protein concentrate c | 10.23 | -- |
| Fish meal d | -- | 28.2 |
| Poultry by-product meal e | -- | 21.52 |
| Blood meal f | -- | 4.3 |
| Wheat flour g | 13.3 | 27.56 |
| Wheat gluten meal | 2.24 | -- |
| Fish oil h | 17 | 14.4 |
| Lysine HCl | 1.85 | 1.12 |
| Methionine | 0.59 | 0.42 |
| Threonine | 0.32 | 0.58 |
| Taurine i | 0.5 | -- |
| Dicalcium phosphate | 2.75 | -- |
| Vitamin premix j | 1 | 1 |
| Choline CL | 0.6 | 0.6 |
| Vitamin C k | 0.2 | 0.2 |
| Trace min premix l | 0.1 | 0.1 |
| Potassium chloride m | 0.56 | -- |
| Sodium Chloride | 0.28 | -- |
| Magnesium oxide m | 0.05 | -- |
| Calculated Composition, as-is basis | ||
| Crude Protein, % | 40 | 40 |
| Crude Lipid, % | 20 | 20 |
| Phosphorus, % | 0.9 | 1.16 |
Publisher’s Note: MDPI stays neutral with regard to jurisdictional claims in published maps and institutional affiliations. |
© 2021 by the authors. Licensee MDPI, Basel, Switzerland. This article is an open access article distributed under the terms and conditions of the Creative Commons Attribution (CC BY) license (https://creativecommons.org/licenses/by/4.0/).
Share and Cite
Palma, M.; Bledsoe, J.W.; Tavares, L.C.; Romano, N.; Small, B.C.; Viegas, I.; Overturf, K. Digesta and Plasma Metabolomics of Rainbow Trout Strains with Varied Tolerance of Plant-Based Diets Highlights Potential for Non-Lethal Assessments of Enteritis Development. Metabolites 2021, 11, 590. https://doi.org/10.3390/metabo11090590
Palma M, Bledsoe JW, Tavares LC, Romano N, Small BC, Viegas I, Overturf K. Digesta and Plasma Metabolomics of Rainbow Trout Strains with Varied Tolerance of Plant-Based Diets Highlights Potential for Non-Lethal Assessments of Enteritis Development. Metabolites. 2021; 11(9):590. https://doi.org/10.3390/metabo11090590
Chicago/Turabian StylePalma, Mariana, Jacob W. Bledsoe, Ludgero C. Tavares, Nicholas Romano, Brian C. Small, Ivan Viegas, and Ken Overturf. 2021. "Digesta and Plasma Metabolomics of Rainbow Trout Strains with Varied Tolerance of Plant-Based Diets Highlights Potential for Non-Lethal Assessments of Enteritis Development" Metabolites 11, no. 9: 590. https://doi.org/10.3390/metabo11090590