Article

Analysis of Host Jejunum Transcriptome and Associated Microbial Community Structure Variation in Young Calves with Feed-Induced Acidosis

1
College of Animal Science and Technology, China Agricultural University, No.2 Yuanmingyuan West Road, Haidian, Beijing 100193, China
2
Cell Wall Biology and Utilization Research Unit, US Dairy Forage Research Center, Agricultural Research Service, US Department of Agriculture, 1925 Linden Drive, Madison, WI 53706, USA
3
Department of Dairy Science, University of Wisconsin-Madison, Madison, WI 53706, USA
*
Authors to whom correspondence should be addressed.
Metabolites 2021, 11(7), 414; https://doi.org/10.3390/metabo11070414
Submission received: 11 May 2021 / Revised: 15 June 2021 / Accepted: 15 June 2021 / Published: 23 June 2021
(This article belongs to the Special Issue Multi-Omics Methods in Dairy Research)

Abstract

:
Diet-induced acidosis imposes a health risk to young calves. In this study, we aimed to investigate the host jejunum transcriptome changes, along with its microbial community variations, using our established model of feed-induced ruminal acidosis in young calves. Eight bull calves were randomly assigned to two diet treatments beginning at birth (a starch-rich diet, Aci; a control diet, Con). Whole-transcriptome RNA sequencing was performed on the jejunum tissues collected at 17 weeks of age. Ribosomal RNA reads were used for studying microbial community structure variations in the jejunum. A total of 853 differentially expressed genes were identified (402 upregulated and 451 downregulated) between the two groups. The cell cycle and the digestion and absorption of protein in jejunal tissue were affected by acidosis. Compared to the control, genera of Campylobacter, Burkholderia, Acidaminococcus, Corynebacterium, and Olsenella significantly increased in abundance in the Aci group, while Lachnoclostridium and Ruminococcus were significantly lower in the Aci group. Expression changes in the AXL gene were associated with the abundance variations of a high number of genera in jejunum. Our study provided a snapshot of the transcriptome changes in the jejunum and its associated meta-transcriptome changes in microbial communities in young calves with feed-induced acidosis.

1. Introduction

During early development, ruminants go through a suite of gradual and complex morphological changes, enabling them to efficiently digest milk as its primary diet, and then to transition into a plant-based diet. During the weaning transition period, as solid feed intake increases, there must be qualitative changes in nutrient digestion and metabolism pathways [1]. These changes include the development of immune defense mechanisms, adaptation to energy metabolism, and nutrient digestion and absorption [2]. In this context, the early development and maturation of the gastrointestinal tract (GIT) is important because it plays a crucial role in nutrient absorption in addition to its role as the first line of immune defense [3]. In cattle, calf GIT development is affected by different feeding strategies, and such effects have long-lasting impacts on calf performance [4,5,6]. To promote rumen development and help with the early weaning of the calves, consumption of the maximum amount of easily fermentable starter is commonly practiced during the weaning period [7,8]. However, calves fed high-starch diets could produce an excessive amount of short-chain fatty acids (SCFAs). Once the production of SCFAs exceeds ruminal buffering capacity, passage rate, and especially absorption rate, ruminal pH will drop substantially [9], leading to subacute ruminal acidosis (SARA) [10,11], which is one of the most common metabolic diseases in ruminants [12].
So far, the rumen has been the major focus in dairy cattle nutritional physiology research. It is important to recognize that the effects and the conceivable pathogenesis of acidosis and SARA may not be restricted solely to the rumen. Other parts of the GIT may well be affected [13,14,15]. Among them, the lower gut has received very limited attention. Studies of the lower gut in cattle afflicted by SARA will most likely provide critical knowledge in the treatment and prevention of feed-induced SARA. Bridging the stomach and large intestine in mammals, the small intestine serves as the key point for nutrient and mineral absorption. The three distinct regions of the small intestine, the duodenum, jejunum, and ileum work together to complete the nutrient digestion. The jejunum mainly absorbs small nutrient particles digested in the duodenum [16]. The main function of the ileum is to absorb the available nutrients that were not absorbed by the jejunum. The nutrients transported through the epithelial cells of the jejunum and ileum include fructose, vitamins, glucose, amino acids, and small peptides [17,18]. The interior of the jejunum is lined with villi (small finger-like projections), which expand the effective surface area needed for nutrient absorption. As some of the early studies in the immunoglobulin absorption and calf health, El-Nageh proposed that the absorption of colostral proteins occurred predominantly in the jejunum in neonatal calves [19,20]. A recent study by Hammon and co-authors reported that different diets have significant effects on the jejunum mucosal immune system as reflected by their RNA sequencing data [5]. These studies collectively indicated the vital role of jejunum in calf nutrition and health. Despite its important function in nutrient absorption, to our knowledge, there were few reports focusing on the molecular mechanisms underlying jejunum development in young calves and their roles in nutritional metabolic diseases.
Transcriptome studies of the small intestine have provided valuable information in the understanding of the nutritional metabolism and immune responses in piglets [21,22], chickens [23], children [24], and calves [5,25]. In our established model of feed-induced acidosis in young calves, the two diets used in the model were designed to induce or blunt ruminal acidosis. We observed significant physiological differences in the calves receiving each diet, e.g., significantly lower ruminal pH (p < 0.01) and reduced dry-matter intake (p < 0.04) and body weight (p < 0.02) [26]. The host transcriptome profile in rumen epithelial and liver changed significantly in young calves with acidosis induction [27]. Several anti-inflammatory genes were differentially expressed in the liver between the treatment groups. Significant positive correlations between these anti-inflammatory genes and the rumen microbial community were also observed [28]. Our previous work indicated that highly coordinated transcriptome changes may occur in the GIT of young calves inflicted by acidosis. As a follow-up study, the objective of this study was to investigate the transcriptome changes in host jejunum and its associated microbial community in the same group of young calves with nutritionally induced or blunted ruminal acidosis. Whole transcriptome RNA-seq enabled us to conduct a hypothesis-free analysis of gene-expression changes in the jejunum epithelium and any associated changes in the microbial community to delineate the response differences in the jejunum in these young calves with or without feed-induced acidosis. It was expected that calves fed an acidosis inducing diet would exhibit significant changes in the jejunum transcriptome and its microbial communities compared to the ones receiving acidosis blunt diet.

2. Results

2.1. Acidosis Model Induced by Feed

This work was conducted by using our established acidosis-inducing/blunting model in young calves [26]. Per our previous report, rumen pH was reported in our recently published work [27]. Overall, the mean ruminal pH in the Aci group was significantly lower than the Con group (p < 0.01; 5.36 vs. 5.69). Ruminal pH was lower in the Aci group during the week of weaning (p < 0.05; 5.00 vs. 5.47), though pH was not different by diets at other weeks. Beginning at week 4, lower starter intake was observed in calves from the Aci group compared with those in the control group (p < 0.04). Beginning at week 5 through 16, the body weight of Aci calves was lower than that of Con calves (p < 0.02).

2.2. Transcriptome Changes in Host Jejunum Tissue

Total RNA sequencing of jejunum tissue generated an average of 46,541,838 ± 667,279 and 46,965,765 ± 320,045 (mean ± SE) reads in Con and Aci groups respectively. After sequence alignment, an average of 96.75% ± 0.44% (for the Con) and 96.98% ± 0.10% (for the Aci) of the reads within each group were mapped to the reference genome. Using the Bioconductor package ssizeRNA [29], we determined that we had sufficient power to identify significantly differentially expressed genes with the RNA-sequencing data we generated (power = 0.90).

2.2.1. Differentially Expressed Genes in Jejunum

A total of 853 differentially expressed genes (DEGs) were identified between the Con and Aci groups (p < 0.05), with 402 showing increased expression (IEGs) and 451 showing reduced expression (REGs) in the Aci group (Supplementary Materials Table S1). A clear separation between the Aci and Con groups was identified by using the top 40 most significant DEGs (Figure 1). The expression of five target genes was successfully confirmed by using RT-qPCR (Figure 2).

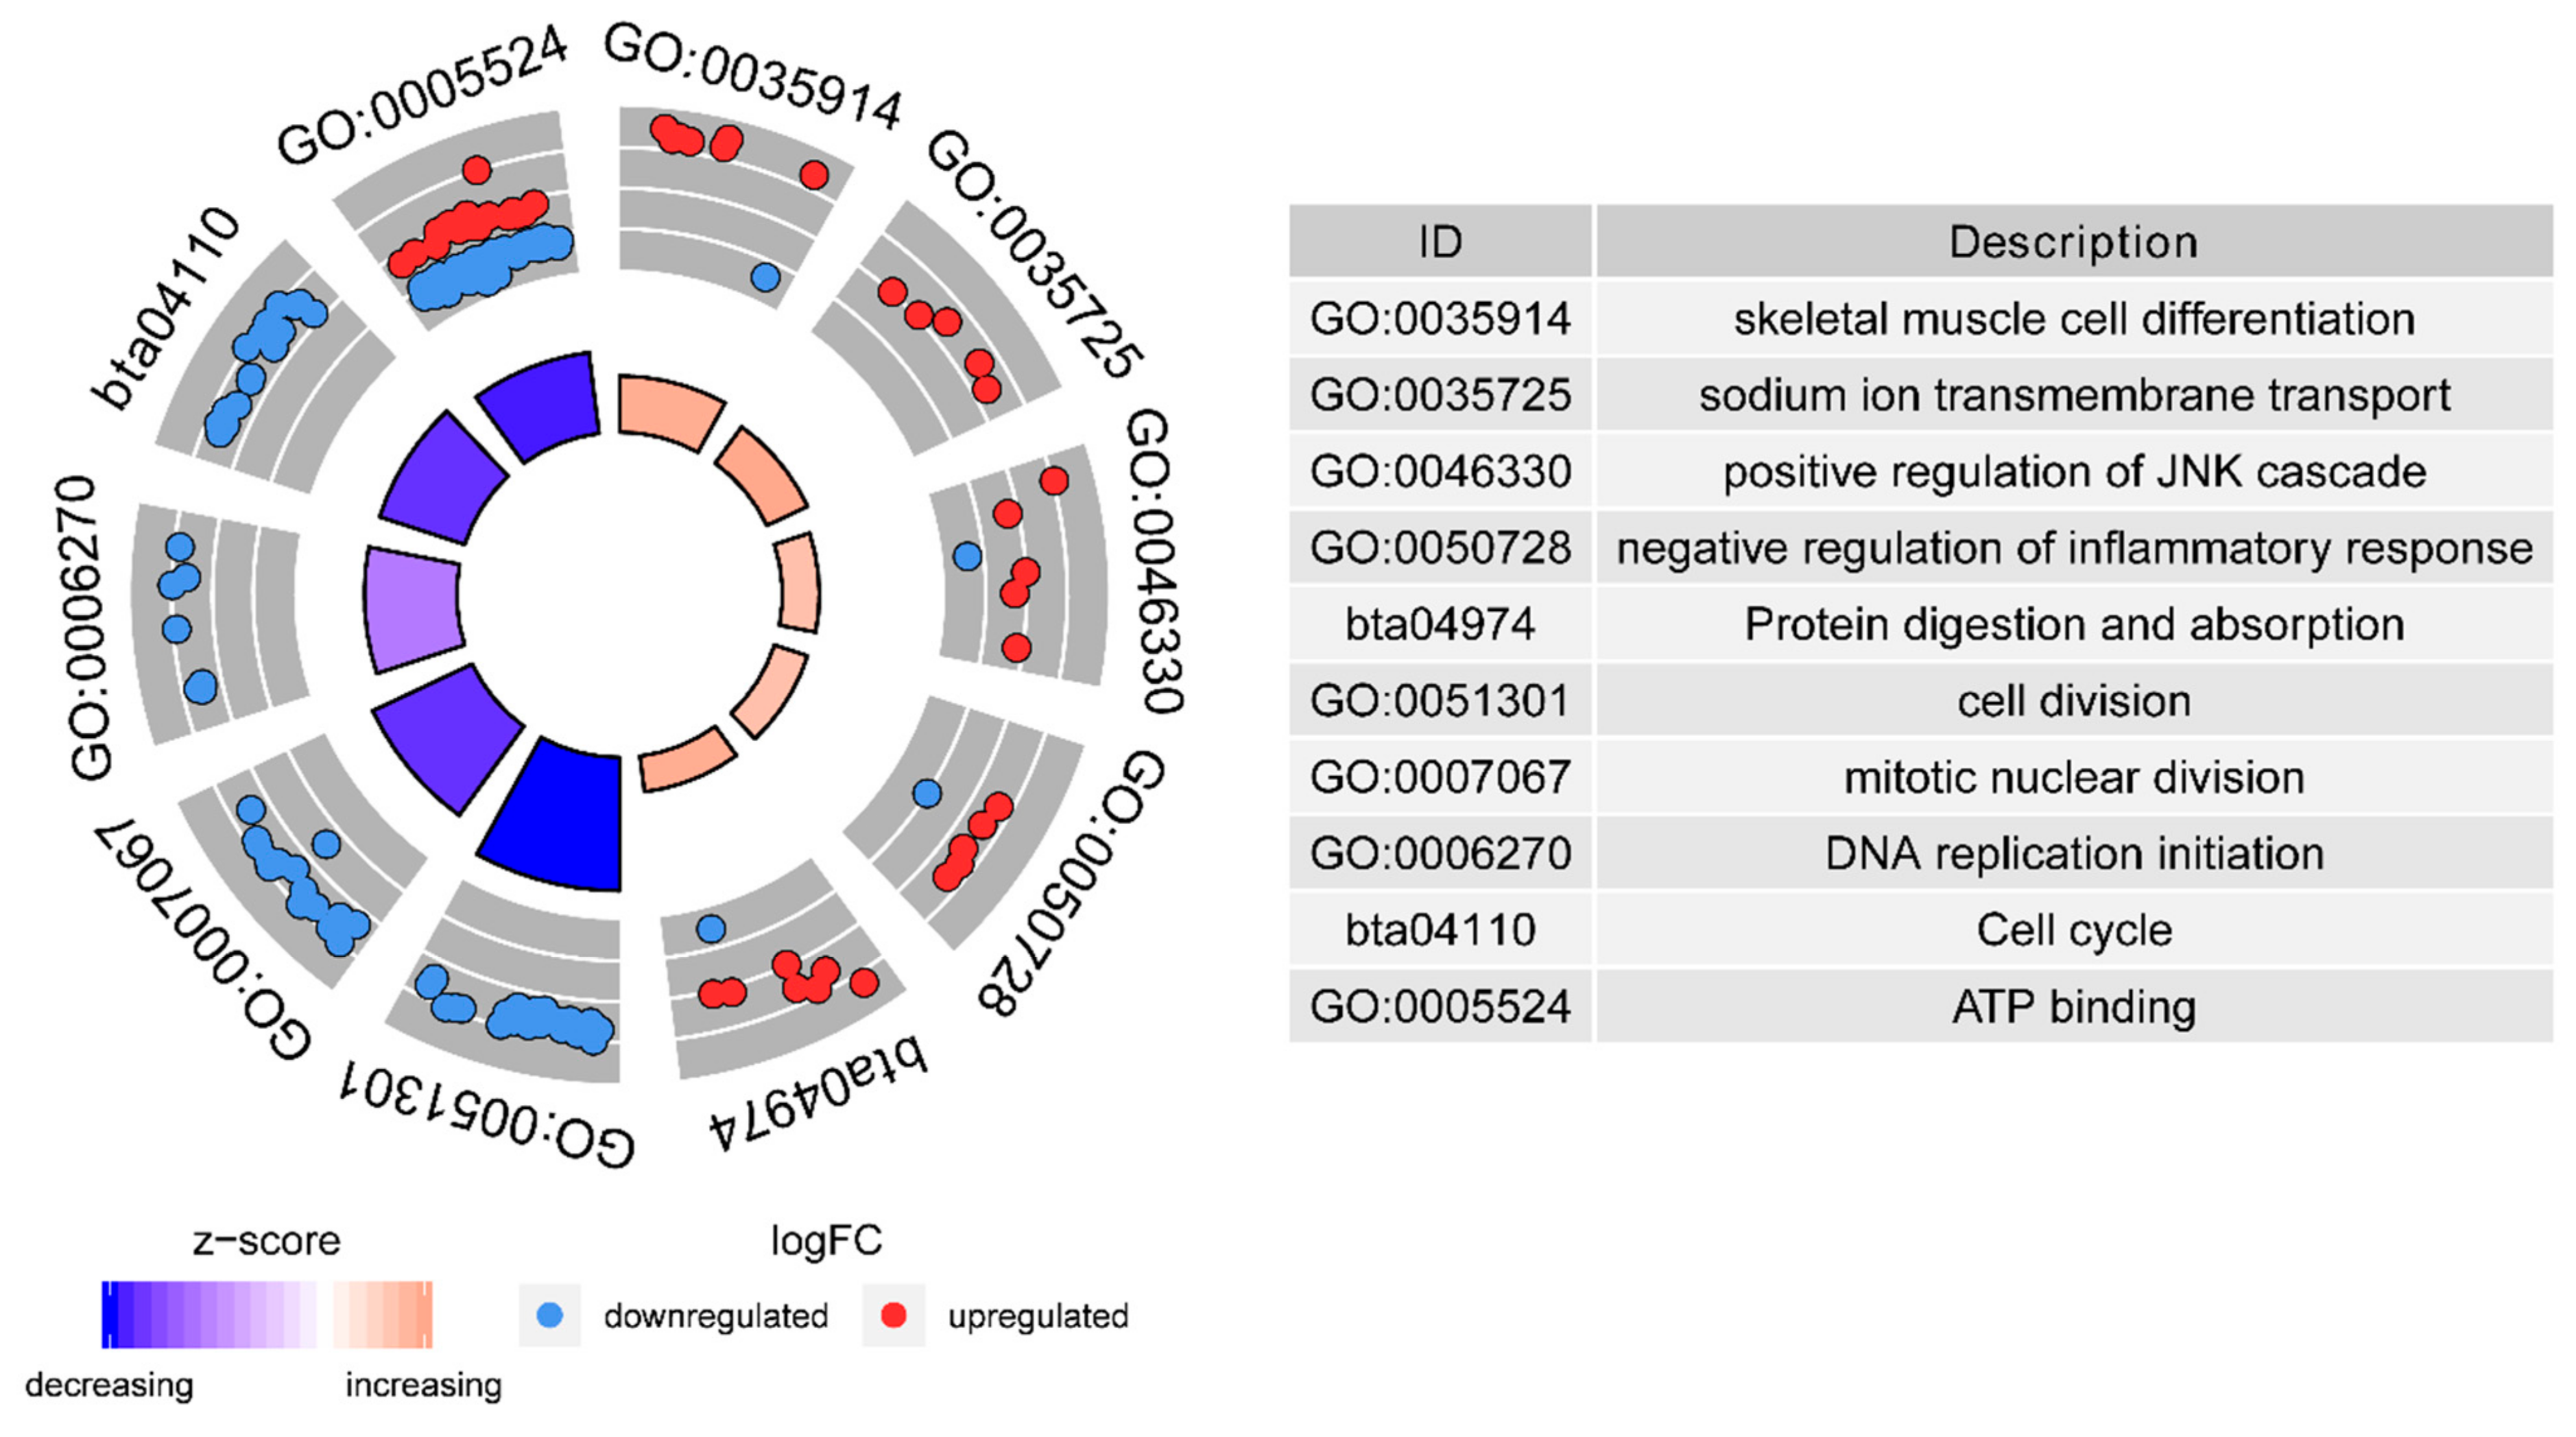
2.2.2. Functional Annotation of DEGs

As shown in Figure 3 and Supplementary Materials Table S2, the most noteworthy eight identified GO functions using all of the DEGs were sodium ion transmembrane transport (GO: BP:0035725, five genes, z-score = 2.34), skeletal muscle cell differentiation (GO: BP:0035914, eight genes, z-score = 2.12), negative regulation of inflammatory response (GO: BP:0050728, six genes, z-score = 1.63), positive regulation of JNK cascade (GO: BP:0046330, six genes, z-score = 1.63), cell division (GO: BP:0051301, 24 genes, z-score = −4.90), ATP binding (GO: MF:0005524, 76 genes, z-score = −4.59), mitotic nuclear division (GO: BP:0007067, 18 genes, z-score = −4.24), and DNA replication initiation (GO: BP:0006270, eight genes, z-score = −2.83). Moreover, two KEGG pathways were enriched, including cell cycle (bta04110, 18 genes, z-score = −4.24 and protein digestion/absorption (bta04974, eight genes, z-score = 2.12).
Additionally, the genes enriched in the biological progress of sodium ion transmembrane transport were all IEGs (SLC6A8, log2FC = 1.25; SLC24A1, log2FC = 1.03; SLC4A4, log2FC = 1.24; SCNN1A, log2FC = 1.17; ANO6, log2FC = 1.01; p < 0.05, Supplementary Materials Table S1). The DEGs enriched in the following KEGG pathways, cell cycle, biological progress of mitotic nuclear division, cell division, and DNA replication initiation were mainly IEGs (only one REG). The genes enriched in the molecular function of ATP binding included both the REGs and IEGs, with a smaller portion of it contributed by REGs.
Our RNA sequencing work identified 28 DEGs encoding the solute carrier group (SLC) of membrane transport proteins. Among these SLC protein-coding genes, 15 DEGs (SLC15A1, SLC22A15, SLC6A12, SLC3A2, SLC7A10, SLC7A7, SLC25A20, SLC25A34, SLC25A22, SLC9B2, SLC22A5, SLC4A4, SLC51A, SLC1A1, and SLC31A1) were involved in integral component of membrane (GO:0016021, p < 0.05, Supplementary Materials Table S3). Five IEGs (SLC15A1, SLC3A2, SLC7A8, SLC1A1, and SLC7A7) were enriched in KEGG pathway of protein digestion and absorption.

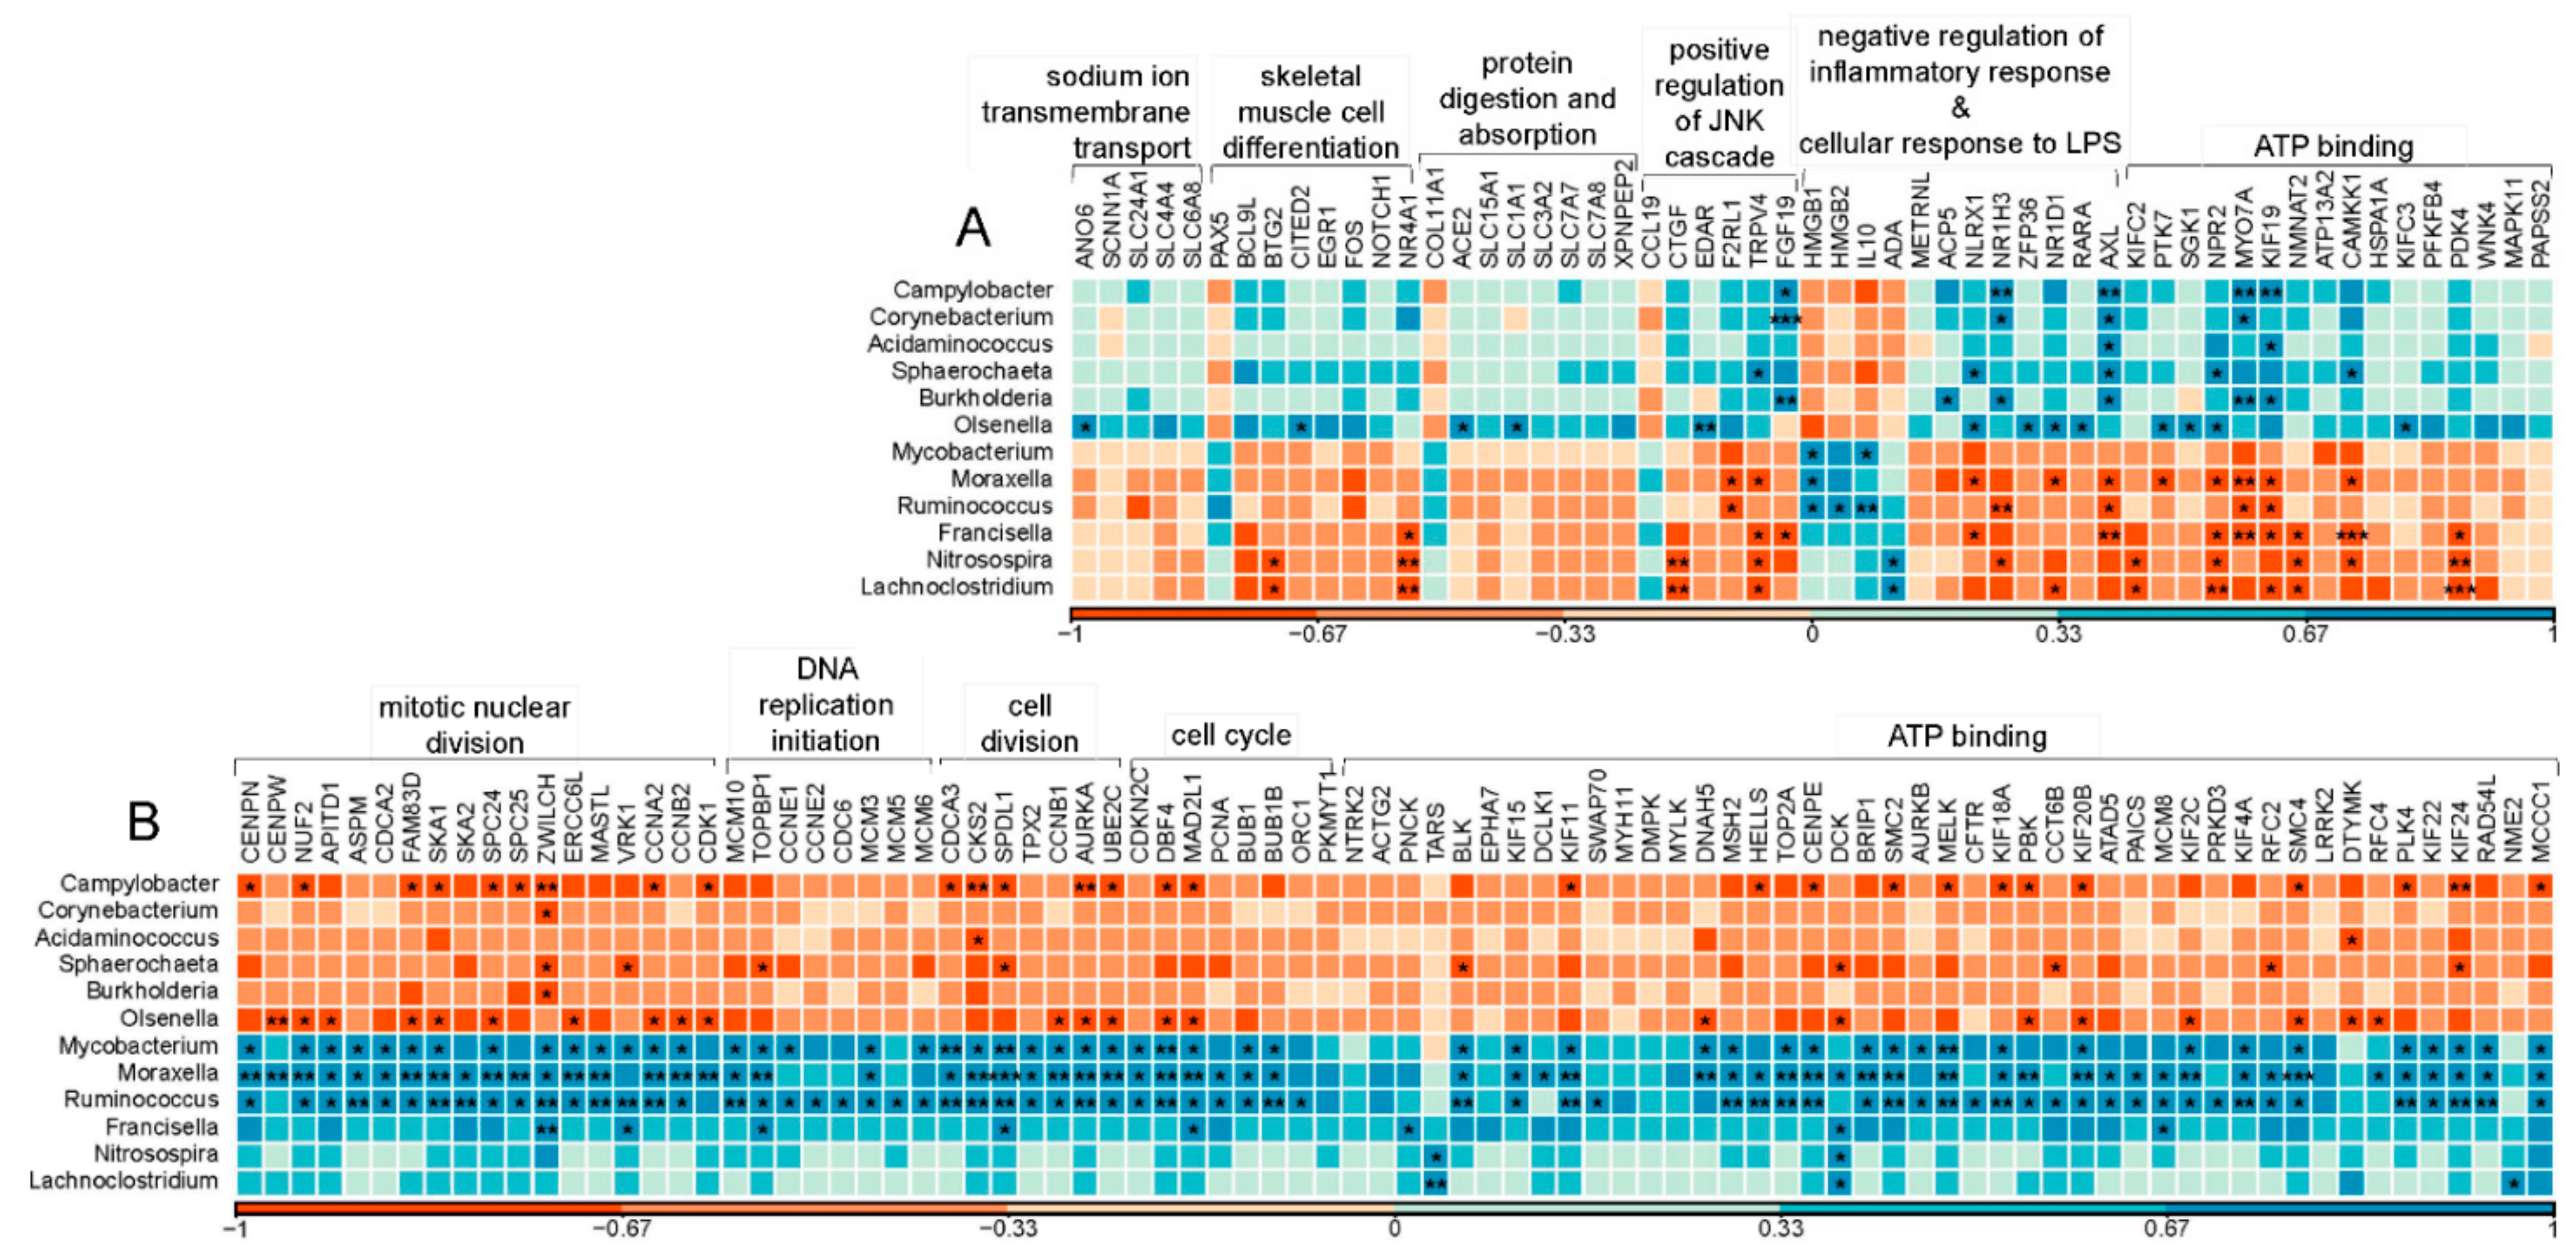
2.3. Jejunum Active Microorganisms and Its Association with Jejunum mRNA Expression Changes

Using bioinformatically extracted rRNA reads, microbial taxonomic classification was achieved by using Kraken, which identified a total of 60 genera in the jejunum (Supplementary Materials Table S4). Kruskal–Wallis test indicated 12 significantly differentially abundant genera in jejunum between Aci and Con groups (Table 1, p < 0.05). Among them, three Gram-negative bacteria (Campylobacter, Burkholderia, and Acidaminococcus) and two Gram-positive bacteria (Corynebacterium and Olsenella) showed significantly higher abundance in Aci group compared to the Con group. Pearson’s correlation analysis between these 12 genera and DEGs in the jejunum indicated that Campylobacter, Corynebacterium, and Burkholderia had significantly positive correlation with the four IEGs collectively (FGF19, NR1H3, AXL, and MYO7A; Figure 4A; r > 0.7; p < 0.05). GO analysis showed that these genes were involved in the biological progress of positive regulation of c-Jun N-terminal kinases (JNK) cascade, negative regulation of inflammatory response and the molecular function of ATP binding (Figure 4A).
Furthermore, several genera, Ruminococcus, Mycobacterium, Moraxella, Francisella, Nitrosospira, and Lachnoclostridium, had significantly lower abundance in Aci group compared to the control. Among them, three genera (Francisella, Nitrosospira, and Lachnoclostridium) were positively related to gene DCK and negatively related to five IEGs (NPR2, NMNAT2, PDK4, NR4A1, and TRPV4; Figure 4A, r < −0.7, p < 0.05). These genes showed an enrichment in several biological processes, including positive regulation of JNK cascade, negative regulation of inflammatory response and molecular function of ATP binding. Moraxella, Ruminococcus, and Mycobacterium were associated with more than half of the REGs, which were enriched in the first five decreased functions, as shown in Figure 4B (r > 0.7, p < 0.05).

3. Discussion

3.1. Jejunum Remodeling at the Transcriptome Level Caused by Acidosis-Induced Feed

In our study, the impact of feed-induced acidosis was reflected by the enrichment of DEGs in cell division, DNA replication initiation, ATP binding, cell cycle, and mitotic nuclear division. These findings implied that ruminal acidosis inflicted cellular reproduction and development in the jejunum at the transcriptome level. The genes classified as downstream regulators and relevant to the cell division, DNA replication initiation, cell cycle, and mitotic nuclear division showed coordinated negative activation z-scores (Figure 3). Among them, the cyclin-dependent kinase 1 (CDK1) gene was shared by these biological functions and was a REG in rumen tissue (log2FC = −0.78; p < 0.05), as shown in our previous study [27]. CDK1 is a highly conserved protein acting as a serine/threonine kinase and it has a key role in cell-cycle regulation [30]. However, little is known about its function in cattle, specifically in the context of ruminal acidosis.
As a systematic and complex process, DNA replication ensures the faithful duplication of the genome as required by the cell division at each cell cycle [31]. Of note, as shown in Figure 5, nine DEGs enriched in DNA replication were significantly downregulated (RFC4, log2FC = −0.56; RFC2, log2FC = −0.59; POLE, log2FC = −0.66; PCNA, log2FC = −0.78; MCM3, log2FC = −0.67; MCM5, log2FC = −0.51; FEN1, log2FC = −0.55; MCM6, log2FC = −0.70; RPA3, log2FC = −0.82; p < 0.05, Supplementary Materials Table S1). Mini-chromosome maintenance proteins (MCMs) are highly conserved proteins, involved in the initiation of eukaryotic genome replication [32]. These proteins are subunits of a larger protein complex, including MCM2-7 [33]. Within MCM2-7, six MCMs are loaded onto G1-phase DNA in a bicyclic heterohexameric structure (with the arrangement of MCM2-MCM6-MCM4-MCM7-MCM3-MCM5 in counterclockwise order) [34]. Most MCM2-7 hexamers remain dormant on chromatin [33]. They can be activated when the replication fork stalls or slows down. This feature is critical for maintaining genome integrity and stability in the event of DNA damage and replication stress [35,36]. In cattle, the direct causal relationship between MCM5 variants and calf growth has not been reported. However, it has been suggested that growth defects are associated with decreased MCM5 expression in zebrafish [37]. In our study, lower body weight in calves in the Aci group might be associated with the decreased MCM5 expression in jejunum and liver tissues [28]. However, the Aci group also consumed significantly less starter feed. Though we were not able to make definitive conclusions about the potential causal relationships between reduced weight gain and decreased expression in MCM5, future studies are needed to further investigate the potential association between MCM5 expression and reduced body weight. Notably, MCM2-7 genes were all downregulated in Aci group although MCM2, MCM4, and MCM7 were not identified as the REGs (MCM2, log2FC = −0.40; p = 0.058; MCM4, log2FC = −0.43; p = 0.052; MCM7, log2FC = −0.46; p = 0.038). Thus, it is possible that early age ruminal acidosis could potentially affect not only the overall body growth but also organ development. Acting as a DNA clamp, proliferating cell nuclear antigen (PCNA) is a synthesis factor for DNA polymerase δ in eukaryotic cells [38]. DNA polymerase epsilon is involved in the resynthesis of damaged DNA strands during DNA repair. Thus, PCNA is essential to both DNA synthesis and DNA repair [39]. Additionally, it is a common marker to assess cell apoptosis and proliferation in the jejunum as reported in many studies [40,41]. As shown in the study by Greeff et al. [40], the expression of PCNA is positively related to mucosa length of jejunum in the piglet. The reduced PCNA expression in the Aci group may suggest that early age rumen acidosis could affect jejunum tissue growth. Further targeted, follow-up studies are warranted.
Two other REGs identified in this study, MASTL and AURKA (log2FC = −0.60, and log2FC = −0.52, respectively; p < 0.05, Supplementary Materials Table S1) were also downregulated in the liver (log2FC = −1.63, and log2FC = −1.35, respectively; FDR < 0.05) of young calves in the Aci group [28]. MASTL gene encodes for the protein microtubule-associated serine/threonine kinase, which is a key regulator of mitosis, ensuring the proper maintenance of mitotic substrate phosphorylation [43]. As reported before, MASTL kinase could enhance the CDK1 mitotic phosphorylation events during mitosis [44]. On the other hand, CDK1 inactivation reduced its ability in phosphorylation inhabitation, which is followed by a decline in MASTL activity [45,46,47]. Thus, mitotic phosphorylation might decline during mitosis in the jejunum tissue of young calves with ruminal acidosis. Another important regulator of cell-cycle events is Aurora kinases (AURKs), which are conserved serine/threonine kinases with an important role in regulating cell-cycle events [48]. As one of these AURKs, the AURKA gene encodes aurora kinase A, known as serine/threonine-protein kinase 6. Located at the spindle poles, AURKA is closely associated with chromosome segregation [49] and it regulates cytokinesis by regulating centrosome maturation [50]. Aurora B kinase, encoded by AURKB gene, plays a role in the attachment of the mitotic spindle to the centromere. As a REG in our study (log2FC = −0.69, p < 0.05, Supplementary Materials Table S1), AURKB was involved in the biological progress of ATP binding (Figure 4B). Interestingly, Zhu and co-authors’ suggested that AURKA and AURKB were instrumental in affecting intestinal microbiome homeostasis, which was essential for intestinal health [51]. In our study, we found that AURKA was negatively related to two Gram-positive bacteria (Corynebacterium and Olsenella, Figure 4B, r < −0.7, p < 0.05) while AURKB was positively related to Ruminococcus and Mycobacterium (Figure 4B, r > 0.7, p < 0.05). Taken together, our findings suggested that acidosis-inducing diet may affect cellular growth of jejunum tissue at the transcriptome level and the expression changes in AURKs might be related to jejunal microbiome homeostasis.

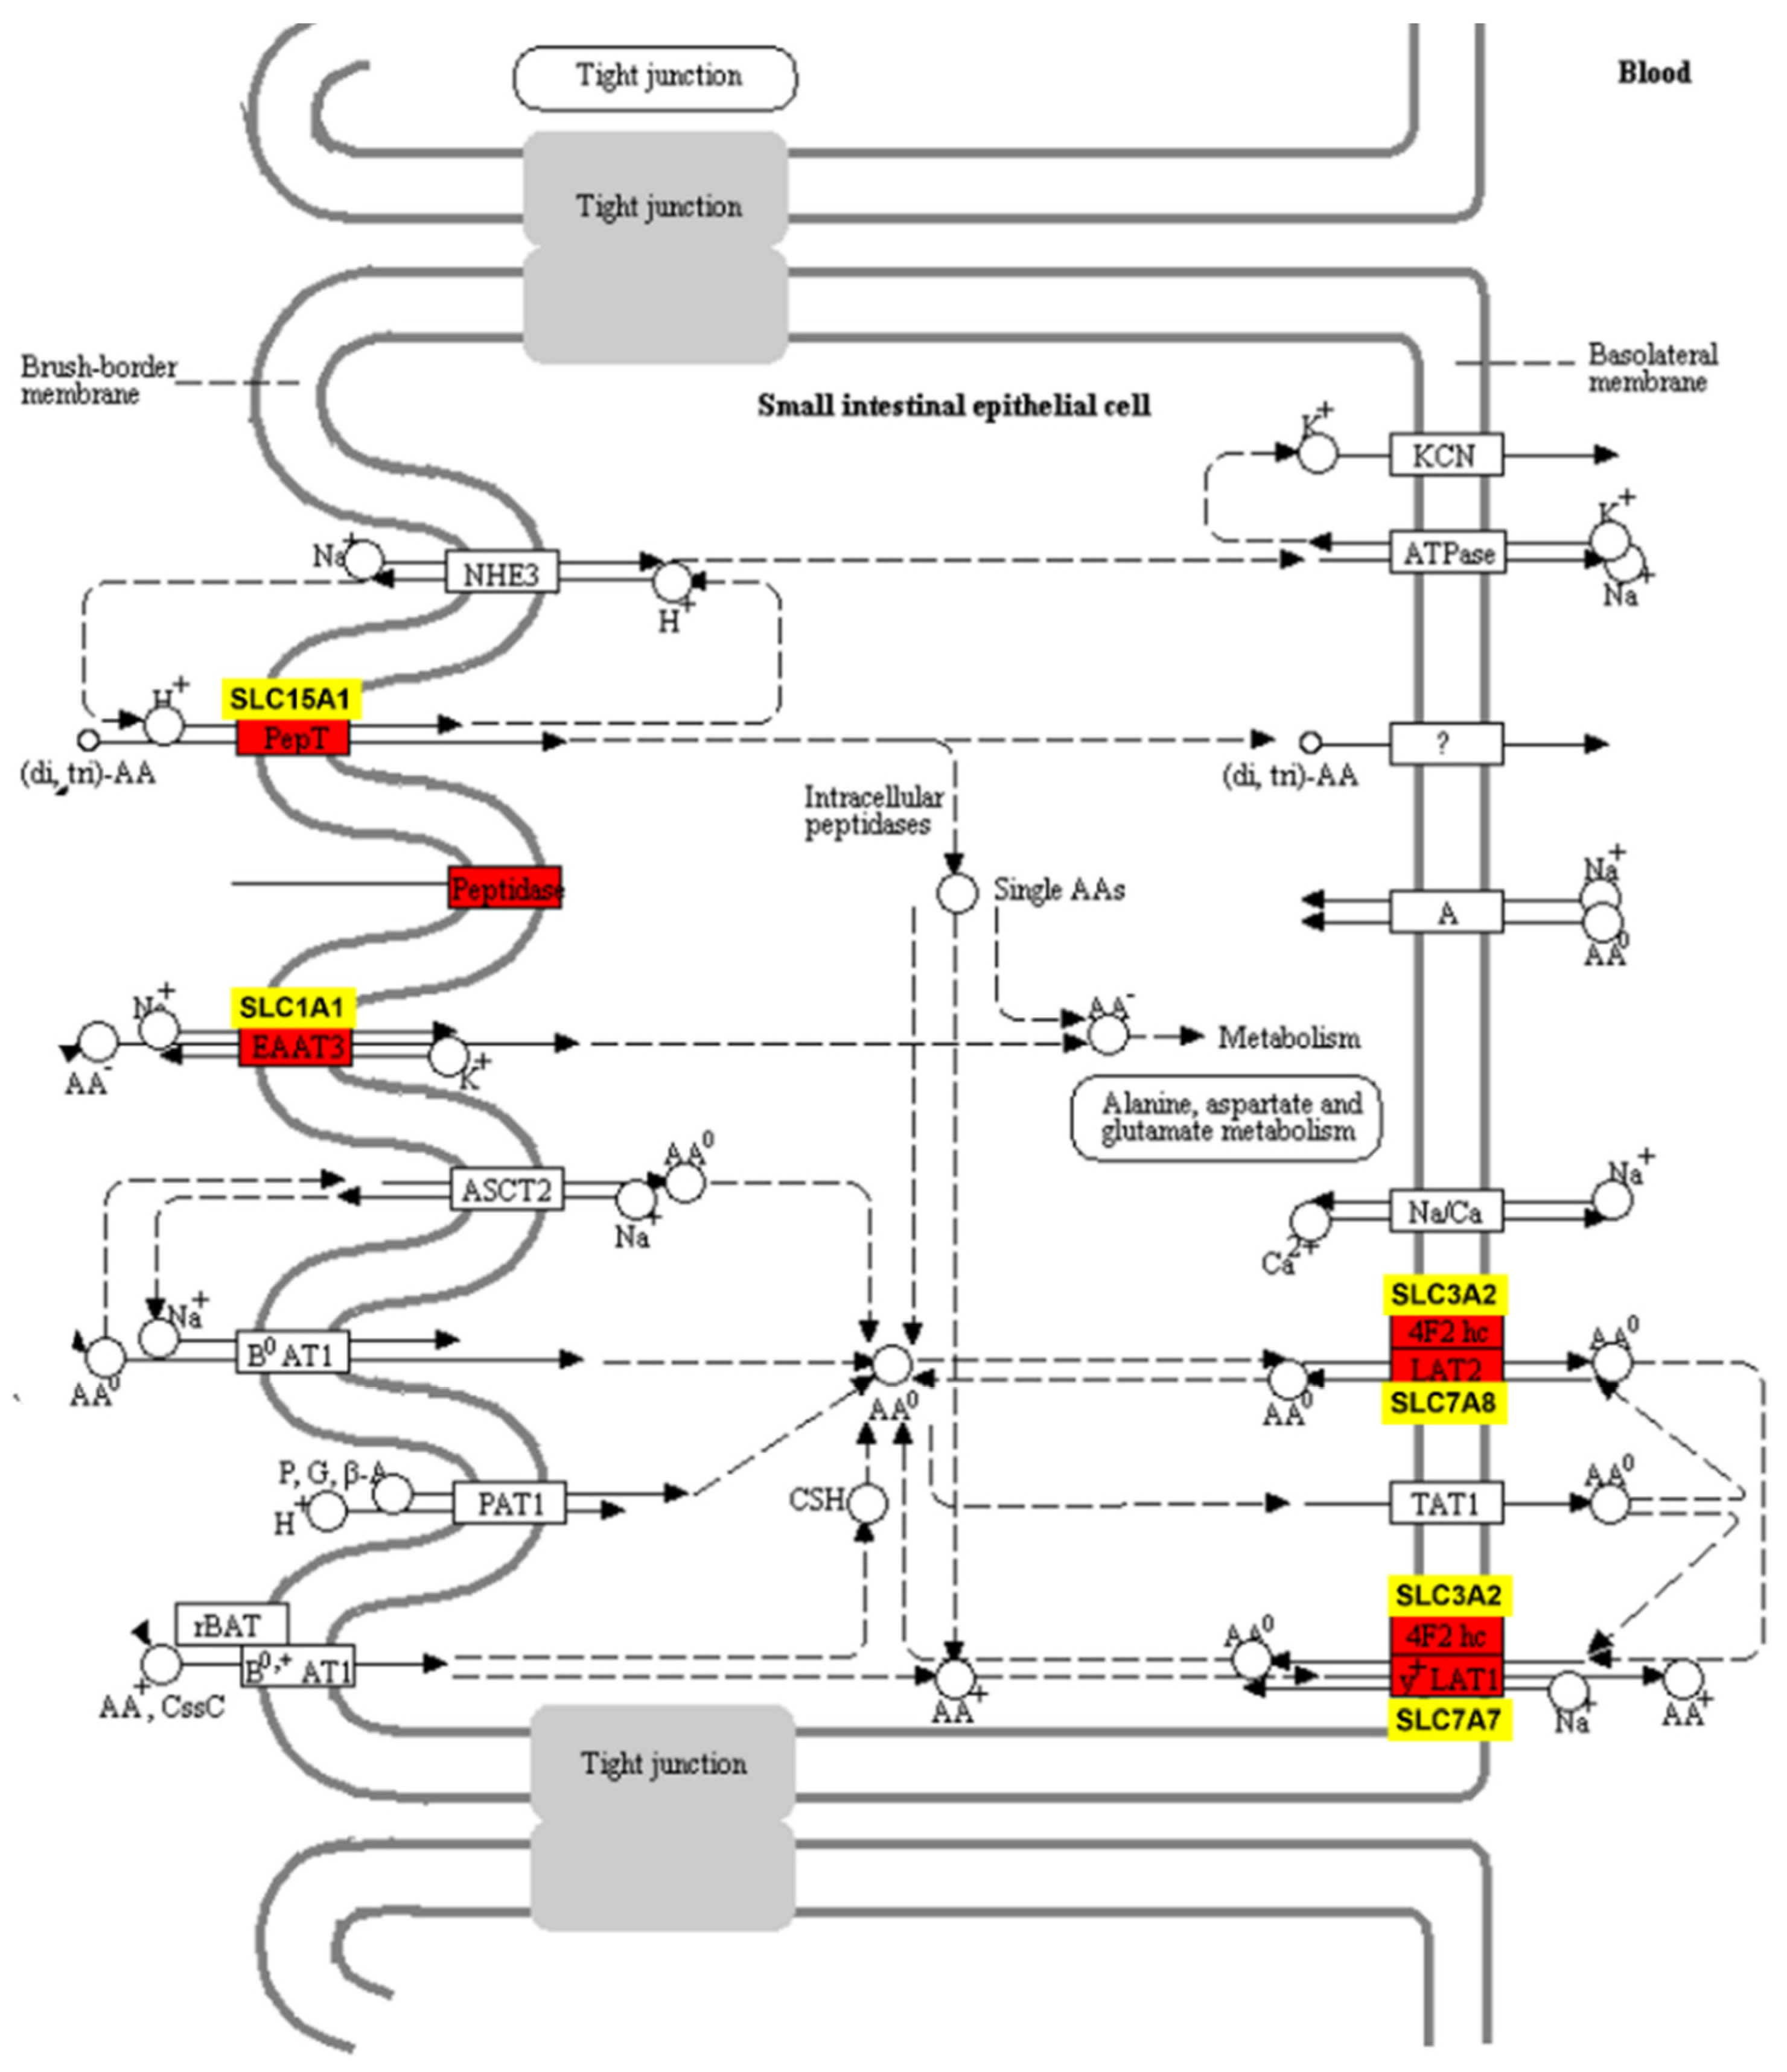
3.2. Significant Expression Changes in Nutrient Transporters and Sodium Ion Transmembrane Transport in the Jejunum of Acidotic Calves

The solute carrier (SLC) group of membrane transport proteins included more than 400 members that were categorized into 65 families. Most of these proteins located in the cell membrane [52]. SLC1A1, SLC15A1, SLC7A7, and SLC7A8 have been identified as the major intestinal transporters for anionic amino acid (AA), peptides, and neutral AA. Their elevated expression in the acidotic calves might be promoted by the acidosis-inducing diet [53,54]. As shown in Figure 6, genes SLC1A1 and SLC7A7 encode AA transporter excitatory amino acid transporter 3 (EAAT3) and Y + L amino acid transporter 1 (Y+ LAT1) respectively. These two AA transporters (EAAT3 and Y+ LAT1) belong to the Na+-dependent systems of AA transporters [55]. SLC7A7 was reported with high transport efficiency of Methionine in the jejunum in growing goats [56] and has been shown to interact with solute carrier family 3 member 2 (SLC3A2) [57]. SLC7A8 gene encodes LAT2, which is an energy-independent exchanger of neutral amino acids [58]. SLC3A2, encoding the 4F2 cell-surface antigen heavy chain, was upregulated in the Aci group and was consistent with the expression change of SLC7A7 gene in this study. Meanwhile, according to Liao’s study, increasing ruminal supplementation of starch hydrolysate could improve the supply of microbe-derived AA in the jejunum [59]. Thus, in our study, the IEGs of AA transporters may respond to increased AA in jejunum lumen because of the higher concentration of starch in the Aci group. Alternatively, the Aci calves consumed less starter, which leads to reduced microbial protein. In turn, jejunal mucosa may respond to the lack of protein by elevated gene expression of amino acid transporters. SLC15A1 gene encodes the peptide transporter 1 (PEPT1), which transports dipeptide and tripeptide located in the brush border membrane (BBM) of enterocytes in the small intestine [60]. PEPT1 plays an important role in the mammalian neonate [61] and is highly expressed in the duodenum, jejunum, and ileum [62,63]. Collectively, these results suggested that the direct response to increased nutrient availability might be the increased expression levels of nutrient transporters in jejunal enterocytes.
Moreover, solute carrier family 6 member 8 (SLC6A8) encodes the creatine transporter 1, a member of the superfamily of Na+, Cl coupled transporters for neurotransmitters [64,65] and organic osmolytes [66]. The expression of this gene has been reported in a wide variety of tissues, such as brain, heart, retina, small intestine, kidney, and skeletal muscle [67,68]. SLC4A4 gene encodes the electrogenic sodium bicarbonate cotransporter 1, which is important for a transepithelial HCO3 transport in the intestine of fishes [69,70]. However, very limited work was performed on these genes in cattle. It will be worthwhile to determine the function of SLC group genes in the small intestine of young cattle. Nonetheless, our findings provided evidence that sodium ion transmembrane transporters were an important class of genes significantly impacted by the acidosis-inducing diet in the jejunum.

3.3. Immune Response in Host Jejunum Tissue of Young Calves Treated with Acidosis-Inducing Diet

The investigation in jejunum could help better understand the immune responses in neonatal cattle fed a highly fermentable diet [71,72]. Our work indicated that the expression of immunity-related genes in the jejunum was highly responsive to ruminal acidosis. Notably, in the context of the jejunal immune response, NOD-like receptor X1 (NLRX1) and nuclear receptor subfamily 1, group H, member 3 (NR1H3) were among the IEGs (log2FC = −0.60, and log2FC = −0.52, respectively; p < 0.05, Supplementary Materials Table S1). NLRX1 gene plays a pivotal in host immunity when it comes to bacterial infections [73]. The expression level of NLRX1 may be regulated by early, negative feedback circuitry induced by infection [73,74]. In this study, we observed that the expression of NLRX1 gene was negatively correlated with two pathogenic bacterial genera (Francisella and Moraxella, Figure 4A, r < −0.7, p < 0.05). NR1H3 gene encodes Liver X receptor alpha (LXR-α). As a nuclear receptor [75], NR1H3 was previously reported as a potentially important transcription regulator of milk fat synthesis [76]. Future studies are needed to fully understand the importance of the NR1H3 gene function in jejunum after treatment of acidosis-inducing diet. AXL is a suppressor of the innate immune response [77] and was upregulated in the Aci group (log2FC = 0.52, p < 0.05, Supplementary Materials Table S1). In normal tissues, as reported by Rothlin et al. [78], activated AXL attenuated the TLR-dependent inflammatory response and natural killer cell activity. Furthermore, AXL gene showed significant association with a large number of genera in the jejunum (Figure 4A). Thus, it is evident that early age ruminal acidosis in cattle could affect AXL gene expression in the jejunum tissue, and such change is accompanied by coordinated changes in the bacterial community. Interestingly, we did not observe any clinical signs pertaining to pathological infection; for example, there were no significant changes in body temperature between the Aci and control calves. These observations likely depicted a picture of acting immune machinery in the calves treated with high-starch diet. Further follow-up studies are needed to investigate genes involved in inflammation response.

3.4. Active Jejunal Microbes and Its Association with Host mRNA Expression Changes

In previously published studies, the abundance of Campylobacter and Olsenella was higher and the abundance of Ruminococcus was lower in acidotic group [79,80,81,82]. Using an RNA-sequencing based approach, we also observed consistent profiles in both the rumen [27] and jejunum (Table 1). Campylobacters are generally considered as commensal bacteria within the cattle GIT [79,81,83]. They catabolize glucose [84,85] and play an important role in the nitrogen cycle in the GIT [86]. However, some Campylobacter species can infect humans and animals and cause diseases [87]. Among them, Campylobacter fetus was reported as a contributing factor to spontaneous abortions in cattle and sheep [88]. Further work is needed to determine whether the abundance changes in the Campylobacter genus could damage the functionality of jejunum with the presence of ruminal acidosis. Olsenella can ferment carbohydrates into lactic acid. Olsenella spp. has also been found to break down glucose in the rumen, owing to its beta-glucosidase capacity [89]. As shown in Kraatz et al.’s study, dietary starch increased the abundance of rumen Olsenella [89]. Thus, the increased abundance of the Olsenella in jejunum might be the result of the higher concentration of starch in Aci group. Ruminococcus is a bacterial genus in the phylum Firmicutes and has been found in the jejunum in many studies [28,90,91]. Ruminococcus could generate energy through carbohydrate fermentation [92] and produce carbohydrate-active enzymes, such as cellulases and hemicelluloses [93,94]. In this study, Ruminococcus was significantly lower in Con group. This might be due to the lower starch and more fiber in the Con group. The increased abundance of Ruminococcus in the Aci group may indicate that carbohydrate metabolism is active. This is consistent with the findings in Jami et al.’s study, where the abundance of Ruminococcus decreased with increased fiber content in feeds [95]. Ruminococcus may also participate in amino acid metabolism [28]. In Li’s work [28], Ruminococcus was positively correlated with the biosynthesis of tyrosine, phenylalanine, and tryptophan biosynthesis, and positively involved in methionine and cysteine metabolisms. However, we did not identify any significant association between Ruminococcus and jejunum mRNAs that were enriched in protein digestion and absorption. On the other hand, as shown in Wang’s study, the overgrowth of Ruminococcus in the jejunum may be detrimental to the host’s ability in nitrogen digestion and utilization [91].
Chemical digestion is considered as the main form of digestion in the jejunum due to its limited number of microorganisms [91]. However, microorganisms can assist to some extent in the digestion of nutrients in the jejunum [96]. In our study, the abundance of Acidaminococcus and Corynebacterium, which can digest the amino acids [97,98], was significantly higher in Aci group compared to the Con group (Table 1, p < 0.05). Acidaminococcus could use amino acids and peptides [97] and are amino acid fermenting bacteria found in the rumen [99]. In Myer’s study [100], increased abundance of Acidaminococcus was identified in the high feed-efficiency steer, suggesting that the presence of Acidaminococcus in jejunal digesta may be indicative of greater GIT proteolytic activity for high-efficiency animals. Corynebacterium is a predominant genus in the small intestine of non-ruminants, such as pigs [101], rats [102], and broiler chickens [103,104]. Higher abundance of this genus was found in the small intestine than it is in both the stomach and the large intestine in growing/finishing pigs [101]. Due to its ability to digest the amino acids in the ileum of growing pigs, this genus is a new protein source in growing pigs [98]. So far limited studies investigated the Corynebacterium and associated function in the jejunum of cattle. This genus may represent a new avenue for functional microbial ecology in the cattle GIT. Burkholderia is a genus of Proteobacteria, with most species in this genus being pathogenic [105]. This genus has higher abundance in the Aci group while the abundance of three other genera (Mycobacterium, Francisella, and Moraxella) was lower in Aci group. It is hard to draw conclusion whether substantial abundance changes in these genera might be deleterious in the jejunum in Aci group. However, it is fair to conclude that ruminal acidosis in calves was accompanied with dramatic abundance changes of dominant bacterial groups in the jejunum, and the major causal factor of such changes lies in the diet composition.

4. Materials and Methods

4.1. Acidosis Model Induced by Feed Remodeling

Calves included in this study were part of a larger study that was published [26,27,28]. Throughout the experiment, all animal protocols (A005848) were approved by the Animal Care and Use Committee at the University of Wisconsin–Madison. All the procedures relating to animal care and use in this study were implemented in accordance with the guidelines and regulations by the US Dairy Forage Research Center Farm.
In brief, eight Holstein bull calves were enrolled for this experiment. Rumen acidosis was induced by a starch-rich, low-fiber diet (Aci; pelleted, 42.7% starch, 15.1% neutral detergent fiber (NDF), and 5.56% sugar), while texturized starter was fed as a control (Con, 35.3% starch, 25.3% NDF, and 6.17% sugar). The trial started at 1 week of age through 16 weeks with 4 calves randomly assigned to each treatment. At 3 weeks of age, soft rubber cannulas (28 mm i.d.) were fitted to each calf following the method by Kristensen et al. [106]. Before incising the rumen and subsequent cannula insertion, an initial incision was created in the skin and the rumen tissue was sewn to the skin and to heal for 5 days. Between 7 and 9 weeks of age, larger soft rubber cannulas (51 mm i.d.; Bar-Diamond Inc., Parma, ID, USA) were put into place to replace the original cannulas due to accommodate the increase in the size of the fistula. A calibrated pH electrode was inserted into the rumen before each collection to measure rumen pH. Ruminal pH was tested at seven time-points (−8, −4, 0, 2, 4, 8, and 12 h relative to grain feeding) in a single day every other week from week 6 to week 16. Until 17 weeks of age, the 4 calves in each group were sacrificed and jejunum tissues were harvested. Upon tissue collection, they were rinsed with PBS and cut into 4–5 mm2 pieces, using sterilized scalpels and placed into Eppendorf safe-lock tubes (Eppendorf North America, Hauppauge, NY, USA). Collected tissues were immediately frozen in liquid nitrogen and stored at −80 °C for further RNA extraction.

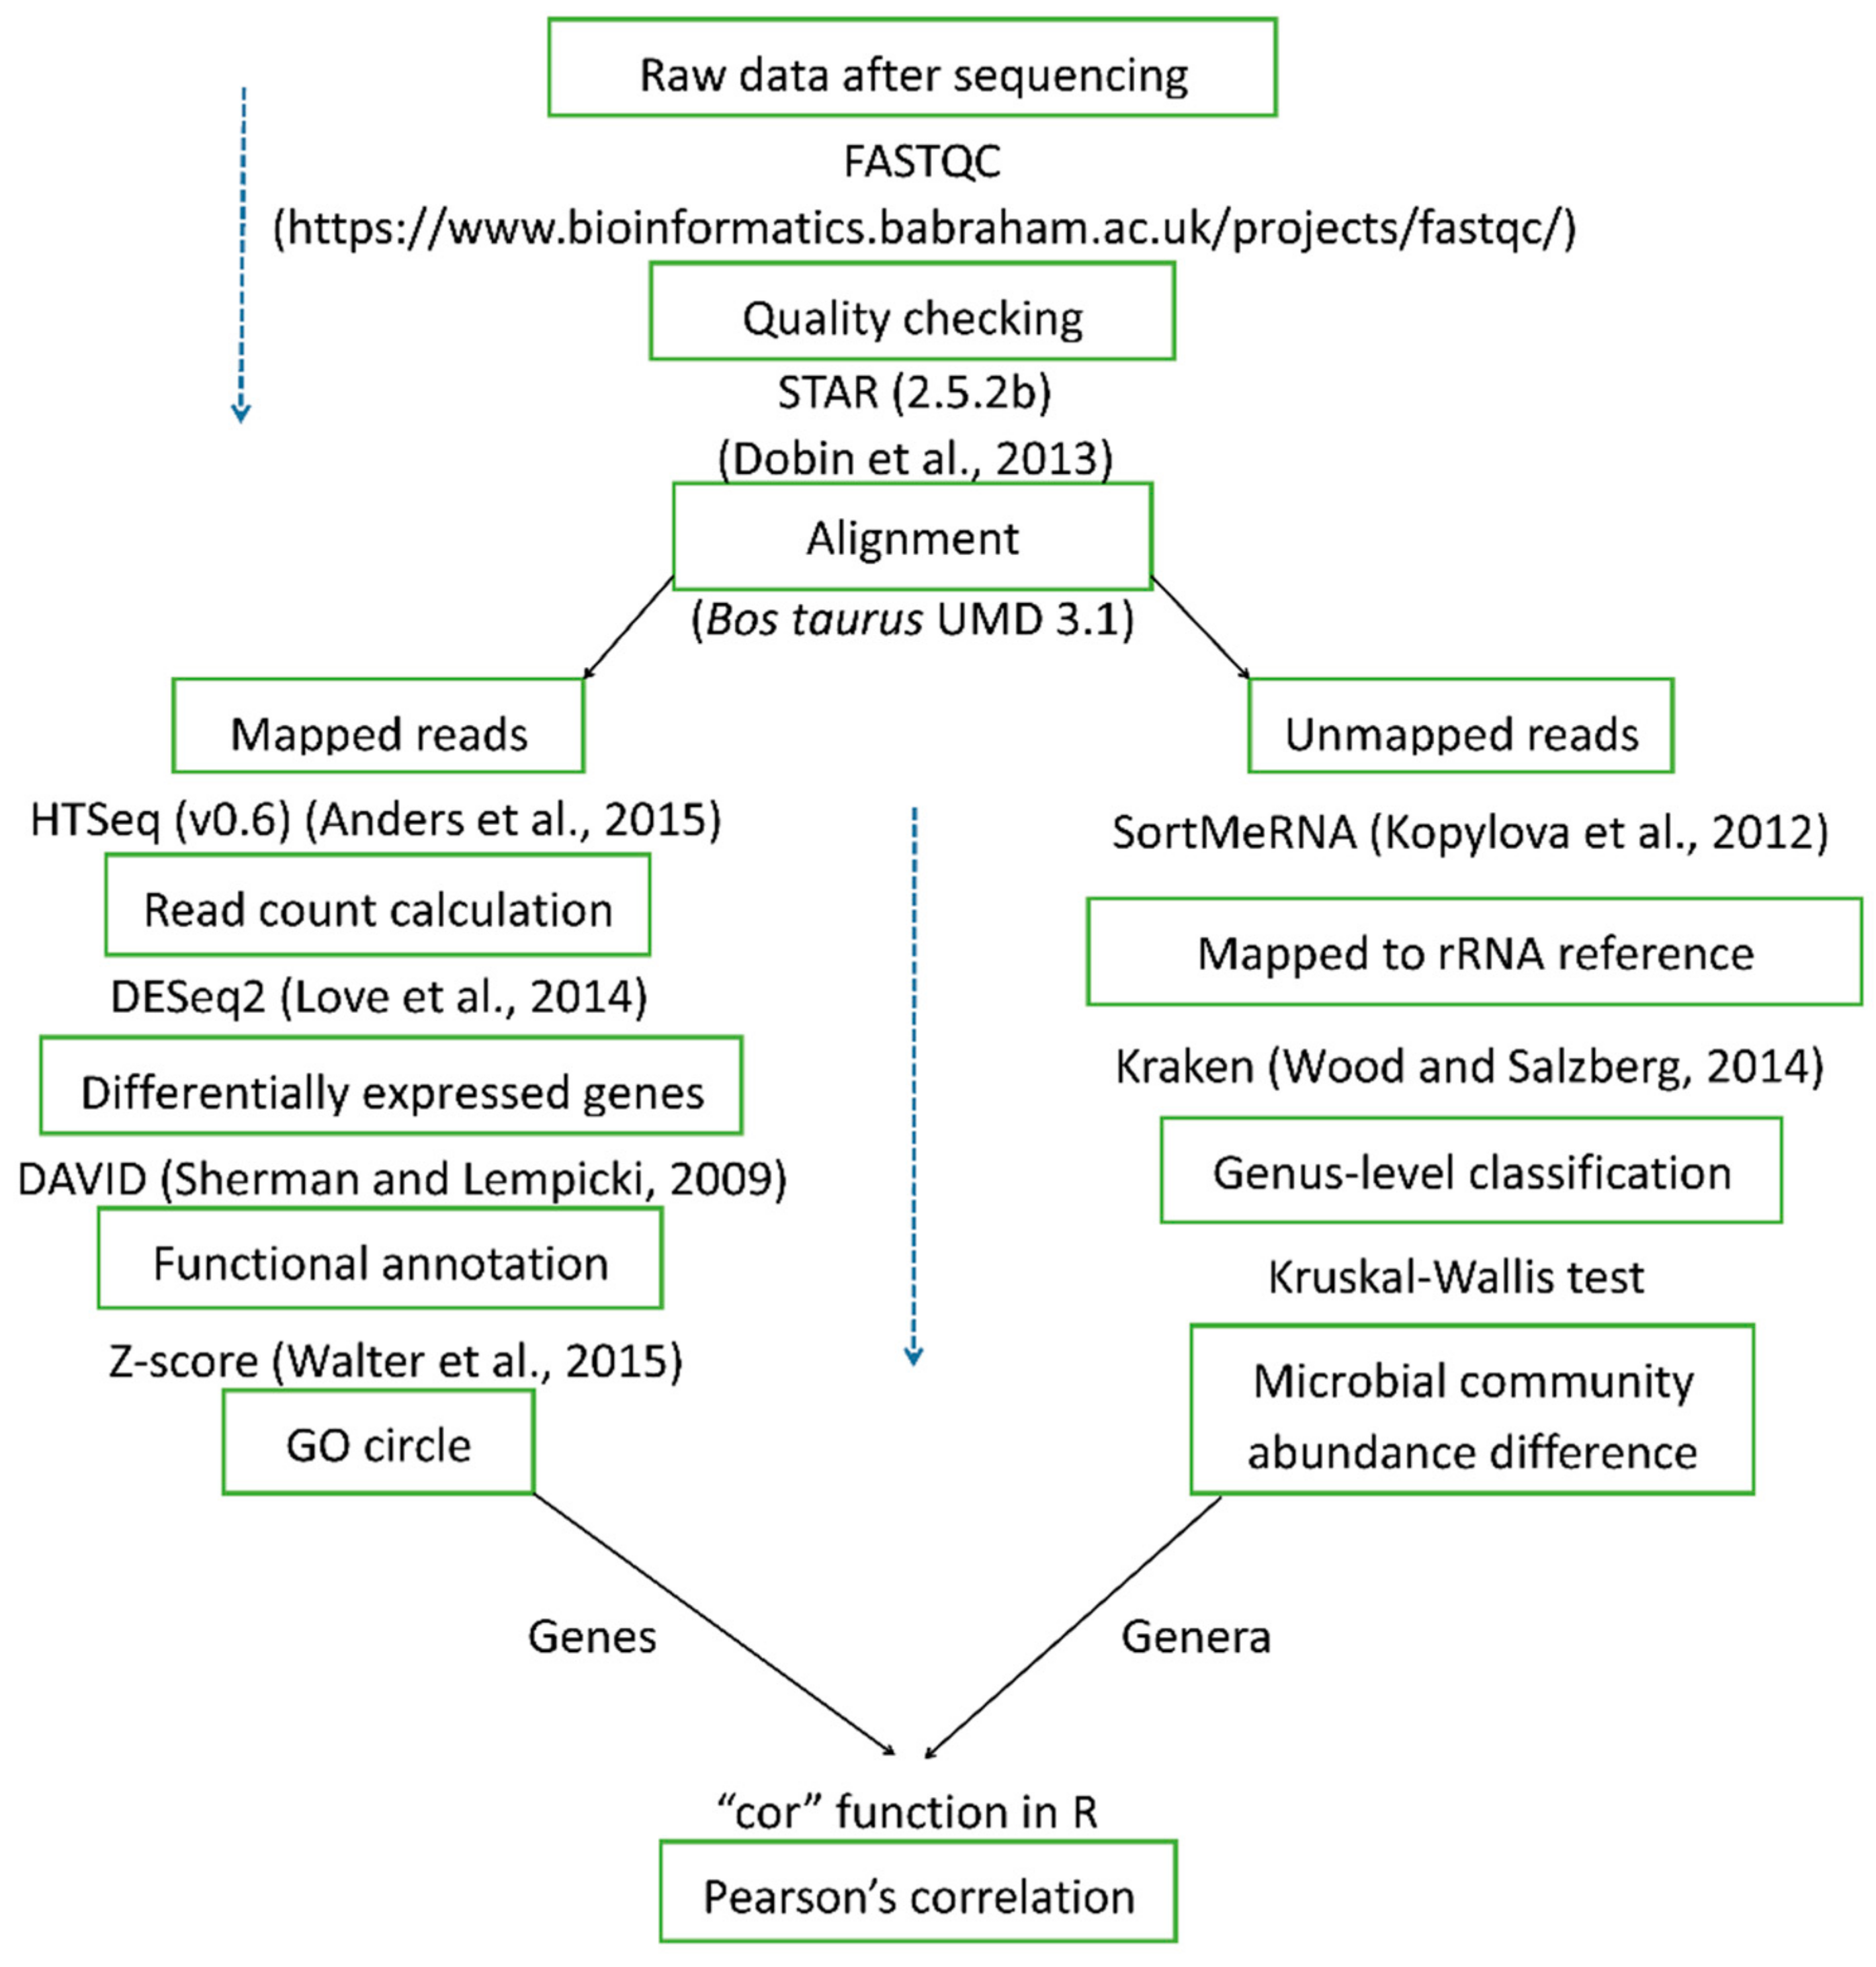
4.2. RNA Sequencing, Bioinformatics, and Statistical Analysis

RNA library preparation and sequencing following the detailed procedure described in the co-author’s publication [27]. The main steps are shown in Figure 7. Detailed bioinformatics and data analysis steps following the procedures described in the co-author’s publication [27,28] are shown in Figure 8. Briefly, RNA sequencing raw reads were mapped to the cattle reference genome (UMD 3.1) by using STAR (2.5.2b) [107]. Gene-level reads counts were calculated by using HTseq (v0.6) [108]. Differential gene expression analysis was performed by using DESeq2 [109]. Gene ontology and pathway analysis were performed by using DAVID [110]. Cattle genome unmapped reads were considered to be of microbial origin. SortMeRNA (version, 2.1b) [111] was used to enrich rRNA reads from the host genome unmapped reads, using the reference rRNA databases provided by Silva (release 119) [112] and Rfam 11.0 [113]. The enriched rRNA reads were used for bacterial taxonomic classification, using Kraken2 (v.2.0.8-beta) [114]. Raw-read counts at each taxonomic level (i.e., phylum, genus, and species) as identified by Kraken2 were normalized by total number of classified reads per sample by following these steps: (1) the total number of reads mapped to the given taxonomic level (i.e., phylum, genus, and species) was divided by 1,000,000 to obtain the “per million factor”; (2) the total number of reads mapped to each specific given taxonomic level was divided by the “per million factor” to yield the normalized read count. Normalized read counts at a given taxonomic level was used as the measurement for microbial abundance analysis. Pearson’s r correlation analysis between the gene expression and microbial genus level abundance was performed by using the cor function in R. The cutoff values of |r| > 0.7 and p < 0.05 were used to determine significant correlations. Raw read counts for each gene were deposited in FigShare (10.6084/m9.figshare.12845963). Raw rRNA reads were uploaded in NCBI, with the project number of PRJNA647364.

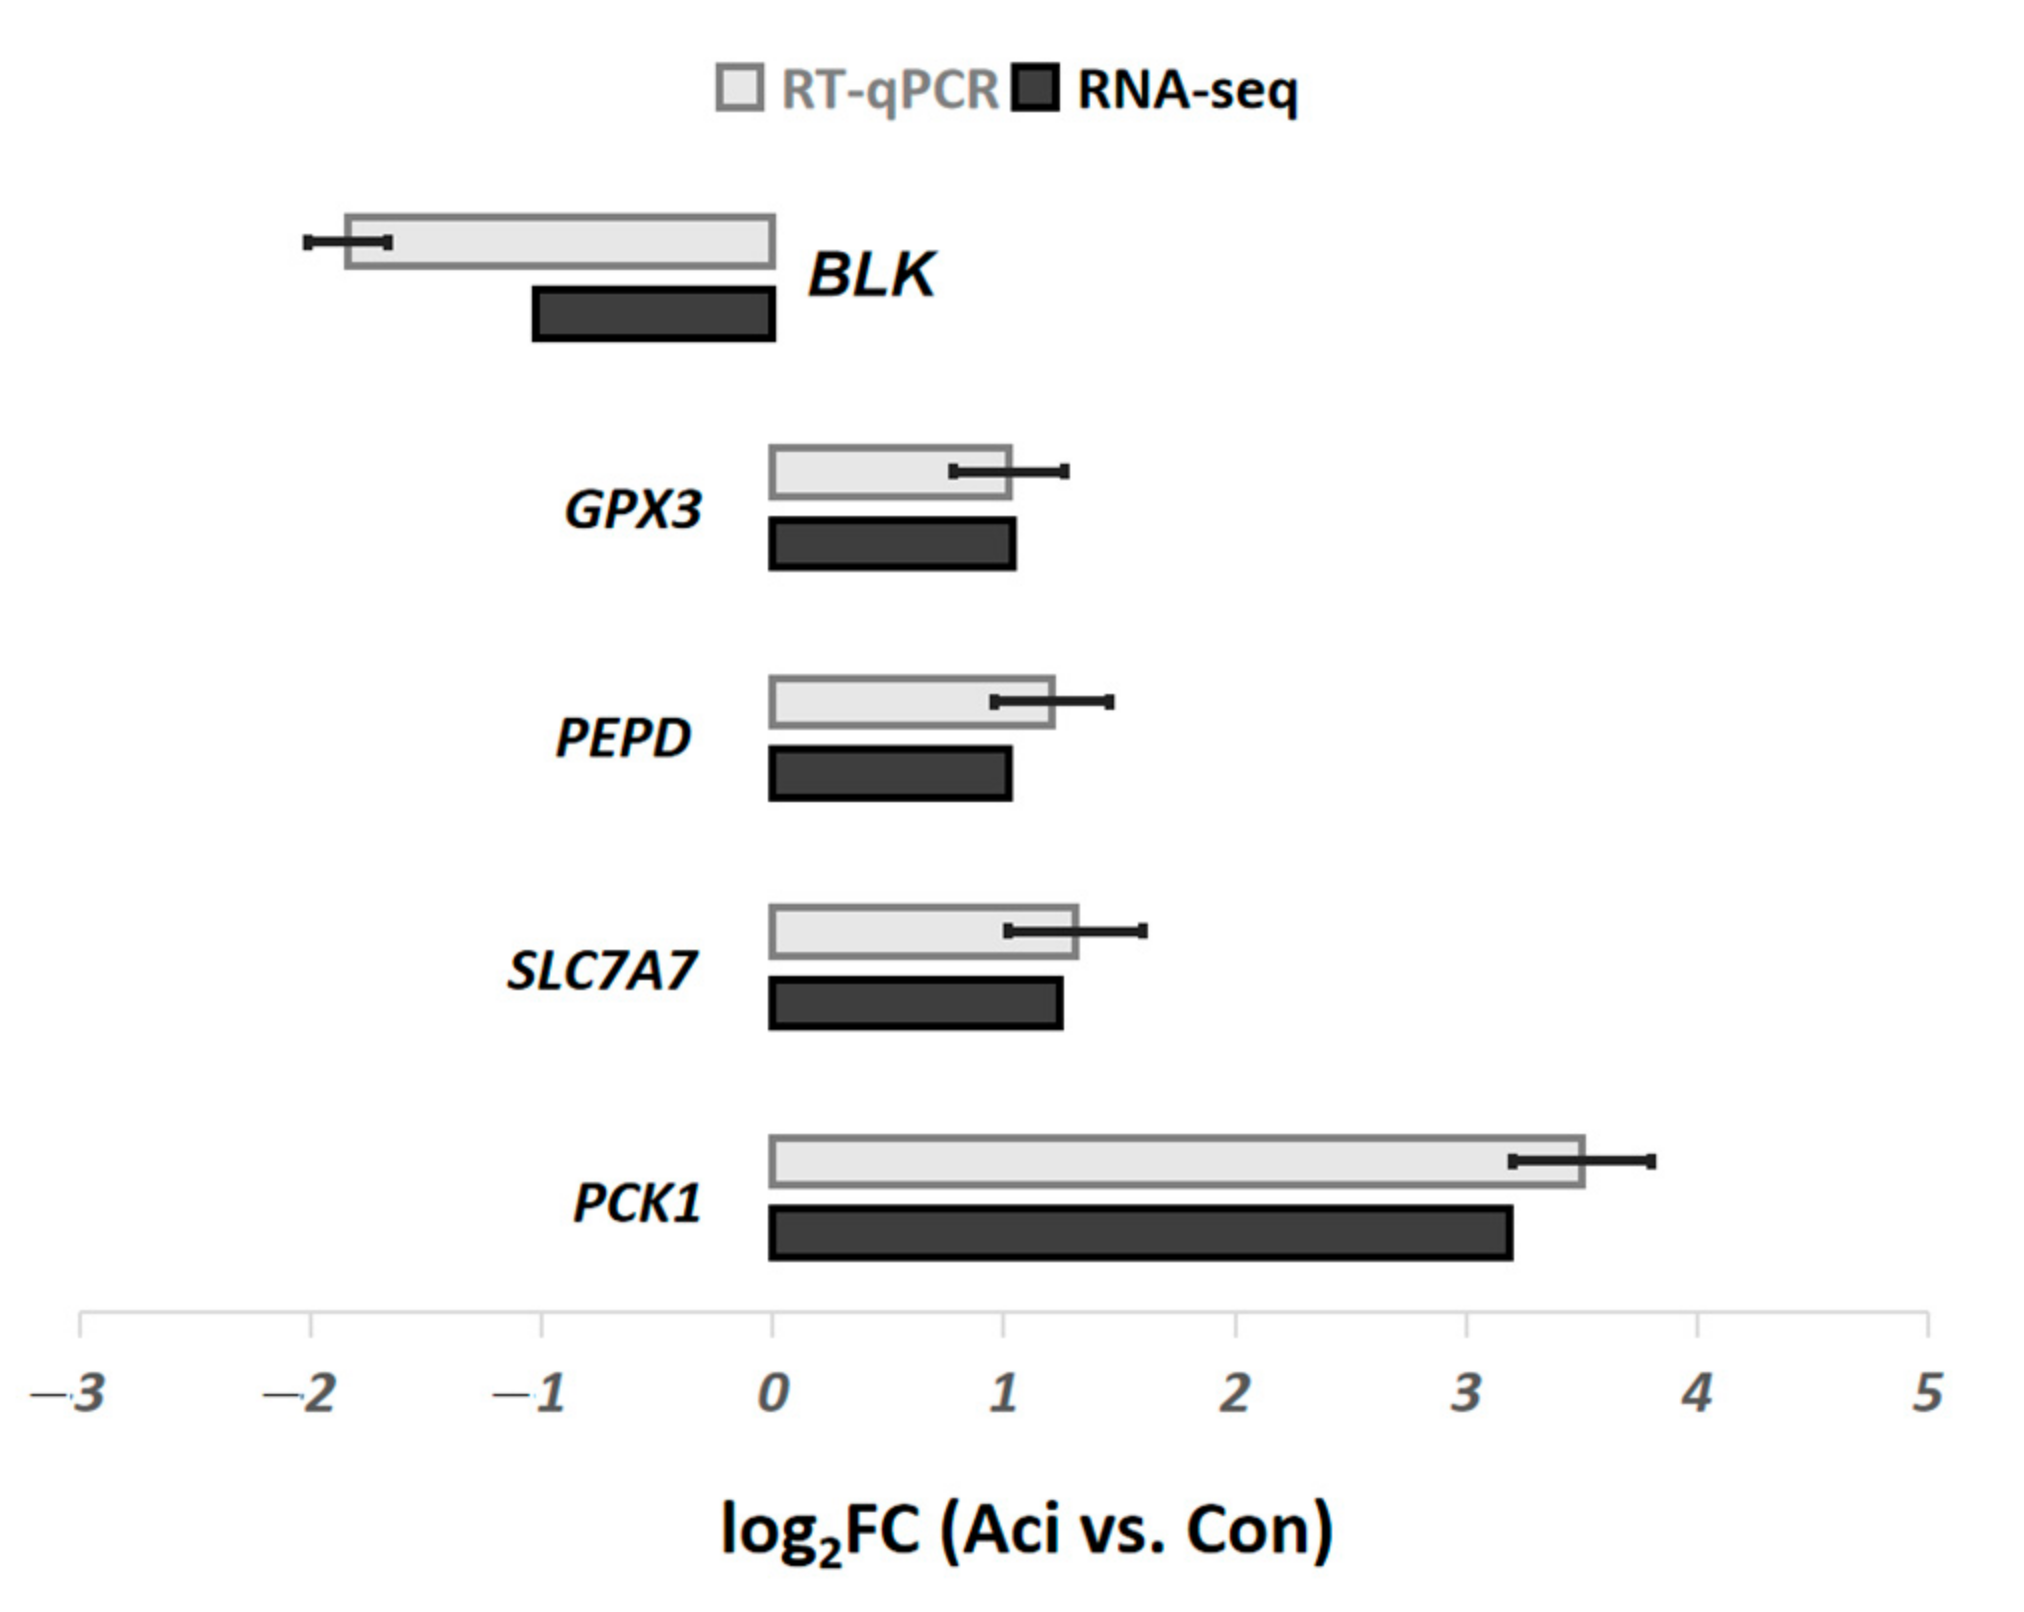
4.3. RT-qPCR Analysis

A collection of five randomly selected DEGs was pursued for expression analysis, using RT-qPCR. They included PCK1, SLC7A7, PEPD, GPX3, and BLK. PCK1 (phosphoenolpyruvate carboxykinase 1) has a reported role in regulating cell-cycle progression [115]. SLC7A7 provides instructions an amino acid transporter, which is involved in certain building blocks of protein [116]. PEPD (peptidase D) provides instruction for making prolidase, which is involved in the finals steps of breaking down some proteins obtained through dies [117]. GPX3 (Glutathione peroxidase 3), as a member of glutathione peroxidase family, functions in the detoxification of hydrogen peroxide [118]. BLK (Tyrosine-protein kinase) is typically involved in cell proliferation and differentiation [119]. The protein encoded by BLK has been reported in stimulating insulin synthesis in response to glucose [120]. PAX5 encodes a member of the paired box transcription factor family. Paired box transcription factors are important regulators during early development. Encoding a B-cell lineage specific activator protein, this gene expresses at early stages of B-cell differentiation [121].
We performed cDNA synthesis by using High-Capacity cDNA synthesis mix (Thermo Fisher Scientific, Waltham, MA, USA) with 2 μg of total RNA. Gene-specific, Taqman assay probes were ordered from Thermo Fisher’s probe assay collection (Thermo Fisher Scientific, Waltham, MA, USA) as follows: Bt03224295_m1 (PCK1), Bt03244891_m1 (SLC7A7), Bt00944663_m1 (PEPD), Bt03259219_m1 (GPX3), Bt03248098_m1 (BLK). QuantStudio 5 fast system (Thermo Fisher Scientific, Waltham, MA, USA) performed all qPCR reactions. The following PCR condition was used: one step of uracil-N-glycosylase (UNG) [122] treatment at 50 °C for 2 min, followed by an initial denaturation/activation step at 95 °C for 10 min, and then 40 cycles at 95 °C for 15 s and 60 °C for 60 s. The fold change in gene expression was obtained following normalization to two reference genes, Beta-actin (ACTB) [123] and hydroxymethylbilane synthase (HMBS) [124]. These two reference genes were used as an endogenous reference gene for all reactions. Final gene-expression data were obtained by using the 2−ΔΔCt method [125].

5. Conclusions

Our study painted the picture of active transcriptome changes in the jejunum of young calves fed an acidosis-inducing diet. We observed transcriptomic remodeling in the jejunum, as reflected by the downregulation of MCMs and PCNA, which were involved in DNA replication. Moreover, genes encoding transporters of amino acid and peptide, and sodium ion transmembrane transport changed significantly in the jejunum as a response to acidosis-inducing diet. Of note, our study found significant abundance changes in active jejunal microbes. Several of the microbes showed significant association with many host genes involved in the immune response, such as the upregulated AXL and NLRX1. In summary, our study provided transcriptome-level knowledge of the jejunum functionality in young calves subjected to acidosis-inducing diet. This study was performed at only one time-point (17 weeks of age) with one tissue type. A comprehensive study that encompasses the entire weaning period and covers a wider range of GIT tissues would undoubtedly provide insightful knowledge regarding the dynamics between the host transcriptome and the associated microbial community. Additionally, follow-up research is needed to determine whether calves that experience ruminal acidosis are more susceptible to diseases later in life.

Supplementary Materials

The following are available online at https://www.mdpi.com/article/10.3390/metabo11070414/s1. Table S1: Differentially expressed genes between Aci and Con groups, Table S2: Functional annotation of DEGs with z-score, Table S3: Functional annotation for differentially expressed SLC protein-coding genes between Aci and Con groups, Table S4: Read counts of genera in the jejunum between Aci and Con groups.

Author Contributions

Conceptualization, W.L.; methodology, W.L. and S.G.; software, N.G.; validation, B.M. and N.G.; formal analysis, W.L. and N.G.; investigation, W.L., N.G., and S.G.; resources, W.L. and S.G.; data curation, B.M. and W.L.; writing—original draft preparation, W.L. and N.G.; writing—review and editing, W.L., S.L., and N.G.; visualization, N.G.; supervision, W.L. and S.L.; project administration, W.L., N.G., and S.G.; funding acquisition, W.L. All authors have read and agreed to the published version of the manuscript.

Funding

This research was funded by the USDA Agricultural Research Service (US Dairy Forage Research Center), grant number 5090-31000-026-00-D.

Institutional Review Board Statement

In this study, all animal protocols were approved by the Animal Care and Use Committee at the University of Wisconsin–Madison (protocol number: A005848). All the procedures relating to animal care and use were implemented in accordance with the guidelines and regulations by the US Dairy Forage Research Center Farm.

Informed Consent Statement

Not applicable.

Data Availability Statement

The raw read counts for each gene were deposited in FigShare (10.6084/m9.figshare.12845963). Raw rRNA reads were uploaded in NCBI, with the project number of PRJNA647364.

Acknowledgments

N.G. was supported by the China Scholarship Council and the Elite Cattlemen Program of China Agricultural University. W.L., S.G. and B.M. were supported by appropriated project 5090-31000-026-00-D from the USDA Agricultural Research Service (US Dairy Forage Research Center). This research used resources provided by the SCINet project of the USDA Agricultural Research Service, ARS project number 0500-00093-001-00-D. Mention of trade names or commercial products in this article is solely for the purpose of providing specific information and does not imply recommendation by the US Department of Agriculture. The USDA is an equal opportunity provider and employer.

Conflicts of Interest

The authors declare no conflict of interest.

References

  1. Rey, M.; Enjalbert, F.; Combes, S.; Cauquil, L.; Bouchez, O.; Monteils, V. Establishment of ruminal bacterial community in dairy calves from birth to weaning is sequential. J. Appl. Microbiol. 2014, 116, 245–257. [Google Scholar] [CrossRef] [PubMed]
  2. Chase, C.C.L.; Hurley, D.J.; Reber, A.J. Neonatal immune development in the calf and its impact on vaccine response. Vet. Clin. N. Am. Food A 2008, 24, 87–104. [Google Scholar] [CrossRef] [PubMed]
  3. Pacha, J. Development of Intestinal Transport Function in Mammals. Physiol. Rev. 2000, 80, 1633–1667. [Google Scholar] [CrossRef] [PubMed]
  4. Zou, Y.; Wang, Y.; Deng, Y.; Cao, Z.; Li, S.; Wang, J. Effects of feeding untreated, pasteurized and acidified waste milk and bunk tank milk on the performance, serum metabolic profiles, immunity, and intestinal development in Holstein calves. J. Anim. Sci. Biotechno. 2017, 8, 53. [Google Scholar] [CrossRef]
  5. Hammon, H.M.; Frieten, D.; Gerbert, C.; Koch, C.; Dusel, G.; Weikard, R.; Kuhn, C. Different milk diets have substantial effects on the jejunal mucosal immune system of pre-weaning calves, as demonstrated by whole transcriptome sequencing. Sci. Rep. 2018, 8, 1693. [Google Scholar] [CrossRef] [Green Version]
  6. Poudel, P.; Froehlich, K.; Casper, D.P.; St-Pierre, B. Feeding Essential Oils to Neonatal Holstein Dairy Calves Results in Increased Ruminal Prevotellaceae Abundance and Propionate Concentrations. Microorganisms 2019, 7, 120. [Google Scholar] [CrossRef] [Green Version]
  7. Aragona, K.M.; Suarez-Mena, F.X.; Dennis, T.S.; Quigley, J.D.; Hu, W.; Hill, T.M.; Schlotterbeck, R.L. Effect of starter form, starch concentration, and amount of forage fed on Holstein calf growth from 2 to 4 months of age. J. Dairy Sci. 2020, 103, 2324–2332. [Google Scholar] [CrossRef]
  8. National Research Council. Nutrient Requirements of Dairy Cattle; National Academy Press: Washington, DC, USA, 2001. [Google Scholar]
  9. Steele, M.A.; Croom, J.; Kahler, M.; Alzahal, O.; Mcbride, B.W. Bovine rumen epithelium undergoes rapid structural adaptations during grain-induced subacute ruminal acidosis. Am. J. Physiol. Reg. I 2011, 300, R1515–R1523. [Google Scholar] [CrossRef] [Green Version]
  10. Gozho, G.N.; Plaizier, J.C.; Krause, D.O.; Kennedy, A.D.; Wittenberg, K.M. Subacute Ruminal Acidosis Induces Ruminal Lipopolysaccharide Endotoxin Release and Triggers an Inflammatory Response—ScienceDirect. J. Dairy Sci. 2005, 88, 1399–1403. [Google Scholar] [CrossRef] [Green Version]
  11. Zebeli, Q.; Dijkstra, J.; Tafaj, M.; Steingass, H.; Ametaj, B.N.; Drochner, W. Modeling the Adequacy of Dietary Fiber in Dairy Cows Based on the Responses of Ruminal pH and Milk Fat Production to Composition of the Diet. J. Dairy Sci. 2008, 91, 2046–2066. [Google Scholar] [CrossRef] [Green Version]
  12. Li, F.; Cao, Y.; Liu, N.; Yang, X.; Yao, J.; Yan, D. Subacute ruminal acidosis challenge changed in situ degradability of feedstuffs in dairy goats. J. Dairy Sci. 2014, 97, 5101–5109. [Google Scholar] [CrossRef] [Green Version]
  13. Lean, I.J.; Golder, H.M. Ruminal Acidosis: Beyond pH and Rumen. In Proceedings of the 81st Cornell Nutrition Conference for Feed Manufacturers, East Syracuse, NY, USA, 22–24 October 2019; pp. 127–145. [Google Scholar]
  14. Stefanska, B.; Czapa, W.; Pruszynska-Oszmaek, E.; Szczepankiewicz, D.; Fievez, V.; Komisarek, J.; Stajek, K.; Nowak, W. Subacute ruminal acidosis affects fermentation and endotoxin concentration in the rumen and relative expression of the CD14/TLR4/MD2 genes involved in lipopolysaccharide systemic immune response in dairy cows. J. Dairy Sci. 2018, 101, 1297–1310. [Google Scholar] [CrossRef] [Green Version]
  15. Plaizier, J.C.; Yoon, I.; Khafipour, E.S.; Scott, M. Impact of Saccharomyces cerevisiae fermentation product and subacute ruminal acidosis on production, inflammation, and fermentation in the rumen and hindgut of dairy cows. Anim. Feed. Sci. Tech. 2016, 211, 50–60. [Google Scholar] [CrossRef]
  16. Tappenden, K.A. Pathophysiology of short bowel syndrome: Considerations of resected and residual anatomy. JPEN-Parenter. Enter. 2014, 38, 14S–22S. [Google Scholar] [CrossRef]
  17. Norman, D.A.; Morawski, S.G.; Fordtran, J.S. Influence of glucose, fructose, and water movement on calcium absorption in the jejunum. Gastroenterology 1980, 78, 22–25. [Google Scholar] [CrossRef]
  18. Krejs, G.J.; Browne, R.; Raskin, P. Effect of intravenous somatostatin on jejunal absorption of glucose, amino acids, water, and electrolytes. Gastroenterology 1980, 78, 26. [Google Scholar] [CrossRef]
  19. El Nageh, M. Siege de l’absorption intestinale des gamma globulins du colostrum. Chez le veau nouveau-ne. Ann. Med. Vet. 1967, 11, 380. [Google Scholar]
  20. El Nageh, M. Periode de permeabilite de l’intestin du veau nouvean-ne aux gamma globulin du colostrum. Ann. Med. Vet. 1967, 11, 370. [Google Scholar]
  21. Qi, M.; Tan, B.E.; Wang, J.; Li, J.; Yin, Y.L. Small intestinal transcriptome analysis revealed changes of genes involved in nutrition metabolism and immune responses in growth retardation piglets. J. Anim. Sci. 2019, 97, 3795–3808. [Google Scholar] [CrossRef]
  22. Yan, Z.; Cai, L.; Huang, X.; Sun, W.; Li, S.; Wang, P.; Yang, Q.; Jiang, T.; Gun, S. Histological and Comparative Transcriptome Analyses Provide Insights into Small Intestine Health in Diarrheal Piglets after Infection with Clostridium Perfringens Type C. Animals 2019, 9, 269. [Google Scholar] [CrossRef] [Green Version]
  23. Bertocchi, M.; Sirri, F.; Palumbo, O.; Luise, D.; Trevisi, P. Exploring Differential Transcriptome between Jejunal and Cecal Tissue of Broiler Chickens. Animals 2019, 9, 221. [Google Scholar] [CrossRef] [Green Version]
  24. Subramanian, S.; Huq, S.; Yatsunenko, T.; Haque, R.; Mahfuz, M.; Alam, M.A.; Benezra, A.; DeStefano, J.; Meier, M.F.; Muegge, B.D.; et al. Persistent gut microbiota immaturity in malnourished Bangladeshi children. Nature 2014, 510, 417–421. [Google Scholar] [CrossRef]
  25. Koch, C.; Gerbert, C.; Frieten, D.; Dusel, G.; Hammon, H.M. Effects of ad libitum milk replacer feeding and butyrate supplementation on the epithelial growth and development of the gastrointestinal tract in Holstein calves. J. Dairy Sci. 2019, 102, 8513–8526. [Google Scholar] [CrossRef]
  26. Gelsinger, S.L.; Coblentz, W.K.; Zanton, G.I.; Ogden, R.K.; Akins, M.S. Physiological effects of starter-induced ruminal acidosis in calves before, during, and after weaning. J. Dairy Sci. 2020, 103, 2762–2772. [Google Scholar] [CrossRef]
  27. Li, W.; Gelsinger, S.; Edwards, A.; Riehle, C.; Koch, D. Transcriptome analysis of rumen epithelium and meta-transcriptome analysis of rumen epimural microbial community in young calves with feed induced acidosis. Sci. Rep. 2019, 9, 4744. [Google Scholar] [CrossRef]
  28. Li, W.; Gelsinger, S.; Edwards, A.; Riehle, C.; Koch, D. Changes in meta-transcriptome of rumen epimural microbial community and liver transcriptome in young calves with feed induced acidosis. Sci. Rep. 2019, 9, 1–12. [Google Scholar] [CrossRef] [Green Version]
  29. Bi, R.; Liu, P. Sample size calculation while controlling false discovery rate for differential expression analysis with RNA-sequencing experiments. BMC Bioinform. 2016, 17, 146. [Google Scholar] [CrossRef] [Green Version]
  30. Morgan, D.O. The Cell Cycle: Principles of Control; Oxford University Press: Oxford, UK, 2006. [Google Scholar]
  31. Li, Z.; Xu, X.Z. Post-Translational Modifications of the Mini-Chromosome Maintenance Proteins in DNA Replication. Genes 2019, 10, 331. [Google Scholar] [CrossRef] [PubMed] [Green Version]
  32. Forsburg, S.L. Eukaryotic MCM proteins: Beyond replication initiation. Microbiol. Mol. Biol. Rev. 2004, 68, 109–131. [Google Scholar] [CrossRef] [PubMed] [Green Version]
  33. Tognetti, S.; Riera, A.; Speck, C. Switch on the engine: How the eukaryotic replicative helicase MCM2-7 becomes activated. Chromosoma 2015, 124, 13–26. [Google Scholar] [CrossRef] [PubMed] [Green Version]
  34. Ibarra, A.; Schwob, E.; Méndez, J. Excess MCM proteins protect human cells from replicative stress by licensing backup origins of replication. Proc. Natl. Acad. Sci. USA 2008, 105, 8956–8961. [Google Scholar] [CrossRef] [Green Version]
  35. Ge, X.Q.; Jackson, D.A.; Blow, J.J. Dormant origins licensed by excess Mcm2–7 are required for human cells to survive replicative stress. Gene. Dev. 2007, 21, 3331–3341. [Google Scholar] [CrossRef] [Green Version]
  36. Musiałek, M.W.; Rybaczek, D. Behavior of replication origins in Eukaryota–spatio-temporal dynamics of licensing and firing. Cell Cycle 2015, 14, 2251–2264. [Google Scholar] [CrossRef]
  37. Ryu, S.; Holzschuh, J.; Erhardt, S.; Ettl, A.-K.; Driever, W. Depletion of minichromosome maintenance protein 5 in the zebrafish retina causes cell-cycle defect and apoptosis. Proc. Natl. Acad. Sci. USA 2005, 102, 18467–18472. [Google Scholar] [CrossRef] [Green Version]
  38. Shivji, M.K.; Kenny, M.K.; Wood, R.D. Proliferating cell nuclear antigen is required for DNA excision repair. Cell 1992, 69, 367–374. [Google Scholar] [CrossRef]
  39. Essers, J.; Theil, A.F.; Baldeyron, C.; van Cappellen, W.A.; Houtsmuller, A.B.; Kanaar, R.; Vermeulen, W. Nuclear dynamics of PCNA in DNA replication and repair. Mol. Cell. Biol. 2005, 25, 9350–9359. [Google Scholar] [CrossRef] [Green Version]
  40. de Greeff, A.; Resink, J.W.; van Hees, H.M.J.; Ruuls, L.; Klaassen, G.J.; Rouwers, S.M.G.; Stockhofe-Zurwieden, N. Supplementation of piglets with nutrient-dense complex milk replacer improves intestinal development and microbial fermentation. J. Anim. Sci. 2016, 94, 1012–1019. [Google Scholar] [CrossRef]
  41. Song, Z.H.; Tong, G.; Xiao, K.; Jiao, L.F.; Ke, Y.L.; Hu, C.H. L-Cysteine protects intestinal integrity, attenuates intestinal inflammation and oxidant stress, and modulates NF-B and Nrf2 pathways in weaned piglets after LPS challenge. Innate Immun. 2016, 22, 152–161. [Google Scholar] [CrossRef]
  42. Kanehisa, M.; Goto, S. KEGG: Kyoto encyclopedia of genes and genomes. Nucleic Acids Res. 2000, 28, 27–30. [Google Scholar] [CrossRef]
  43. Marzec, K.; Burgess, A. The Oncogenic Functions of MASTL Kinase. Front. Cell Dev. Biol. 2018, 6, 162. [Google Scholar] [CrossRef]
  44. Voets, E.; Wolthuis, R.M. MASTL is the human ortholog of Greatwall kinase that facilitates mitotic entry, anaphase and cytokinesis. Cell Cycle 2010, 9, 3591–3601. [Google Scholar] [CrossRef]
  45. Heim, A.; Konietzny, A.; Mayer, T.U. Protein phosphatase 1 is essential for Greatwall inactivation at mitotic exit. EMBO Rep. 2015, 16, 1501–1510. [Google Scholar] [CrossRef] [PubMed] [Green Version]
  46. Ma, S.; Vigneron, S.; Robert, P.; Strub, J.M.; Cianferani, S.; Castro, A.; Lorca, T. Greatwall dephosphorylation and inactivation upon mitotic exit is triggered by PP1. J. Cell Sci. 2016, 129, 1329–1339. [Google Scholar] [CrossRef] [PubMed] [Green Version]
  47. Rogers, S.; Fey, D.; McCloy, R.A.; Parker, B.L.; Mitchell, N.J.; Payne, R.J.; Daly, R.J.; James, D.E.; Caldon, C.E.; Watkins, D.N. PP1 initiates the dephosphorylation of MASTL, triggering mitotic exit and bistability in human cells. J. Cell Sci. 2016, 129, 1340–1354. [Google Scholar] [CrossRef] [PubMed] [Green Version]
  48. Carmena, M.; Earnshaw, W.C. The cellular geography of aurora kinases. Nat. Rev. Mol. Cell Biol. 2003, 4, 842–854. [Google Scholar] [CrossRef]
  49. Ding, J.; Swain, J.E.; Smith, G.D. Aurora kinase-A regulates microtubule organizing center (MTOC) localization, chromosome dynamics, and histone-H3 phosphorylation in mouse oocytes. Mol. Reprod. Dev. 2011, 78, 80–90. [Google Scholar] [CrossRef] [PubMed] [Green Version]
  50. Nikonova, A.S.; Astsaturov, I.; Serebriiskii, I.G.; Dunbrack, R.L.; Golemis, E.A. Aurora A kinase (AURKA) in normal and pathological cell division. Cell. Mol. Life Sci. 2013, 70, 661–687. [Google Scholar] [CrossRef] [PubMed]
  51. Zhu, W.H.; Li, J.; Wu, B.Y. Gene expression profiling of the mouse gut: Effect of intestinal flora on intestinal health. Mol. Med. Rep. 2018, 17, 3667–3673. [Google Scholar] [CrossRef] [Green Version]
  52. Perland, E.; Fredriksson, R. Classification systems of secondary active transporters. Trends Pharmacol. Sci. 2017, 38, 305–315. [Google Scholar] [CrossRef]
  53. Broer, S. Amino acid transport across mammalian intestinal and renal epithelia. Physiol. Rev. 2008, 88, 249–286. [Google Scholar] [CrossRef]
  54. Woodward, A.D.; Holcombe, S.J.; Steibel, J.P.; Staniar, W.B.; Colvin, C.; Trottier, N.L. Cationic and neutral amino acid transporter transcript abundances are differentially expressed in the equine intestinal tract. J. Anim. Sci. 2010, 88, 1028–1033. [Google Scholar] [CrossRef] [Green Version]
  55. Rexhepaj, R.; Grahammer, F.; Volkl, H.; Remy, C.; Wagner, C.A.; Sandulache, D.; Artunc, F.; Henke, G.; Nammi, S.; Capasso, G.; et al. Reduced intestinal and renal amino acid transport in PDK1 hypomorphic mice. FASEB J. 2006, 20, 2214–2222. [Google Scholar] [CrossRef] [Green Version]
  56. Zhu, X.L.; Jiao, J.Z.; Zhou, C.S.; Tang, S.X.; Wang, M.; Kang, J.H.; Han, X.F.; Tan, Z.L. Effects of dietary methionine and lysine supplementation on nutrients digestion, serum parameters and mRNA expression of related aminoacid sensing and transporting genes in growing goats. Small Rumin. Res. 2018, 166, 1–6. [Google Scholar] [CrossRef]
  57. Pfeiffer, R.; Rossier, G.; Spindler, B.; Meier, C.; Kühn, L.; Verrey, F. Amino acid transport of y+ L-type by heterodimers of 4F2hc/CD98 and members of the glycoprotein-associated amino acid transporter family. EMBO J. 1999, 18, 49–57. [Google Scholar] [CrossRef] [Green Version]
  58. Braun, D.; Wirth, E.K.; Wohlgemuth, F.; Reix, N.; Klein, M.O.; Gruters, A.; Kohrle, J.; Schweizer, U. Aminoaciduria, but normal thyroid hormone levels and signalling, in mice lacking the amino acid and thyroid hormone transporter Slc7a8. Biochem. J. 2011, 439, 249–255. [Google Scholar] [CrossRef] [Green Version]
  59. Liao, S.; Vanzant, E.; Harmon, D.; McLeod, K.; Boling, J.; Matthews, J. Ruminal and abomasal starch hydrolysate infusions selectively decrease the expression of cationic amino acid transporter mRNA by small intestinal epithelia of forage-fed beef steers. J. Dairy Sci. 2009, 92, 1124–1135. [Google Scholar] [CrossRef] [Green Version]
  60. Fei, Y.-J.; Kanai, Y.; Nussberger, S.; Ganapathy, V.; Leibach, F.H.; Romero, M.F.; Singh, S.K.; Boron, W.F.; Hediger, M.A. Expression cloning of a mammalian proton-coupled oligopeptide transporter. Nature 1994, 368, 563–566. [Google Scholar] [CrossRef]
  61. Shen, H.; Smith, D.E.; Brosius, F.C. Developmental expression of PEPT1 and PEPT2 in rat small intestine, colon, and kidney. Pediatr. Res. 2001, 49, 789–795. [Google Scholar] [CrossRef] [Green Version]
  62. Zhou, P.; Luo, Y.Q.; Zhang, L.; Li, J.L.; Zhang, B.L.; Xing, S.; Zhu, Y.P.; Gao, F.; Zhou, G.H. Effects of cysteamine supplementation on the intestinal expression of amino acid and peptide transporters and intestinal health in finishing pigs. Anim. Sci. J. 2017, 88, 314–321. [Google Scholar] [CrossRef]
  63. Clarke, L.C.; Sweeney, T.; Curley, E.; Gath, V.; Duffy, S.K.; Vigors, S.; Rajauria, G.; O’Doherty, J.V. Effect of beta-glucanase and beta-xylanase enzyme supplemented barley diets on nutrient digestibility, growth performance and expression of intestinal nutrient transporter genes in finisher pigs. Anim. Feed. Sci. Tech. 2018, 238, 98–110. [Google Scholar] [CrossRef]
  64. Sora, I.; Richman, J.; Santoro, G.; Wei, H.; Wang, Y.; Vanderah, T.; Horvath, R.; Nguyen, M.; Waite, S.; Roeske, W.R. The cloning and expression of a human creatine transporter. Biochem. Bioph. Res. Co. 1994, 204, 419–427. [Google Scholar] [CrossRef] [PubMed]
  65. Christie, D.L. Functional insights into the creatine transporter. In Creatine and Creatine Kinase in Health and Disease; Springer: Berlin/Heidelberg, Germany, 2007; pp. 99–118. [Google Scholar]
  66. Takenaka, M.; Bagnasco, S.M.; Preston, A.S.; Uchida, S.; Yamauchi, A.; Kwon, H.M.; Handler, J.S. The canine betaine gamma-amino-n-butyric acid transporter gene: Diverse mRNA isoforms are regulated by hypertonicity and are expressed in a tissue-specific manner. Proc. Natl. Acad. Sci. USA 1995, 92, 1072–1076. [Google Scholar] [CrossRef] [PubMed] [Green Version]
  67. Braissant, O.; Henry, H. AGAT, GAMT and SLC6A8 distribution in the central nervous system, in relation to creatine deficiency syndromes: A review. J. Inherit. Metab. Dis. 2008, 31, 230–239. [Google Scholar] [CrossRef] [PubMed] [Green Version]
  68. Mak, C.; Waldvogel, H.; Dodd, J.; Gilbert, R.; Lowe, M.; Birch, N.; Faull, R.; Christie, D. Immunohistochemical localisation of the creatine transporter in the rat brain. Neuroscience 2009, 163, 571–585. [Google Scholar] [CrossRef]
  69. Taylor, J.; Mager, E.; Grosell, M. Basolateral NBCe1 plays a rate-limiting role in transepithelial intestinal HCO3–secretion, contributing to marine fish osmoregulation. J. Exp. Biol. 2010, 213, 459–468. [Google Scholar] [CrossRef] [Green Version]
  70. Alves, A.; Gregorio, S.F.; Egger, R.C.; Fuentes, J. Molecular and functional regionalization of bicarbonate secretion cascade in the intestine of the European sea bass (Dicentrarchus labrax). Comp. Biochem. Phys. A 2019, 233, 53–64. [Google Scholar] [CrossRef]
  71. Cui, Z.; Wu, S.; Li, J.; Yang, Q.E.; Chai, S.; Wang, L.; Wang, X.; Zhang, X.; Liu, S.; Yao, J. Effect of Alfalfa Hay and Starter Feeding Intervention on Gastrointestinal Microbial Community, Growth and Immune Performance of Yak Calves. Front. Microbiol. 2020, 11, 994. [Google Scholar] [CrossRef]
  72. Malmuthuge, N.; Li, M.; Goonewardene, L.A.; Oba, M.; Guan, L.L. Effect of calf starter feeding on gut microbial diversity and expression of genes involved in host immune responses and tight junctions in dairy calves during weaning transition. J. Dairy Sci. 2013, 96, 3189–3200. [Google Scholar] [CrossRef]
  73. Philipson, C.W.; Bassaganya-Riera, J.; Viladomiu, M.; Kronsteiner, B.; Abedi, V.; Hoops, S.; Michalak, P.; Kang, L.; Girardin, S.E.; Hontecillas, R. Modeling the regulatory mechanisms by which NLRX1 modulates innate immune responses to Helicobacter pylori infection. PLoS ONE 2015, 10, e0137839. [Google Scholar] [CrossRef] [Green Version]
  74. Castano-Rodriguez, N.; Kaakoush, N.O.; Goh, K.-L.; Fock, K.M.; Mitchell, H.M. The NOD-like receptor signalling pathway in Helicobacter pylori infection and related gastric cancer: A case-control study and gene expression analyses. PLoS ONE 2014, 9, e0117870. [Google Scholar] [CrossRef]
  75. Miyata, K.S.; McCaw, S.E.; Patel, H.V.; Rachubinski, R.A.; Capone, J.P. The orphan nuclear hormone receptor LXR interacts with the peroxisome proliferator-activated receptor and inhibits peroxisome proliferator signaling. J. Biol. Chem. 1996, 271, 9189–9192. [Google Scholar] [CrossRef] [Green Version]
  76. McFadden, J.; Corl, B. Activation of liver X receptor (LXR) enhances de novo fatty acid synthesis in bovine mammary epithelial cells. J. Dairy Sci. 2010, 93, 4651–4658. [Google Scholar] [CrossRef]
  77. Meertens, L.; Labeau, A.; Dejarnac, O.; Cipriani, S.; Sinigaglia, L.; Bonnet-Madin, L.; Le Charpentier, T.; Hafirassou, M.L.; Zamborlini, A.; Cao-Lormeau, V.-M. Axl mediates ZIKA virus entry in human glial cells and modulates innate immune responses. Cell Rep. 2017, 18, 324–333. [Google Scholar] [CrossRef]
  78. Rothlin, C.V.; Ghosh, S.; Zuniga, E.I.; Oldstone, M.B.; Lemke, G. TAM receptors are pleiotropic inhibitors of the innate immune response. Cell 2007, 131, 1124–1136. [Google Scholar] [CrossRef] [Green Version]
  79. Petri, R.; Schwaiger, T.; Penner, G.; Beauchemin, K.; Forster, R.; McKinnon, J.; McAllister, T. Changes in the rumen epimural bacterial diversity of beef cattle as affected by diet and induced ruminal acidosis. Appl. Environ. Microbiol. 2013, 79, 3744–3755. [Google Scholar] [CrossRef] [Green Version]
  80. Bergmann, G.T. Microbial community composition along the digestive tract in forage- and grain-fed bison. BMC Vet. Res. 2017, 13, 253. [Google Scholar] [CrossRef] [Green Version]
  81. Wetzels, S.U.; Mann, E.; Pourazad, P.; Qumar, M.; Pinior, B.; Metzler-Zebeli, B.U.; Wagner, M.; Schmitz-Esser, S.; Zebeli, Q. Epimural bacterial community structure in the rumen of Holstein cows with different responses to a long-term subacute ruminal acidosis diet challenge. J. Dairy Sci. 2017, 100, 1829–1844. [Google Scholar] [CrossRef]
  82. Kim, Y.H.; Nagata, R.; Ohkubo, A.; Ohtani, N.; Kushibiki, S.; Ichijo, T.; Sato, S. Changes in ruminal and reticular pH and bacterial communities in Holstein cattle fed a high-grain diet. BMC Vet. Res. 2018, 14, 310. [Google Scholar] [CrossRef]
  83. Petri, R.M.; Kleefisch, M.T.; Metzler-Zebeli, B.U.; Zebeli, Q.; Klevenhusen, F. Changes in the Rumen Epithelial Microbiota of Cattle and Host Gene Expression in Response to Alterations in Dietary Carbohydrate Composition. Appl. Environ. Microbiol. 2018, 84, AEM.00384-18. [Google Scholar] [CrossRef] [Green Version]
  84. Vorwerk, H.; Huber, C.; Mohr, J.; Bunk, B.; Bhuju, S.; Wensel, O.; Spröer, C.; Fruth, A.; Flieger, A.; Schmidt-Hohagen, K. A transferable plasticity region in C ampylobacter coli allows isolates of an otherwise non-glycolytic food-borne pathogen to catabolize glucose. Mol. Microbiol. 2015, 98, 809–830. [Google Scholar] [CrossRef] [Green Version]
  85. Vegge, C.S.; Jansen van Rensburg, M.J.; Rasmussen, J.J.; Maiden, M.C.; Johnsen, L.G.; Danielsen, M.; MacIntyre, S.; Ingmer, H.; Kelly, D.J. Glucose metabolism via the Entner-Doudoroff pathway in Campylobacter: A rare trait that enhances survival and promotes biofilm formation in some isolates. Front. Microbiol. 2016, 7, 1877. [Google Scholar] [CrossRef] [Green Version]
  86. Kelly, D.J. Complexity and Versatility in the Physiology and Metabolism of Campylobacter jejuni. In Campylobacter, 3rd ed.; Amer Soc Microbiology: Washington, DC, USA, 2008; pp. 41–61. [Google Scholar]
  87. Moore, J.E.; Corcoran, D.; Dooley, J.S.; Fanning, S.; Lucey, B.; Matsuda, M.; McDowell, D.A.; Megraud, F.; Millar, B.C.; O’Mahony, R.; et al. Campylobacter. Vet. Res. 2005, 36, 351–382. [Google Scholar] [CrossRef] [Green Version]
  88. Sauerwein, R.; Horrevorts, A.; Bisseling, J. Septic abortion associated withCampylobacter fetus subspeciesfetus infection: Case report and review of the literature. Infection 1993, 21, 331–333. [Google Scholar] [CrossRef]
  89. Kraatz, M.; Wallace, R.J.; Svensson, L. Olsenella umbonata sp. nov., a microaerotolerant anaerobic lactic acid bacterium from the sheep rumen and pig jejunum, and emended descriptions of Olsenella, Olsenella uli and Olsenella profusa. Int. J. Syst. Evol. Micr. 2011, 61, 795–803. [Google Scholar] [CrossRef] [Green Version]
  90. Malmuthuge, N.; Griebel, P.J. Taxonomic identification of commensal bacteria associated with the mucosa and digesta throughout the gastrointestinal tracts of preweaned calves. Appl. Environ. Microbiol. 2014, 80, 2021–2028. [Google Scholar] [CrossRef] [Green Version]
  91. Wang, L.Z.; Liu, K.Z.; Wang, Z.S.; Bai, X.; Peng, Q.H.; Jin, L. Bacterial Community Diversity Associated with Different Utilization Efficiencies of Nitrogen in the Gastrointestinal Tract of Goats. Front. Microbiol. 2019, 10, 239. [Google Scholar] [CrossRef]
  92. Gyuraszova, M.; Kovalcikova, A.; Gardlik, R. Association between oxidative status and the composition of intestinal microbiota along the gastrointestinal tract. Med. Hypotheses 2017, 103, 81–85. [Google Scholar] [CrossRef]
  93. Suen, G.; Stevenson, D.M.; Bruce, D.C.; Chertkov, O.; Copeland, A.; Cheng, J.-F.; Detter, C.; Detter, J.C.; Goodwin, L.A.; Han, C.S. Complete genome of the cellulolytic ruminal bacterium Ruminococcus albus 7. Am. Soc. Microbiol. 2011, 193, 5574–5575. [Google Scholar] [CrossRef] [PubMed] [Green Version]
  94. Flint, H.J.; Scott, K.P.; Duncan, S.H.; Louis, P.; Forano, E. Microbial degradation of complex carbohydrates in the gut. Gut Microbes 2012, 3, 289–306. [Google Scholar] [CrossRef] [PubMed] [Green Version]
  95. Jami, E.; Israel, A.; Kotser, A.; Mizrahi, I. Exploring the bovine rumen bacterial community from birth to adulthood. ISME J. 2013, 7, 1069–1079. [Google Scholar] [CrossRef] [PubMed] [Green Version]
  96. Liu, J.; Liu, F.; Cai, W.; Jia, C.; Song, J. Diet-induced changes in bacterial communities in the jejunum and their associations with bile acids in Angus beef cattle. Anim. Microbiome 2020, 2, 33. [Google Scholar] [CrossRef]
  97. Vangylswyk, N.O. Succiniclasticum Ruminis Gen-Nov, Sp-Nov, A Ruminal Bacterium Converting Succinate to Propionate as the Sole Energy-Yielding Mechanism. Int. J. Syst. Bacteriol. 1995, 45, 297–300. [Google Scholar] [CrossRef] [PubMed] [Green Version]
  98. Wang, J.; Kim, J.; Kim, J.; Kim, I. Amino acid digestibility of single cell protein from Corynebacterium ammoniagenes in growing pigs. Anim. Feed. Sci. Tech. 2013, 180, 111–114. [Google Scholar] [CrossRef]
  99. Cook, G.M.; Wells, J.E.; Russell, J.B. Ability of acidaminococcus-fermentans to oxidize trans-aconitate and decrease the accumulation of tricarballylate, a toxic end-product of ruminal fermentation. Appl. Environ. Microbiol. 1994, 60, 2533–2537. [Google Scholar] [CrossRef] [Green Version]
  100. Myer, P.R.; Wells, J.E.; Smith, T.P.L.; Kuehn, L.A.; Freetly, H.C. Microbial community profiles of the jejunum from steers differing in feed efficiency. J. Anim. Sci. 2016, 94, 327–338. [Google Scholar] [CrossRef]
  101. Wang, J.; Han, Y.; Zhao, J.Z.; Zhou, Z.J.; Fan, H. Pyrosequencing-based analysis of the complex microbiota located in the gastrointestinal tracts of growing-finishing pigs. Anim Prod. Sci. 2019, 59, 870–878. [Google Scholar] [CrossRef]
  102. Zhu, Y.Z.; Shi, C.; Niu, Q.Y.; Wang, J.; Zhu, W.Y. Dynamic changes in morphology, gene expression and microbiome in the jejunum of compensatory-growth rats induced by protein restriction. Microb. Biotechnol. 2018, 11, 734–746. [Google Scholar] [CrossRef]
  103. Lu, J.; Idris, U.; Harmon, B.; Hofacre, C.; Maurer, J.J.; Lee, M.D. Diversity and succession of the intestinal bacterial community of the maturing broiler chicken. Appl. Environ. Microbiol. 2003, 69, 6816–6824. [Google Scholar] [CrossRef] [Green Version]
  104. Xiao, Y.P.; Xiang, Y.; Zhou, W.D.; Chen, J.G.; Li, K.F.; Yang, H. Microbial community mapping in intestinal tract of broiler chicken. Poult. Sci. 2017, 96, 1387–1393. [Google Scholar] [CrossRef]
  105. Balows, A.; Trüper, H.G.; Dworkin, M.; Harder, W.; Schleifer, K.H. The Prokaryotes: A Handbook on the Biology of Bacteria: Ecophysiology, Isolation, Identification, Applications; Springer: Heidelberg, Germany, 1992. [Google Scholar]
  106. Kristensen, N.B.; Engbaek, M.; Vestergaard, M.; Harmon, D.L. Technical note: Ruminal cannulation technique in young Holstein calves: Effects of cannulation on feed intake, body weight gain, and ruminal development at six weeks of age. J. Dairy Sci. 2010, 93, 737–742. [Google Scholar] [CrossRef]
  107. Dobin, A.; Davis, C.A.; Schlesinger, F.; Drenkow, J.; Zaleski, C.; Jha, S.; Batut, P.; Chaisson, M.; Gingeras, T.R. STAR: Ultrafast universal RNA-seq aligner. Bioinformatics 2013, 29, 15–21. [Google Scholar] [CrossRef] [PubMed]
  108. Anders, S.; Pyl, P.T.; Huber, W. HTSeq—A Python framework to work with high-throughput sequencing data. Bioinformatics 2015, 31, 166–169. [Google Scholar] [CrossRef] [PubMed]
  109. Love, M.I.; Huber, W.; Anders, S. Moderated estimation of fold change and dispersion for RNA-seq data with DESeq2. Genome Biol. 2014, 15, 550. [Google Scholar] [CrossRef] [PubMed] [Green Version]
  110. Sherman, B.T. Extracting biological meaning from large gene lists with DAVID. In Chapter 13 in Current Protocols in Bioinformatics; John Wiley & Sons, Inc.: Hoboken, NJ, USA, 2009. [Google Scholar]
  111. Kopylova, E.; Noé, L.; Touzet, H. SortMeRNA: Fast and accurate filtering of ribosomal RNAs in metatranscriptomic data. Bioinformatics 2012, 28, 3211–3217. [Google Scholar] [CrossRef]
  112. Quast, C.; Pruesse, E.; Yilmaz, P.; Gerken, J.; Schweer, T.; Yarza, P.; Peplies, J.; Glöckner, F.O. The SILVA ribosomal RNA gene database project: Improved data processing and web-based tools. Nucleic Acids Res. 2012, 41, D590–D596. [Google Scholar] [CrossRef]
  113. Burge, S.W.; Daub, J.; Eberhardt, R.; Tate, J.; Barquist, L.; Nawrocki, E.P.; Eddy, S.R.; Gardner, P.P.; Bateman, A. Rfam 11.0: 10 years of RNA families. Nucleic Acids Res. 2013, 41, D226–D232. [Google Scholar] [CrossRef] [Green Version]
  114. Wood, D.E.; Salzberg, S.L. Kraken: Ultrafast metagenomic sequence classification using exact alignments. Genome Biol. 2014, 15, R46. [Google Scholar] [CrossRef] [Green Version]
  115. Tuo, L.; Xiang, J.; Pan, X.; Hu, J.; Tang, H.; Liang, L.; Xia, J.; Hu, Y.; Zhang, W.; Huang, A.; et al. PCK1 negatively regulates cell cycle progression and hepatoma cell proliferation via the AMPK/p27(Kip1) axis. J. Exp. Clin. Cancer Res. 2019, 38, 50. [Google Scholar] [CrossRef] [Green Version]
  116. Sperandeo, P.; Lau, F.K.; Carpentieri, A.; De Castro, C.; Molinaro, A.; Deho, G.; Silhavy, T.J.; Polissi, A. Functional analysis of the protein machinery required for transport of lipopolysaccharide to the outer membrane of Escherichia coli. J. Bacteriol. 2008, 190, 4460–4469. [Google Scholar] [CrossRef] [Green Version]
  117. Mitsubuchi, H.; Nakamura, K.; Matsumoto, S.; Endo, F. Inborn errors of proline metabolism. J. Nutr. 2008, 138, 2016S–2020S. [Google Scholar] [CrossRef]
  118. Takebe, G.; Yarimizu, J.; Saito, Y.; Hayashi, T.; Nakamura, H.; Yodoi, J.; Nagasawa, S.; Takahashi, K. A comparative study on the hydroperoxide and thiol specificity of the glutathione peroxidase family and selenoprotein P. J. Biol. Chem. 2002, 277, 41254–41258. [Google Scholar] [CrossRef] [Green Version]
  119. Compeer, E.B.; Janssen, W.; van Royen-Kerkhof, A.; van Gijn, M.; van Montfrans, J.M.; Boes, M. Dysfunctional BLK in common variable immunodeficiency perturbs B-cell proliferation and ability to elicit antigen-specific CD4+ T-cell help. Oncotarget 2015, 6, 10759–10771. [Google Scholar] [CrossRef]
  120. Borowiec, M.; Liew, C.W.; Thompson, R.; Boonyasrisawat, W.; Hu, J.; Mlynarski, W.M.; El Khattabi, I.; Kim, S.H.; Marselli, L.; Rich, S.S.; et al. Mutations at the BLK locus linked to maturity onset diabetes of the young and beta-cell dysfunction. Proc. Natl. Acad. Sci. USA 2009, 106, 14460–14465. [Google Scholar] [CrossRef] [Green Version]
  121. Arseneau, J.R.; Laflamme, M.; Lewis, S.M.; Maicas, E.; Ouellette, R.J. Multiple isoforms of PAX5 are expressed in both lymphomas and normal B-cells. Brit. J. Haematol. 2009, 147, 328–338. [Google Scholar] [CrossRef]
  122. Schormann, N.; Ricciardi, R.; Chattopadhyay, D. Uracil-DNA glycosylases—structural and functional perspectives on an essential family of DNA repair enzymes. Protein Sci. 2014, 23, 1667–1685. [Google Scholar] [CrossRef] [Green Version]
  123. Wisnieski, F.; Calcagno, D.Q.; Leal, M.F.; dos Santos, L.C.; Gigek, C.D.; Chen, E.S.; Pontes, T.B.; Assumpcao, P.P.; de Assumpcao, M.B.; Demachki, S.; et al. Reference genes for quantitative RT-PCR data in gastric tissues and cell lines. World J. Gastroentero. 2013, 19, 7121–7128. [Google Scholar] [CrossRef]
  124. Die, J.V.; Baldwin, R.L.; Rowland, L.J.; Li, R.; Oh, S.; Li, C.J.; Connor, E.E.; Ranilla, M.J. Selection of internal reference genes for normalization of reverse transcription quantitative polymerase chain reaction (RT-qPCR) analysis in the rumen epithelium. PLoS ONE 2017, 12, e0172674. [Google Scholar] [CrossRef]
  125. Livak, K.J.; Schmittgen, T.D. Analysis of relative gene expression data using real-time quantitative PCR and the 2−ΔΔCT method. Methods 2001, 25, 402–408. [Google Scholar] [CrossRef]
Figure 1. Heatmap showing top 40 DEGs between treatments. The log2 ratio values of DEG abundance were used for cluster analysis with the R pheatmap package. Red and blue indicate relative over- or under-expression of genes, respectively. Aci, feed-induced acidosis group; Con, control group.
Metabolites 11 00414 g001
Figure 2. RT-qPCR confirmation of five DEGs identified by RNA-seq.
Metabolites 11 00414 g002
Figure 3. The GO circle of functional enrichment analyses with DEGs. Each segment of the circle shows the scatter plot the log2FC of the enriched genes. The red points display upregulation, and the teal-blue ones display downregulation. The bigger segment size of the inner circle indicated the higher expression of the enriched pathway. The darker the shade of blue means more decreasing. The darker the shade of red means more increasing.
Metabolites 11 00414 g003
Figure 4. The Pearson correlation matrix between the active bacteria with significant abundance changes and the host jejunum DEGs. The color scale bar below (A) and (B) show the Pearson r value: the more positive the correlation (closer to 1), the darker the shade of blue; the more negative the correlation (closer to −1), the darker the shade of red. (A) The IEGs enriched in ATP binding and the DEGs enriched in protein digestion and absorption, sodium ion transmembrane transport, skeletal muscle cell differentiation, negative regulation of inflammatory response, cellular response to LPS, and positive regulation of JNK cascade. (B) The REGs enriched in ATP binding and the DEGs enriched in cell cycle, cell division, mitotic nuclear division, and DNA replication initiation; * p < 0.05; ** p < 0.01; *** p < 0.001.
Metabolites 11 00414 g004
Figure 5. DNA replication of jejunum epithelial cell. This figure is based on the pathway bta03030 shown in KEGG [42]. Green markers indicate that proteins encoded by genes with reduced expression levels in treated calves. The graph was produced by “pathview” in R.
Metabolites 11 00414 g005
Figure 6. Amino acids and peptides transport in jejunum epithelial cell. Red marker: transporters encoded by the IEGs. Yellow marker: IEGs encode the transporters for anionic amino acid (AA), peptides, neutral AA. This figure is based on the pathway bta04974 shown in KEGG [42]. Red markers were printed by “pathview” in R.
Metabolites 11 00414 g006
Figure 7. Workflow of RNA library preparation and sequencing.
Metabolites 11 00414 g007
Figure 8. Bioinformatics workflow of whole-transcriptome sequencing data analysis.
Metabolites 11 00414 g008
Table 1. The active bacteria changes in jejunum when using rRNA transcriptome analysis.
GenusNormalized Read Counts (Mean ± SEM)p-ValueDescription
ConAci
Campylobacter738.22 ± 208.783581.05 ± 1312.380.021Gram-negative
Corynebacterium1096.51 ± 181.402828.44 ± 1278.400.021Gram-positive
Acidaminococcus658.54 ± 88.522119.04 ± 1371.720.021Gram-negative
Olsenella484.36 ± 174.051521.03 ± 908.390.043Gram-positive
Sphaerochaeta206.85 ± 44.44520.41 ± 172.810.043--
Burkholderia0.00129.69 ± 116.150.047Gram-negative
Moraxella370.53 ± 64.5260.63 ± 37.340.020Gram-negative
Francisella3510.84 ± 200.531768.27 ± 361.600.021Gram-negative
Nitrosospira4510.05 ± 690.551783.64 ± 546.930.021--
Lachnoclostridium5588.09 ± 1076.921553.04 ± 356.100.021Butyrate producer
Mycobacterium176.47 ± 55.1122.34 ± 22.340.038Cannot be stained
Ruminococcus1847.28 ± 380.77546.59 ± 212.980.043Gram-positive
Publisher’s Note: MDPI stays neutral with regard to jurisdictional claims in published maps and institutional affiliations.

