
Hyperpolarized 13C Magnetic Resonance Spectroscopic Imaging of Pyruvate Metabolism in Murine Breast Cancer Models of Different Metastatic Potential

 , , and
Abstract
:
1. Introduction
2. Results
2.1. Tumor Size
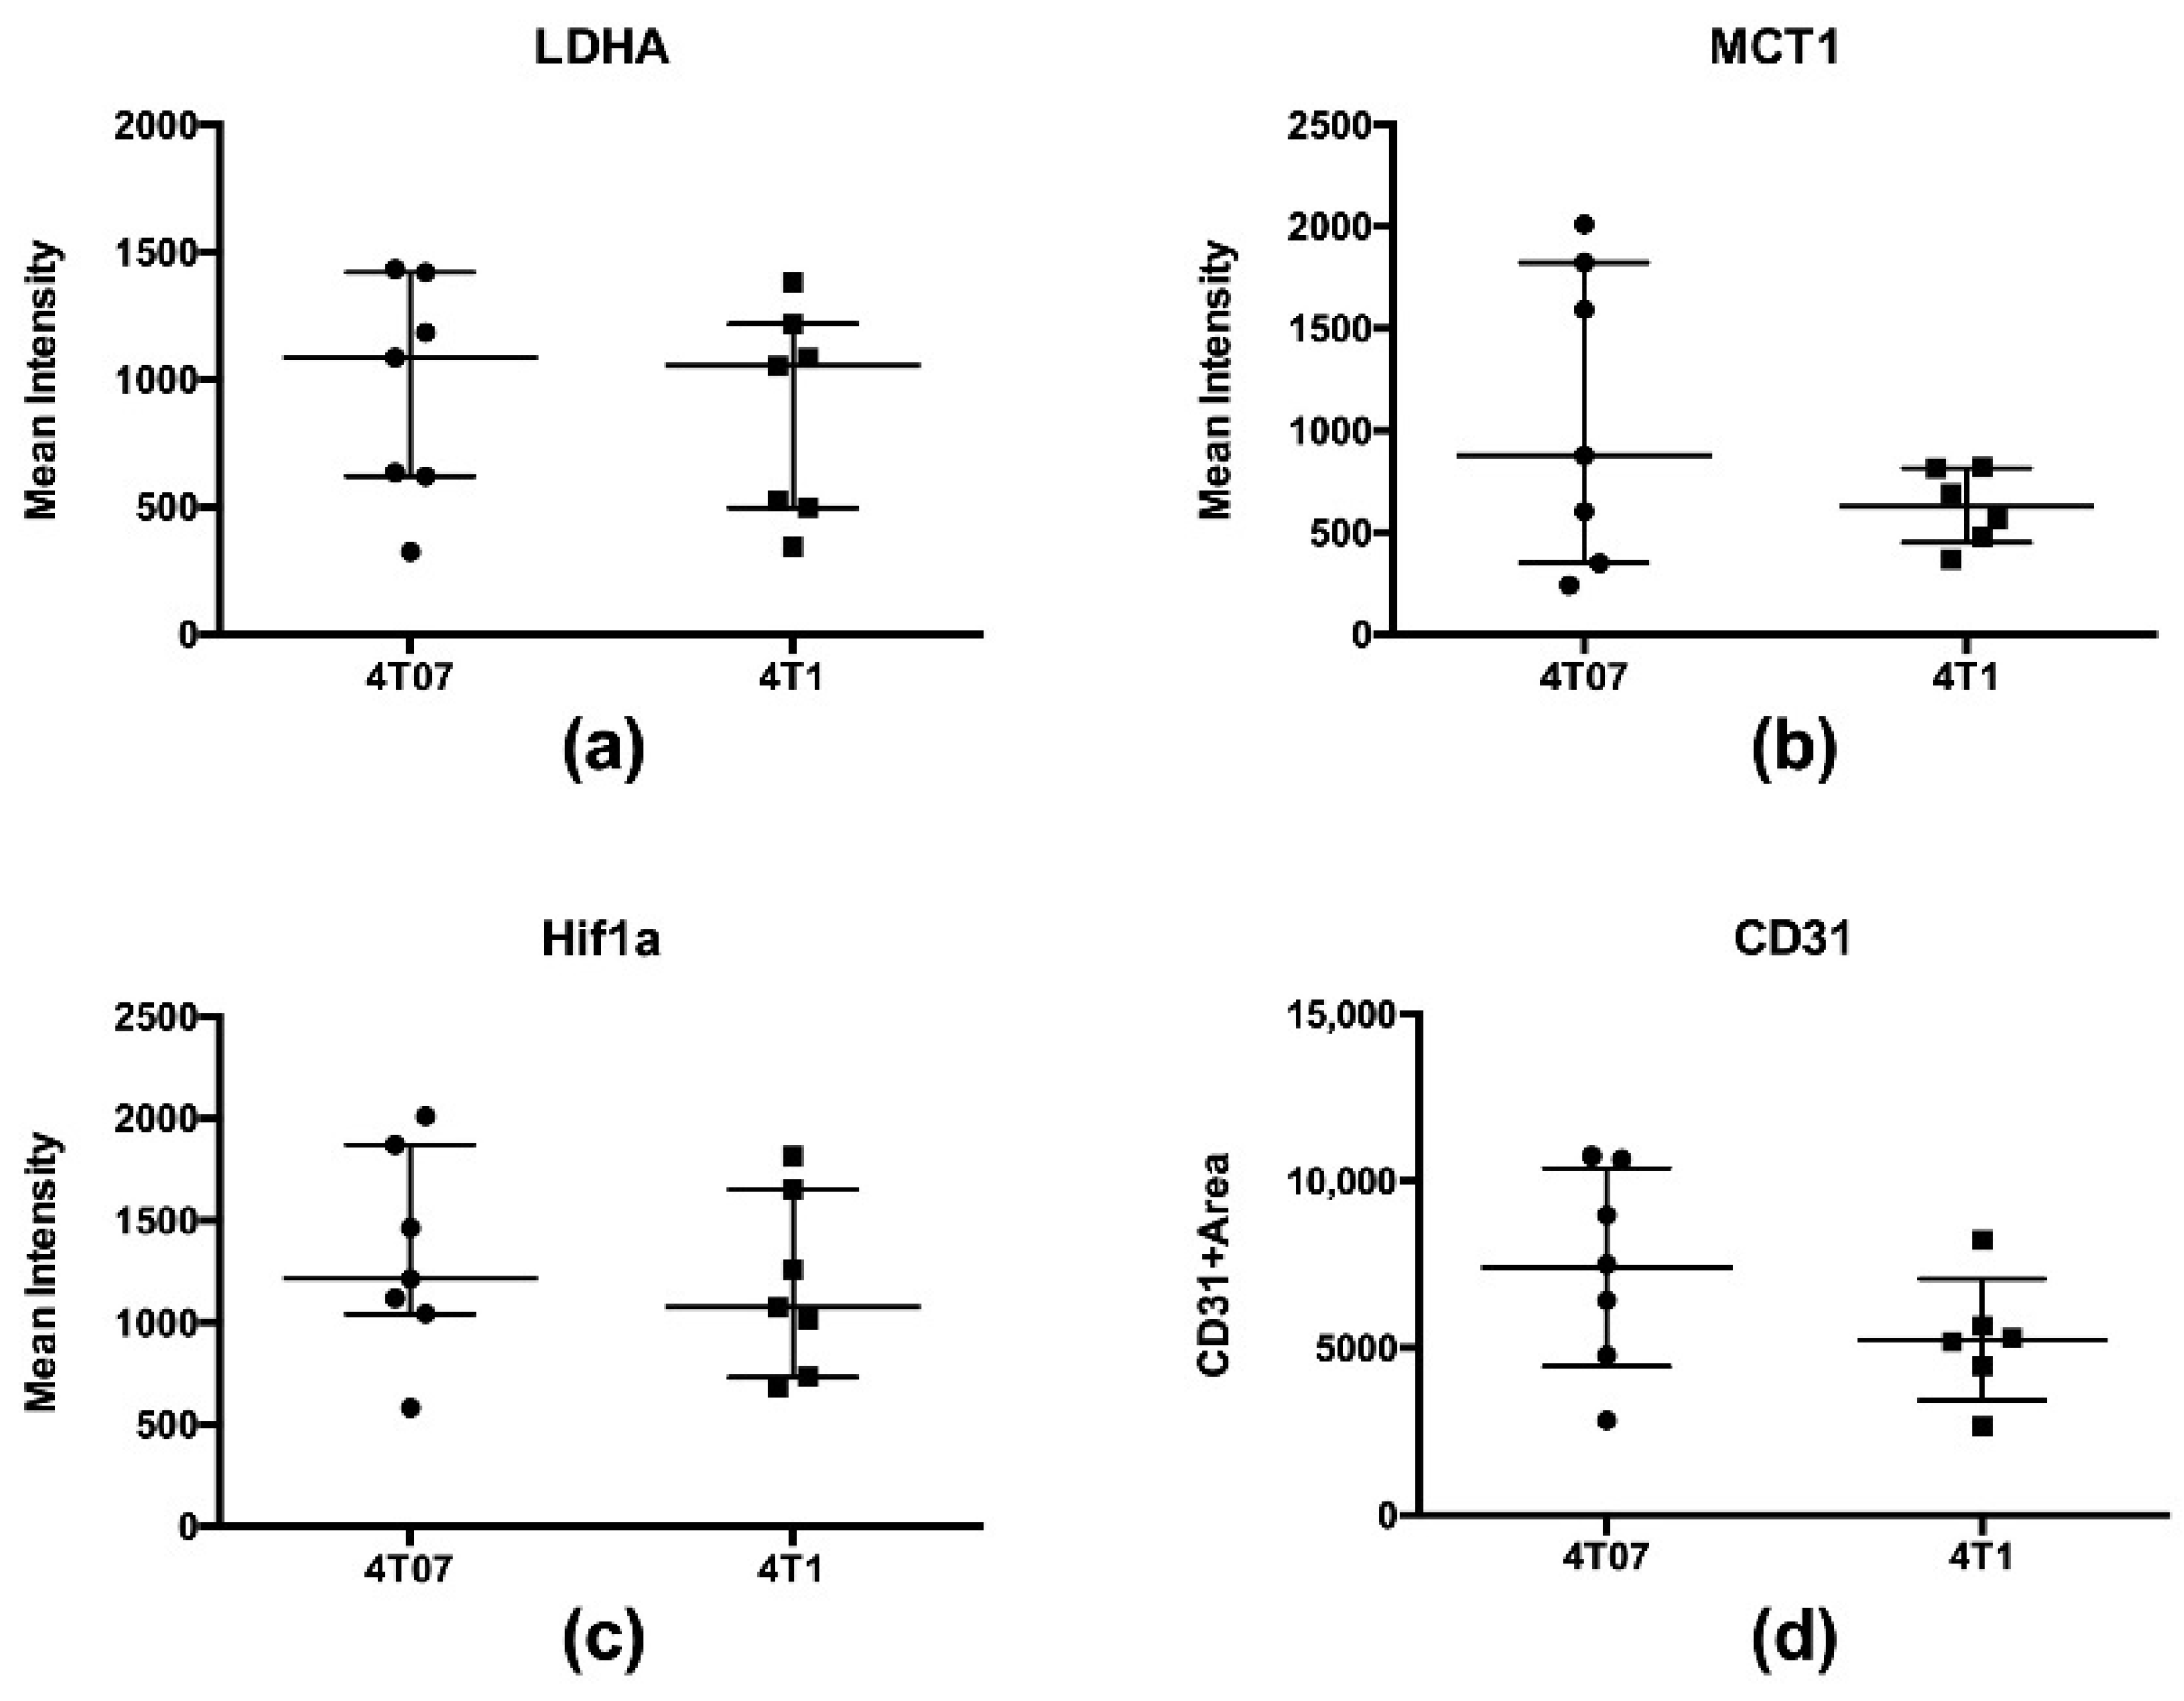
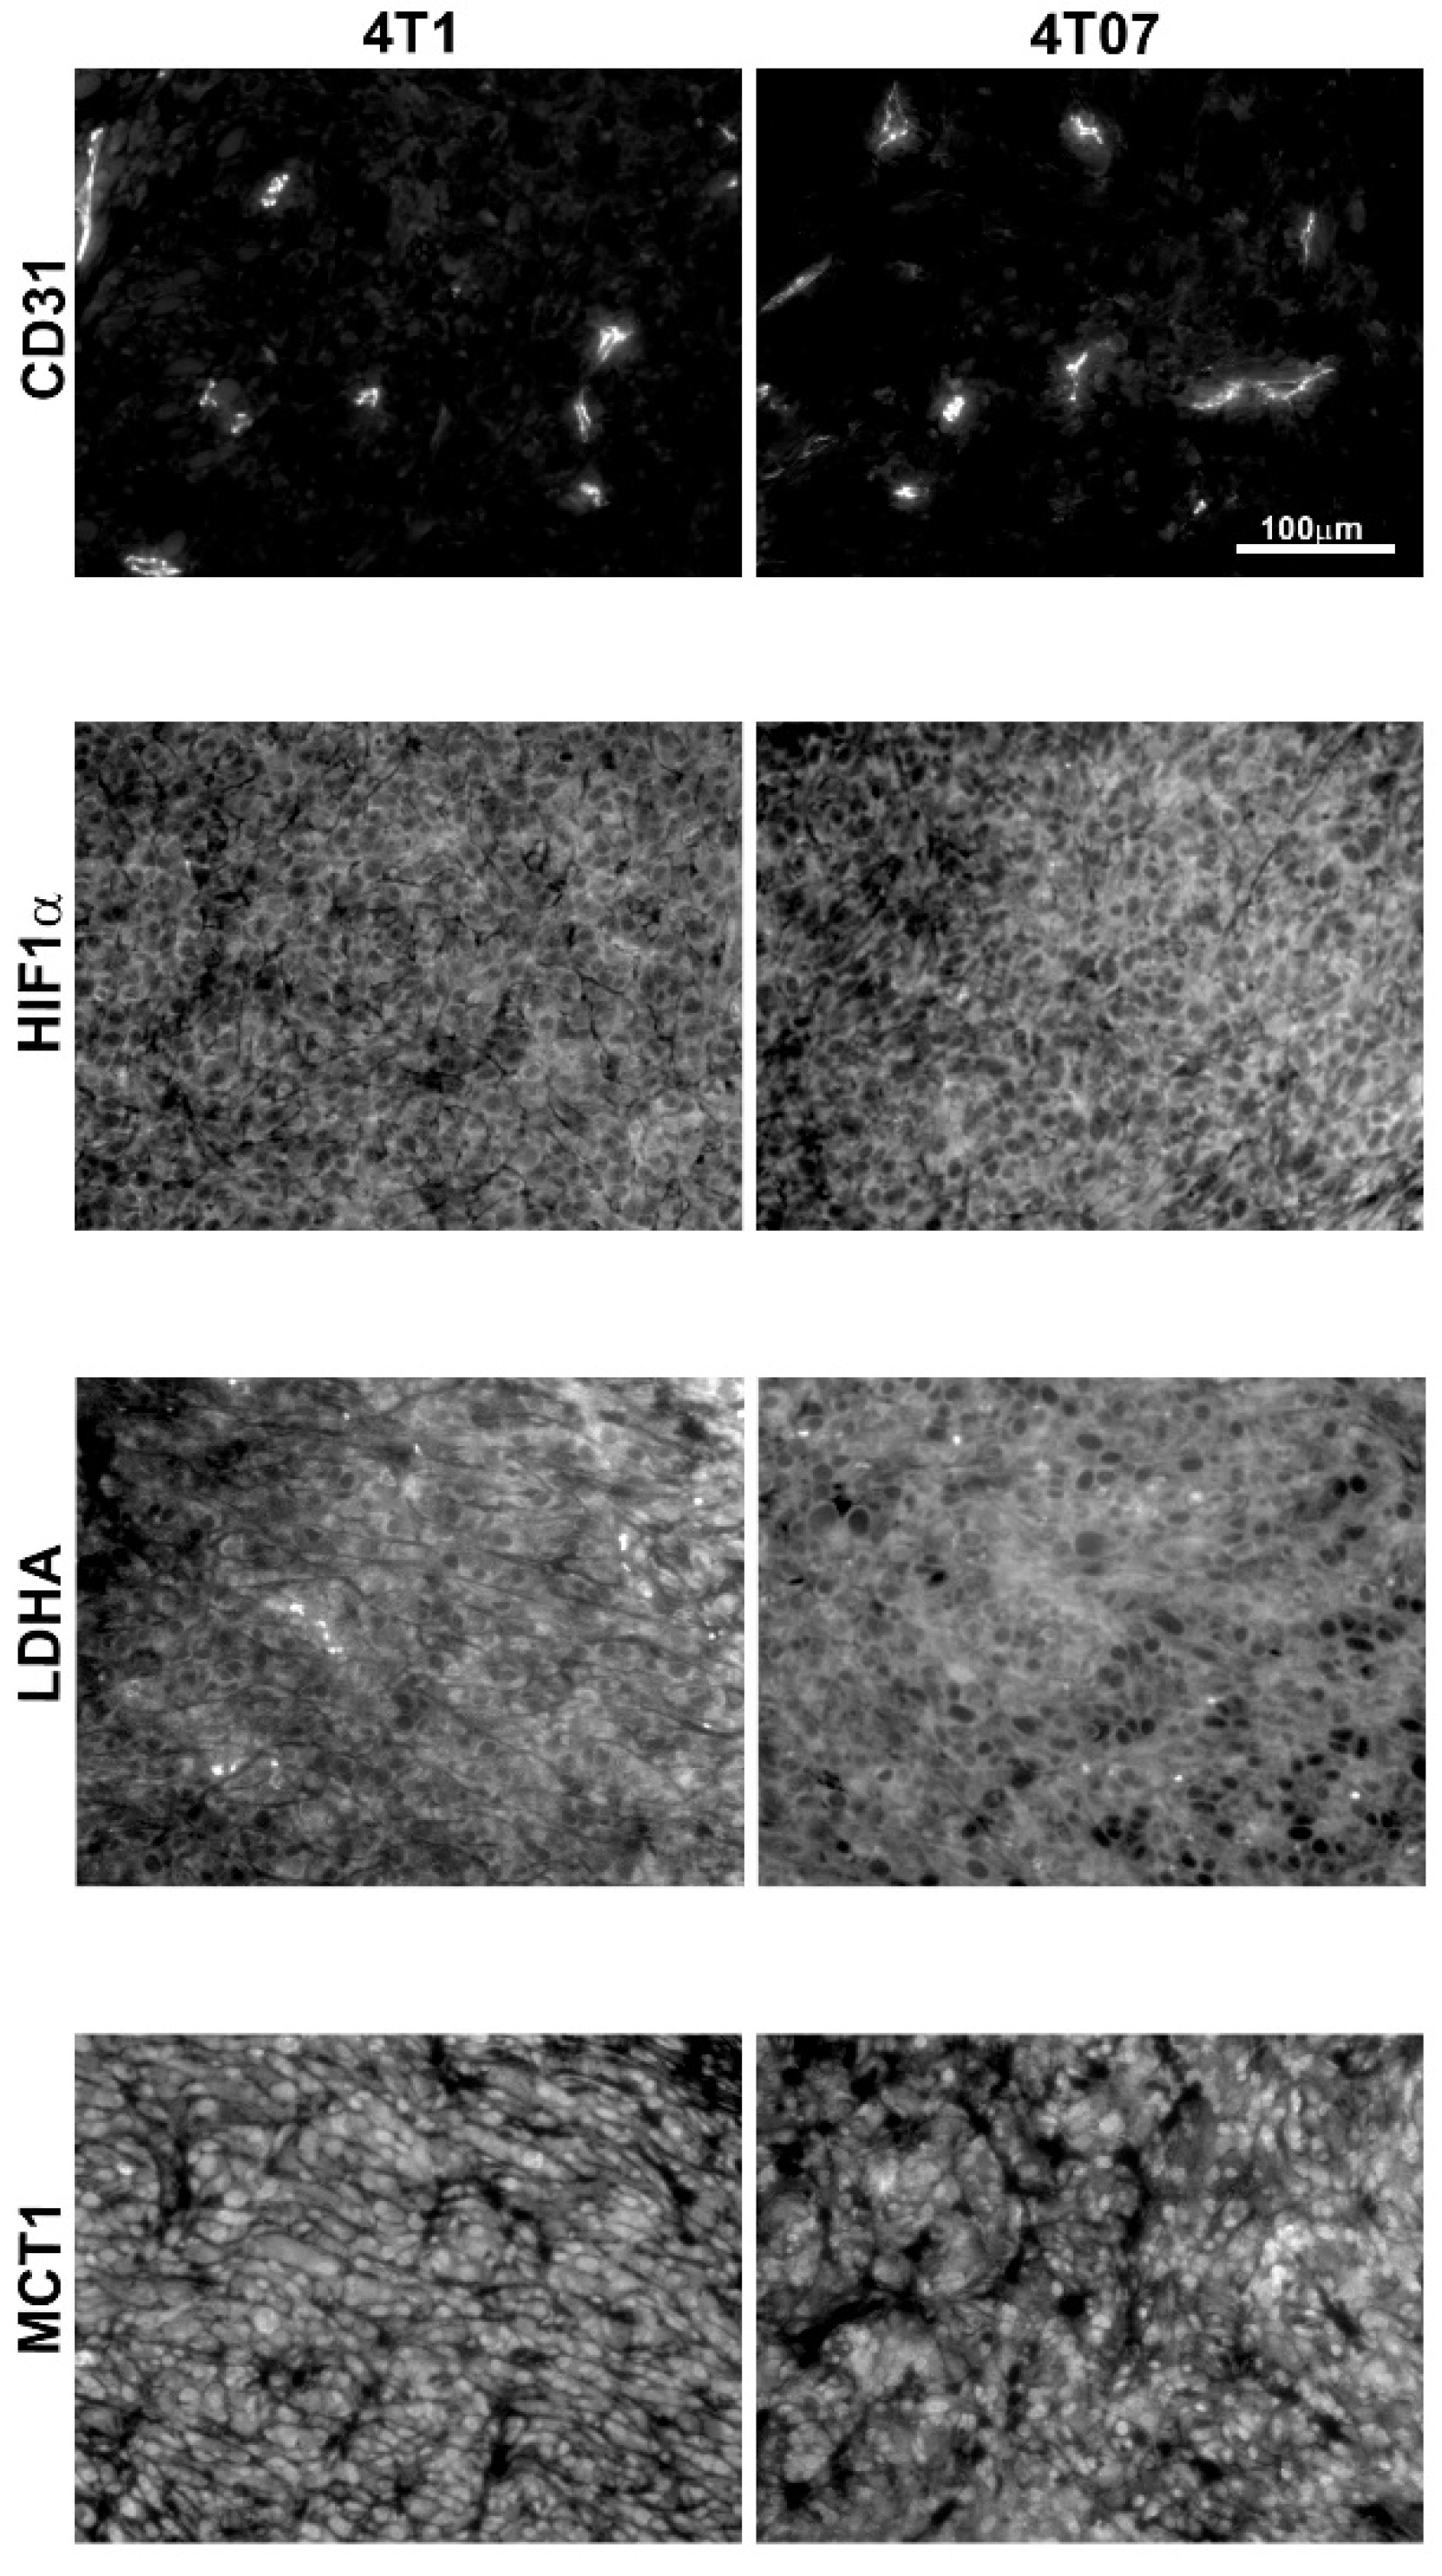
2.2. Immunohistochemistry and Biochemical Analysis
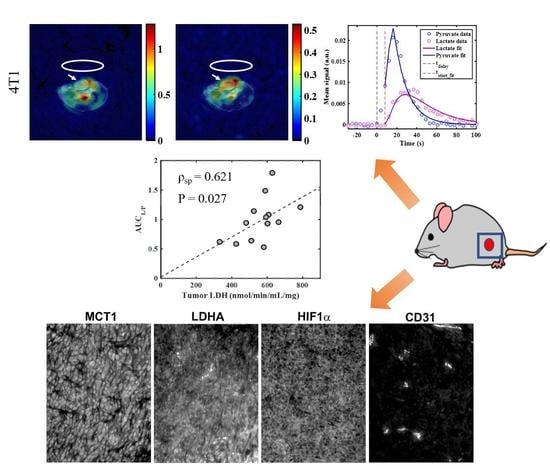
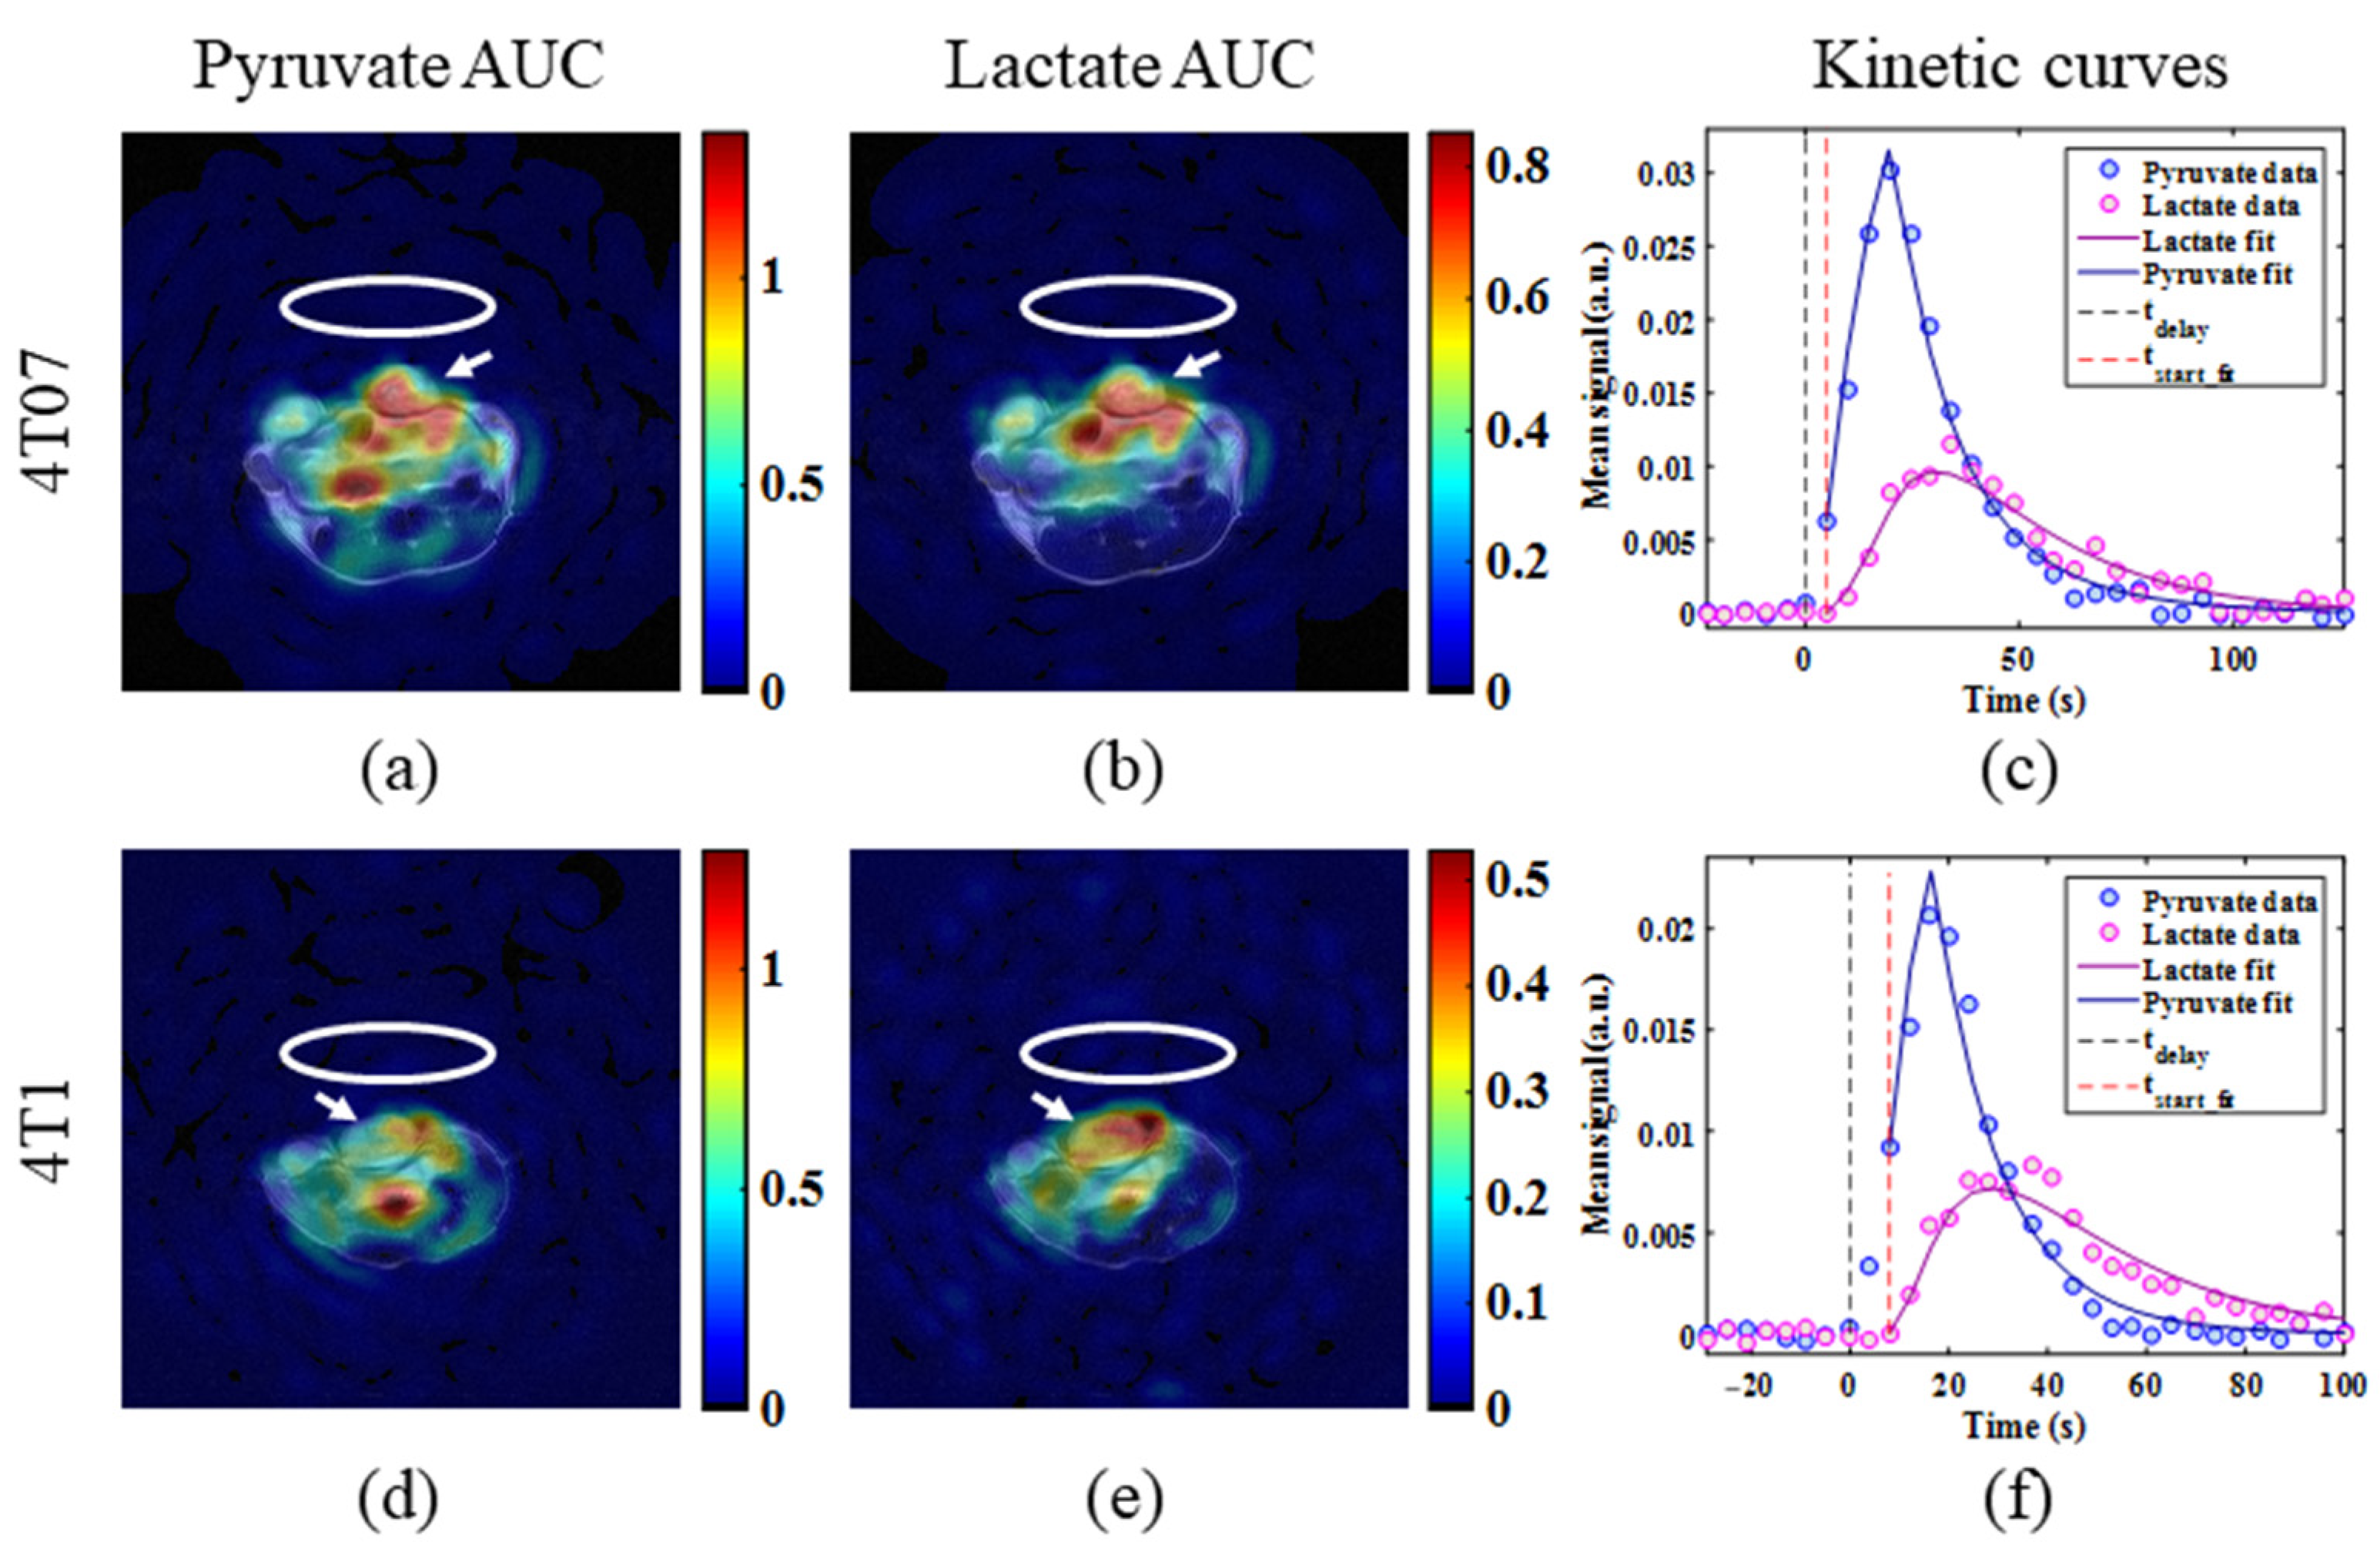
2.3. Metabolic Imaging
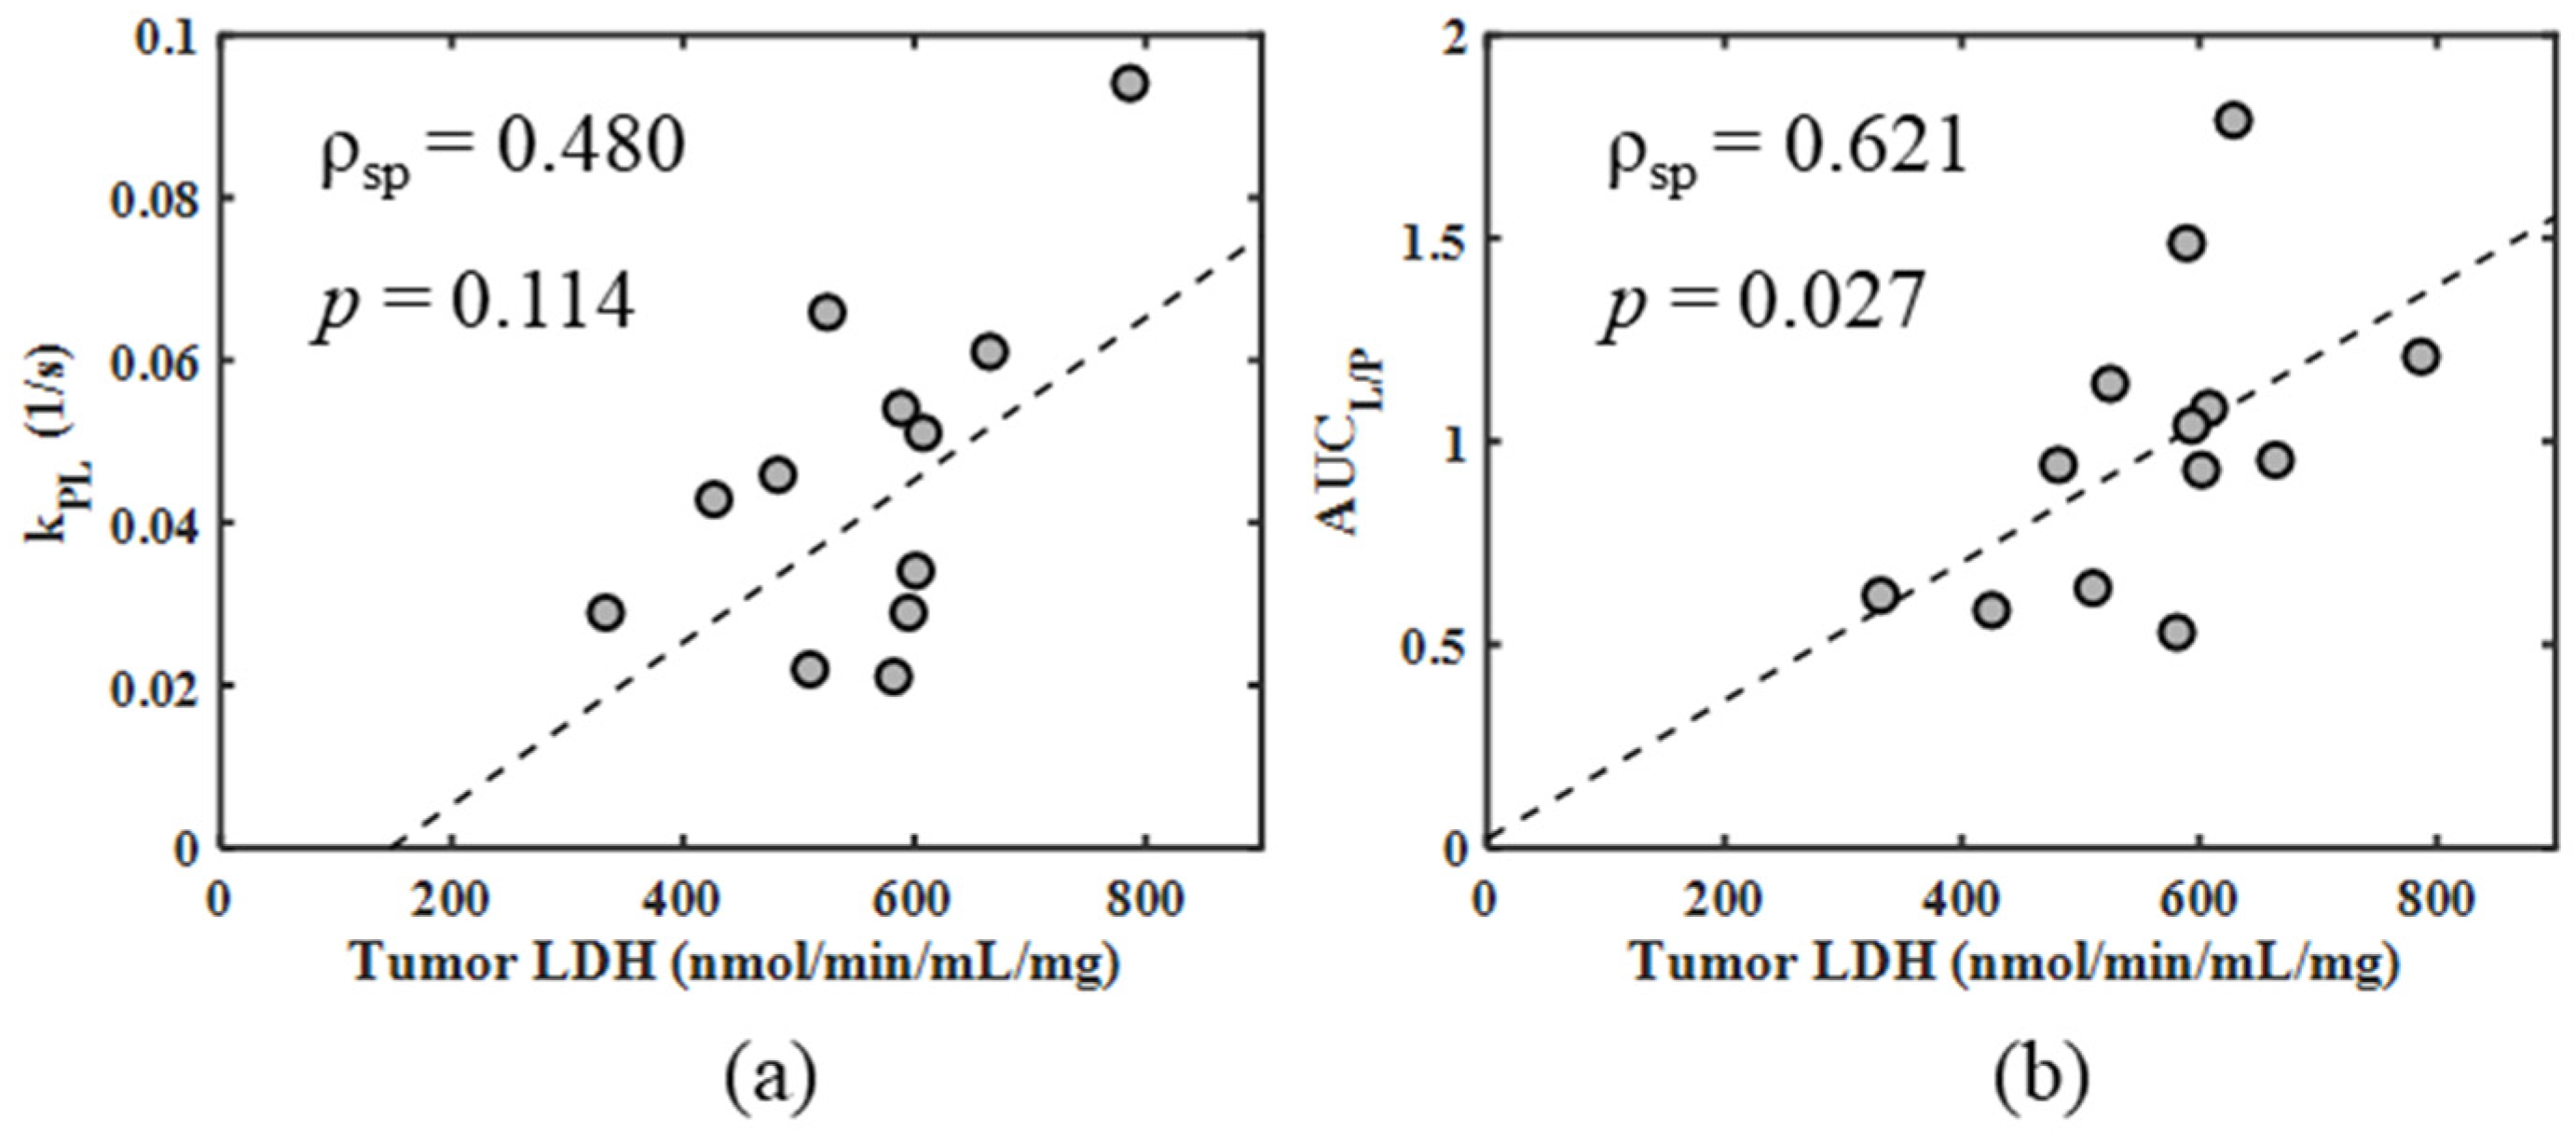
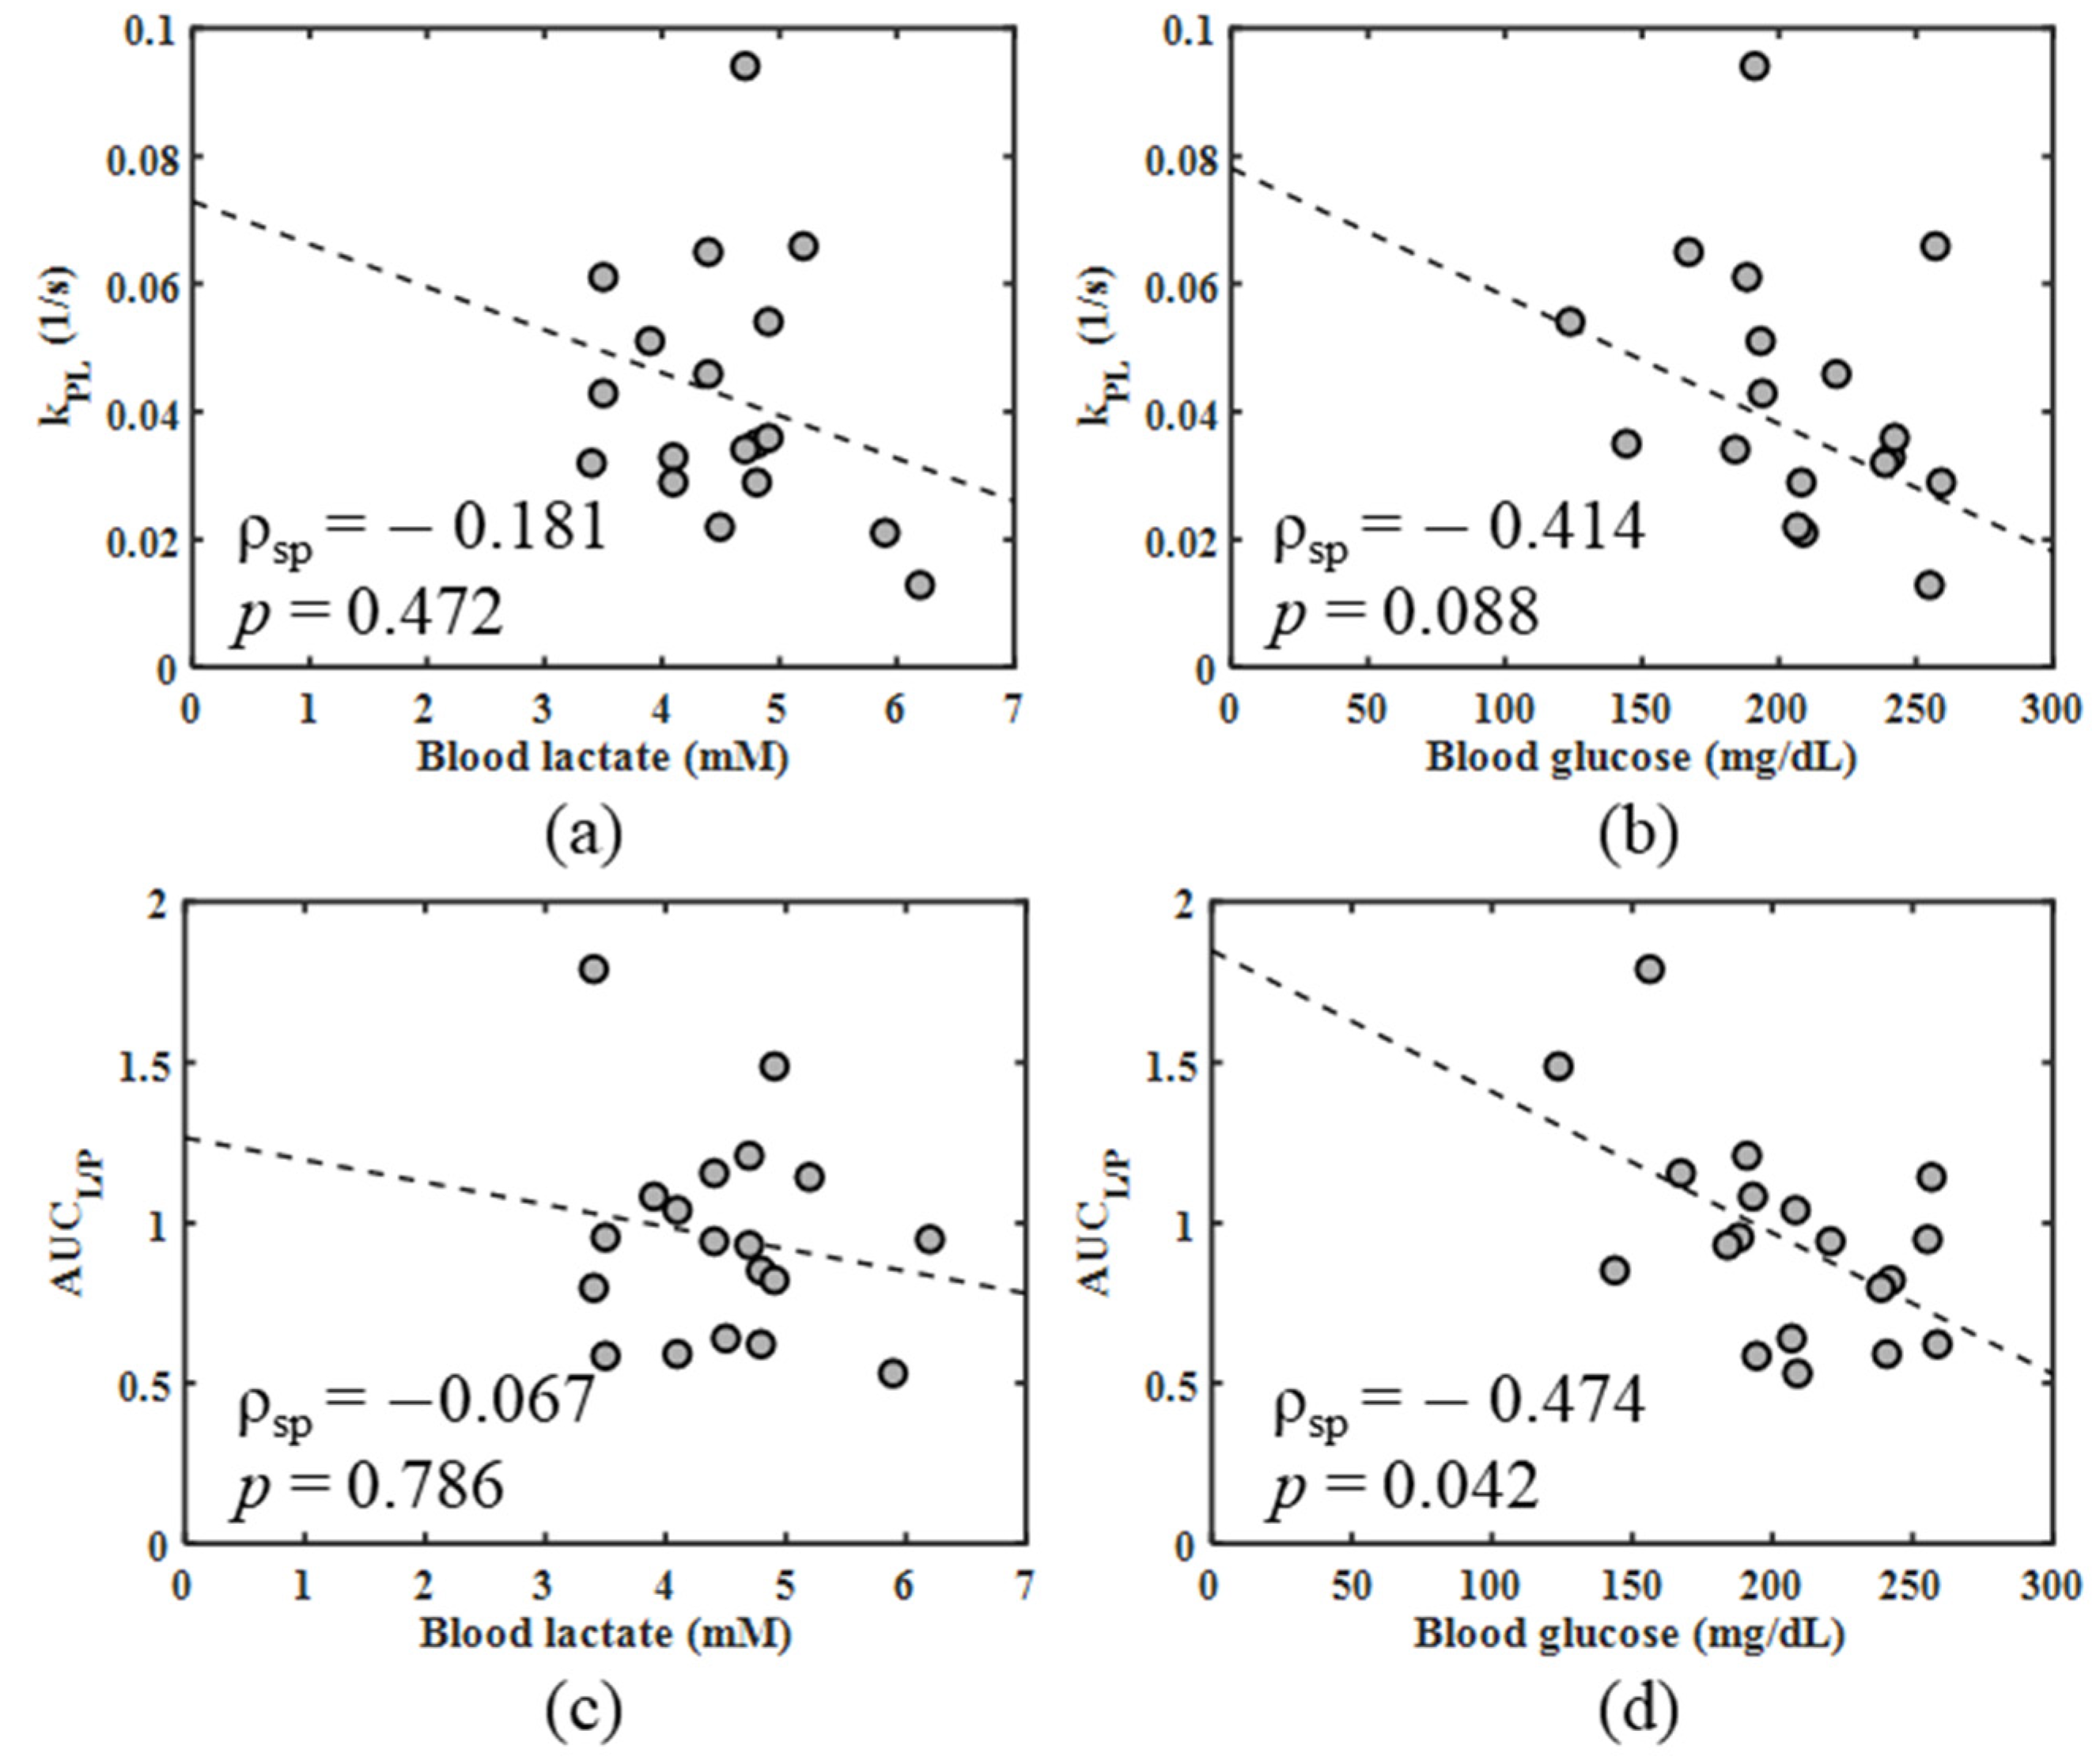
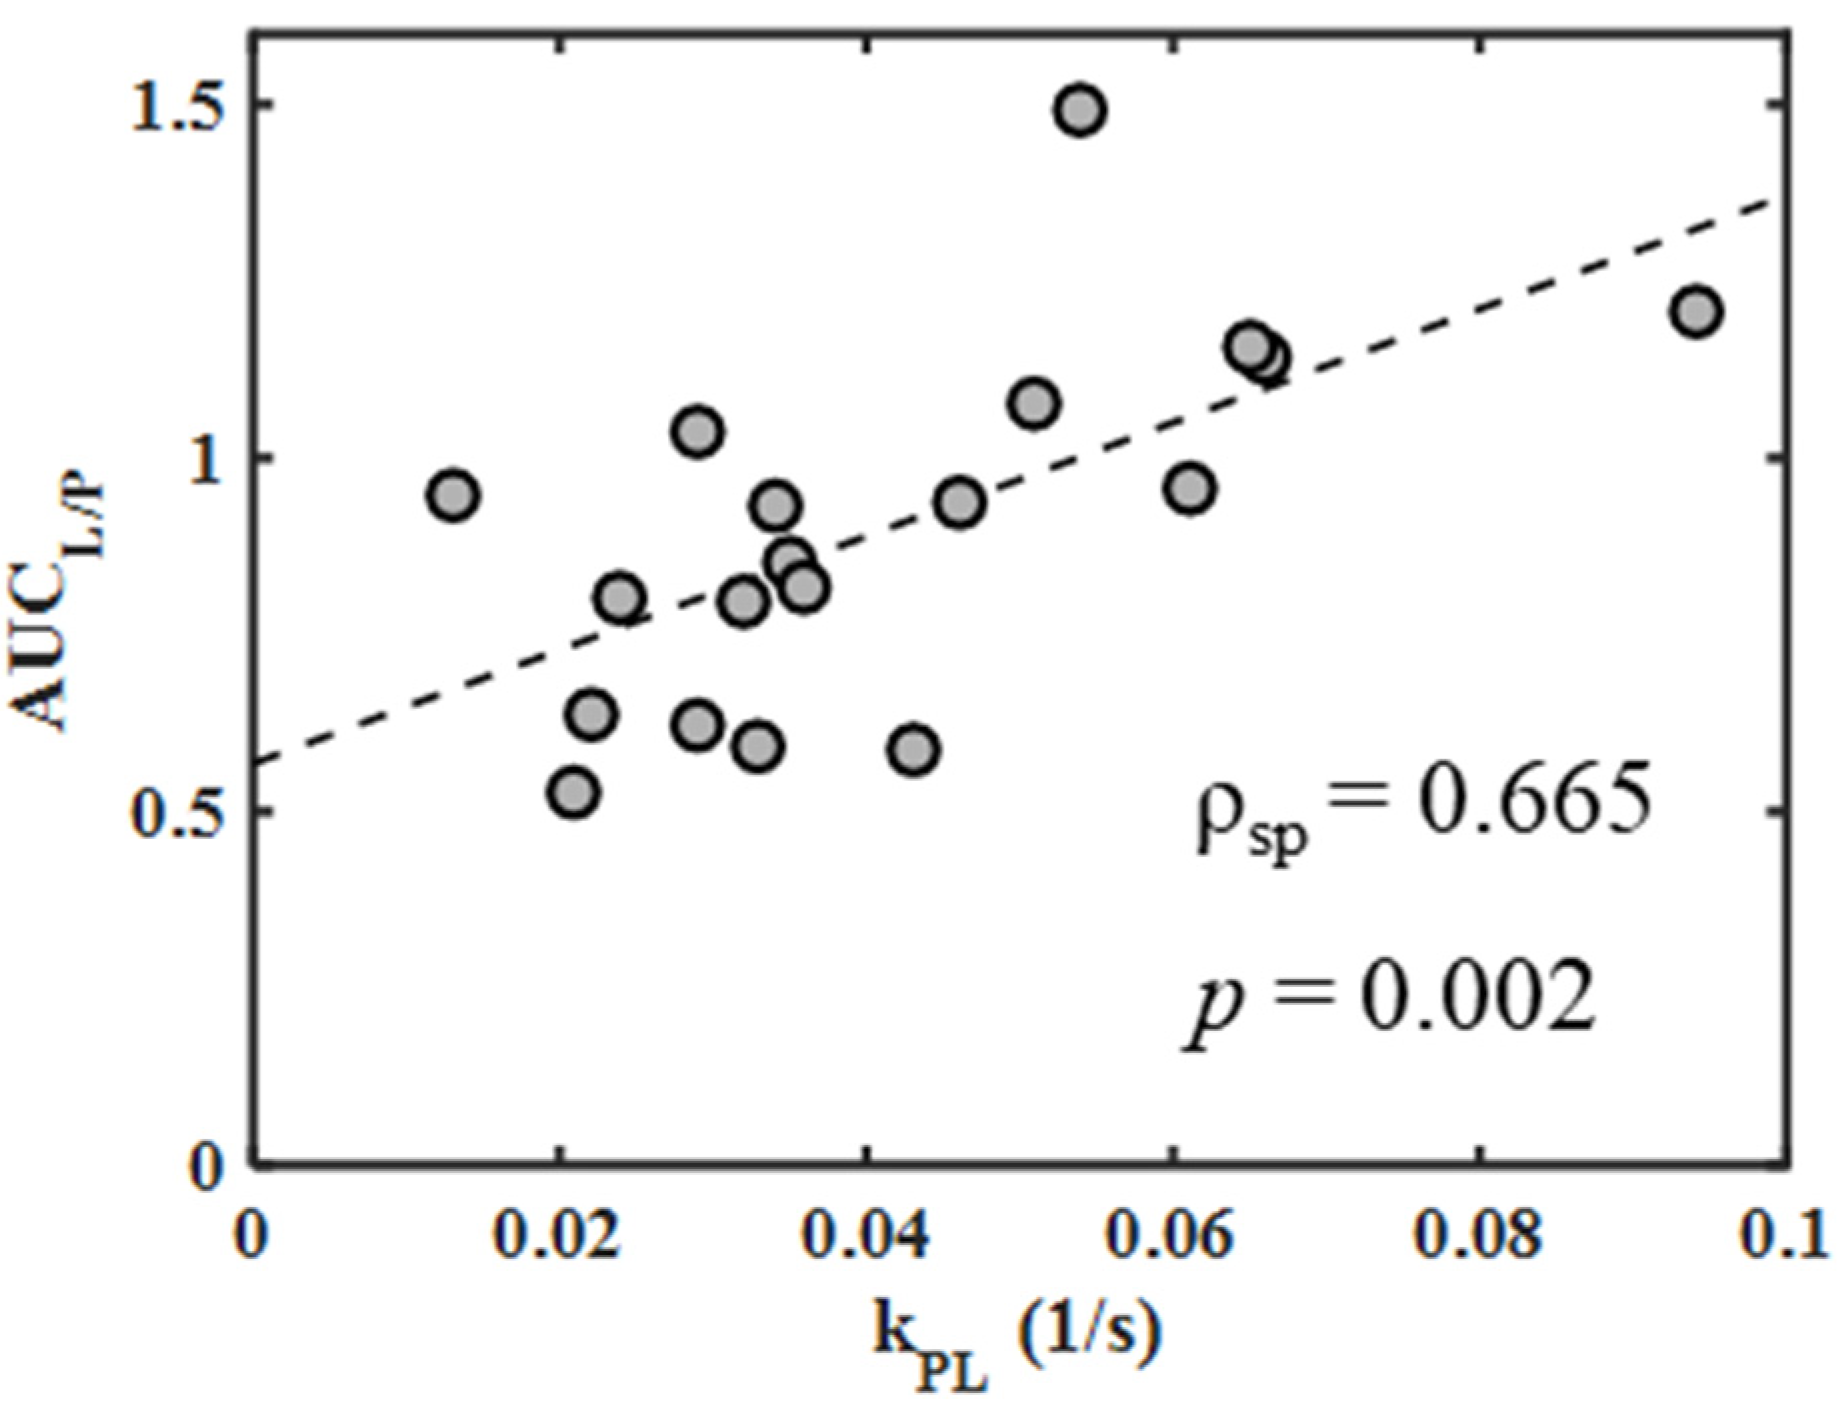
2.4. Correlations between Metabolic Measures
3. Discussion
4. Materials and Methods
4.1. Cell Culture
4.2. Animal Model and Handling
4.3. Biochemical and Immunohistochemical Analysis
4.4. Hyperpolarization
4.5. Image Acquisition
4.6. Image Reconstruction
4.7. Image Analysis
4.8. Statistical Analysis
5. Conclusions
Author Contributions
Funding
Institutional Review Board Statement
Informed Consent Statement
Data Availability Statement
Conflicts of Interest
Appendix A

Appendix B
Appendix B.1. Correlation of Imaging Measures of Metabolism

Appendix B.2. Repeatability of Metabolic Measures
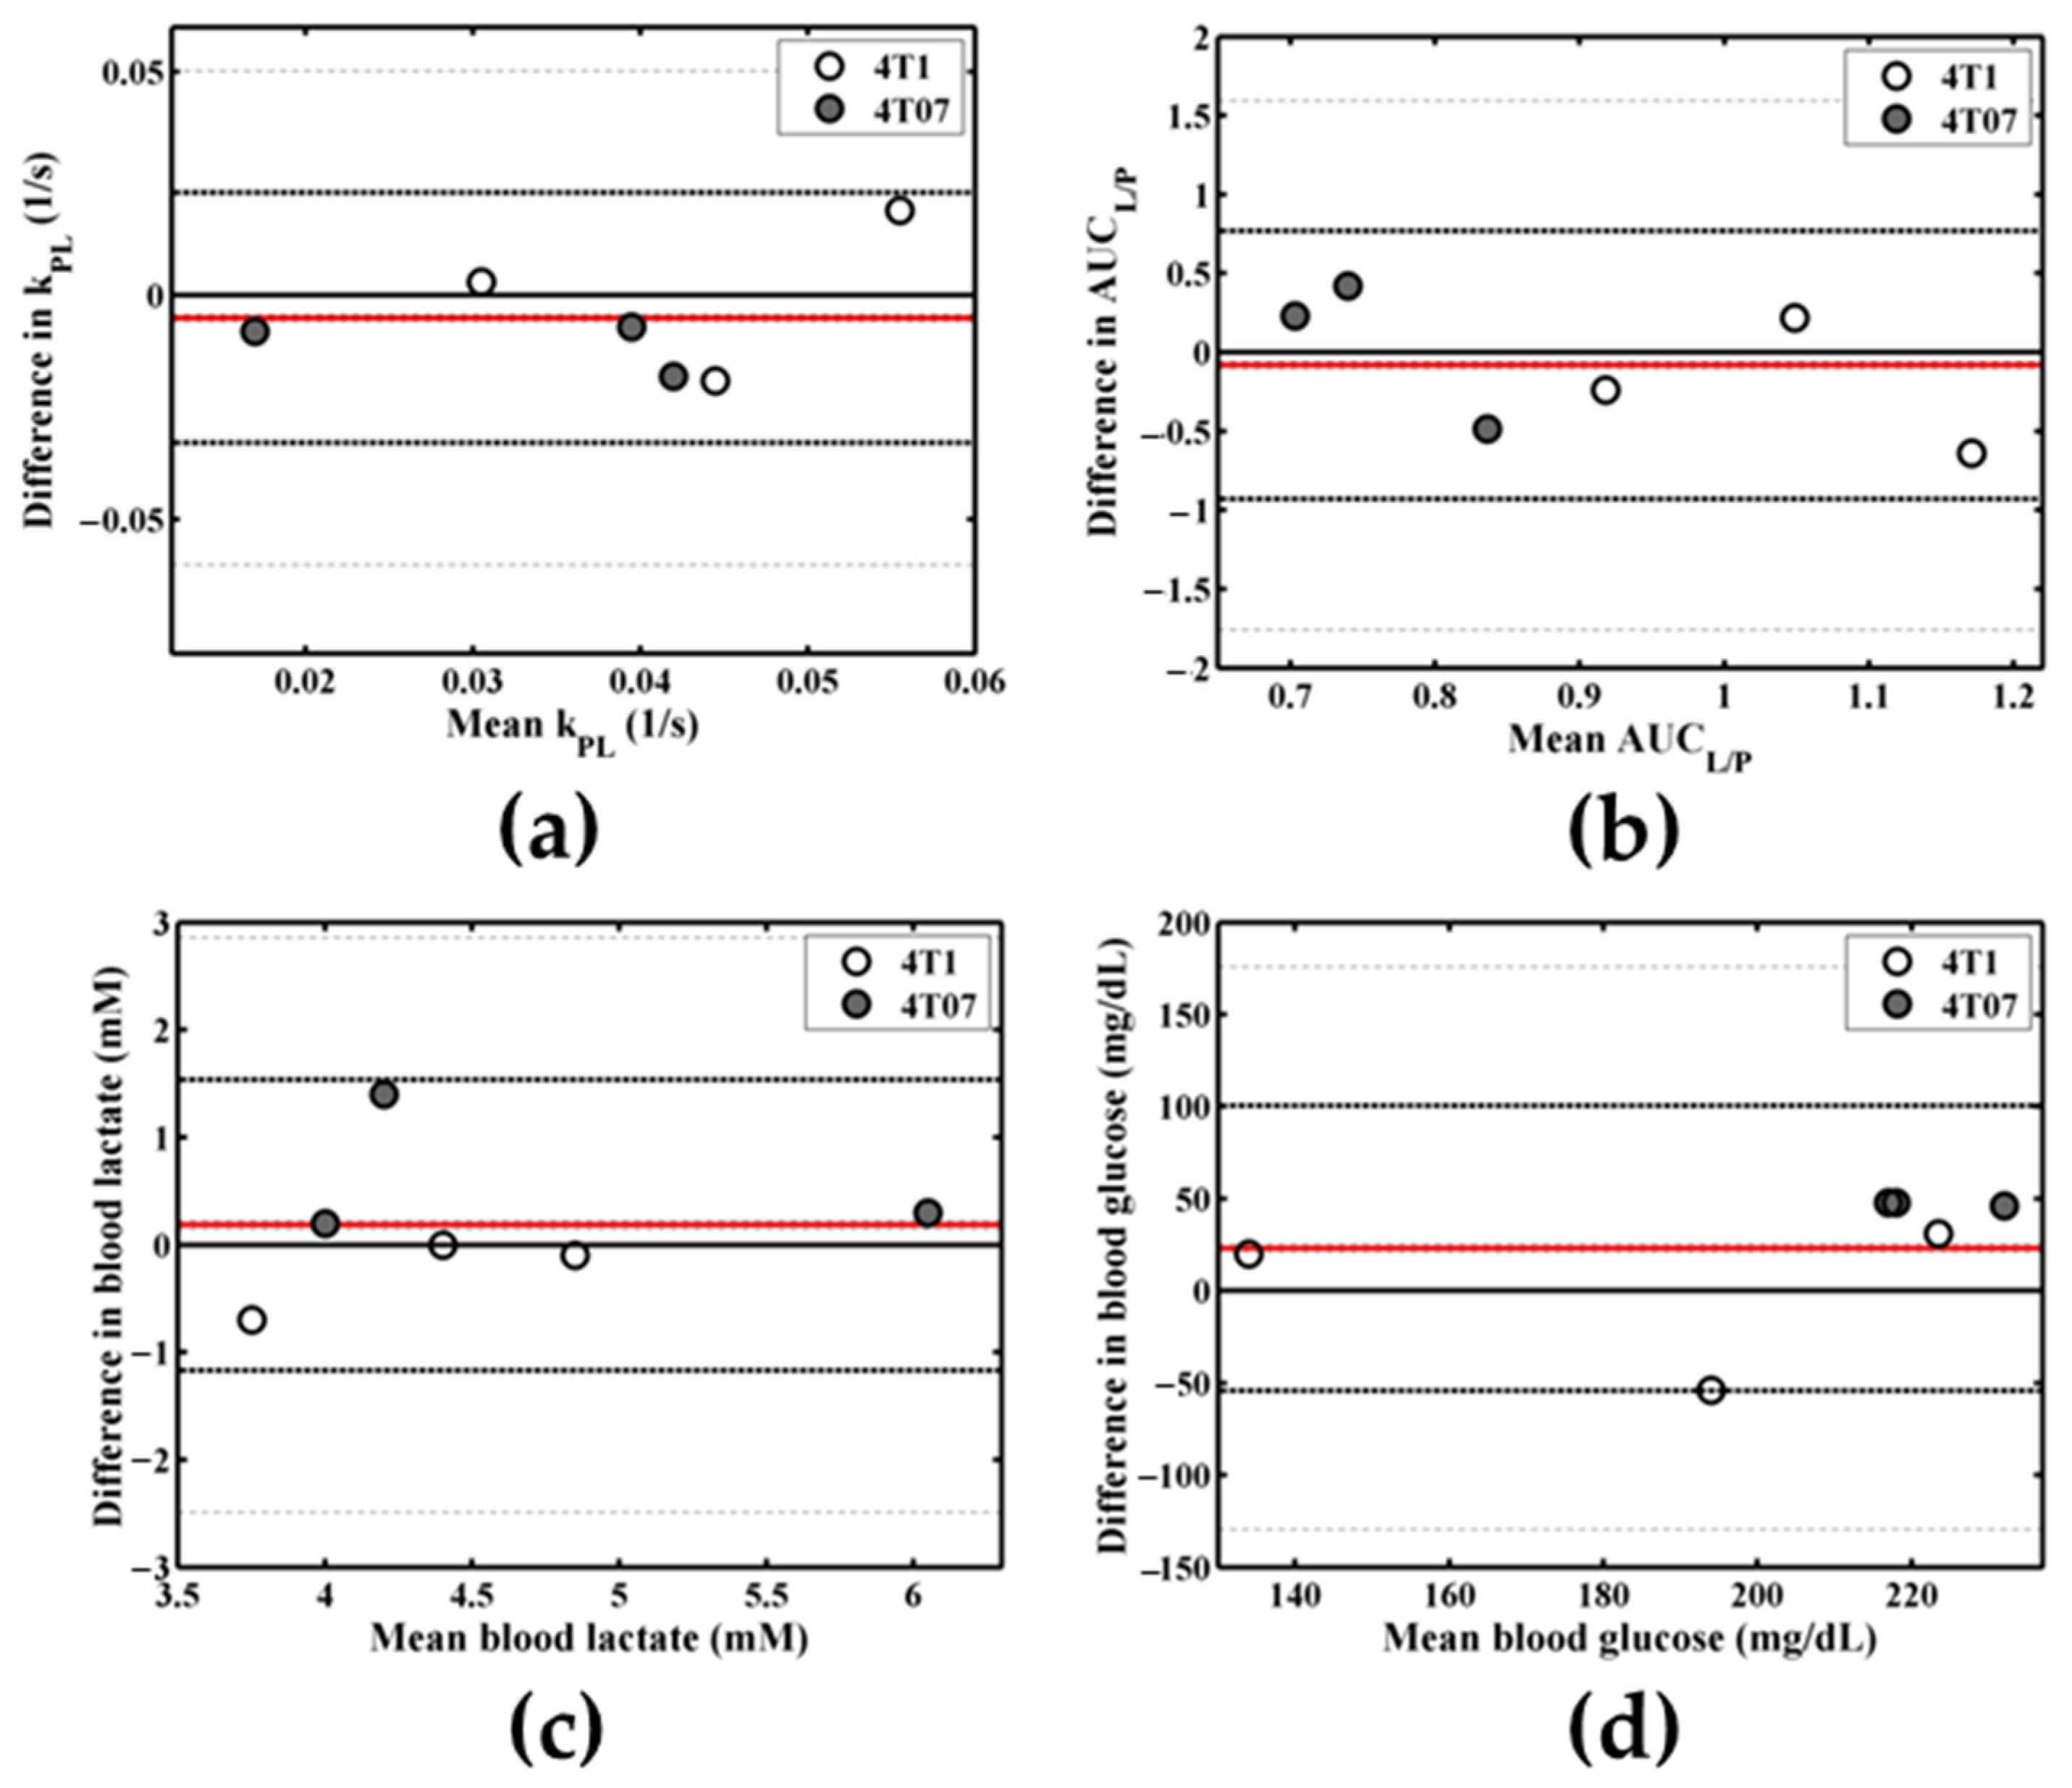
Appendix B.2.1. Methods
Appendix B.2.2. Results


| Metabolic Measure | Day 1 Mean ± SD | Day 2 Mean ± SD | p-Value | Lower LOA (95% CI) | Upper LOA (95% CI) | Bias | COV |
|---|---|---|---|---|---|---|---|
| kPL (1/s) | 0.036 ± 0.017 | 0.041 ± 0.013 | 0.43 | −0.03 (−0.06, −0.01) | 0.02 (0.00, 0.05) | −0.01 | 0.23 |
| AUCL/P | 0.86 ± 0.19 | 0.94 ± 0.35 | 0.66 | −0.93 (−1.76, −0.10) | 0.77 (−0.06, 1.59) | −0.08 | 0.29 |
| Blood lactate (mM) | 4.6 ± 0.9 | 4.5 ± 0.9 | 0.54 | −1.17 (−2.49, 0.15) | 1.54 (0.22, 2.86) | 0.18 | 0.08 |
| Blood glucose (mg/dL) | 215 ± 47 | 192 ± 35 | 0.21 | −54 (−129, 21) | 100 (25, 176) | 23 | 0.14 |
Appendix B.2.3. Discussion
References
- American Cancer Society. Global Cancer Facts & Figures, 3rd ed.; American Cancer Society: Atlanta, GA, USA, 2015. [Google Scholar]
- Linde, N.; Fluegen, G.; Aguirre-Ghiso, J.A. The relationship between dormant cancer cells and their microenvironment. Adv. Cancer Res. 2016, 132, 45–71. [Google Scholar] [PubMed] [Green Version]
- Hanahan, D.; Weinberg, R.A. Hallmarks of cancer: The next generation. Cell 2011, 144, 646–674. [Google Scholar] [CrossRef] [PubMed] [Green Version]
- Vander Heiden, M.G.; Cantley, L.C.; Thompson, C.B. Understanding the warburg effect: The metabolic requirements of cell proliferation. Science 2009, 324, 1029–1033. [Google Scholar] [CrossRef] [Green Version]
- Hirschhaeuser, F.; Sattler, U.G.; Mueller-Klieser, W. Lactate: A metabolic key player in cancer. Cancer Res. 2011, 71, 6921–6925. [Google Scholar] [CrossRef] [Green Version]
- Ardenkjaer-Larsen, J.H.; Fridlund, B.; Gram, A.; Hansson, G.; Hansson, L.; Lerche, M.H.; Servin, R.; Thaning, M.; Golman, K. Increase in signal-to-noise ratio of > 10,000 times in liquid-state nmr. Proc. Natl. Acad. Sci. USA 2003, 100, 10158–10163. [Google Scholar] [CrossRef] [PubMed] [Green Version]
- Day, S.E.; Kettunen, M.I.; Gallagher, F.A.; Hu, D.E.; Lerche, M.; Wolber, J.; Golman, K.; Ardenkjaer-Larsen, J.H.; Brindle, K.M. Detecting tumor response to treatment using hyperpolarized 13c magnetic resonance imaging and spectroscopy. Nat. Med. 2007, 13, 1382–1387. [Google Scholar] [CrossRef] [PubMed]
- Chen, A.P.; Albers, M.J.; Cunningham, C.H.; Kohler, S.J.; Yen, Y.F.; Hurd, R.E.; Tropp, J.; Bok, R.; Pauly, J.M.; Nelson, S.J.; et al. Hyperpolarized c-13 spectroscopic imaging of the tramp mouse at 3t—initial experience. Magn. Reson. Med. 2007, 58, 1099–1106. [Google Scholar] [CrossRef]
- Xu, H.N.; Kadlececk, S.; Profka, H.; Glickson, J.D.; Rizi, R.; Li, L.Z. Is higher lactate an indicator of tumor metastatic risk? A pilot mrs study using hyperpolarized 13c-pyruvate. Acad. Radiol. 2014, 21, 223–231. [Google Scholar] [CrossRef] [Green Version]
- Xu, H.N.; Kadlececk, S.; Pullinger, B.; Profka, H.; Cai, K.; Hariharan, H.; Rizi, R.; Li, L.Z. In vivo metabolic evaluation of breast tumor mouse xenografts for predicting aggressiveness using the hyperpolarized 13c-nmr technique. Adv. Exp. Med. Biol. 2013, 789, 237–242. [Google Scholar]
- Ward, C.S.; Venkatesh, H.S.; Chaumeil, M.M.; Brandes, A.H.; Vancriekinge, M.; Dafni, H.; Sukumar, S.; Nelson, S.J.; Vigneron, D.B.; Kurhanewicz, J.; et al. Noninvasive detection of target modulation following phosphatidylinositol 3-kinase inhibition using hyperpolarized 13c magnetic resonance spectroscopy. Cancer Res. 2010, 70, 1296–1305. [Google Scholar] [CrossRef] [PubMed] [Green Version]
- Shin, P.J.; Zhu, Z.; Camarda, R.; Bok, R.A.; Zhou, A.Y.; Kurhanewicz, J.; Goga, A.; Vigneron, D.B. Cancer recurrence monitoring using hyperpolarized [1-13c]pyruvate metabolic imaging in murine breast cancer model. Magn. Reson. Imaging 2017, 43, 105–109. [Google Scholar] [CrossRef]
- Granlund, K.L.; Morris, E.A.; Vargas, H.A.; Lyashchenko, S.K.; DeNoble, P.J.; Sacchini, V.A.; Sosa, R.A.; Kennedy, M.A.; Nicholson, D.; Guo, Y.; et al. First-in-Woman Study of in Vivo Breast Cancer Metabolism Using Hyperpolarized [1-13c] Pyruvate. In Proceedings of the 24th Annual Meeting of ISMRM, Singapore, 7–13 May 2016. [Google Scholar]
- Harper, K.L.; Sosa, M.S.; Entenberg, D.; Hosseini, H.; Cheung, J.F.; Nobre, R.; Avivar-Valderas, A.; Nagi, C.; Girnius, N.; Davis, R.J.; et al. Mechanism of early dissemination and metastasis in her2. Nature 2016, 540, 588–592. [Google Scholar] [CrossRef]
- Morris, B.A.; Burkel, B.; Ponik, S.M.; Fan, J.; Condeelis, J.S.; Aguirre-Ghiso, J.A.; Castracane, J.; Denu, J.M.; Keely, P.J. Collagen matrix density drives the metabolic shift in breast cancer cells. EBioMedicine 2016, 13, 146–156. [Google Scholar] [CrossRef] [PubMed] [Green Version]
- Hill, D.K.; Orton, M.R.; Mariotti, E.; Boult, J.K.; Panek, R.; Jafar, M.; Parkes, H.G.; Jamin, Y.; Miniotis, M.F.; Al-Saffar, N.M.; et al. Model free approach to kinetic analysis of real-time hyperpolarized 13c magnetic resonance spectroscopy data. PLoS ONE 2013, 8, e71996. [Google Scholar] [CrossRef] [PubMed]
- Bonuccelli, G.; Tsirigos, A.; Whitaker-Menezes, D.; Pavlides, S.; Pestell, R.G.; Chiavarina, B.; Frank, P.G.; Flomenberg, N.; Howell, A.; Martinez-Outschoorn, U.E.; et al. Ketones and lactate “Fuel” Tumor growth and metastasis: Evidence that epithelial cancer cells use oxidative mitochondrial metabolism. Cell Cycle (Georget. Tex.) 2010, 9, 3506–3514. [Google Scholar] [CrossRef]
- DeBerardinis, R.J.; Chandel, N.S. Fundamentals of cancer metabolism. Sci. Adv. 2016, 2, e1600200. [Google Scholar] [CrossRef] [Green Version]
- Gallagher, F.A.; Woitek, R.; McLean, M.A.; Gill, A.B.; Manzano Garcia, R.; Provenzano, E.; Riemer, F.; Kaggie, J.; Chhabra, A.; Ursprung, S.; et al. Imaging breast cancer using hyperpolarized carbon-13 mri. Proc. Natl. Acad. Sci. USA 2020, 117, 2092–2098. [Google Scholar] [CrossRef] [Green Version]
- Lau, J.Y.; Chen, A.P.; Gu, Y.P.; Cunningham, C.H. Voxel-by-voxel correlations of perfusion, substrate, and metabolite signals in dynamic hyperpolarized 13c imaging. NMR Biomed. 2016, 29, 1038–1047. [Google Scholar] [CrossRef]
- Kettunen, M.I.; Hu, D.E.; Witney, T.H.; McLaughlin, R.; Gallagher, F.A.; Bohndiek, S.E.; Day, S.E.; Brindle, K.M. Magnetization transfer measurements of exchange between hyperpolarized [1-13c]pyruvate and [1-13c]lactate in a murine lymphoma. Magn. Reson. Med. 2010, 63, 872–880. [Google Scholar] [CrossRef] [PubMed]
- Fan, J.; Hitosugi, T.; Chung, T.W.; Xie, J.; Ge, Q.; Gu, T.L.; Polakiewicz, R.D.; Chen, G.Z.; Boggon, T.J.; Lonial, S.; et al. Tyrosine phosphorylation of lactate dehydrogenase a is important for nadh/nad(+) redox homeostasis in cancer cells. Mol. Cell Biol. 2011, 31, 4938–4950. [Google Scholar] [CrossRef] [Green Version]
- Frees, A.E.; Rajaram, N.; McCachren, S.S., III; Fontanella, A.N.; Dewhirst, M.W.; Ramanujam, N. Delivery-corrected imaging of fluorescently-labeled glucose reveals distinct metabolic phenotypes in murine breast cancer. PLoS ONE 2014, 9, e115529. [Google Scholar] [CrossRef]
- Harris, T.; Eliyahu, G.; Frydman, L.; Degani, H. Kinetics of hyperpolarized 13c1-pyruvate transport and metabolism in living human breast cancer cells. Proc. Natl. Acad. Sci. USA 2009, 106, 18131–18136. [Google Scholar] [CrossRef] [Green Version]
- Daniels, C.J.; McLean, M.A.; Schulte, R.F.; Robb, F.J.; Gill, A.B.; McGlashan, N.; Graves, M.J.; Schwaiger, M.; Lomas, D.J.; Brindle, K.M.; et al. A comparison of quantitative methods for clinical imaging with hyperpolarized 13c-pyruvate. NMR Biomed. 2016, 29, 387–399. [Google Scholar] [CrossRef] [Green Version]
- Gupta, S.; Roy, A.; Dwarakanath, B.S. Metabolic cooperation and competition in the tumor microenvironment: Implications for therapy. Front. Oncol. 2017, 7, 68. [Google Scholar] [CrossRef] [Green Version]
- Sotgia, F.; Martinez-Outschoorn, U.E.; Pavlides, S.; Howell, A.; Pestell, R.G.; Lisanti, M.P. Understanding the warburg effect and the prognostic value of stromal caveolin-1 as a marker of a lethal tumor microenvironment. Breast Cancer Res. BCR 2011, 13, 213. [Google Scholar] [CrossRef] [Green Version]
- Xu, H.N.; Nioka, S.; Glickson, J.D.; Chance, B.; Li, L.Z. Quantitative mitochondrial redox imaging of breast cancer metastatic potential. J. Biomed. Opt. 2010, 15, 036010. [Google Scholar] [CrossRef] [Green Version]
- Chen, A.P.; Hurd, R.E.; Schroeder, M.A.; Lau, A.Z.; Gu, Y.P.; Lam, W.W.; Barry, J.; Tropp, J.; Cunningham, C.H. Simultaneous investigation of cardiac pyruvate dehydrogenase flux, krebs cycle metabolism and ph, using hyperpolarized [1,2-13c2]pyruvate in vivo. NMR Biomed. 2012, 25, 305–311. [Google Scholar] [CrossRef] [PubMed] [Green Version]
- Hu, S.; Yoshihara, H.A.; Bok, R.; Zhou, J.; Zhu, M.; Kurhanewicz, J.; Vigneron, D.B. Use of hyperpolarized [1-13C]pyruvate and [2-13C]pyruvate to probe the effects of the anticancer agent dichloroacetate on mitochondrial metabolism in vivo in the normal rat. Magn. Reson. Imaging 2012, 30, 1367–1372. [Google Scholar] [CrossRef] [PubMed] [Green Version]
- Qu, W.; Zha, Z.; Lieberman, B.P.; Mancuso, A.; Stetz, M.; Rizzi, R.; Ploessl, K.; Wise, D.; Thompson, C.; Kung, H.F. Facile synthesis [5-13C-4-2H2]-l-glutamine for hyperpolarized mrs imaging of cancer cell metabolism. Acad. Radiol. 2011, 18, 932–939. [Google Scholar] [CrossRef]
- Hou, Y.; Zhou, M.; Xie, J.; Chao, P.; Feng, Q.; Wu, J. High glucose levels promote the proliferation of breast cancer cells through gtpases. Breast Cancer (Dove Med. Press) 2017, 9, 429–436. [Google Scholar] [CrossRef] [PubMed] [Green Version]
- Haseen, S.D.; Khanam, A.; Sultan, N.; Idrees, F.; Akhtar, N.; Imtiaz, F. Elevated fasting blood glucose is associated with increased risk of breast cancer: Outcome of case-control study conducted in karachi, pakistan. Asian Pac. J. Cancer Prev. APJCP 2015, 16, 675–678. [Google Scholar] [CrossRef] [Green Version]
- Shapot, V.S.; Blinov, V.A. Blood glucose levels and gluconeogenesis in animals bearing transplantable tumors. Cancer Res. 1974, 34, 1827–1832. [Google Scholar]
- Svaninger, G.; Drott, C.; Lundholm, K. Role of insulin in development of cancer cachexia in nongrowing sarcoma-bearing mice: Special reference to muscle wasting. J. Natl. Cancer Inst. 1987, 78, 943–950. [Google Scholar]
- Serrao, E.M.; Rodrigues, T.B.; Gallagher, F.A.; Kettunen, M.I.; Kennedy, B.W.C.; Vowler, S.L.; Burling, K.A.; Brindle, K.M. Effects of fasting on serial measurements of hyperpolarized [1-13c]pyruvate metabolism in tumors. NMR Biomed. 2016, 29, 1048–1055. [Google Scholar] [CrossRef] [Green Version]
- Faustino-Rocha, A.; Oliveira, P.A.; Pinho-Oliveira, J.; Teixeira-Guedes, C.; Soares-Maia, R.; da Costa, R.G.; Colaco, B.; Pires, M.J.; Colaco, J.; Ferreira, R.; et al. Estimation of rat mammary tumor volume using caliper and ultrasonography measurements. Lab Anim. 2013, 42, 217–224. [Google Scholar] [CrossRef]
- Esbona, K.; Inman, D.; Saha, S.; Jeffery, J.; Schedin, P.; Wilke, L.; Keely, P. Cox-2 modulates mammary tumor progression in response to collagen density. Breast Cancer Res. 2016, 18, 35. [Google Scholar] [CrossRef] [Green Version]
- Hernando, D.; Kellman, P.; Haldar, J.P.; Liang, Z.P. Robust water/fat separation in the presence of large field inhomogeneities using a graph cut algorithm. Magn. Reson. Med. 2010, 63, 79–90. [Google Scholar] [CrossRef] [PubMed] [Green Version]
- Gordon, J.W.; Niles, D.J.; Fain, S.B.; Johnson, K.M. Joint spatial-spectral reconstruction and k-t spirals for accelerated 2d spatial/1d spectral imaging of 13c dynamics. Magn. Reson. Med. 2014, 71, 1435–1445. [Google Scholar] [CrossRef] [Green Version]
- Qin, Q. Point spread functions of the t2 decay in k-space trajectories with long echo train. Magn. Reson. Imaging 2012, 30, 1134–1142. [Google Scholar] [CrossRef] [Green Version]
- Wiesinger, F.; Weidl, E.; Menzel, M.I.; Janich, M.A.; Khegai, O.; Glaser, S.J.; Haase, A.; Schwaiger, M.; Schulte, R.F. Ideal spiral csi for dynamic metabolic mr imaging of hyperpolarized [1-13c]pyruvate. Magn. Reson. Med. 2012, 68, 8–16. [Google Scholar] [CrossRef]
- Gordon, J.W.; Niles, D.J.; Adamson, E.B.; Johnson, K.M.; Fain, S.B. Application of flow sensitive gradients for improved measures of metabolism using hyperpolarized 13c mri. Magn. Reson. Med. 2016, 75, 1242–1248. [Google Scholar] [CrossRef] [Green Version]
- Durst, M.; Koellisch, U.; Frank, A.; Rancan, G.; Gringeri, C.V.; Karas, V.; Wiesinger, F.; Menzel, M.I.; Schwaiger, M.; Haase, A.; et al. Comparison of acquisition schemes for hyperpolarised 13c imaging. NMR Biomed. 2015, 28, 715–725. [Google Scholar] [CrossRef]
- Duyn, J.H.; Yang, Y.; Frank, J.A.; van der Veen, J.W. Simple correction method for k-space trajectory deviations in mri. J. Magn. Reson. 1998, 132, 150–153. [Google Scholar] [CrossRef] [PubMed] [Green Version]
- R Core Team. R: A language and Environment for Statistical Computing; R Foundation for Statistical Computing: Vienna, Austria, 2018. [Google Scholar]


| Tumor Model | n | Volume (mm3) Mean ± SD | Mass (mg) Mean ± SD | Days Post-Inoculation Mean ± SD |
|---|---|---|---|---|
| 4T07 | 7 | 184 ± 178 | 163 ± 145 | 21 ± 8 |
| 4T1 | 7 | 195 ± 84 | 150 ± 58 | 12 ± 1 |
| Metabolic Measure | 4T07 | 4T1 | Unpaired t-Test | ||
|---|---|---|---|---|---|
| Mean ± SD | # Samples | Mean ± SD | # Samples | ||
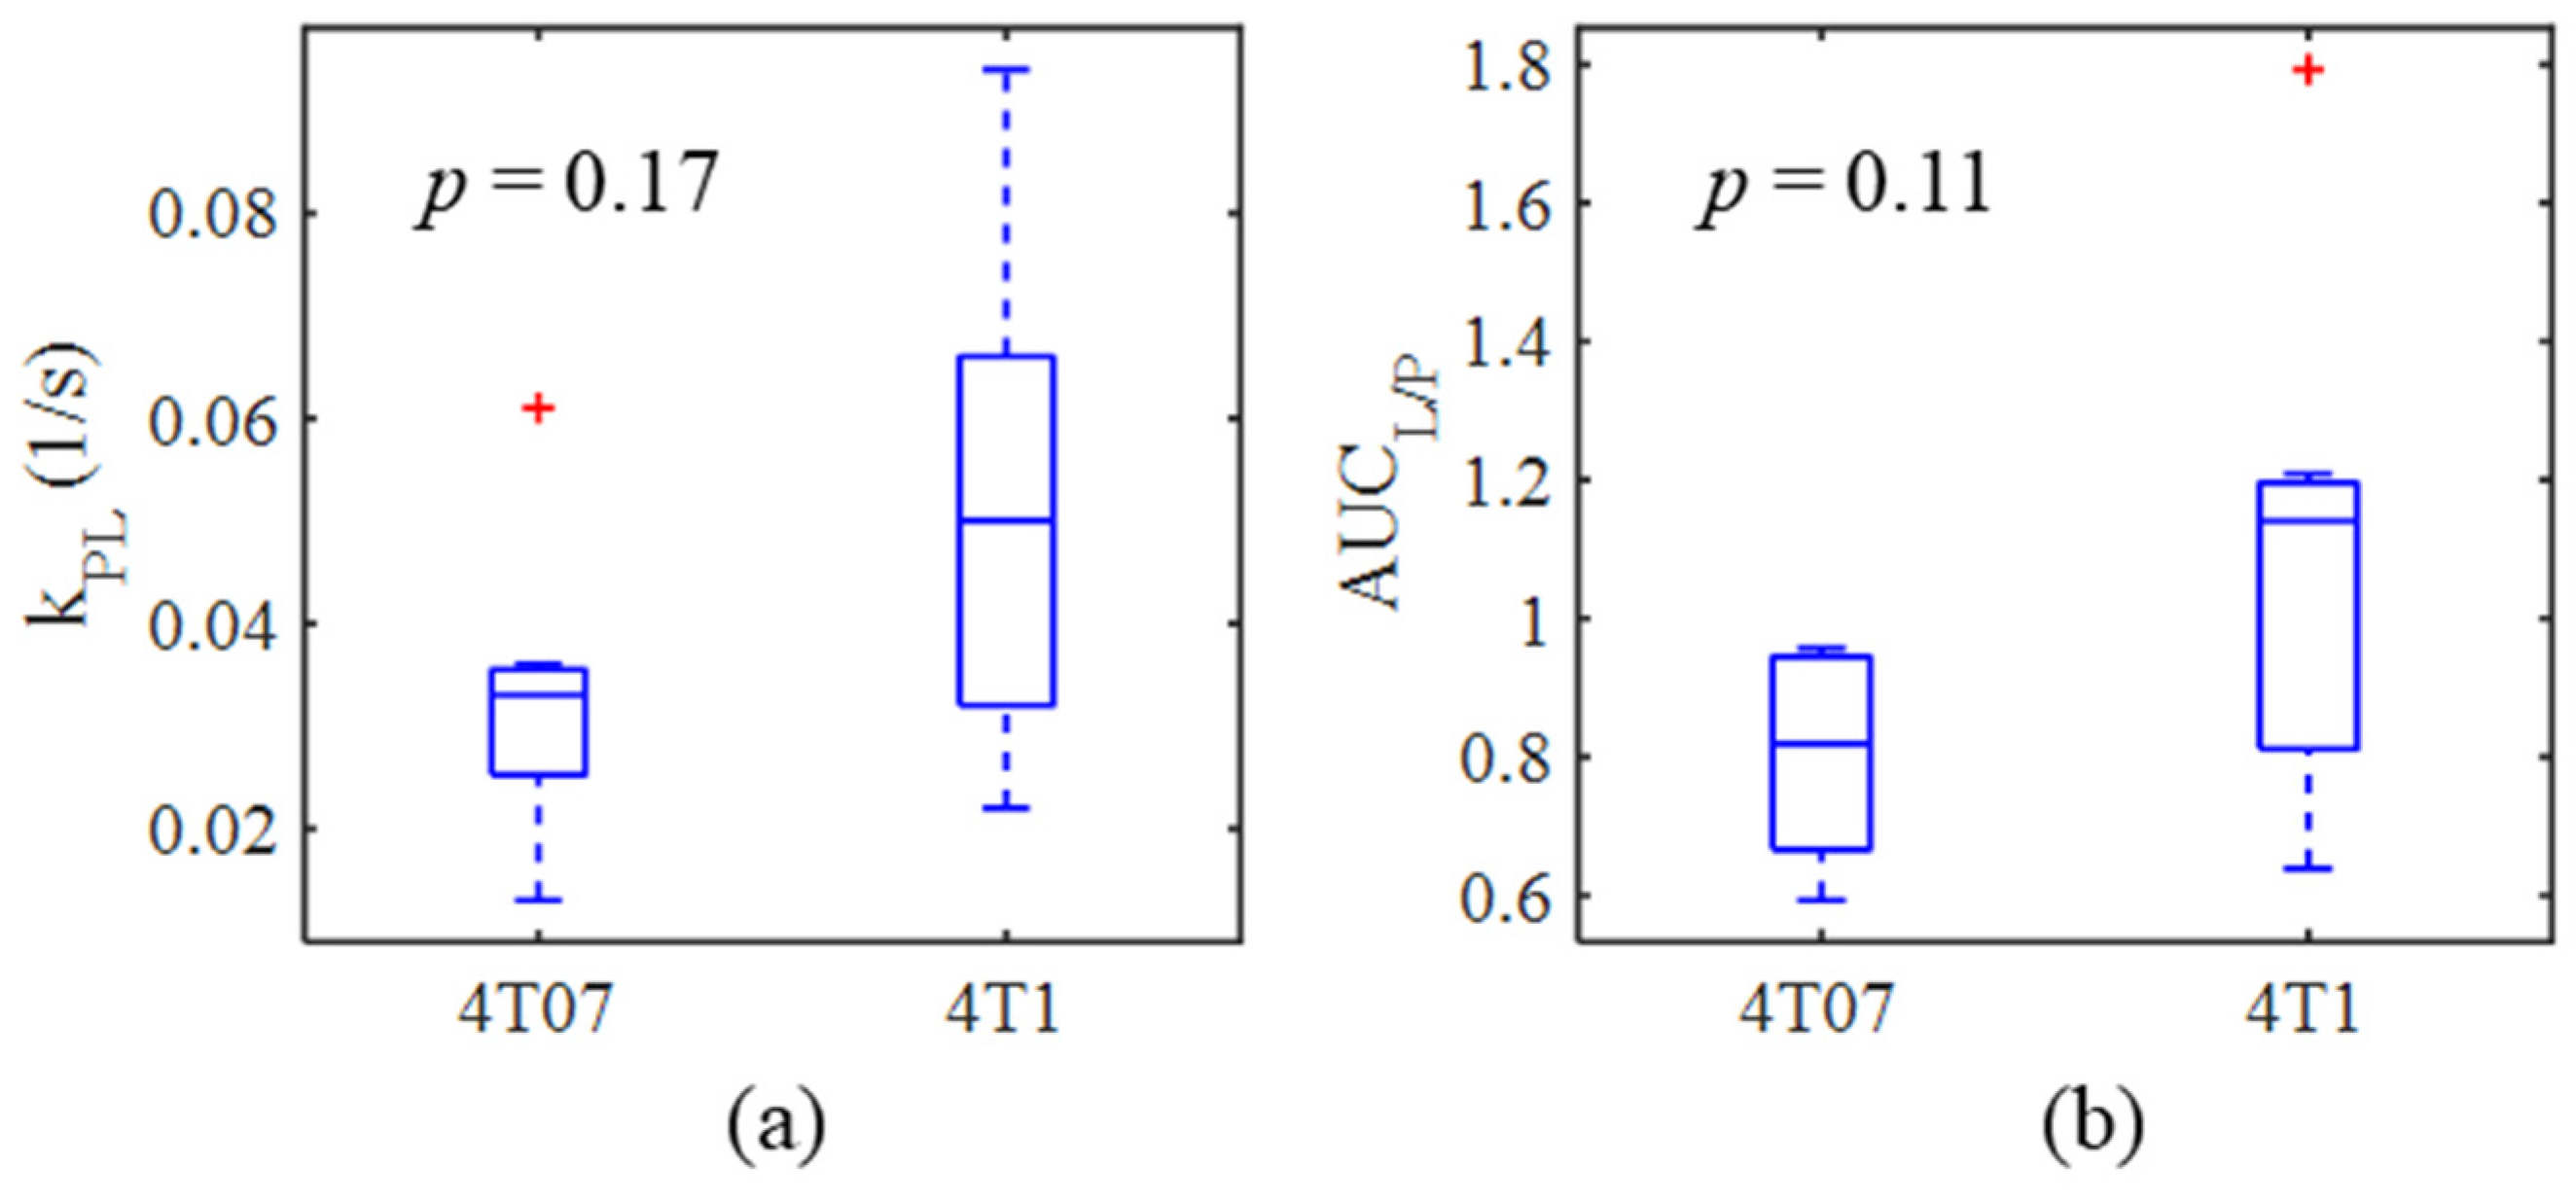
| kPL (s−1) | 0.033 ± 0.015 | 7 | 0.052 ± 0.027 | 6 | p = 0.17 |
| AUCL/P | 0.81 ± 0.15 | 7 | 1.08 ± 0.38 | 7 | p = 0.11 |
| Blood lactate (mM) | 4.7 ± 0.9 | 6 | 4.3 ± 0.7 | 7 | p = 0.45 |
| Blood glucose (mg/dL) | 228 ± 33 | 6 | 194 ± 43 | 7 | p = 0.14 |
| Tumor LDH (nmol/min/mL/mg) | 535 ± 128 | 6 | 588 ± 102 | 7 | p = 0.44 |
| Tumor LDHA (mean intensity) | 958 ± 433 | 7 | 872 ± 408 | 7 | p = 0.52 |
| Tumor MCT1 (mean intensity) | 1071 ± 729 | 7 | 623 ± 184 | 6 | p = 0.18 |
| Tumor HIF-1α (mean intensity) | 1329 ± 496 | 7 | 1176 ± 432 | 7 | p = 0.52 |
| Tumor CD31 (CD31 + area) | 7422 ± 2973 | 7 | 5253 ± 1814 | 6 | p = 0.43 |
| Comparison | Tumor Models Included | Time Points Included a | ρspearman | p-Value |
|---|---|---|---|---|
| kPL vs. tumor LDH | pooled 4T1 and 4T07 | final | 0.480 | 0.114 |
| kPL vs. blood lactate | pooled 4T1 and 4T07 | all | −0.181 | 0.472 |
| kPL vs. blood glucose | pooled 4T1 and 4T07 | all | −0.414 | 0.088 |
| kPL vs. tumor LDHA | pooled 4T1 and 4T07 | final | 0.459 | 0.115 |
| kPL vs. tumor MCT1 | pooled 4T1 and 4T07 | final | −0.403 | 0.172 |
| kPL vs. tumor HIF-1α | pooled 4T1 and 4T07 | final | −0.163 | 0.593 |
| kPL vs. tumor CD31 | pooled 4T1 and 4T07 | final | −0.233 | 0.443 |
| kPL vs. tumor volume | pooled 4T1 and 4T07 | final | −0.201 | 0.511 |
| AUCL/P vs. tumor LDH | pooled 4T1 and 4T07 | final | 0.621 | 0.027 |
| AUCL/P vs. blood lactate | pooled 4T1 and 4T07 | all | −0.067 | 0.786 |
| AUCL/P vs. blood glucose | pooled 4T1 and 4T07 | all | −0.474 | 0.042 |
| AUCL/P vs. tumor LDHA | pooled 4T1 and 4T07 | final | −0.057 | 0.844 |
| AUCL/P vs. tumor MCT1 | pooled 4T1 and 4T07 | final | −0.479 | 0.083 |
| AUCL/P vs. tumor HIF-1α | pooled 4T1 and 4T07 | final | −0.275 | 0.342 |
| AUCL/P vs. tumor CD31 | pooled 4T1 and 4T07 | final | 0.416 | 0.139 |
| AUCL/P vs. tumor CD31 | pooled 4T1 and 4T07 | final | −0.002 | 1.000 |
| AUCL/P vs. kPL | pooled 4T1 and 4T07 | all | 0.665 | 0.002 |
| LDHA vs. tumor volume | pooled 4T1 and 4T07 | final | −0.284 | 0.325 |
| MCT1 vs. tumor volume | pooled 4T1 and 4T07 | final | 0.351 | 0.239 |
| HIF-1α vs. tumor volume | pooled 4T1 and 4T07 | final | −0.095 | 0.750 |
| CD31 vs. tumor volume | pooled 4T1 and 4T07 | final | −0.024 | 0.940 |
| LDHA vs. LDH activity | pooled 4T1 and 4T07 | final | 0.066 | 0.835 |
| Tumor Model | Total Mice Imaged | Subset of Mice with Repeat Study |
|---|---|---|
| 4T07, dormant | 7 | 3 |
| 4T1, metastatic | 7 | 3 |
| Total | 14 | 6 |
Publisher’s Note: MDPI stays neutral with regard to jurisdictional claims in published maps and institutional affiliations. |
© 2021 by the authors. Licensee MDPI, Basel, Switzerland. This article is an open access article distributed under the terms and conditions of the Creative Commons Attribution (CC BY) license (https://creativecommons.org/licenses/by/4.0/).
Share and Cite
Macdonald, E.B.; Begovatz, P.; Barton, G.P.; Erickson-Bhatt, S.; Inman, D.R.; Cox, B.L.; Eliceiri, K.W.; Strigel, R.M.; Ponik, S.M.; Fain, S.B. Hyperpolarized 13C Magnetic Resonance Spectroscopic Imaging of Pyruvate Metabolism in Murine Breast Cancer Models of Different Metastatic Potential. Metabolites 2021, 11, 274. https://doi.org/10.3390/metabo11050274
Macdonald EB, Begovatz P, Barton GP, Erickson-Bhatt S, Inman DR, Cox BL, Eliceiri KW, Strigel RM, Ponik SM, Fain SB. Hyperpolarized 13C Magnetic Resonance Spectroscopic Imaging of Pyruvate Metabolism in Murine Breast Cancer Models of Different Metastatic Potential. Metabolites. 2021; 11(5):274. https://doi.org/10.3390/metabo11050274
Chicago/Turabian StyleMacdonald, Erin B., Paul Begovatz, Gregory P. Barton, Sarah Erickson-Bhatt, David R. Inman, Benjamin L. Cox, Kevin W. Eliceiri, Roberta M. Strigel, Suzanne M. Ponik, and Sean B. Fain. 2021. "Hyperpolarized 13C Magnetic Resonance Spectroscopic Imaging of Pyruvate Metabolism in Murine Breast Cancer Models of Different Metastatic Potential" Metabolites 11, no. 5: 274. https://doi.org/10.3390/metabo11050274