
In Vivo Assessment of Metabolic Abnormality in Alport Syndrome Using Hyperpolarized [1-13C] Pyruvate MR Spectroscopic Imaging

 , ,
, ,
Abstract
:1. Introduction
2. Results
3. Discussion
4. Materials and Methods
4.1. Subjects
4.2. 1H and 13C Imaging Examination
4.3. 13C Data Processing and Analysis
4.4. Urinary Microalbuminuria Measurement
4.5. Histology Evaluation
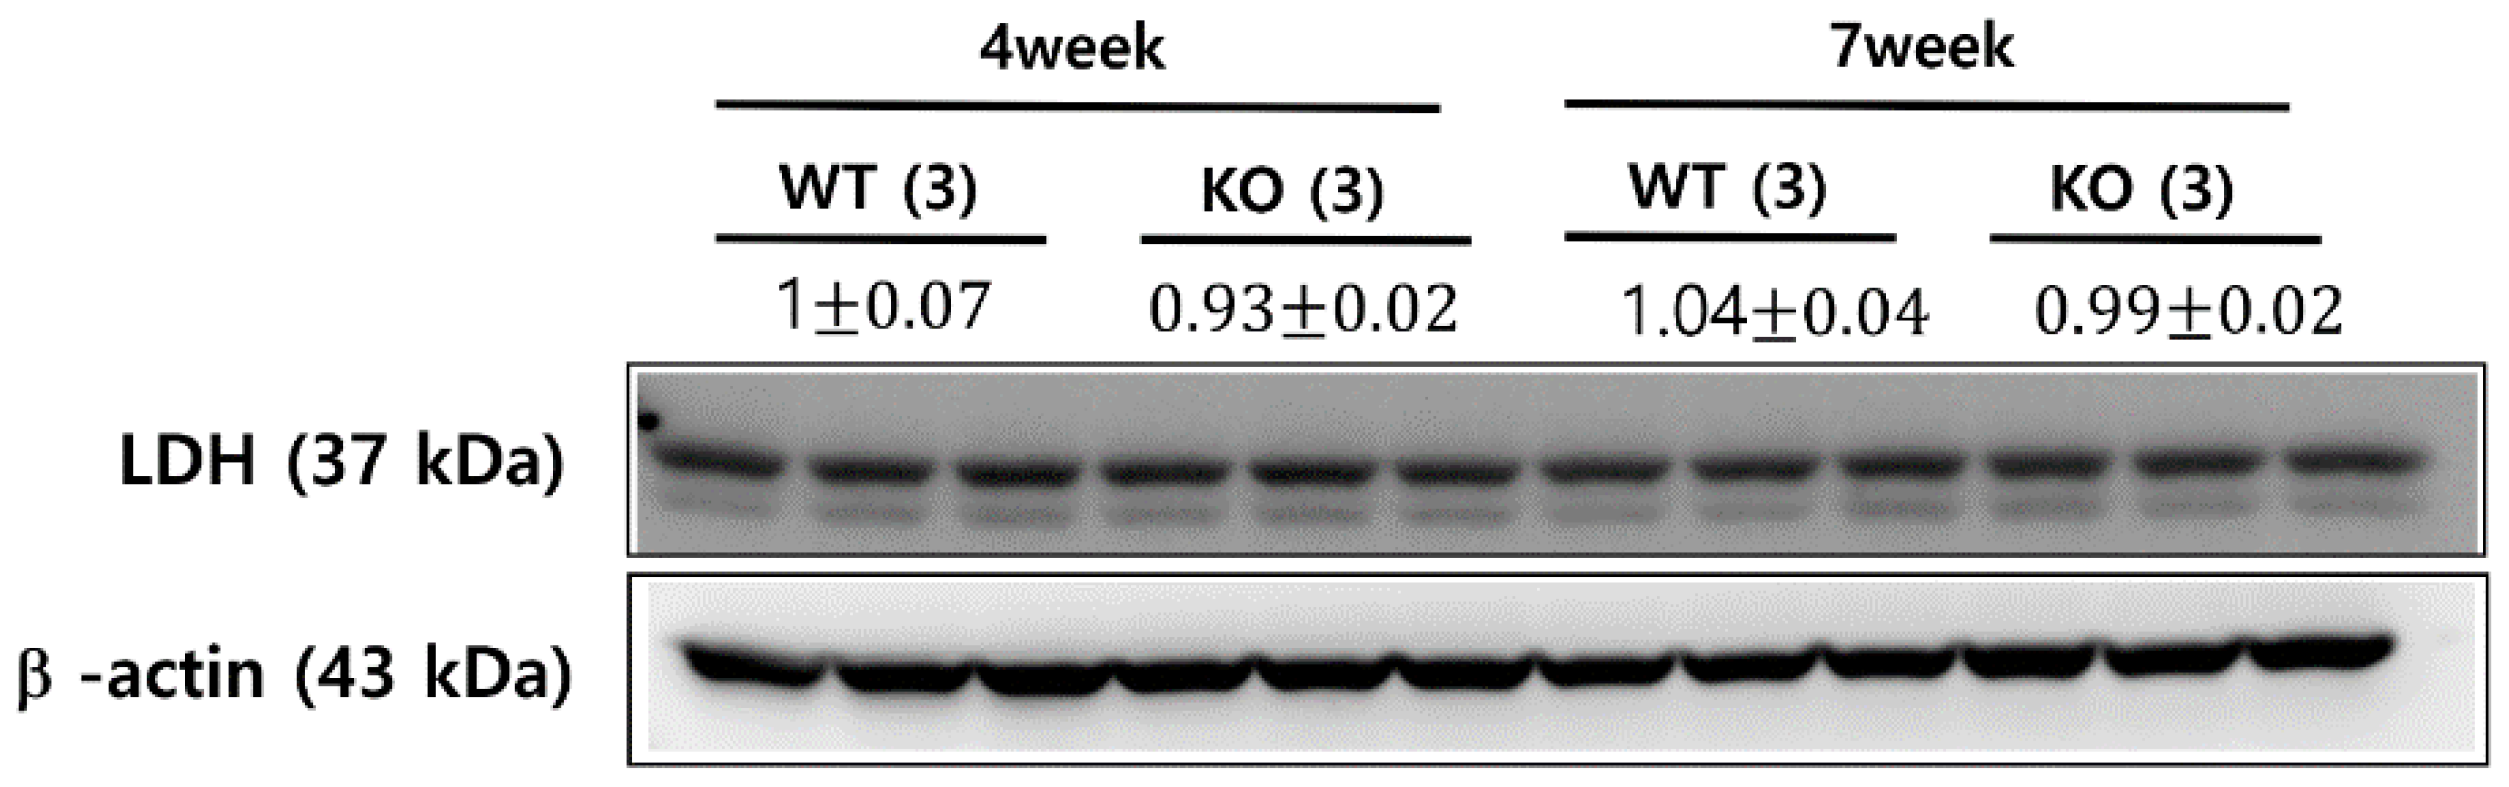
4.6. Western Blot Analysis of LDH
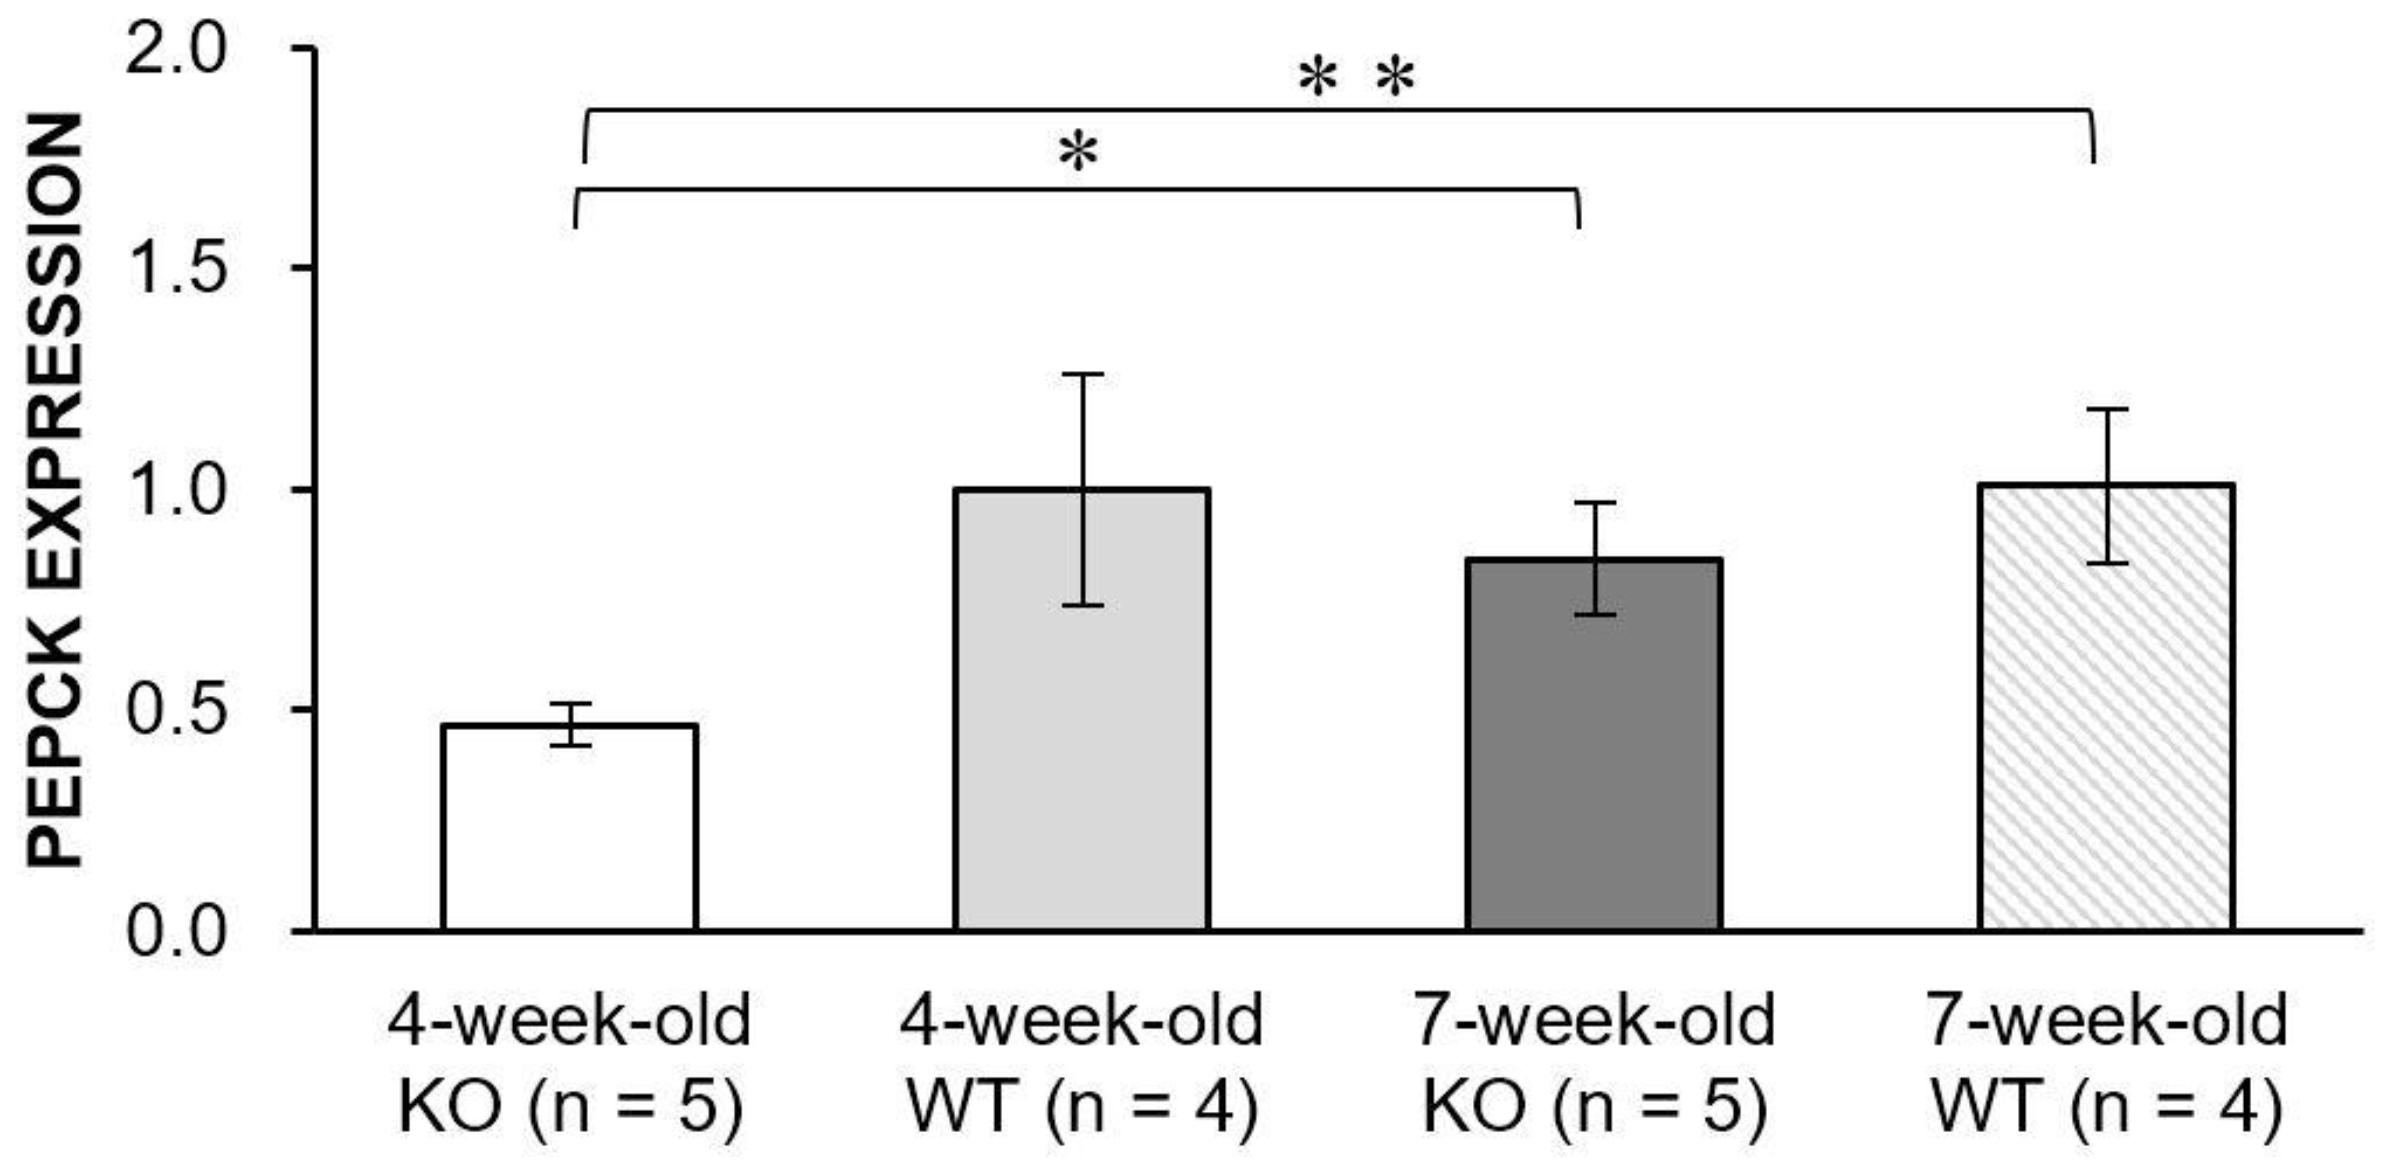
4.7. Real-Time PCR for Evaluation of PEPCK Expression Levels
5. Conclusions
Author Contributions
Funding
Institutional Review Board Statement
Informed Consent Statement
Data Availability Statement
Acknowledgments
Conflicts of Interest
References
- Mahajan, S.; Prabhu, R.; Bairy, M.; Hasan, F.; Sahoo, P. Alport’s Syndrome: A Study of Systemic Manifestations. Int. J. Sci. Study 2013, 1, 4p. [Google Scholar]
- Miner, J.H.; Sanes, J.R. Collagen IV alpha 3, alpha 4, and alpha 5 chains in rodent basal laminae: Sequence, distribution, association with laminins, and developmental switches. J. Cell Biol. 1994, 127, 879–891. [Google Scholar] [CrossRef]
- Abrahamson, D.R.; Hudson, B.G.; Stroganova, L.; Borza, D.B.; St John, P.L. Cellular origins of type IV collagen networks in developing glomeruli. J. Am. Soc. Nephrol. 2009, 20, 1471–1479. [Google Scholar] [CrossRef] [Green Version]
- Kalluri, R.; Shield, C.F.; Todd, P.; Hudson, B.G.; Neilson, E.G. Isoform switching of type IV collagen is developmentally arrested in X-linked Alport syndrome leading to increased susceptibility of renal basement membranes to endoproteolysis. J. Clin. Investig. 1997, 99, 2470–2478. [Google Scholar] [CrossRef]
- Kashtan, C. Long-term management of Alport syndrome in pediatric patients. Pediatr. Health Med. Ther. 2013, 2013, 41. [Google Scholar] [CrossRef] [Green Version]
- Artuso, R.; Fallerini, C.; Dosa, L.; Scionti, F.; Clementi, M.; Garosi, G.; Massella, L.; Epistolato, M.C.; Mancini, R.; Mari, F.; et al. Advances in Alport syndrome diagnosis using next-generation sequencing. Eur. J. Hum. Genet. 2012, 20, 50–57. [Google Scholar] [CrossRef] [Green Version]
- Wang, Z.J.; Ohliger, M.A.; Larson, P.E.Z.; Gordon, J.W.; Bok, R.A.; Slater, J.; Villanueva-Meyer, J.E.; Hess, C.P.; Kurhanewicz, J.; Vigneron, D.B. Hyperpolarized 13C MRI: State of the Art and Future Directions. Radiology 2019, 291, 273–284. [Google Scholar] [CrossRef] [PubMed]
- Baligand, C.; Qin, H.; True-Yasaki, A.; Gordon, J.W.; von Morze, C.; Santos, J.D.; Wilson, D.M.; Raffai, R.; Cowley, P.M.; Baker, A.J.; et al. Hyperpolarized 13C magnetic resonance evaluation of renal ischemia reperfusion injury in a murine model. NMR Biomed. 2017, 30, e3761. [Google Scholar] [CrossRef] [PubMed]
- Nielsen, P.M.; Qi, H.; Bertelsen, L.B.; Laustsen, C. Metabolic reprogramming associated with progression of renal ischemia reperfusion injury assessed with hyperpolarized [1-13C]pyruvate. Sci. Rep. 2020, 10, 8915. [Google Scholar] [CrossRef] [PubMed]
- Nielsen, P.M.; Szocska Hansen, E.S.; Norlinger, T.S.; Norregaard, R.; Bonde Bertelsen, L.; Stodkilde Jorgensen, H.; Laustsen, C. Renal ischemia and reperfusion assessment with three-dimensional hyperpolarized 13C,15N2-urea. Magn. Reson. Med. 2016, 76, 1524–1530. [Google Scholar] [CrossRef] [PubMed]
- Nielsen, P.M.; Laustsen, C.; Bertelsen, L.B.; Qi, H.; Mikkelsen, E.; Kristensen, M.L.; Norregaard, R.; Stodkilde-Jorgensen, H. In situ lactate dehydrogenase activity: A novel renal cortical imaging biomarker of tubular injury? Am. J. Physiol. Ren. Physiol. 2017, 312, F465–F473. [Google Scholar] [CrossRef]
- Clatworthy, M.R.; Kettunen, M.I.; Hu, D.E.; Mathews, R.J.; Witney, T.H.; Kennedy, B.W.; Bohndiek, S.E.; Gallagher, F.A.; Jarvis, L.B.; Smith, K.G.; et al. Magnetic resonance imaging with hyperpolarized [1,4-13C2]fumarate allows detection of early renal acute tubular necrosis. Proc. Natl. Acad. Sci. USA 2012, 109, 13374–13379. [Google Scholar] [CrossRef] [Green Version]
- Sriram, R.; Gordon, J.; Baligand, C.; Ahamed, F.; Delos Santos, J.; Qin, H.; Bok, R.A.; Vigneron, D.B.; Kurhanewicz, J.; Larson, P.E.Z.; et al. Non-Invasive Assessment of Lactate Production and Compartmentalization in Renal Cell Carcinomas Using Hyperpolarized 13C Pyruvate MRI. Cancers 2018, 10, 313. [Google Scholar] [CrossRef] [PubMed] [Green Version]
- Keshari, K.R.; Sriram, R.; Koelsch, B.L.; Van Criekinge, M.; Wilson, D.M.; Kurhanewicz, J.; Wang, Z.J. Hyperpolarized 13C-pyruvate magnetic resonance reveals rapid lactate export in metastatic renal cell carcinomas. Cancer Res. 2013, 73, 529–538. [Google Scholar] [CrossRef] [PubMed] [Green Version]
- Dong, Y.; Eskandari, R.; Ray, C.; Granlund, K.L.; Santos-Cunha, L.D.; Miloushev, V.Z.; Tee, S.S.; Jeong, S.; Aras, O.; Chen, Y.B.; et al. Hyperpolarized MRI Visualizes Warburg Effects and Predicts Treatment Response to mTOR Inhibitors in Patient-Derived ccRCC Xenograft Models. Cancer Res. 2019, 79, 242–250. [Google Scholar] [CrossRef] [PubMed] [Green Version]
- Nelson, S.J.; Kurhanewicz, J.; Vigneron, D.B.; Larson, P.E.; Harzstark, A.L.; Ferrone, M.; van Criekinge, M.; Chang, J.W.; Bok, R.; Park, I.; et al. Metabolic imaging of patients with prostate cancer using hyperpolarized [1-13C]pyruvate. Sci. Transl. Med. 2013, 5, 198ra108. [Google Scholar] [CrossRef] [PubMed] [Green Version]
- Cunningham, C.H.; Lau, J.Y.; Chen, A.P.; Geraghty, B.J.; Perks, W.J.; Roifman, I.; Wright, G.A.; Connelly, K.A. Hyperpolarized 13C Metabolic MRI of the Human Heart: Initial Experience. Circ. Res. 2016, 119, 1177–1182. [Google Scholar] [CrossRef]
- Park, I.; Larson, P.E.Z.; Gordon, J.W.; Carvajal, L.; Chen, H.Y.; Bok, R.; Van Criekinge, M.; Ferrone, M.; Slater, J.B.; Xu, D.; et al. Development of methods and feasibility of using hyperpolarized carbon-13 imaging data for evaluating brain metabolism in patient studies. Magn. Reson. Med. 2018, 80, 864–873. [Google Scholar] [CrossRef] [Green Version]
- Grist, J.T.; McLean, M.A.; Riemer, F.; Schulte, R.F.; Deen, S.S.; Zaccagna, F.; Woitek, R.; Daniels, C.J.; Kaggie, J.D.; Matys, T.; et al. Quantifying normal human brain metabolism using hyperpolarized [1-13C]pyruvate and magnetic resonance imaging. Neuroimage 2019, 189, 171–179. [Google Scholar] [CrossRef]
- Miloushev, V.Z.; Granlund, K.L.; Boltyanskiy, R.; Lyashchenko, S.K.; DeAngelis, L.M.; Mellinghoff, I.K.; Brennan, C.W.; Tabar, V.; Yang, T.J.; Holodny, A.I.; et al. Metabolic Imaging of the Human Brain with Hyperpolarized 13C Pyruvate Demonstrates 13C Lactate Production in Brain Tumor Patients. Cancer Res. 2018, 78, 3755–3760. [Google Scholar] [CrossRef] [Green Version]
- Autry, A.W.; Gordon, J.W.; Chen, H.Y.; LaFontaine, M.; Bok, R.; Van Criekinge, M.; Slater, J.B.; Carvajal, L.; Villanueva-Meyer, J.E.; Chang, S.M.; et al. Characterization of serial hyperpolarized 13C metabolic imaging in patients with glioma. Neuroimage Clin. 2020, 27, 102323. [Google Scholar] [CrossRef]
- Granlund, K.L.; Tee, S.S.; Vargas, H.A.; Lyashchenko, S.K.; Reznik, E.; Fine, S.; Laudone, V.; Eastham, J.A.; Touijer, K.A.; Reuter, V.E.; et al. Hyperpolarized MRI of Human Prostate Cancer Reveals Increased Lactate with Tumor Grade Driven by Monocarboxylate Transporter 1. Cell Metab. 2020, 31, 105–114. [Google Scholar] [CrossRef] [PubMed]
- Chen, H.Y.; Aggarwal, R.; Bok, R.A.; Ohliger, M.A.; Zhu, Z.; Lee, P.; Gordon, J.W.; van Criekinge, M.; Carvajal, L.; Slater, J.B.; et al. Hyperpolarized 13C-pyruvate MRI detects real-time metabolic flux in prostate cancer metastases to bone and liver: A clinical feasibility study. Prostate Cancer Prostatic Dis. 2020, 23, 269–276. [Google Scholar] [CrossRef] [PubMed] [Green Version]
- Venkatesh, H.S.; Chaumeil, M.M.; Ward, C.S.; Haas-Kogan, D.A.; James, C.D.; Ronen, S.M. Reduced phosphocholine and hyperpolarized lactate provide magnetic resonance biomarkers of PI3K/Akt/mTOR inhibition in glioblastoma. Neuro Oncol. 2012, 14, 315–325. [Google Scholar] [CrossRef] [PubMed] [Green Version]
- Dafni, H.; Larson, P.E.; Hu, S.; Yoshihara, H.A.; Ward, C.S.; Venkatesh, H.S.; Wang, C.; Zhang, X.; Vigneron, D.B.; Ronen, S.M. Hyperpolarized 13C spectroscopic imaging informs on hypoxia-inducible factor-1 and myc activity downstream of platelet-derived growth factor receptor. Cancer Res. 2010, 70, 7400–7410. [Google Scholar] [CrossRef] [PubMed] [Green Version]
- Park, I.; Lupo, J.M.; Nelson, S.J. Correlation of Tumor Perfusion Between Carbon-13 Imaging with Hyperpolarized Pyruvate and Dynamic Susceptibility Contrast MRI in Pre-Clinical Model of Glioblastoma. Mol. Imaging Biol. 2019, 21, 626–632. [Google Scholar] [CrossRef]
- Lewis, A.J.M.; Miller, J.J.; Lau, A.Z.; Curtis, M.K.; Rider, O.J.; Choudhury, R.P.; Neubauer, S.; Cunningham, C.H.; Carr, C.A.; Tyler, D.J. Noninvasive Immunometabolic Cardiac Inflammation Imaging Using Hyperpolarized Magnetic Resonance. Circ. Res. 2018, 122, 1084–1093. [Google Scholar] [CrossRef] [Green Version]
- Moon, C.M.; Shin, S.S.; Heo, S.H.; Lim, H.S.; Moon, M.J.; Surendran, S.P.; Kim, G.E.; Park, I.W.; Jeong, Y.Y. Metabolic Changes in Different Stages of Liver Fibrosis: In vivo Hyperpolarized 13C MR Spectroscopy and Metabolic Imaging. Mol. Imaging Biol. 2019, 21, 842–851. [Google Scholar] [CrossRef]
- Park, I.; Kim, S.; Pucciarelli, D.; Song, J.; Choi, J.M.; Lee, K.H.; Kim, Y.H.; Jung, S.; Yoon, W.; Nakamura, J.L. Differentiating Radiation Necrosis from Brain Tumor Using Hyperpolarized Carbon-13 MR Metabolic Imaging. Mol. Imaging Biol. 2021. [Google Scholar] [CrossRef]
- von Morze, C.; Chang, G.Y.; Larson, P.E.; Shang, H.; Allu, P.K.; Bok, R.A.; Crane, J.C.; Olson, M.P.; Tan, C.T.; Marco-Rius, I.; et al. Detection of localized changes in the metabolism of hyperpolarized gluconeogenic precursors 13C-lactate and 13C-pyruvate in kidney and liver. Magn. Reson. Med. 2017, 77, 1429–1437. [Google Scholar] [CrossRef] [Green Version]
- Keshari, K.R.; Wilson, D.M.; Sai, V.; Bok, R.; Jen, K.Y.; Larson, P.; Van Criekinge, M.; Kurhanewicz, J.; Wang, Z.J. Noninvasive in vivo imaging of diabetes-induced renal oxidative stress and response to therapy using hyperpolarized 13C dehydroascorbate magnetic resonance. Diabetes 2015, 64, 344–352. [Google Scholar] [CrossRef] [PubMed] [Green Version]
- Laustsen, C.; Stokholm Norlinger, T.; Christoffer Hansen, D.; Qi, H.; Mose Nielsen, P.; Bonde Bertelsen, L.; Henrik Ardenkjaer-Larsen, J.; Stodkilde Jorgensen, H. Hyperpolarized 13C urea relaxation mechanism reveals renal changes in diabetic nephropathy. Magn. Reson. Med. 2016, 75, 515–518. [Google Scholar] [CrossRef] [PubMed] [Green Version]
- Chakravarty, K.; Cassuto, H.; Reshef, L.; Hanson, R.W. Factors that control the tissue-specific transcription of the gene for phosphoenolpyruvate carboxykinase-C. Crit. Rev. Biochem. Mol. Biol. 2005, 40, 129–154. [Google Scholar] [CrossRef]
- Gerich, J.E. Role of the kidney in normal glucose homeostasis and in the hyperglycaemia of diabetes mellitus: Therapeutic implications. Diabet. Med. 2010, 27, 136–142. [Google Scholar] [CrossRef] [Green Version]
- Gerich, J.E.; Meyer, C.; Woerle, H.J.; Stumvoll, M. Renal gluconeogenesis: Its importance in human glucose homeostasis. Diabetes Care 2001, 24, 382–391. [Google Scholar] [CrossRef] [Green Version]
- Day, S.E.; Kettunen, M.I.; Gallagher, F.A.; Hu, D.E.; Lerche, M.; Wolber, J.; Golman, K.; Ardenkjaer-Larsen, J.H.; Brindle, K.M. Detecting tumor response to treatment using hyperpolarized 13C magnetic resonance imaging and spectroscopy. Nat. Med. 2007, 13, 1382–1387. [Google Scholar] [CrossRef]
- Park, I.; Mukherjee, J.; Ito, M.; Chaumeil, M.M.; Jalbert, L.E.; Gaensler, K.; Ronen, S.M.; Nelson, S.J.; Pieper, R.O. Changes in pyruvate metabolism detected by magnetic resonance imaging are linked to DNA damage and serve as a sensor of temozolomide response in glioblastoma cells. Cancer Res. 2014, 74, 7115–7124. [Google Scholar] [CrossRef] [Green Version]
- DeVience, S.J.; Lu, X.; Proctor, J.; Rangghran, P.; Melhem, E.R.; Gullapalli, R.; Fiskum, G.M.; Mayer, D. Metabolic imaging of energy metabolism in traumatic brain injury using hyperpolarized [1-13C]pyruvate. Sci. Rep. 2017, 7, 1907. [Google Scholar] [CrossRef]
- Guglielmetti, C.; Najac, C.; Didonna, A.; Van der Linden, A.; Ronen, S.M.; Chaumeil, M.M. Hyperpolarized 13C MR metabolic imaging can detect neuroinflammation in vivo in a multiple sclerosis murine model. Proc. Natl. Acad. Sci. USA 2017, 114, E6982–E6991. [Google Scholar] [CrossRef] [PubMed] [Green Version]
- Ding, W.; Yousefi, K.; Goncalves, S.; Goldstein, B.J.; Sabater, A.L.; Kloosterboer, A.; Ritter, P.; Lambert, G.; Mendez, A.J.; Shehadeh, L.A. Osteopontin deficiency ameliorates Alport pathology by preventing tubular metabolic deficits. JCI Insight 2018, 3, e94818. [Google Scholar] [CrossRef] [PubMed] [Green Version]
- Park, J.M.; Josan, S.; Grafendorfer, T.; Yen, Y.F.; Hurd, R.E.; Spielman, D.M.; Mayer, D. Measuring mitochondrial metabolism in rat brain in vivo using MR Spectroscopy of hyperpolarized [2-13C]pyruvate. NMR Biomed. 2013, 26, 1197–1203. [Google Scholar] [CrossRef] [PubMed] [Green Version]
- Keshari, K.R.; Kurhanewicz, J.; Bok, R.; Larson, P.E.; Vigneron, D.B.; Wilson, D.M. Hyperpolarized 13C dehydroascorbate as an endogenous redox sensor for in vivo metabolic imaging. Proc. Natl. Acad. Sci. USA 2011, 108, 18606–18611. [Google Scholar] [CrossRef] [PubMed] [Green Version]
- Mikkelsen, E.F.R.; Mariager, C.O.; Norlinger, T.; Qi, H.; Schulte, R.F.; Jakobsen, S.; Frokiaer, J.; Pedersen, M.; Stodkilde-Jorgensen, H.; Laustsen, C. Hyperpolarized [1-13C]-acetate Renal Metabolic Clearance Rate Mapping. Sci. Rep. 2017, 7, 16002. [Google Scholar] [CrossRef] [PubMed] [Green Version]
- Koellisch, U.; Gringeri, C.V.; Rancan, G.; Farell, E.V.; Menzel, M.I.; Haase, A.; Schwaiger, M.; Schulte, R.F. Metabolic imaging of hyperpolarized [1-13C]acetate and [1-13C]acetylcarnitine—Investigation of the influence of dobutamine induced stress. Magn. Reson. Med. 2015, 74, 1011–1018. [Google Scholar] [CrossRef]
- Gallagher, F.A.; Kettunen, M.I.; Day, S.E.; Hu, D.E.; Karlsson, M.; Gisselsson, A.; Lerche, M.H.; Brindle, K.M. Detection of tumor glutamate metabolism in vivo using 13C magnetic resonance spectroscopy and hyperpolarized [1-13C]glutamate. Magn. Reson. Med. 2011, 66, 18–23. [Google Scholar] [CrossRef]
- Moreno, K.X.; Satapati, S.; DeBerardinis, R.J.; Burgess, S.C.; Malloy, C.R.; Merritt, M.E. Real-time detection of hepatic gluconeogenic and glycogenolytic states using hyperpolarized [2-13C]dihydroxyacetone. J. Biol. Chem. 2014, 289, 35859–35867. [Google Scholar] [CrossRef] [Green Version]
- Kjaergaard, U.; Laustsen, C.; Norlinger, T.; Tougaard, R.S.; Mikkelsen, E.; Qi, H.; Bertelsen, L.B.; Jessen, N.; Stodkilde-Jorgensen, H. Hyperpolarized [1-13C] pyruvate as a possible diagnostic tool in liver disease. Physiol. Rep. 2018, 6, e13943. [Google Scholar] [CrossRef] [Green Version]
- Jin, E.S.; Moreno, K.X.; Wang, J.X.; Fidelino, L.; Merritt, M.E.; Sherry, A.D.; Malloy, C.R. Metabolism of hyperpolarized [1-13C]pyruvate through alternate pathways in rat liver. NMR Biomed. 2016, 29, 466–474. [Google Scholar] [CrossRef]
- Wang, C.; Zhang, B.; Wang, H.; Kong, H.; Gao, F.; Wang, X.; Yang, M.; Zhang, J. A feasibility study of using noninvasive renal oxygenation imaging for the early assessment of ischemic acute kidney injury in an embolization model. Magn. Reson. Imaging 2019, 63, 178–184. [Google Scholar] [CrossRef]
- Morze, C.V.; Allu, P.K.R.; Chang, G.Y.; Marco-Rius, I.; Milshteyn, E.; Wang, Z.J.; Ohliger, M.A.; Gleason, C.E.; Kurhanewicz, J.; Vigneron, D.B.; et al. Non-invasive detection of divergent metabolic signals in insulin deficiency vs. insulin resistance in vivo. Sci. Rep. 2018, 8, 2088. [Google Scholar] [CrossRef]
- Qi, H.; Nielsen, P.M.; Schroeder, M.; Bertelsen, L.B.; Palm, F.; Laustsen, C. Acute renal metabolic effect of metformin assessed with hyperpolarised MRI in rats. Diabetologia 2018, 61, 445–454. [Google Scholar] [CrossRef] [PubMed] [Green Version]
- Schiffer, T.A.; Gustafsson, H.; Palm, F. Kidney outer medulla mitochondria are more efficient compared with cortex mitochondria as a strategy to sustain ATP production in a suboptimal environment. Am. J. Physiol. Ren. Physiol. 2018, 315, F677–F681. [Google Scholar] [CrossRef] [PubMed]
- Brezis, M.; Shanley, P.; Silva, P.; Spokes, K.; Lear, S.; Epstein, F.H.; Rosen, S. Disparate mechanisms for hypoxic cell injury in different nephron segments. Studies in the isolated perfused rat kidney. J. Clin. Investig. 1985, 76, 1796–1806. [Google Scholar] [CrossRef] [PubMed]
- Gordon, J.W.; Autry, A.W.; Tang, S.; Graham, J.Y.; Bok, R.A.; Zhu, X.; Villanueva-Meyer, J.E.; Li, Y.; Ohilger, M.A.; Abraham, M.R.; et al. A variable resolution approach for improved acquisition of hyperpolarized 13C metabolic MRI. Magn. Reson. Med. 2020, 84, 2943–2952. [Google Scholar] [CrossRef]
- Gross, O.; Kashtan, C.E.; Rheault, M.N.; Flinter, F.; Savige, J.; Miner, J.H.; Torra, R.; Ars, E.; Deltas, C.; Savva, I.; et al. Advances and unmet needs in genetic, basic and clinical science in Alport syndrome: Report from the 2015 International Workshop on Alport Syndrome. Nephrol. Dial. Transplant. 2017, 32, 916–924. [Google Scholar] [CrossRef] [PubMed] [Green Version]
- Choi, H.S.; Kim, I.J.; Kim, C.S.; Ma, S.K.; Scholey, J.W.; Kim, S.W.; Bae, E.H. Angiotensin-[1-7] attenuates kidney injury in experimental Alport syndrome. Sci. Rep. 2020, 10, 4225. [Google Scholar] [CrossRef]
- Suh, S.H.; Choi, H.S.; Kim, C.S.; Kim, I.J.; Ma, S.K.; Scholey, J.W.; Kim, S.W.; Bae, E.H. Olmesartan Attenuates Kidney Fibrosis in a Murine Model of Alport Syndrome by Suppressing Tubular Expression of TGFbeta. Int. J. Mol. Sci. 2019, 20, 3843. [Google Scholar] [CrossRef] [PubMed] [Green Version]
- Park, I.; Hu, S.; Bok, R.; Ozawa, T.; Ito, M.; Mukherjee, J.; Phillips, J.J.; James, C.D.; Pieper, R.O.; Ronen, S.M.; et al. Evaluation of heterogeneous metabolic profile in an orthotopic human glioblastoma xenograft model using compressed sensing hyperpolarized 3D 13C magnetic resonance spectroscopic imaging. Magn. Reson. Med. 2013, 70, 33–39. [Google Scholar] [CrossRef] [PubMed] [Green Version]
- Crane, J.C.; Olson, M.P.; Nelson, S.J. SIVIC: Open-Source, Standards-Based Software for DICOM MR Spectroscopy Workflows. Int. J. Biomed. Imaging 2013, 2013, 169526. [Google Scholar] [CrossRef]
- Schneider, C.A.; Rasband, W.S.; Eliceiri, K.W. NIH Image to ImageJ: 25 years of image analysis. Nat. Methods 2012, 9, 671–675. [Google Scholar] [CrossRef]


| 4 Weeks | 7 Weeks | |||
|---|---|---|---|---|
| KO (n = 5) | WT (n = 4) | KO (n = 5) | WT (n = 4) | |
| Body weight (g) | 16.2 ± 0.3 * | 16.6 ± 0.4 ** | 19.4 ± 0.6 * | 21.5 ± 0.6 ** |
| Kidney weight (g) | 0.13 ± 0.006 * | 0.12 ± 0.006 ** | 0.17 ± 0.009 * | 0.16 ± 0.005 ** |
| KW (g)/BW (kg) | 7.69 ± 0.21 * | 6.92 ± 0.20 ** | 8.96 ± 0.18 *‡ | 7.62 ± 0.11 **‡ |
| ACR (mg/g Creatine) | 198.3 ± 61.4 *† | 8.4 ± 1.4 † | 11,423.3 ± 5962.4 *‡ | 13.3 ± 2.0 ‡ |
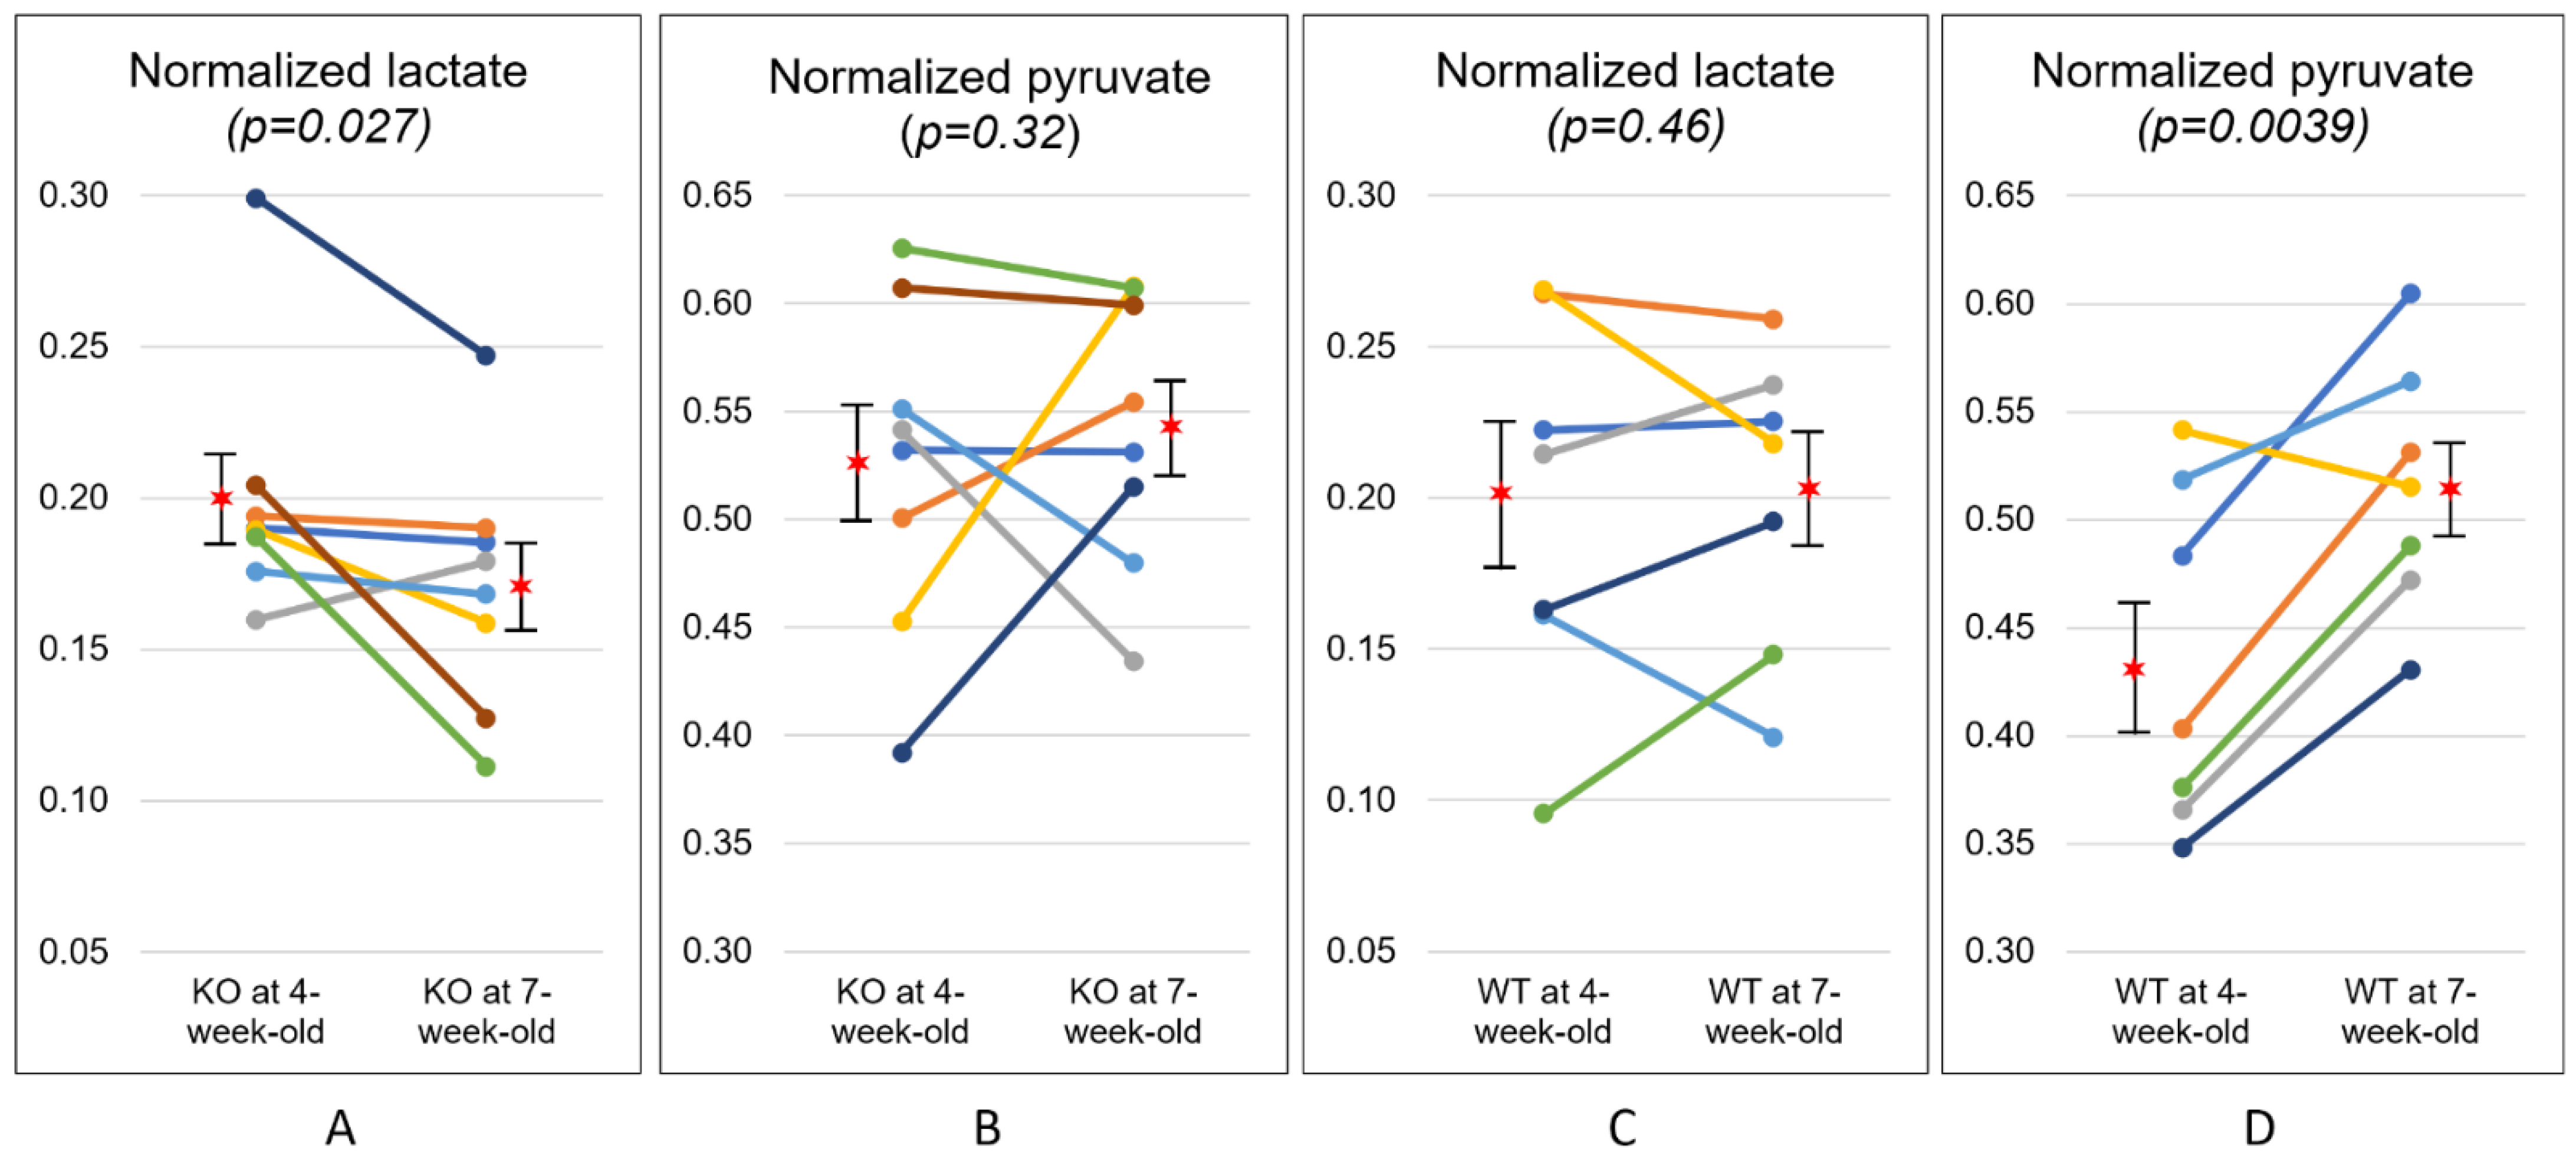
| Normalized Lactate | Normalized Pyruvate | Lac/Pyr | ||
|---|---|---|---|---|
| KO (n = 8) | 4-week | 0.20 ± 0.04 * | 0.53 ± 0.08 | 0.40 ± 0.15 † |
| 7-week | 0.17 ± 0.04 * | 0.54 ± 0.06 | 0.33 ± 0.10 † | |
| WT (n = 7) | 4-week | 0.19 ± 0.06 | 0.43 ± 0.08 ** | 0.47 ± 0.15 * |
| 7-week | 0.20 ± 0.05 | 0.52 ± 0.06 ** | 0.40 ± 0.11 * | |
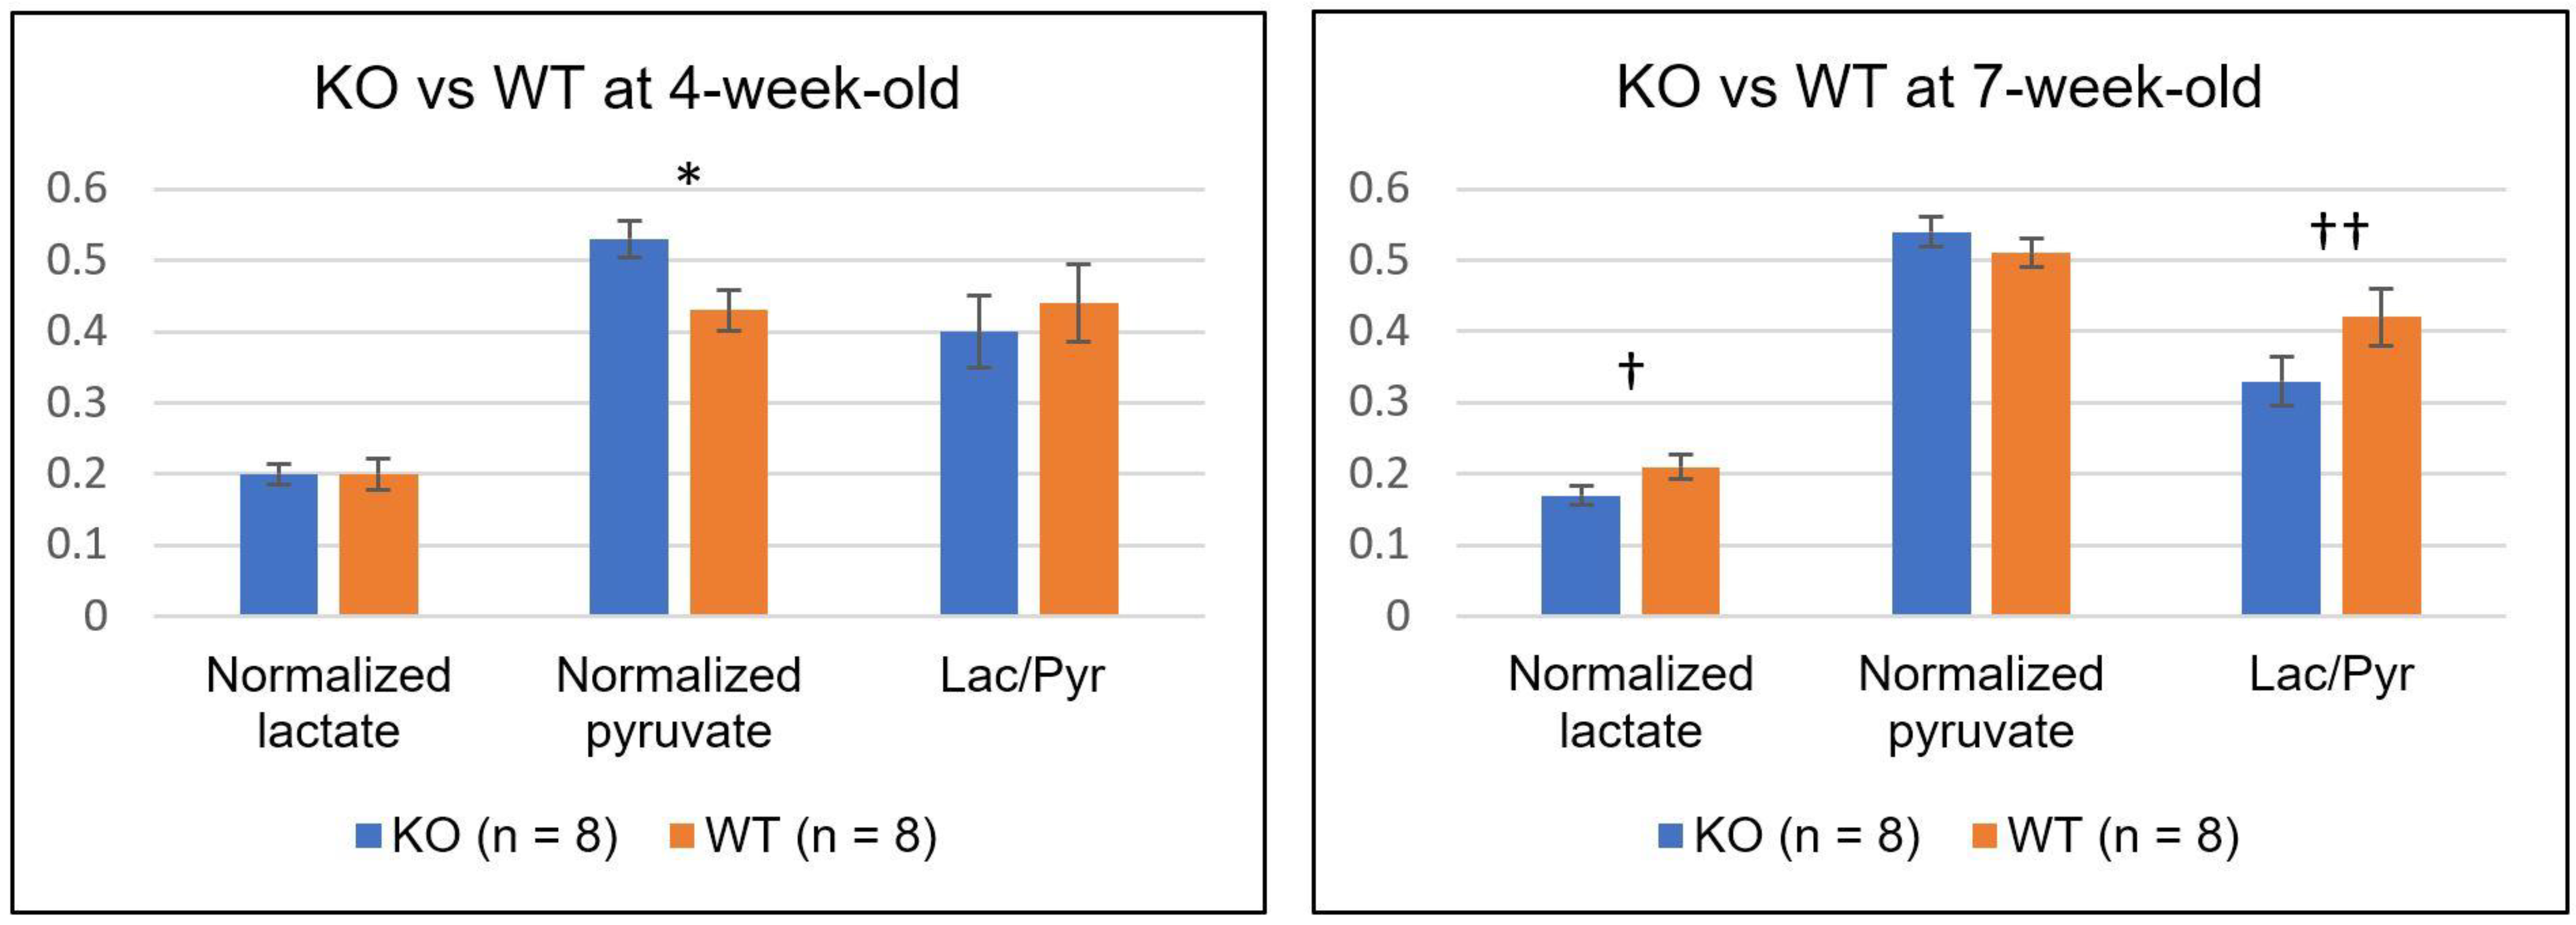
| Normalized Lactate | Normalized Pyruvate | Lac/Pyr | ||
|---|---|---|---|---|
| 4-week | KO (n = 8) | 0.20 ± 0.04 | 0.53 ± 0.08 * | 0.40 ± 0.15 |
| WT(n = 8) | 0.19 ± 0.07 | 0.45 ± 0.08 * | 0.44 ± 0.17 | |
| 7-week | KO (n = 8) | 0.17 ± 0.04 † | 0.54 ± 0.06 | 0.33 ± 0.10 †† |
| WT (n = 8) | 0.21 ± 0.05 † | 0.51 ± 0.06 | 0.42 ± 0.12 †† | |
Publisher’s Note: MDPI stays neutral with regard to jurisdictional claims in published maps and institutional affiliations. |
© 2021 by the authors. Licensee MDPI, Basel, Switzerland. This article is an open access article distributed under the terms and conditions of the Creative Commons Attribution (CC BY) license (https://creativecommons.org/licenses/by/4.0/).
Share and Cite
Nguyen, N.-T.; Bae, E.-H.; Do, L.-N.; Nguyen, T.-A.; Park, I.; Shin, S.-S. In Vivo Assessment of Metabolic Abnormality in Alport Syndrome Using Hyperpolarized [1-13C] Pyruvate MR Spectroscopic Imaging. Metabolites 2021, 11, 222. https://doi.org/10.3390/metabo11040222
Nguyen N-T, Bae E-H, Do L-N, Nguyen T-A, Park I, Shin S-S. In Vivo Assessment of Metabolic Abnormality in Alport Syndrome Using Hyperpolarized [1-13C] Pyruvate MR Spectroscopic Imaging. Metabolites. 2021; 11(4):222. https://doi.org/10.3390/metabo11040222
Chicago/Turabian StyleNguyen, Nguyen-Trong, Eun-Hui Bae, Luu-Ngoc Do, Tien-Anh Nguyen, Ilwoo Park, and Sang-Soo Shin. 2021. "In Vivo Assessment of Metabolic Abnormality in Alport Syndrome Using Hyperpolarized [1-13C] Pyruvate MR Spectroscopic Imaging" Metabolites 11, no. 4: 222. https://doi.org/10.3390/metabo11040222