Multi-Objective Service Restoration of Radial Distribution System in the Presence of Non-Linear Loads


Abstract
:1. Introduction
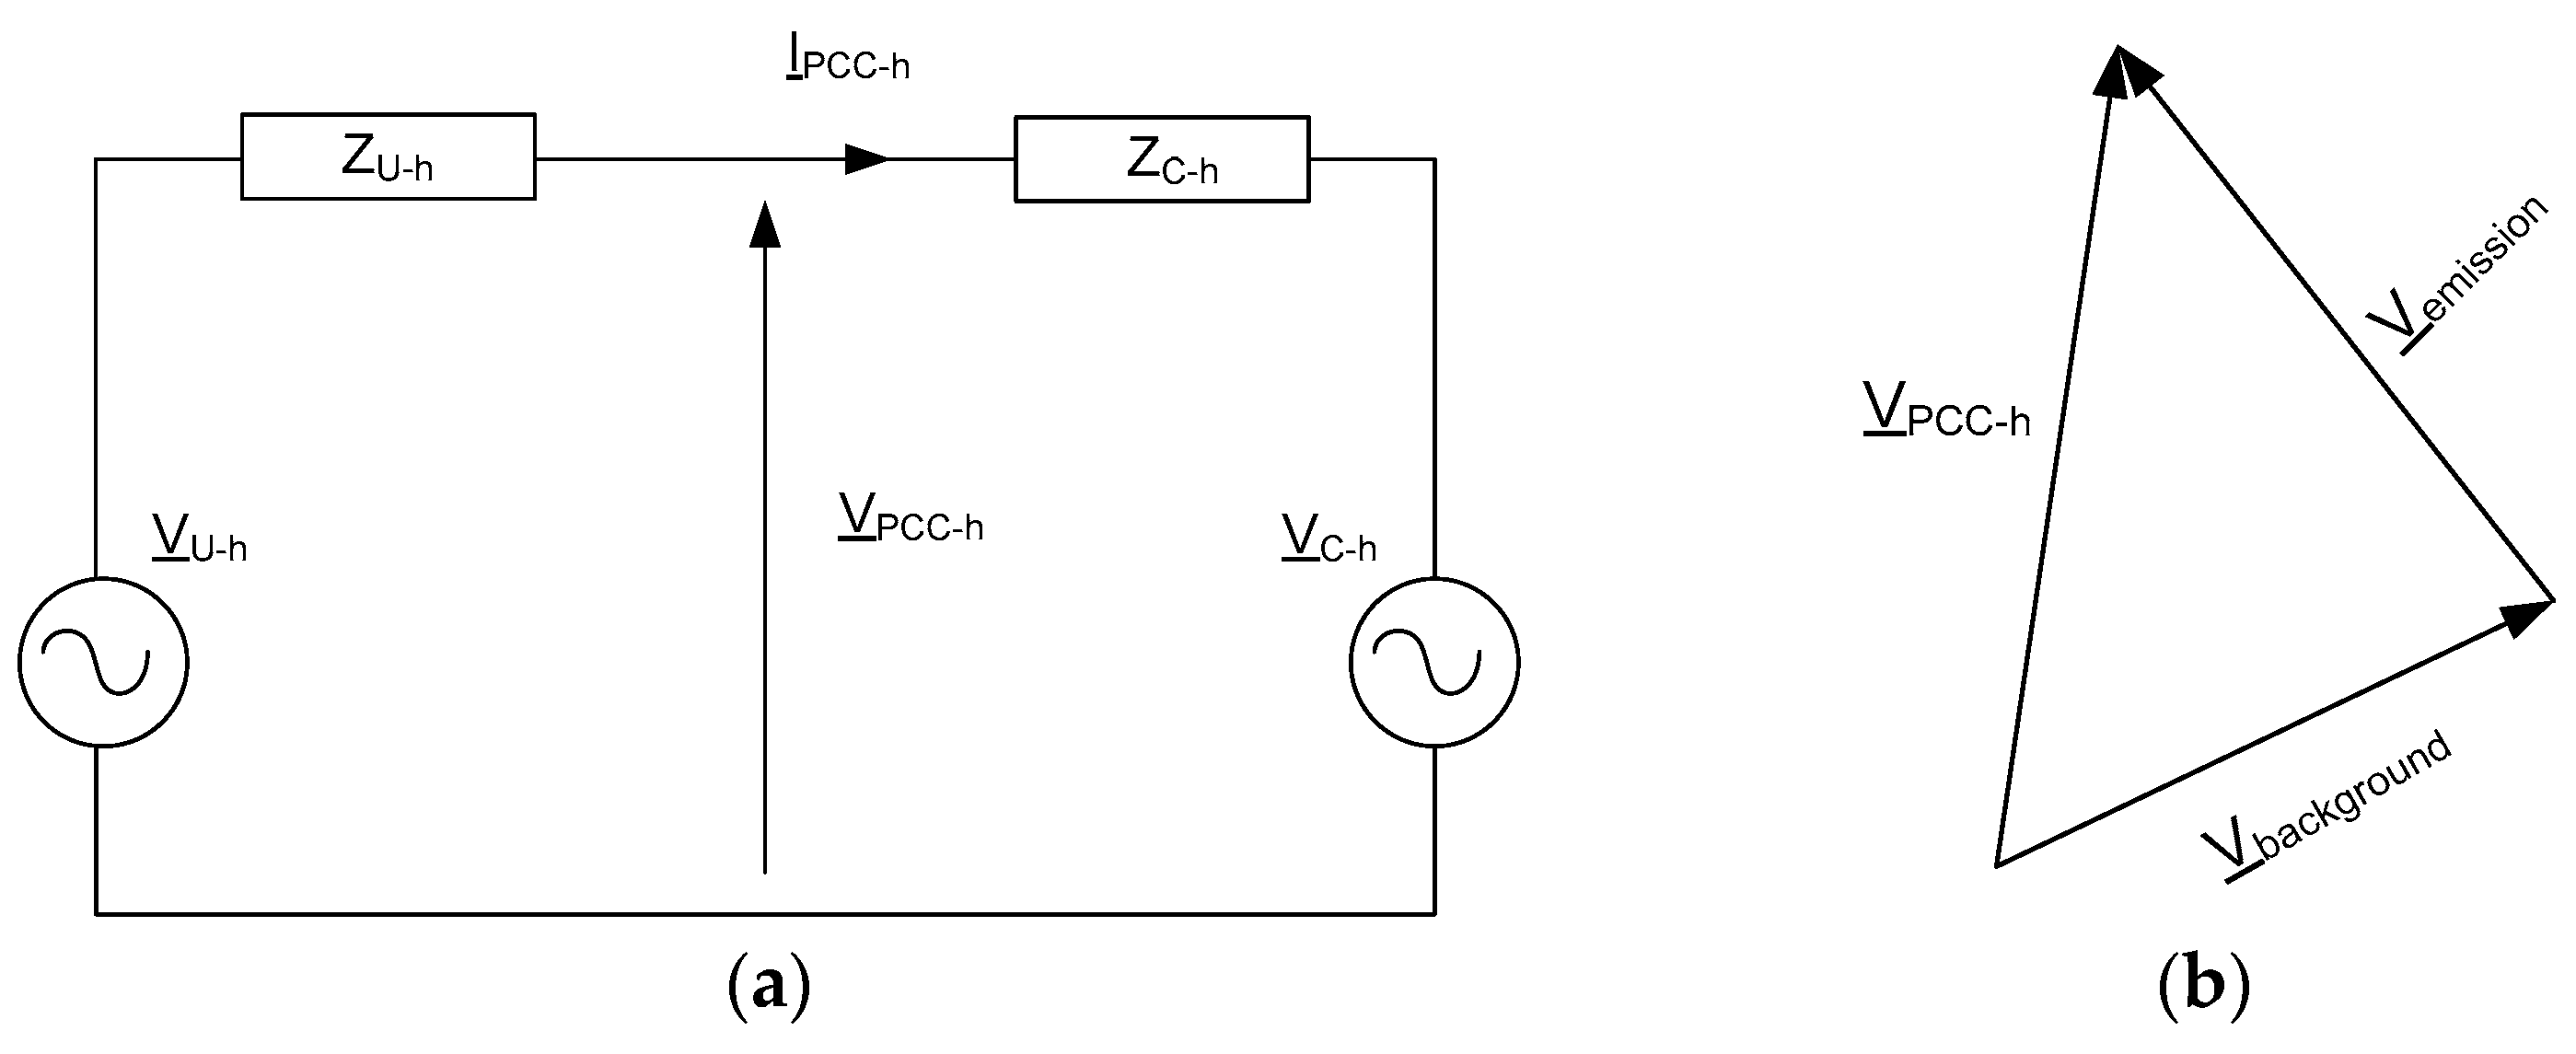
2. Harmonic Emission by Non-Linear Load
2.1. Effect of Non-Linear Load on Radial Distribution Network
- The number of non-linear loads present in the path Ci on which bus i is located (since the network is radial in nature, only one path is possible from the source node).
- Type and rating of the non-linear load in the path Ci.
- The distance of bus i from the bus connected to the non-linear load.
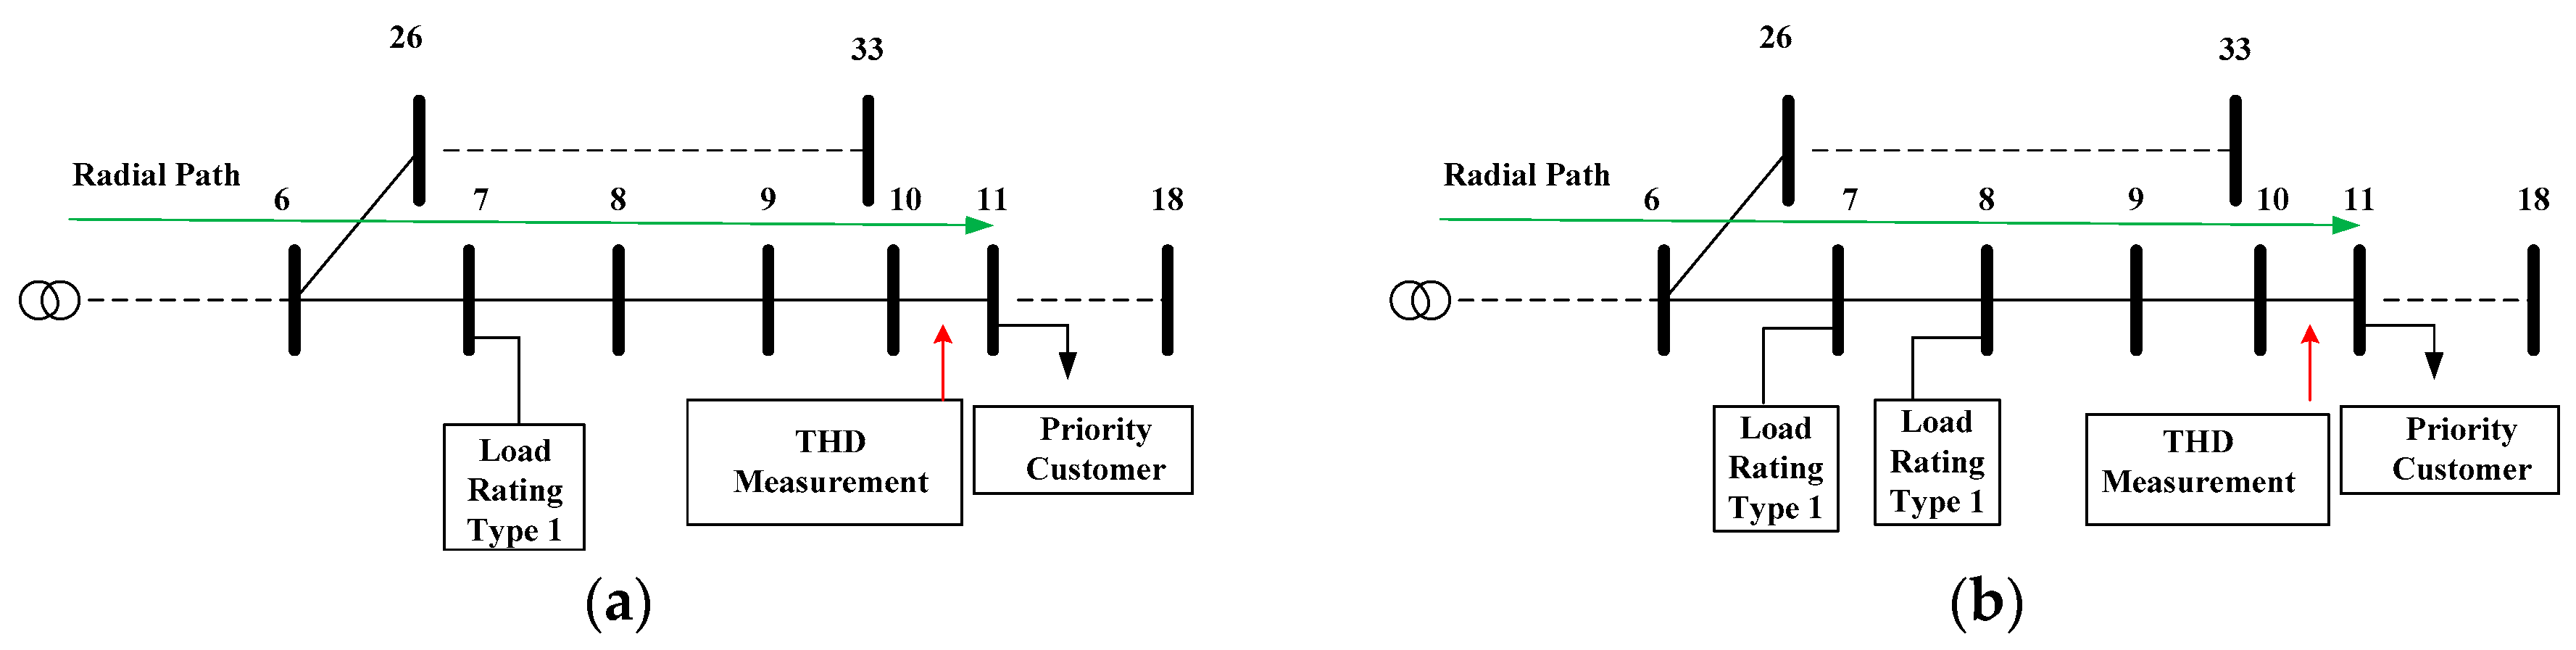
2.1.1. One Non-Linear Load is Connected at Bus 7, and Priority Customer is Connected to Bus 11
2.1.2. Two Non-Linear Loads are Connected at Bus 7 and 8
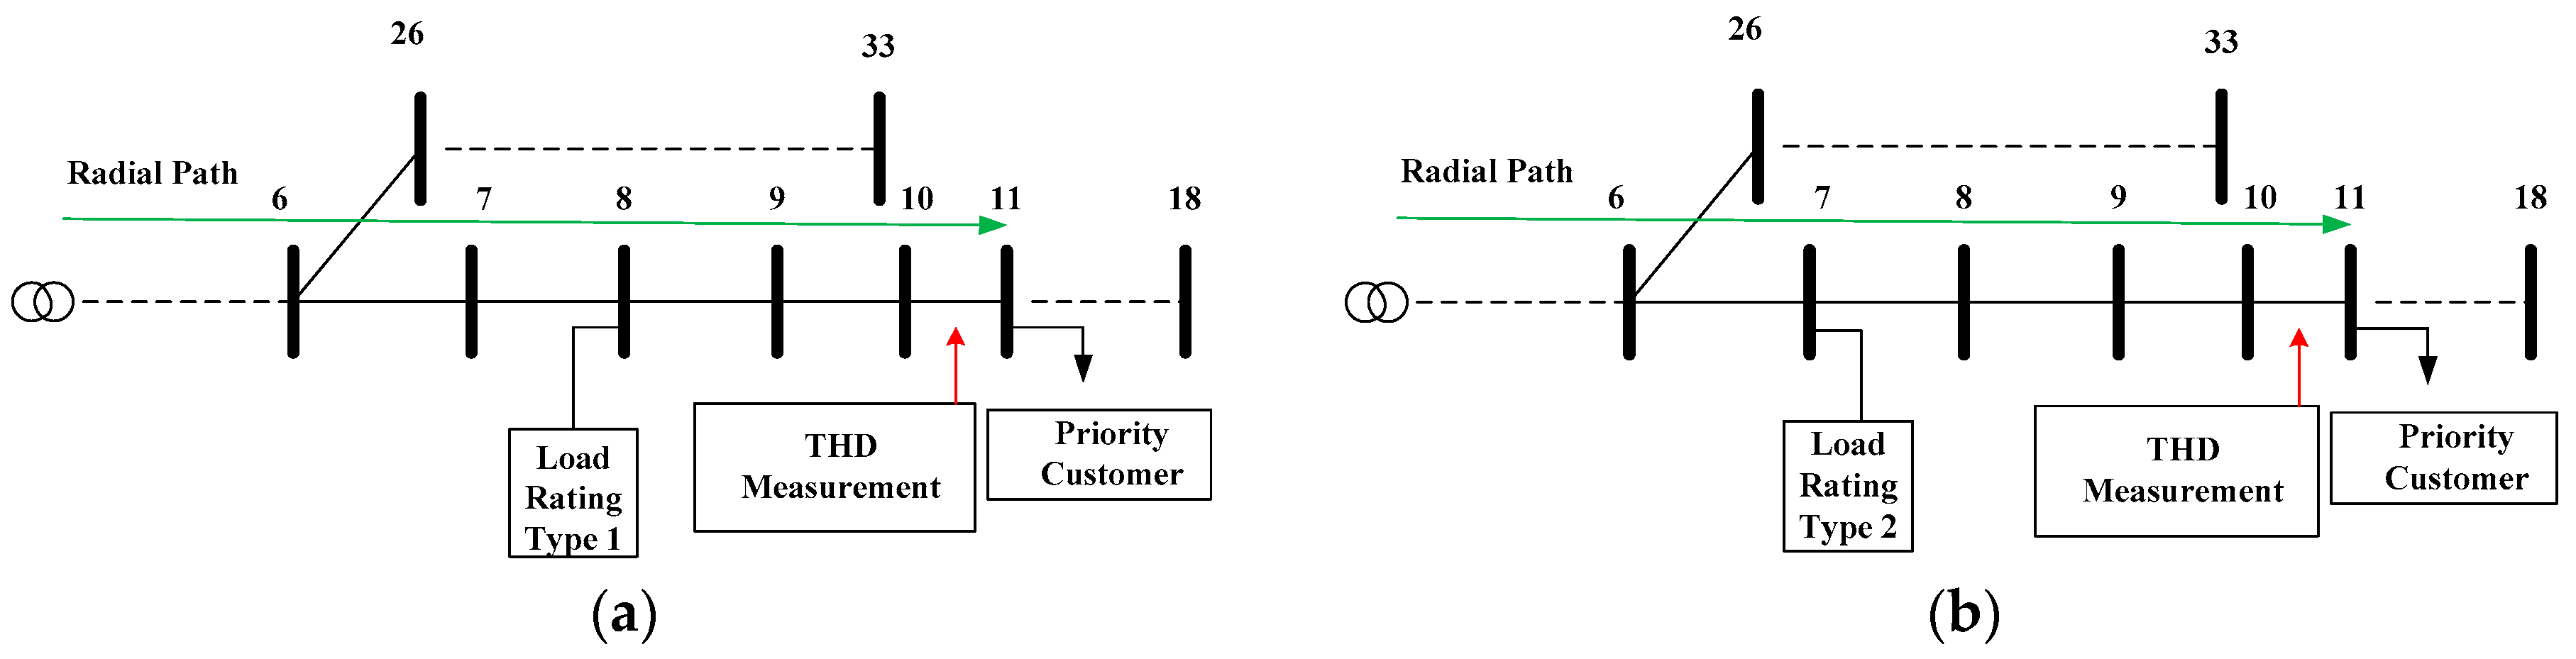
2.1.3. Non-Linear Load is Connected at Bus 8
2.1.4. Full Wave Rectifier Feeding 200 kW Resistive Load is Connected at Bus 7
3. Objectives and Constraints of Service Restoration Problem
Constraints of Service Restoration
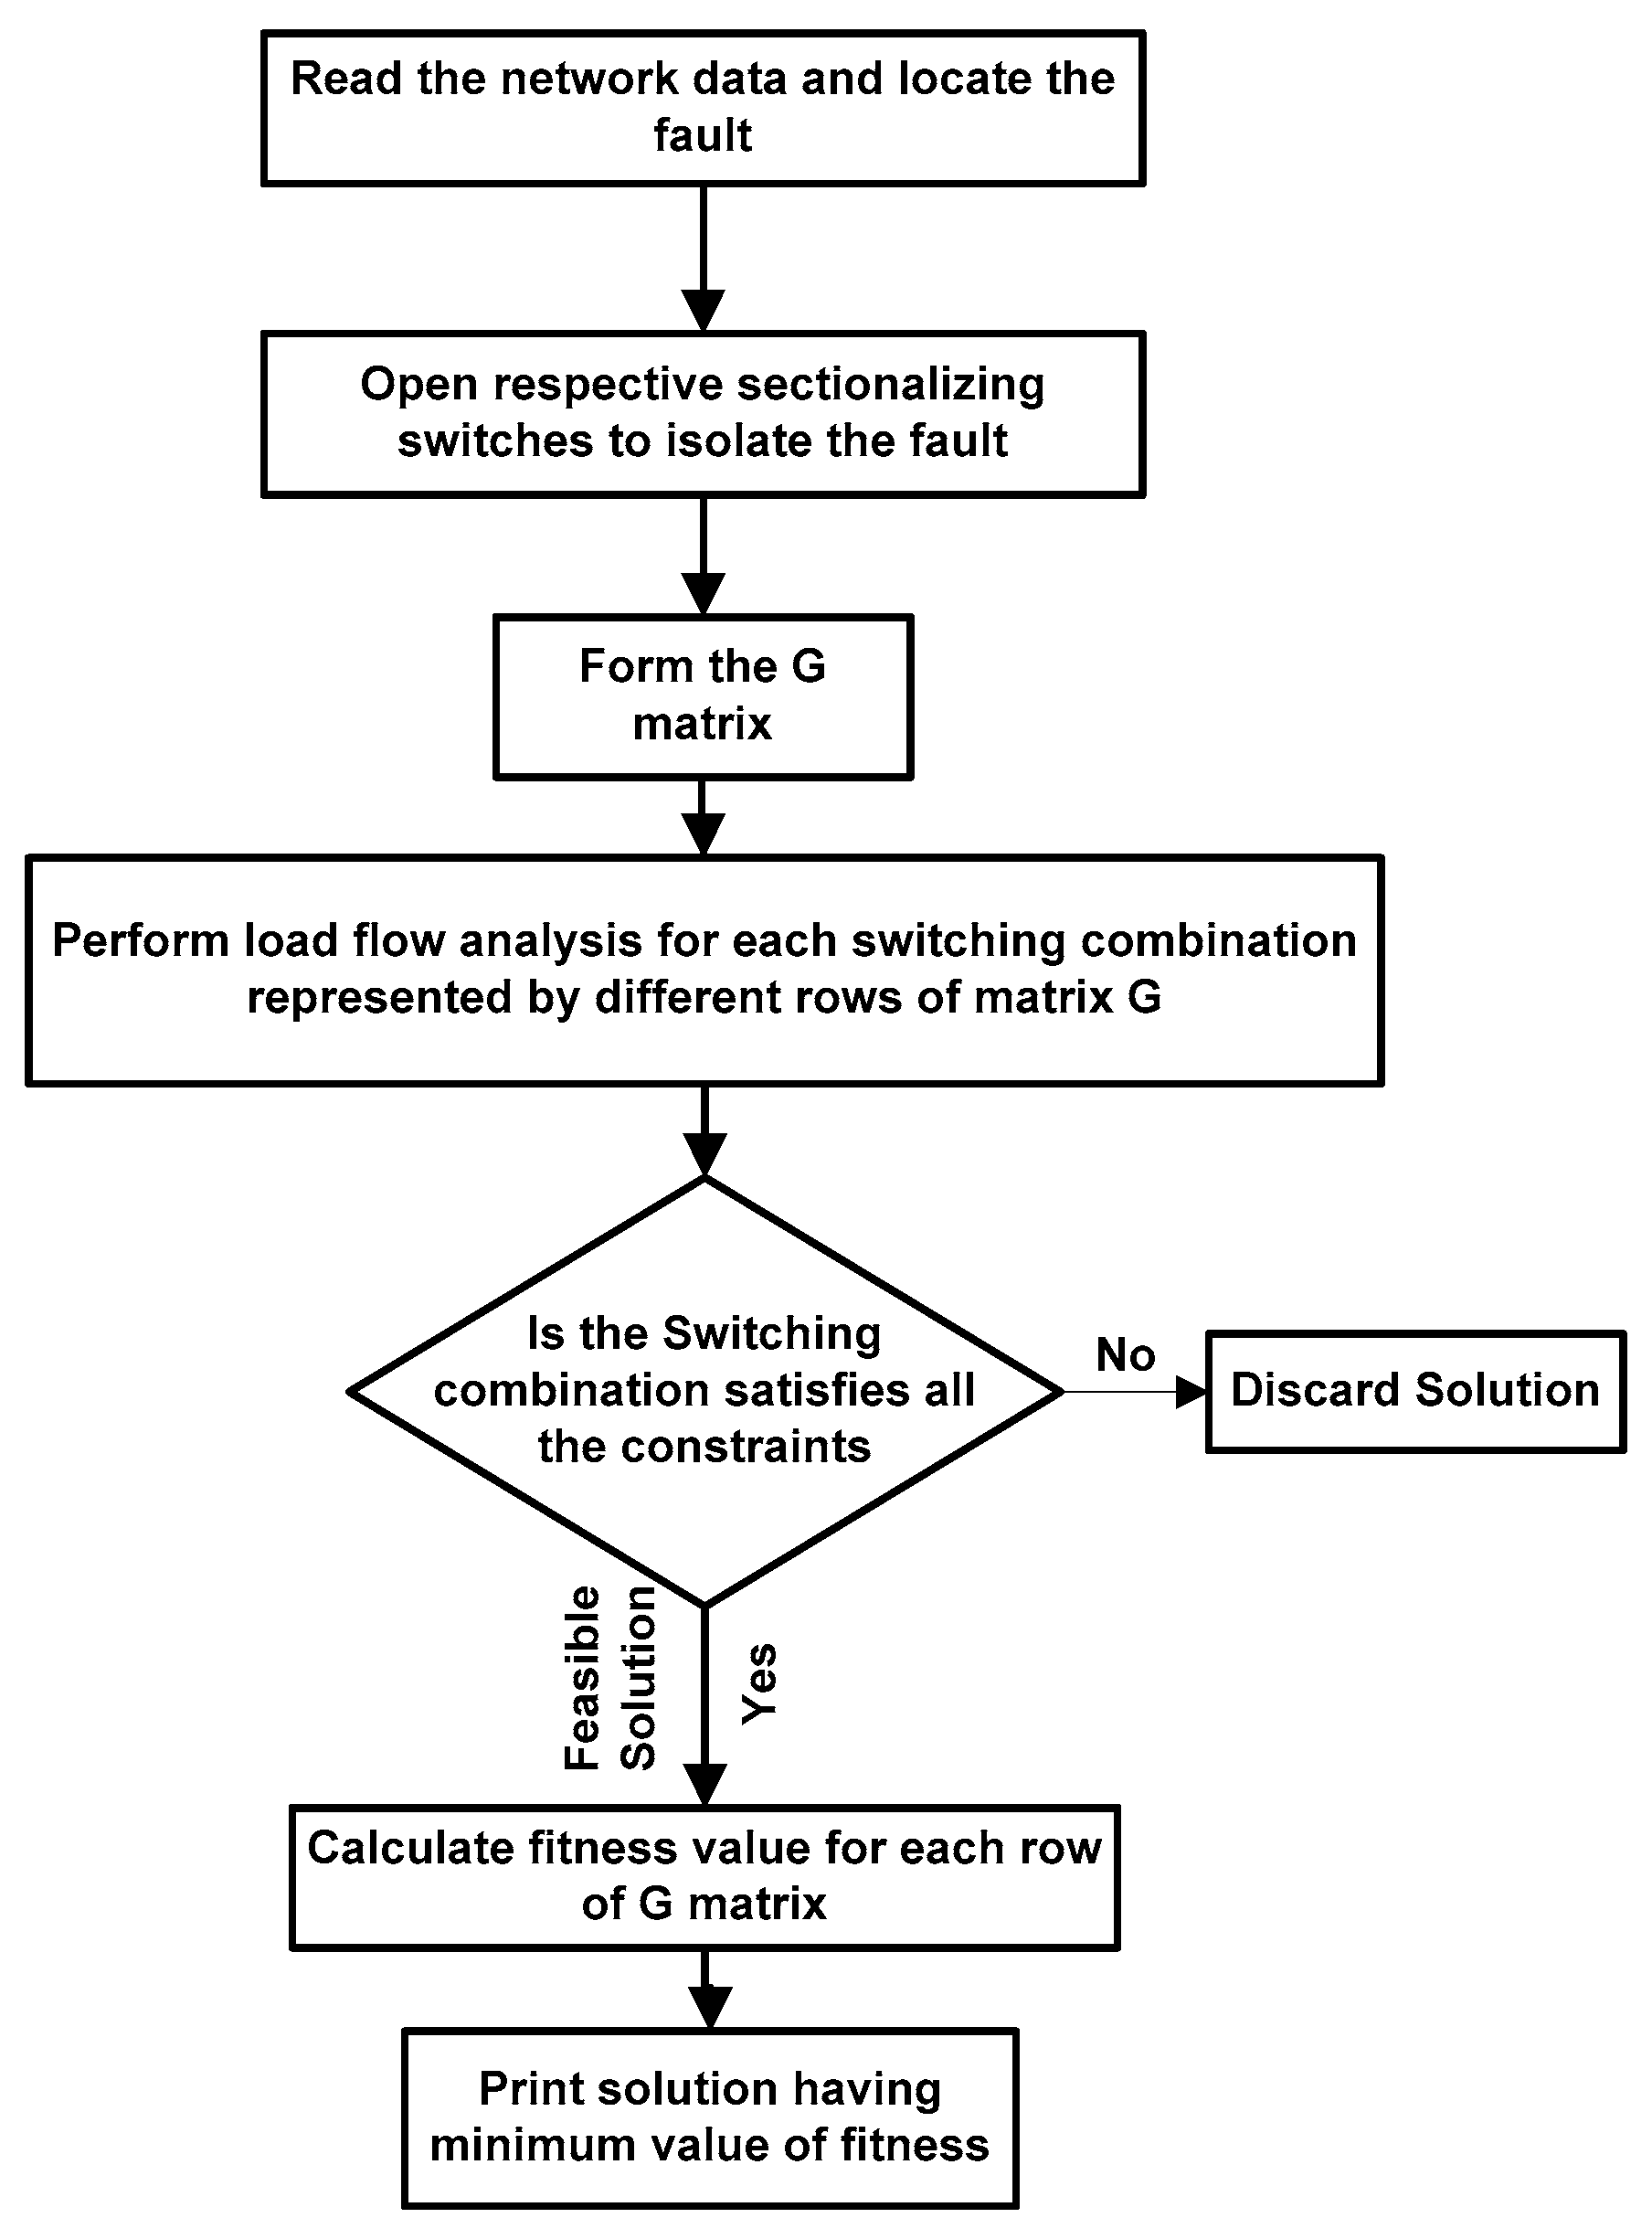
4. Methodology to Solve Service Restoration Problem
4.1. Multi-Objective Optimization
4.1.1. Concept of Dominance
- (a)
- the solution ‘x’ is no worse than solution ‘y’ in all objectives and
- (b)
- the ‘x’ is strictly better than ‘y’ in at least one objective.
4.1.2. Pareto Front
4.1.3. Repository
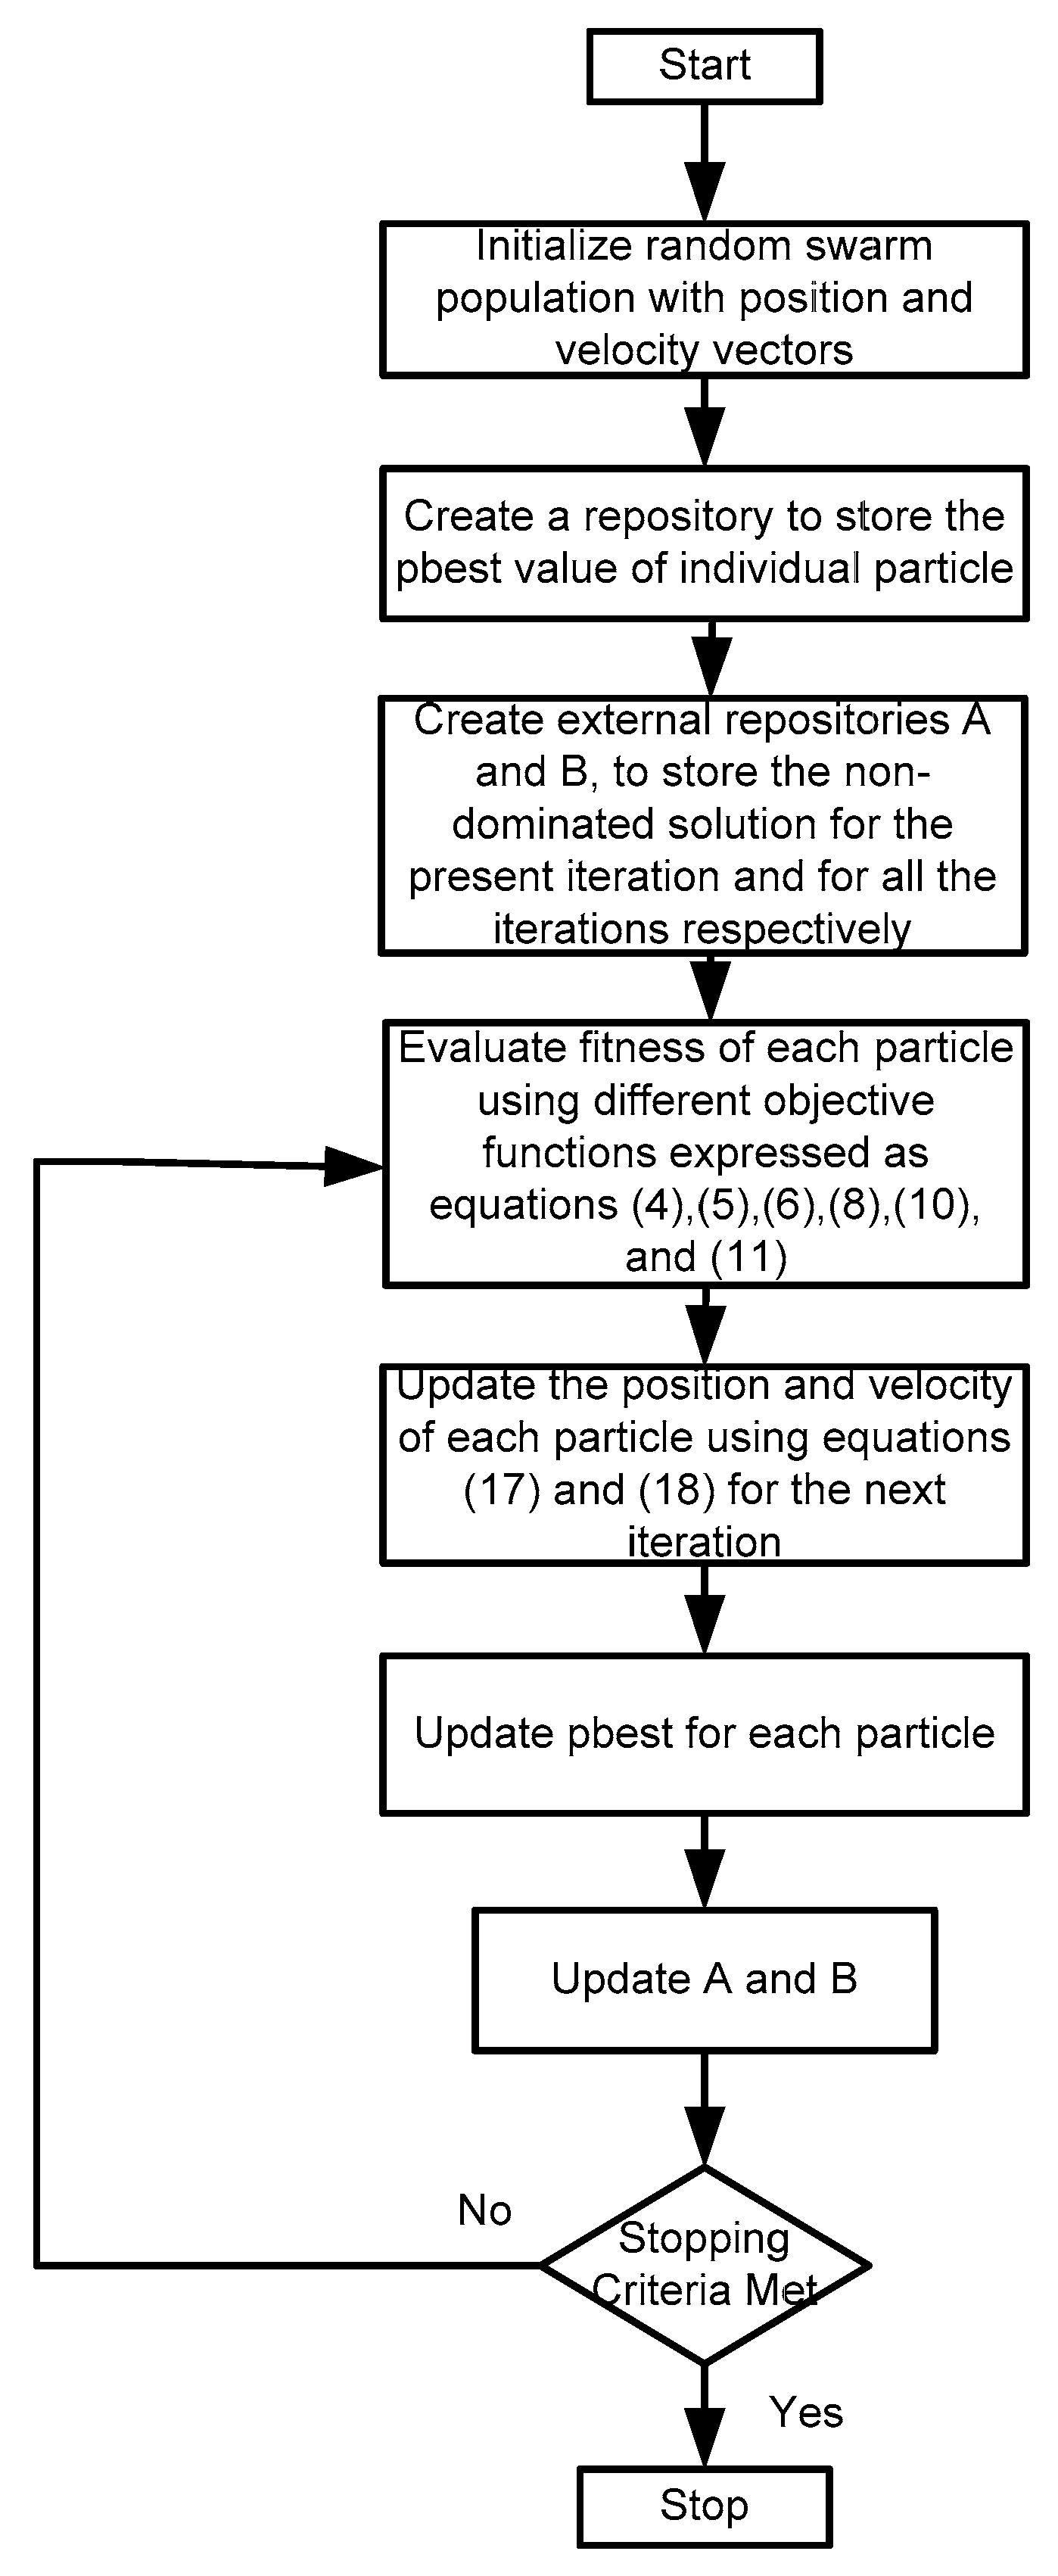
4.2. Multi-Objective Particle Swarm Optimization
- (a)
- Initialize the swarm population with random particles (all constrained must be fulfilled by each particle). For the present problem, the particle represents the switching status of the network.
- (b)
- (b) Evaluate the fitness values f1, f2, f3, f4, f5, and f6 for each candidate in the swarm population.
- (c)
- Create an external repository to store the set of non-dominated solutions having the best fitness values from the initial population.
- (d)
- Select a leader for each particle in the population randomly. The leader fitness value is more than that of particle fitness value.
- (e)
- Calculate new position and velocity of particles from basic PSO formulation given in (17) and (18).
- (f)
- Again form the Pareto optimal set for the new obtained population by evaluating the fitness of each particle.
- (g)
- Repeat the steps from (b) to (f) for 100 iterations.
- (h)
- Print the Pareto optimal set.
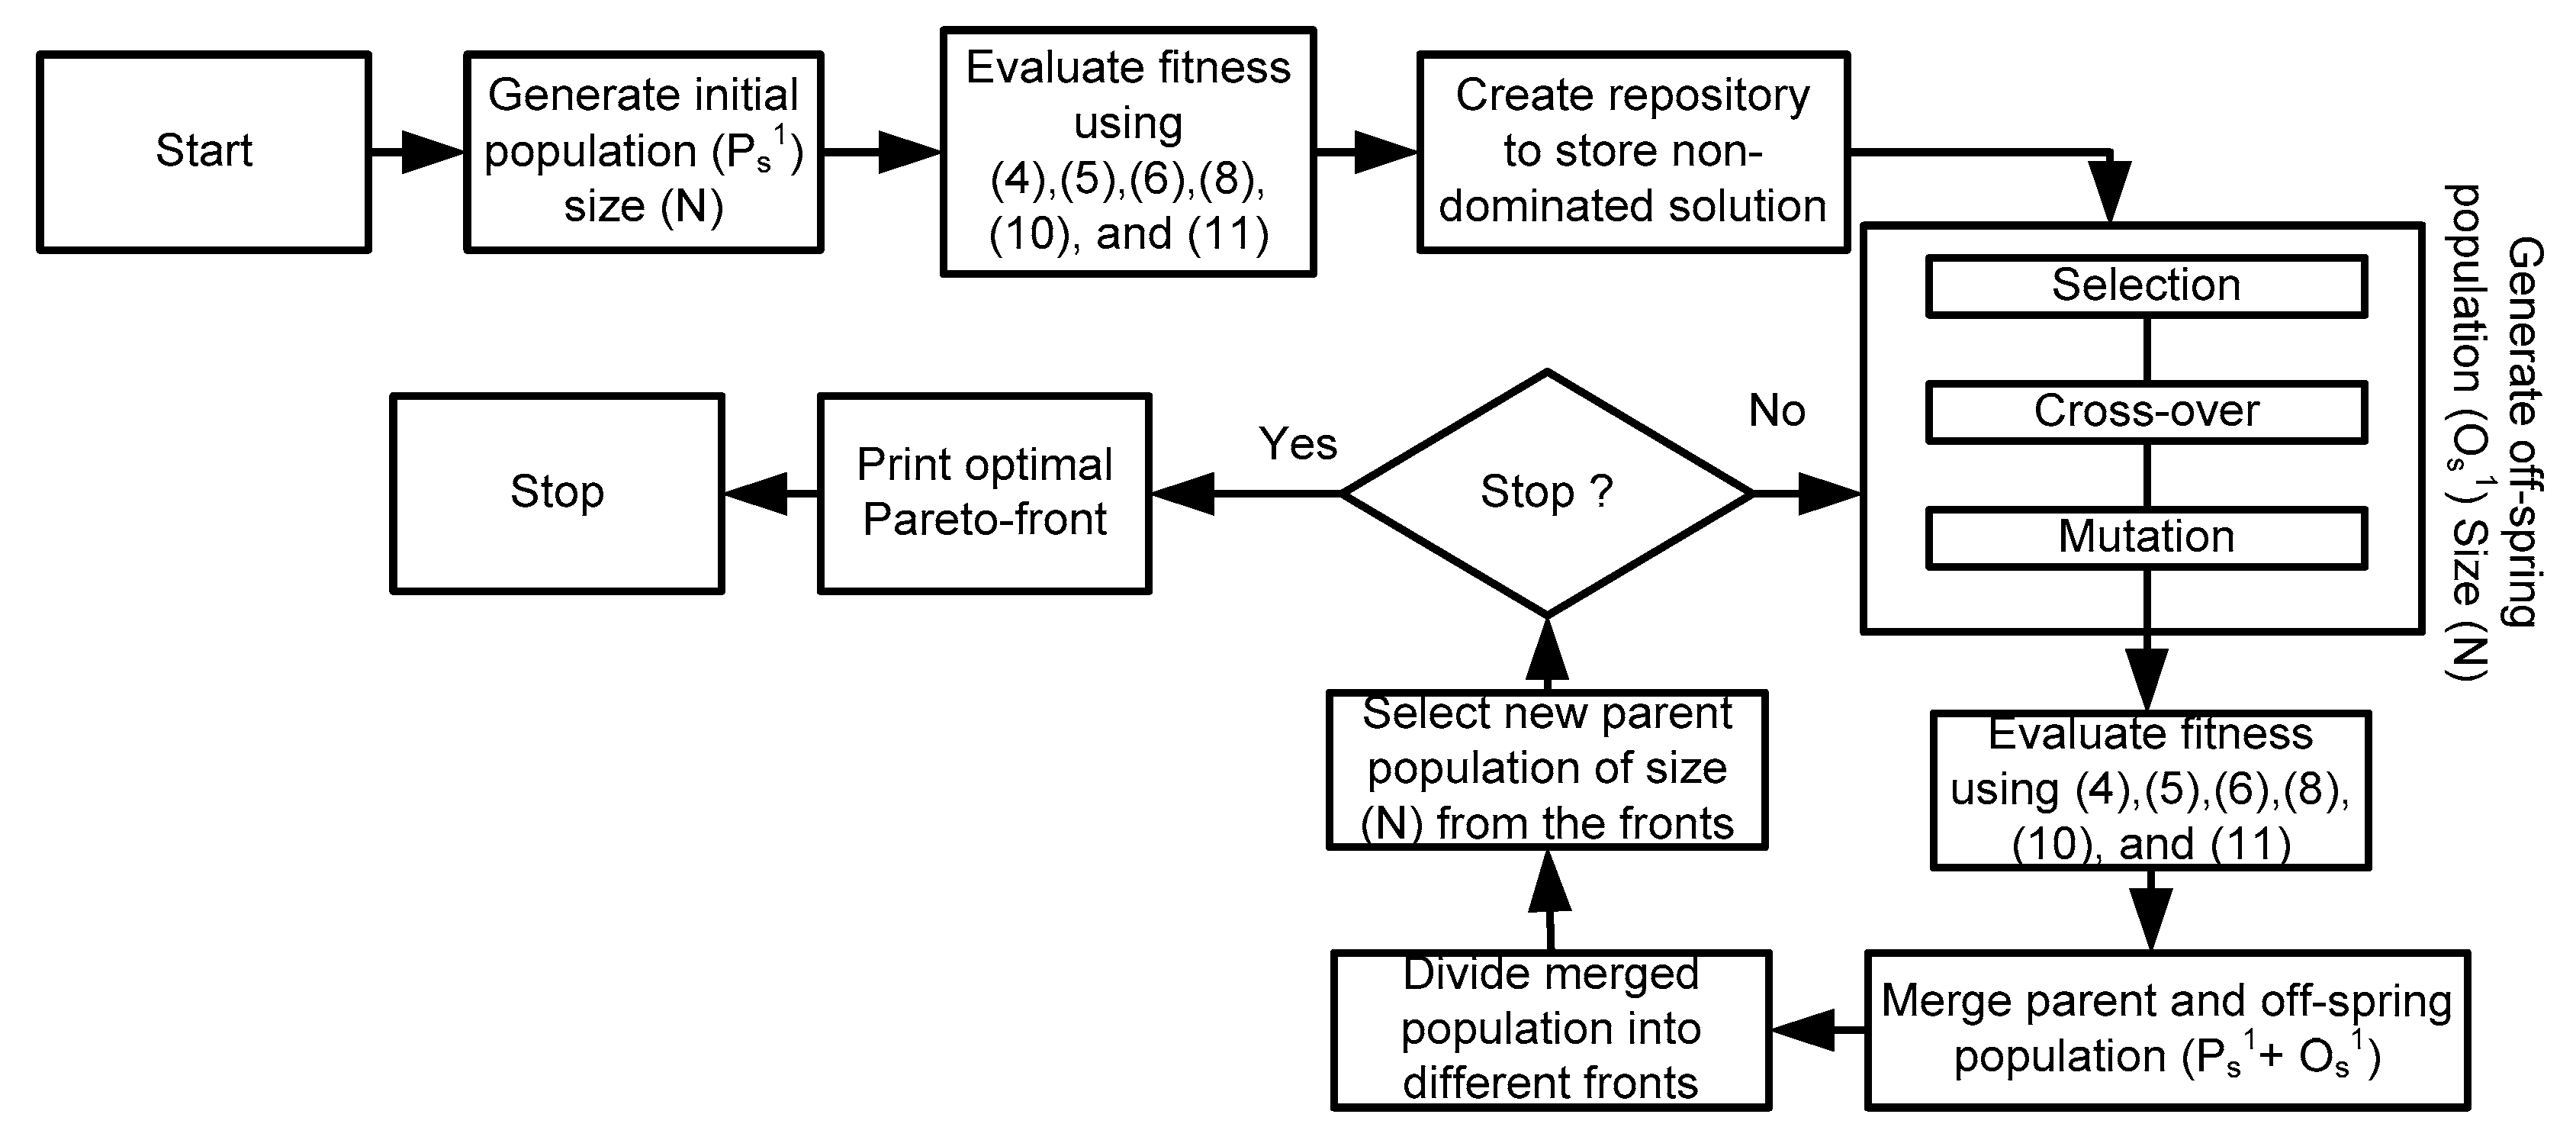
4.3. Non-Dominated Sorting Genetic Algorithm-II
- (a)
- The initial requisite for implementing NSGA-II is that the pre-fault configuration and system data should be known.
- (b)
- Generate initial population Ps1 randomly. A string consisting of switching sequence represents parents in the initial population. All the candidates must satisfy the electrical and topological constraints.
- (c)
- Evaluate the fitness values f1, f2, f3, f4, f5, and f6 for each candidate in the parent population.
- (d)
- Generate offspring population Os1 from parent population using single point crossover and mutation operators. A mating pool must be formed for Os using Crowded Tournament Selection Operator (CTSO).
- (e)
- Merge the two matrices Ps1 and Os1 to form a new matrix Rs1. It is evident that if the size of parent and offspring population is N, then the size of Rs will be 2N.
- (f)
- Divide the candidates present in the Rs into different fronts based on the fitness values.
- (g)
- Form new parent population from the fronts obtained in step (f). The size of the new population should also be N.
- (h)
- Repeat the steps (c) to (g) for further iterations.
- (i)
- After the end of the 100th iteration (which is the convergence criteria here), print the candidate with the best fitness present in the Rs100 matrix.
5. Results and Discussion
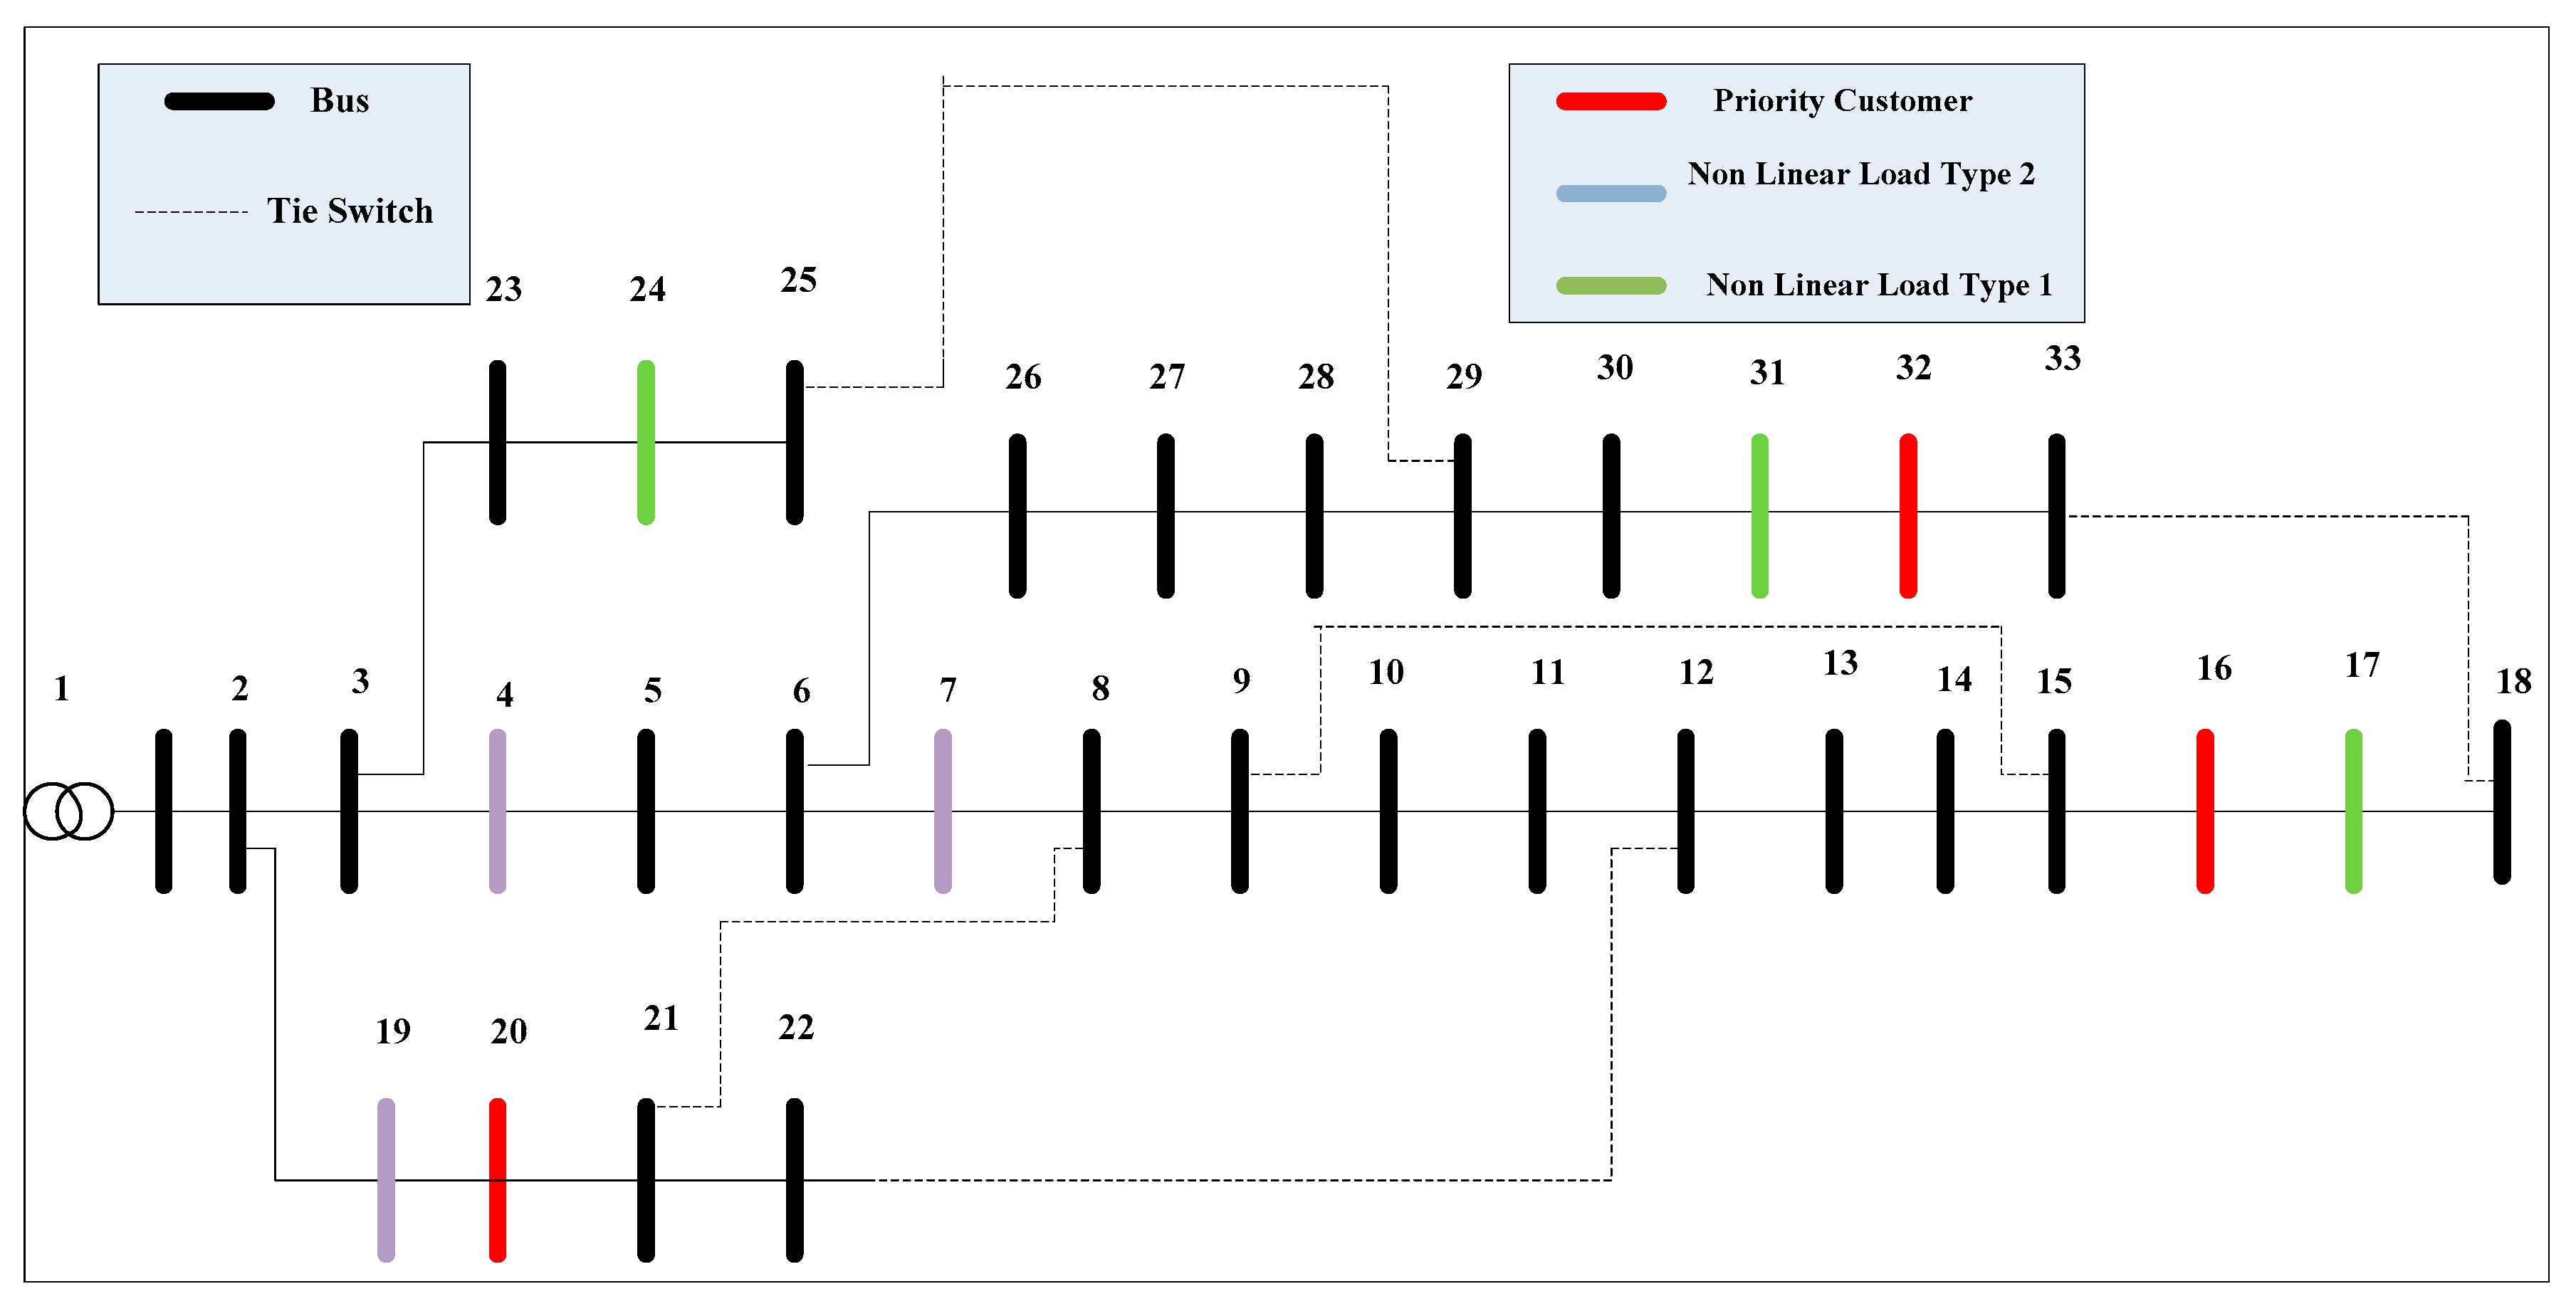
5.1. Case 1: IEEE 33 Bus Test System
- Priority Customers (PC) are assumed to be present at bus 16 (PC1), bus 20 (PC2), and bus 32 (PC3)
- The switch between two buses A and B is represented as S (A, B)
- Full wave rectifier supplying a resistive load of 150 kW is connected to bus 17,24,31
- Full wave rectifier supplying a resistive load of 200 kW is connected to bus 4,7,19
5.1.1. When the Fault Occurs Between Bus 10 and 11
Service Restoration through MOPSO
Service Restoration through NSGA-II
5.1.2. When the Fault Occurs Between Bus 7 and 8
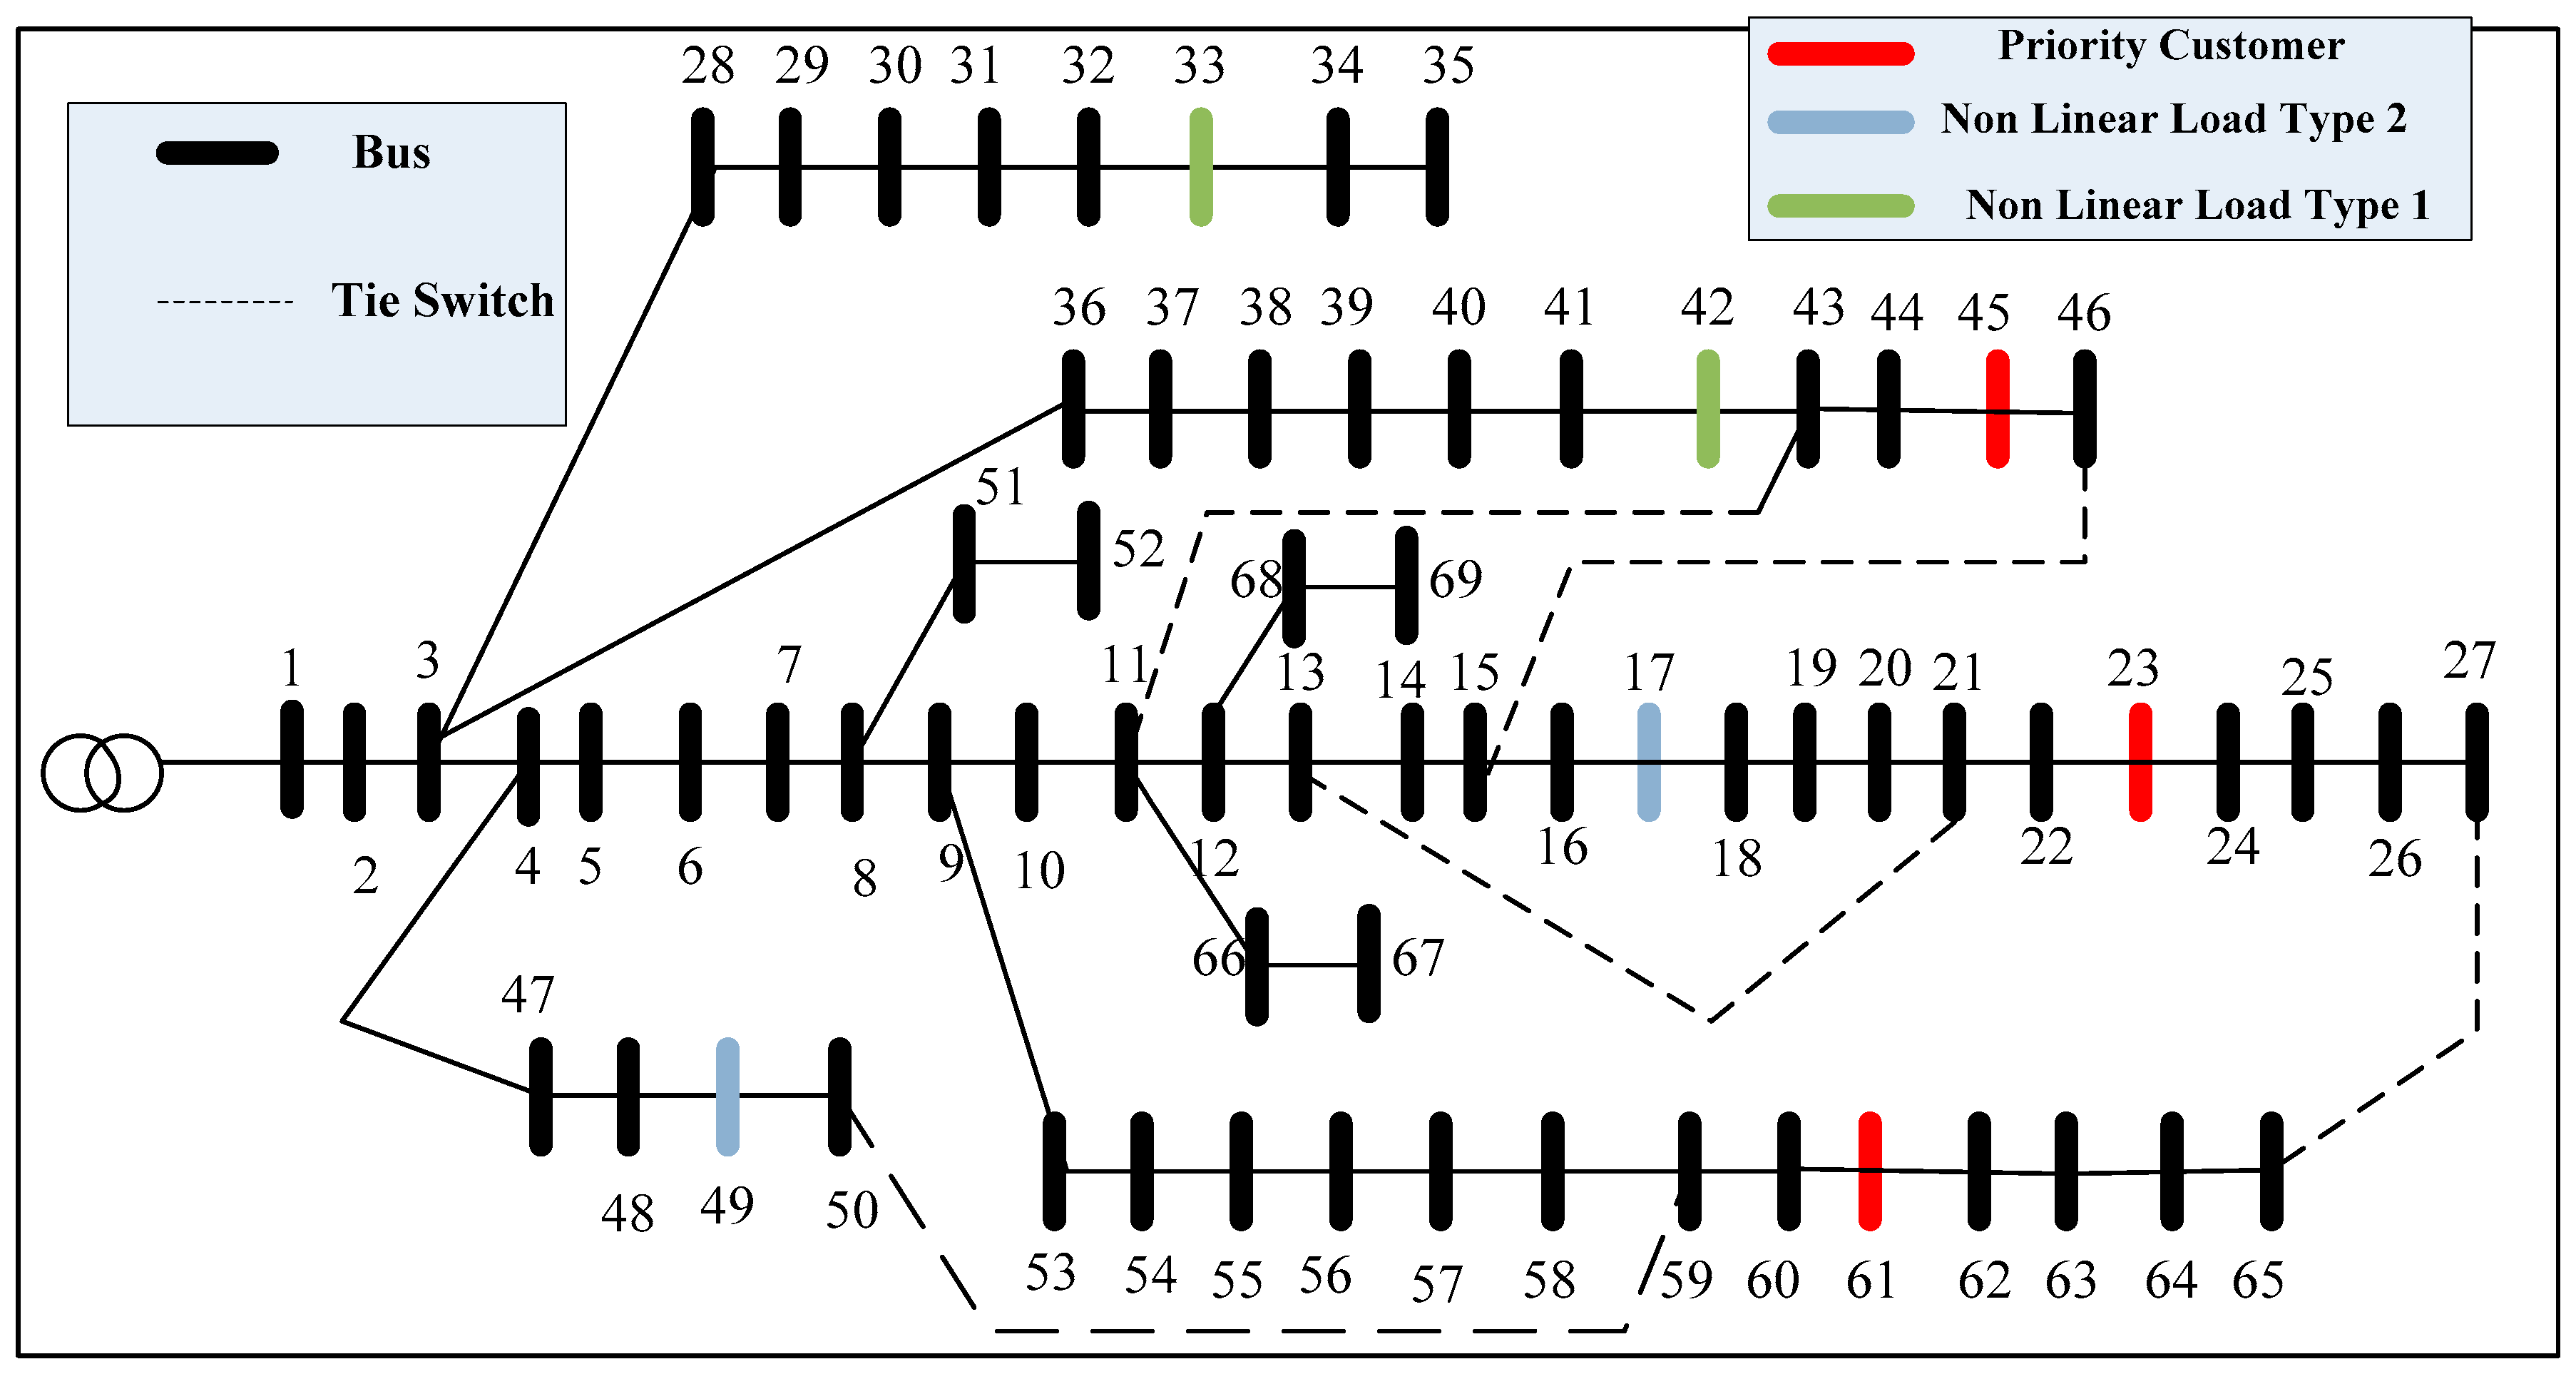
5.2. Case 2: IEEE 69 Bus Test System
- For this case study, non-linear loads are connected at bus no. 17,33,42,49 (Figure 10)
- Priority customers are present at bus 23,45,61
- Switch between two buses A and B is represented as S (A, B)
- Full wave rectifier supplying a resistive load of 150 kW is connected to bus 33,42
- Full wave rectifier supplying a resistive load of 200 kW is connected to bus 17,49
6. Conclusions
Author Contributions
Funding
Conflicts of Interest
References
- US Department of Energy. Development of Advanced Methods for Planning Electric Energy Distribution Systems; Contract ET-78-C-03-1845; Systems Control, Inc.: Washington, DC, USA, 1980. [Google Scholar]
- Taylor, T.; Lubkeman, D. Implementation of Heuristic Search Strategies for Distribution Feeder Reconfiguration. IEEE Trans. Power Deliv. 1990, 1, 239–246. [Google Scholar] [CrossRef]
- Morelato, A.L.; Monticelli, A. Heuristic Search Approach to Distribution System Restoration. IEEE Trans. Power Deliv. 1989, 4, 2235–2241. [Google Scholar] [CrossRef]
- Baran, M.E.; Wu, F.F. Network Reconfiguration in Distribution Systems for Loss Reduction and Load Balancing. IEEE Trans. Power Deliv. 1989, 4, 1401–1407. [Google Scholar] [CrossRef]
- Aoki, K.; Kuwabara, H.; Satoh, T.; Kanezashi, M. An Efficient Algorithm for Load Balancing of Transformers and Feeders by Switching Operation in Large Scale Distribution Systems. IEEE Trans. Power Deliv. 1988, 3, 1865–1872. [Google Scholar] [CrossRef]
- Kuwabara, K.A.H.; Satoh, T.; Kanezashi, M. Outage State Optimal Load Allocation by Automatic Sectionalizing Switching Operation in Distribution Systems. IEEE Trans. Power Deliv. 1987, 2, 1177–1185. [Google Scholar]
- Laun, W.P.; Irving, M.R.; Denial, J.S. Genetic algorithm for supply restoration and optimal load shedding in power system distribution networks. IEE Proc. Gener. Trans. Dis. 2002, 149, 145–151. [Google Scholar] [CrossRef]
- Kumar, Y.; Das, B.; Sharma, J. Multiobjective, multiconstraint service restoration of electrical power distribution system with priority customers. IEEE Trans. Power Deliv. 2008, 23, 261–270. [Google Scholar] [CrossRef]
- Toune, S.; Fudo, H.; Genji, T.; Fukuyama, Y.; Nakanishi, Y. A reactive tabu search for service restoration in electric power distribution system. In Proceedings of the IEEE World Congress on Computational Intelligence, Anchorage, AK, USA, 4–9 May 1998; pp. 763–768. [Google Scholar]
- Lambert-Torres, G.; Martins, H.G.; Coutinho, M.P.; Salomon, C.P.; Vieira, F.C. Particle Swarm Optimization Applied to System Restoration. In Proceedings of the 2009 IEEE Bucharest PowerTech, Bucharest, Romania, 28 June–2 July 2009. [Google Scholar]
- Wu, W.C.; Tsai, M.S. Application of Enhanced Integer Coded Particle Swarm Optimization for Distribution System Feeder Reconfiguration. IEEE Trans. Power Syst. 2011, 26, 1591–1599. [Google Scholar] [CrossRef]
- Isamu, W. An ACO algorithm for service restoration in power distribution systems. In Proceedings of the 2005 IEEE Congress on Evolutionary Computation, Edinburgh, UK, 2–5 September 2005; Volume 3, pp. 2864–2871. [Google Scholar]
- Lu, Z.; Wen, Y.; Yang, L. An Improved ACO Algorithm for Service Restoration in Power Distribution Systems. In Proceedings of the 2009 Asia-Pacific Power and Energy Engineering Conference, Wuhan, China, 27–31 March 2009; pp. 1–4. [Google Scholar]
- Kuo, H.C.; Hsu, Y.Y. Distribution system load estimation and service restoration using a fuzzy set approach. IEEE Trans. Power Syst. 1993, 8, 1950–1957. [Google Scholar]
- Huang, C.H. Multi-objective service restoration of distribution systems using fuzzy cause-effect networks. IEEE Trans. Power Syst. 2003, 18, 867–874. [Google Scholar] [CrossRef]
- Lee, S.J.; Lim, S.; Ahn, B.S. Service restoration of primary distribution systems based on fuzzy evaluation of Multi-criteria. IEEE Trans. Power Syst. 1998, 13, 1156–1163. [Google Scholar]
- Hsiao, Y.T.; Chien, C.Y. Enhancement of restoration service in distribution systems using a combination fuzzy-GA method. IEEE Trans. Power Syst. 2000, 15, 1394–1400. [Google Scholar] [CrossRef]
- Shin, D.J.; Kim, J.; Kim, T.K.; Choo, J.B.; Singh, C. Optimal service restoration and reconfiguration of network using Genetic Tabu algorithm. Electr. Power Syst. Res. 2004, 71, 145–152. [Google Scholar] [CrossRef]
- Augugliaro, A.; Dusonchet, L.; Sanseverino, R. Service restoration in compensated distribution networks using a hybrid genetic algorithm. Electr. Power Syst. Res. 1998, 46, 59–66. [Google Scholar] [CrossRef]
- Mori, H.; Tani, H. A hybrid method of PTS and ordinal optimization for distribution system service restoration. In Proceedings of the IEEE International Conference on Systems, Man and Cybernetics, Washington, DC, USA, 8 October 2003; pp. 3476–3483. [Google Scholar]
- Fukuyama, Y.; Endo, H.; Nakanishi, Y. A hybrid system for service restoration using expert system and genetic algorithm. In Proceedings of the Intelligent Systems Applications to Power Systems, Orlando, FL, USA, 28 January–2 February 1996; pp. 394–398. [Google Scholar]
- Siqing, S.; Youjiang, S.; Yan, L.; Wenqin, Z.; Yihan, Y. Integrating genetic algorithm with expert system for service restoration in distribution system. IEEE Trans. Power Syst. 1998, 1, 265–269. [Google Scholar]
- Liu, C.C.; Lee, S.J.; Venkata, S.S. An expert system operational aid for restoration and loss reduction of distribution systems. IEEE Trans. Power Syst. 1988, 3, 619–626. [Google Scholar] [CrossRef]
- Zhang, Z.Z.; Hope, G.S.; Malik, O.P. A knowledge base approach to optimize the switching in substation. IEEE Trans. Power Deliv. 1990, 5, 103–109. [Google Scholar] [CrossRef]
- Solanki, J.M.; Khushalani, S.; Schulz, N.N. A Multi-Agent Solution to Distribution Systems Restoration. IEEE Trans. Power Syst. 2007, 22, 1026–1034. [Google Scholar] [CrossRef]
- Zhang, L.; Sun, L. Multi-Objective Service Restoration for Blackout of Distribution System with Distributed Generators based on Multi-Agent GA. Energy Procedia 2011, 12, 253–262. [Google Scholar] [CrossRef]
- Lo, Y.L.; Wang, C.H.; Lu, C.N. A Multi-Agent Based Service Restoration in Distribution Network with Distributed Generations. In Proceedings of the International Conference on Intelligent System Applications to Power Systems, Curitiba, Brazil, 8–12 November 2009; pp. 1–5. [Google Scholar]
- Jabr, R.A.; Singh, R.; Pal, B.C. Minimum Loss Network Reconfiguration Using Mixed-Integer Convex Programming. IEEE Trans. Power Syst. 2012, 27, 1106–1115. [Google Scholar] [CrossRef]
- Li, Y.; Xiao, J.; Chen, C.; Tan, Y.; Cao, Y. Service Restoration Model with Mixed-Integer Second-Order Cone Programming for Distribution Network with Distributed Generations. IEEE Trans. Smart Grid 2018. [Google Scholar] [CrossRef]
- Nazerian, E.; Gharebaghi, S.; Safdarian, A. Optimal distribution network reconfiguration considering power quality issues. In Proceedings of the 2017 Smart Grid Conference (SGC), Tehran, Iran, 20–21 December 2017; pp. 1–6. [Google Scholar]
- Ch, Y.; Goswami, S.K.; Chatterjee, D. Effect of network reconfiguration on power quality of distribution system. Int. J. Electr. Power Energy Syst. 2016, 83, 87–95. [Google Scholar] [CrossRef]
- Cataliotti, A.; Cervellera, C.; Cosentino, V.; Di Cara, D.; Gaggero, M.; Macciò, D.; Marsala, G.; Ragusa, A.; Tinè, G. An Improved Load Flow Method for MV Networks Based on LV Load Measurements and Estimations. IEEE Trans. Instrum. Meas. 2019, 68, 430–438. [Google Scholar] [CrossRef]
- Cataliotti, A.; Cosentino, V.; Di Cara, D.; Tinè, G. LV Measurement Device Placement for Load Flow Analysis in MV Smart Grids. IEEE Trans. Instrum. Meas. 2016, 65, 999–1006. [Google Scholar] [CrossRef]
- Xygkis, T.C.; Korres, G.N. Optimal allocation of smart metering systems for enhanced distribution system state estimation. In Proceedings of the 19th Power Systems Computation Conference (PSCC), Genoa, Italy, 20–24 June 2016. [Google Scholar]
- Xygkis, T.C.; Korres, G.N. Optimized Measurement Allocation for Power Distribution Systems Using Mixed Integer SDP. IEEE Trans. Instrum. Meas. 2017, 66, 2967–2976. [Google Scholar] [CrossRef]
- Kong, X.; Chen, Y.; Xu, T.; Wang, C.; Yong, C.; Li, P.; Yu, L. A hybrid state estimator based on SCADA and PMU measurements for medium voltage distribution system. Appl. Sci. 2018, 8, 1527. [Google Scholar] [CrossRef]
- Pfajfar, T.; Blažič, B.; Papič, I. Methods for estimating customer voltage harmonic emission levels. In Proceedings of the 2008 13th International Conference on Harmonics and Quality of Power, Wollongong, NSW, Australia, 28 September–1 October 2008; pp. 1–6. [Google Scholar]
- Pfajfar, T.; Blažič, B.; Papič, I. Harmonic contributions evaluation with the harmonic current vector method. IEEE Trans. PowerDeliv. 2008, 23, 425–433. [Google Scholar] [CrossRef]
- Xu, W.; Liu, Y. A method for determining customer and utility harmonic contributions at the point of common coupling. IEEE Trans. PowerDeliv. 2000, 15, 804–811. [Google Scholar]
- International Electrotechnical Commission. Electromagnetic compatibility (EMC)–Part 3–6: Limits–Assessment of Emission Limits for the Connection of Distorting Installations to MV, HV and EHV Power Systems; IEC TR 61000-3-6: 2008; International Electrotechnical Commission: Geneva, Switzerland, 2008. [Google Scholar]
- Xu, W.; Liu, X.; Liu, Y. An investigation on the validity of power direction method for harmonic source determination. IEEE Trans. PowerDeliv. 2003, 18, 214–219. [Google Scholar] [CrossRef]
- Spelko, A.; Papic, I.; Djokic, S.Z. A voltage-only method for assessing harmonic contribution from a customer installation. In Proceedings of the International Conference on Harmonics and Quality of Power, ICHQP, Ljubljana, Slovenia, 13–16 May 2018; pp. 1–7. [Google Scholar]
- Coello, C.A.C.; Veldhuizen, D.A.V.; Lamont, G.B. Evolutionary Algorithms for Solving Multi-Objective Problems, 2nd ed.; Kluwer Academic Publishers: New York, NY, USA, 2007; pp. 1–19. [Google Scholar]
- Moore, J.; Chapman, R. Application of Particle Swarm to Multi Objective Optimization; Department of Computer Science and Software Engineering, Auburn University: Auburn, AL, USA, 1999. [Google Scholar]
- Ghasemi, S.; Moshtagh, J. Radial distribution systems reconfiguration considering power losses cost and damage cost due to power supply interruption of consumers. Int. J. Electr. Eng. Inform. 2013, 5, 297–315. [Google Scholar] [CrossRef]


| Optimization Algorithm | Switching Sequence | |
|---|---|---|
| On Switches | Off Switches | |
| MOPSO | S(12,22),S(9,15) | S(13,14),S(9,10),S(11,12),S(14,15) |
| NSGA-II | S(12,22),S(33,18),S(9,15) | S(16,17),S(9,10),S(11,12),S(12,13) |
| Out of Service Area Buses | 14 | |
| Manually Controlled Switching Operations | 4 | |
| Remotely Controlled Switching Operations | 2 | |
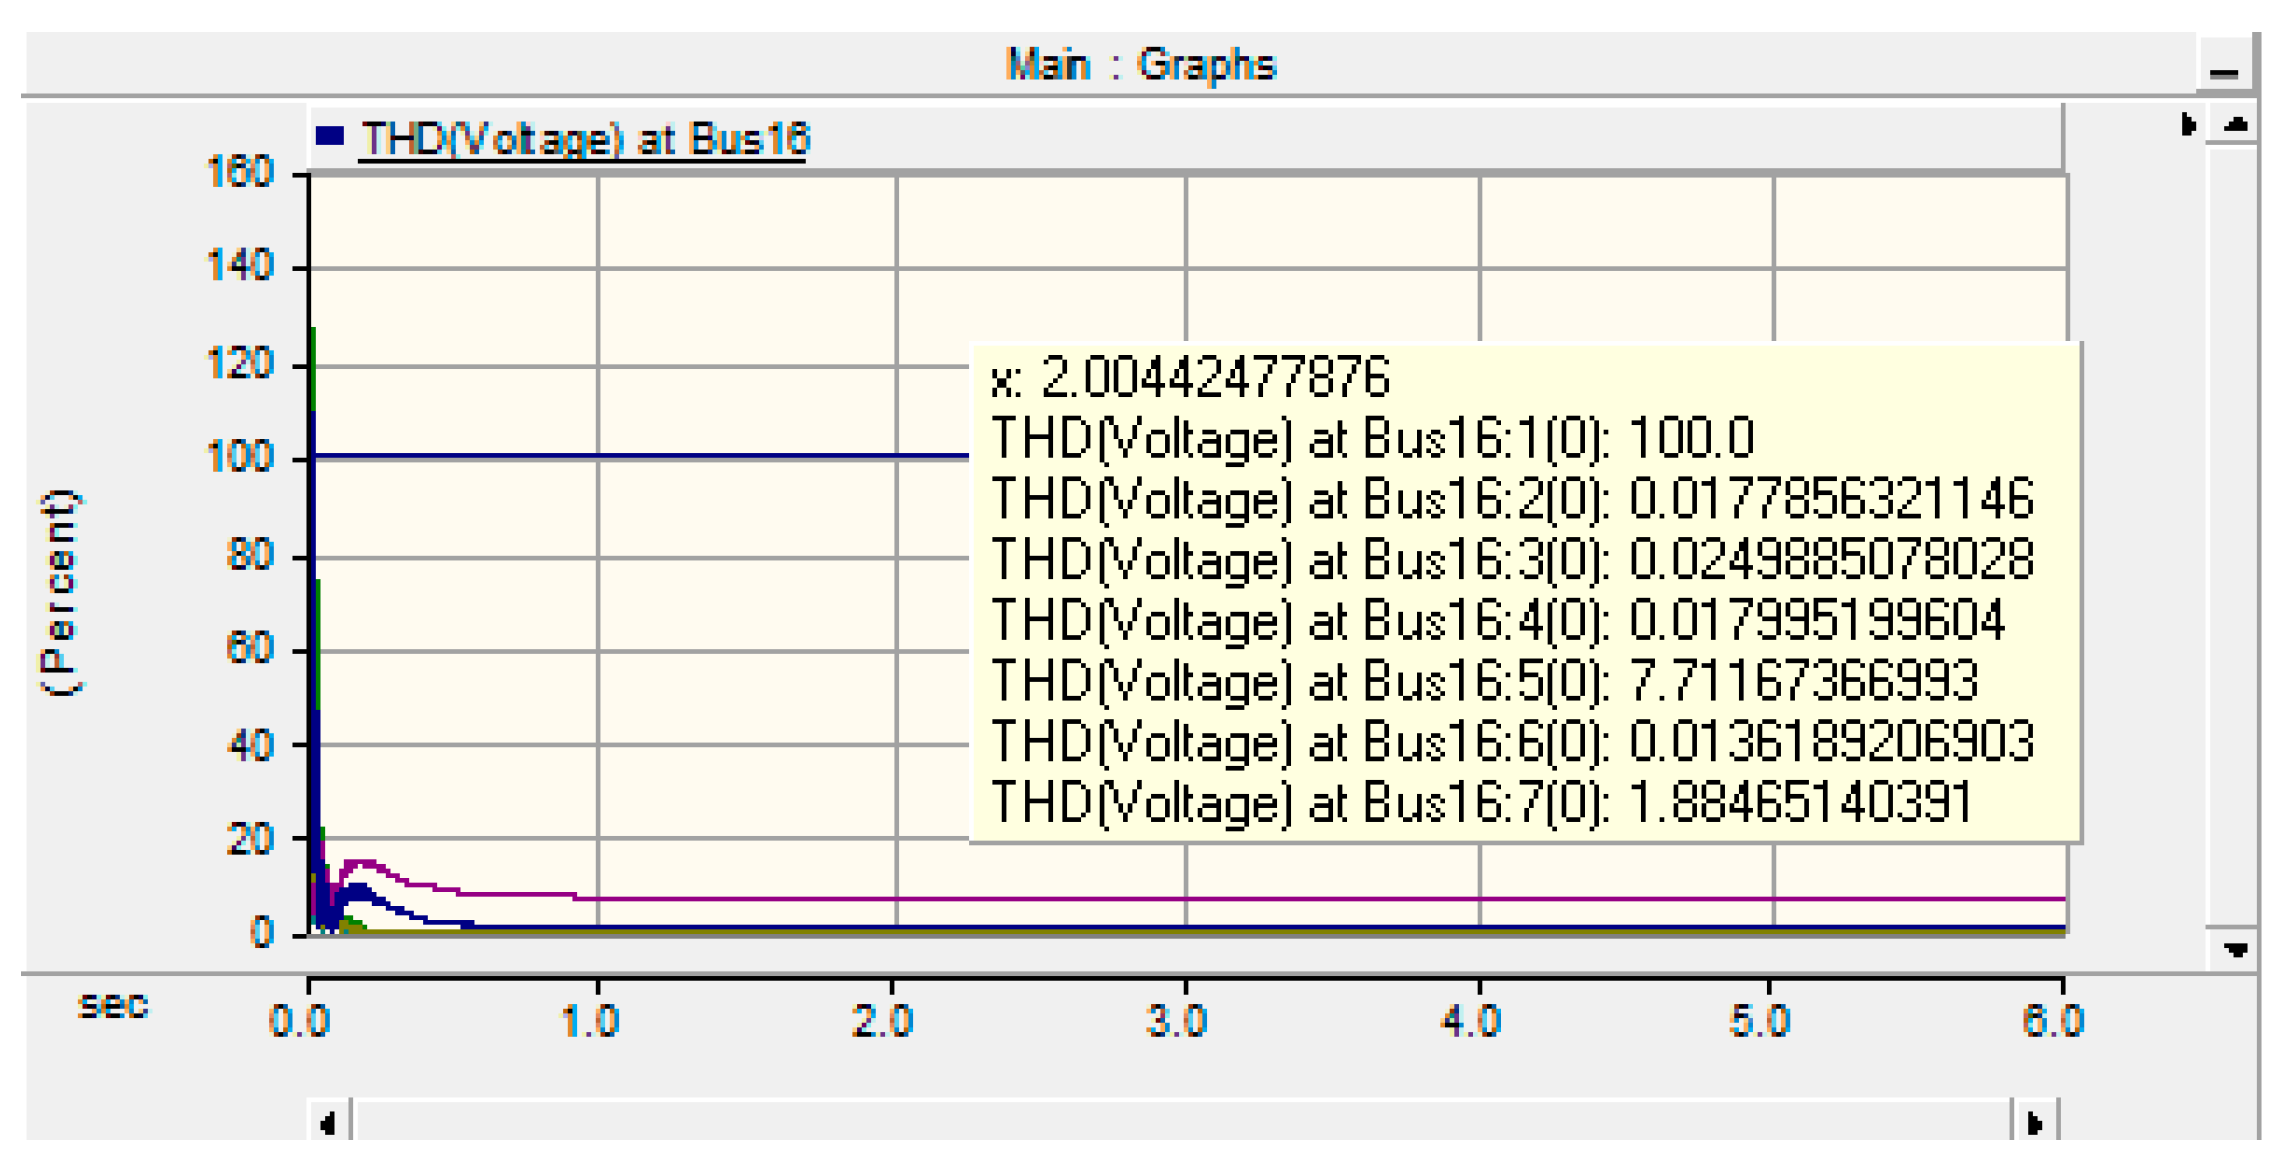
| THD (%) at Bus No. 16 | 3rd Harmonic Component | 0.02 |
| 5th Harmonic Component | 7.17 | |
| 7th Harmonic Component | 1.88 | |
| Total THD at Bus 16 | 9.94 | |
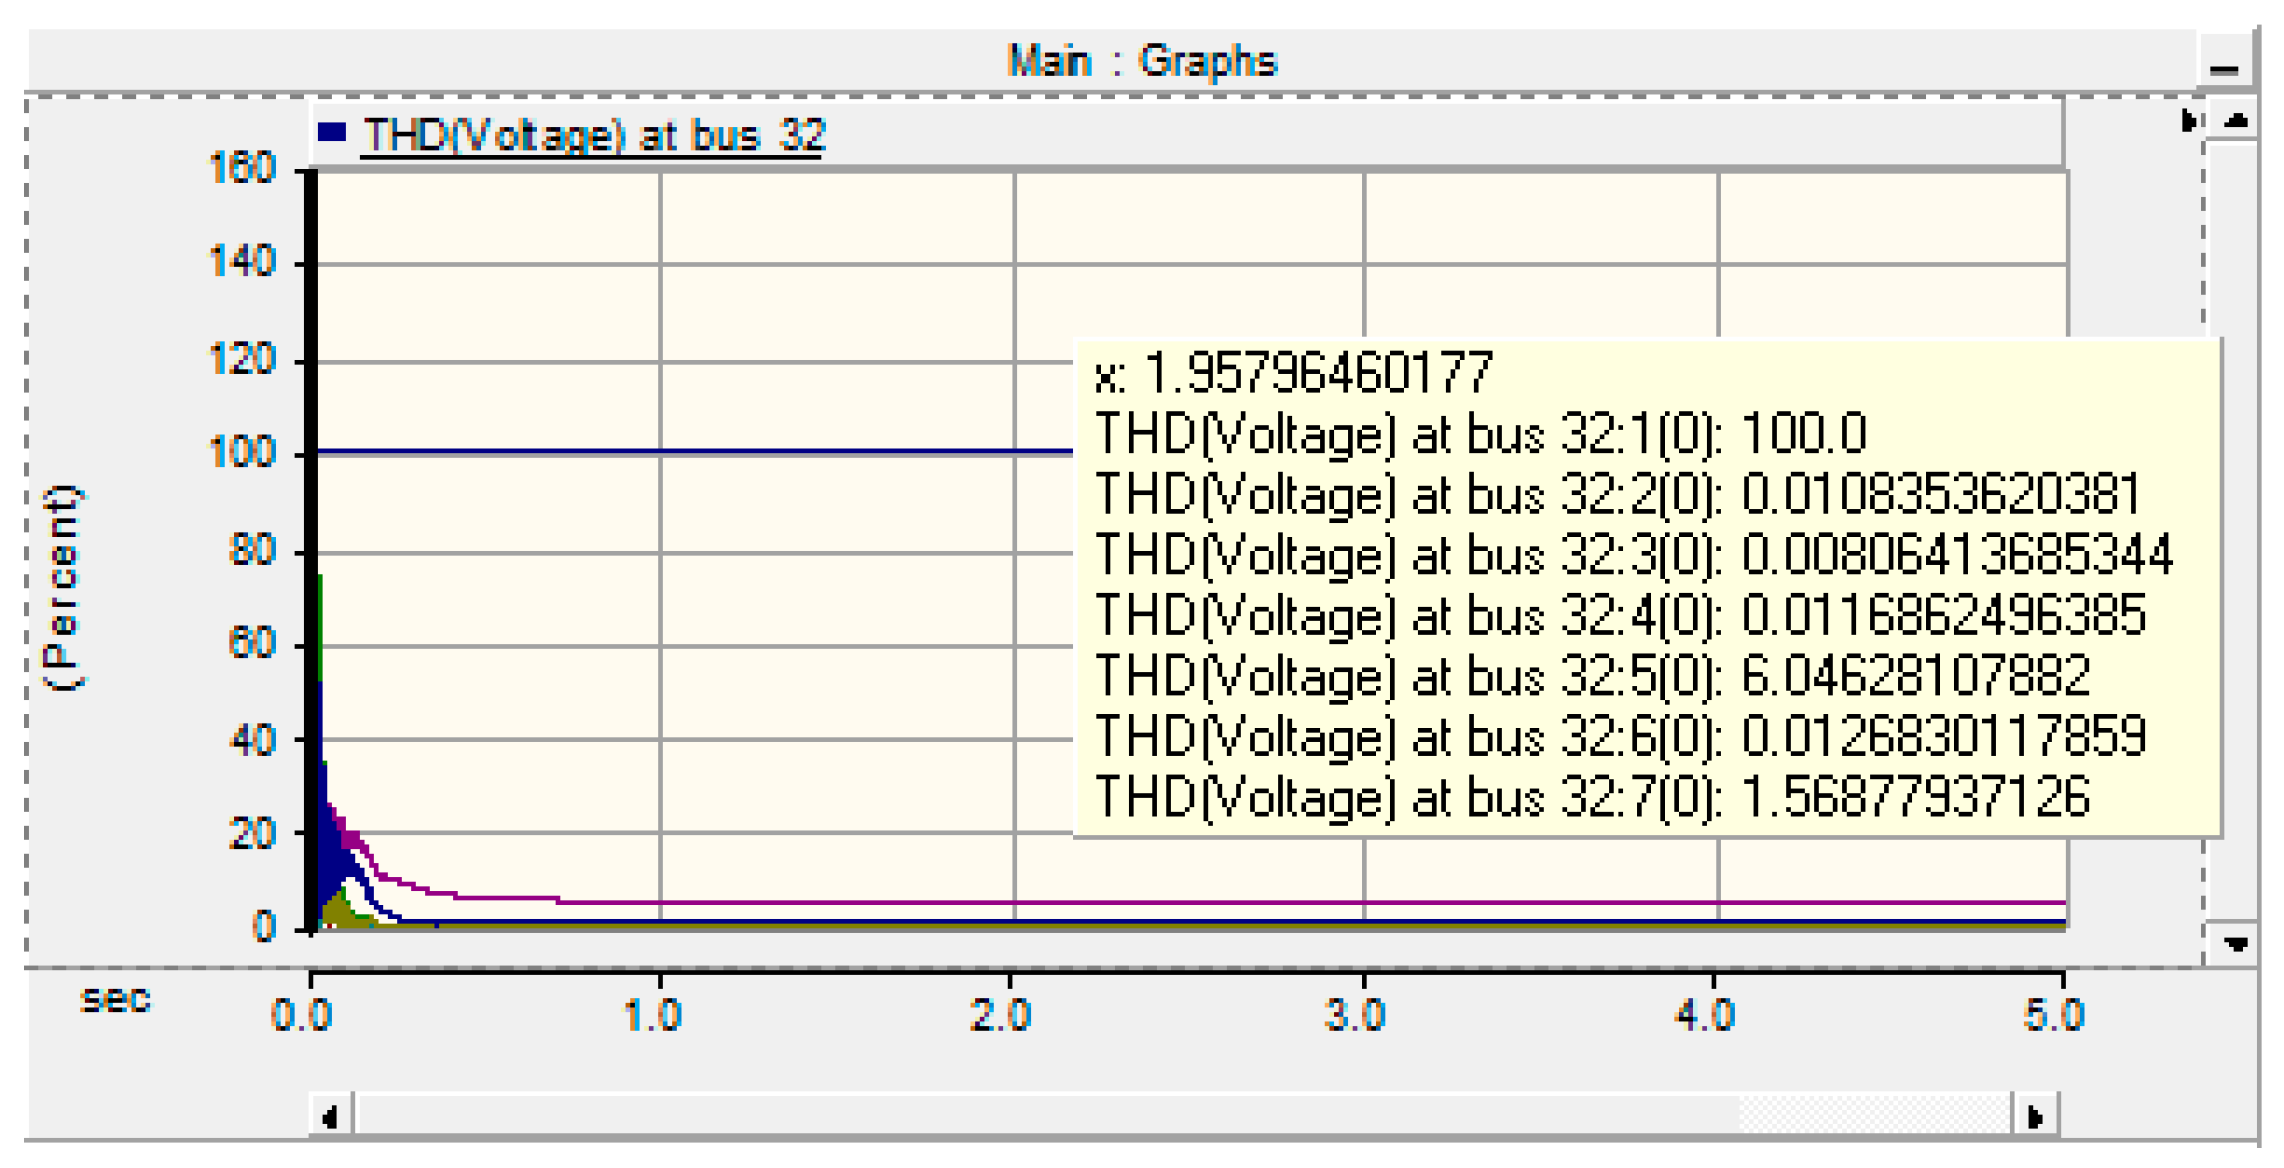
| THD (%) at Bus No. 32 | 3rd Harmonic Component | 0.01 |
| 5th Harmonic Component | 6.04 | |
| 7th Harmonic Component | 1.51 | |
| Total THD at Bus 32 | 6.25 | |
| THD (%) at Bus No. 20 | 3rd Harmonic Component | 0.00 |
| 5th Harmonic Component | 0.91 | |
| 7th Harmonic Component | 0.85 | |
| Total THD at Bus 20 | 1.24 | |
| Configuration | Initial Network Topology Total Number of Non-linear Load Connected | Restored Network Topology Total Number of Non-linear Load Connected | |||||
|---|---|---|---|---|---|---|---|
| PC | 150 kW Load | 200 kW Load | Total NLL | 150 kW Load | 200 kW Load | Total NLL | |
| PC at Bus 16 | 1 | 2 | 3 | 1 | 1 | 2 | |
| PC at Bus 32 | 1 | 1 | 2 | 1 | 0 | 1 | |
| PC at Bus 20 | 0 | 1 | 1 | 0 | 1 | 1 | |
| Fitness Value f4 | 3 | 1.9107 | |||||
| PC | Initial Network | Restored Network | |||||
|---|---|---|---|---|---|---|---|
| Non-Linear Load | PC at Bus 16 | PC at Bus 32 | PC at Bus 20 | PC at Bus 16 | PC at Bus 32 | PC at Bus 20 | |
| Distance of non-linear load at Bus 4 from | 8000 m | 5200 m | X | X | X | X | |
| Distance of non-linear load at Bus 7 from | 6650 m | X | X | X | X | X | |
| Distance of non-linear load at Bus 17 from | 1300 m | X | X | 1300 m | X | X | |
| Distance of non-linear load at Bus 19 from | X | X | 1500 m | 4500 m | X | 1500 m | |
| Distance of non-linear load at Bus 24 from | X | X | X | X | X | X | |
| Distance of non-linear load at Bus 31 from | X | 300m | X | X | 300 m | X | |
| Fitness value f5 | 0.0709 × 10⁻³ | 0.184 × 10⁻³ | |||||
| Out of Service Area Buses | 17,18 | |
| Manually Controlled Switching Operations | 4 | |
| Remotely Controlled Switching Operations | 3 | |
| THD (%) at Bus No. 16 | 3rd Harmonic Component | 0.03 |
| 5th Harmonic Component | 5.80 | |
| 7th Harmonic Component | 1.19 | |
| Total THD at Bus 16 | 5.25 | |
| THD (%) at Bus No. 32 | 3rd Harmonic Component | 0.07 |
| 5th Harmonic Component | 10.12 | |
| 7th Harmonic Component | 2.95 | |
| Total THD at Bus 32 | 7.73 | |
| THD (%) at Bus No. 20 | 3rd Harmonic Component | 0.00 |
| 5th Harmonic Component | 0.89 | |
| 7th Harmonic Component | 0.85 | |
| Total THD at Bus 20 | 1.24 | |
| Configuration | Initial Network Topology THD(Percent) | THD (Percent) by NSGA-II in Restored Network | THD (Percent) by MOPSO in Restored Network | |
|---|---|---|---|---|
| PC | ||||
| PC at Bus 16 | 8.06 | 5.25 | 7.94 | |
| PC at Bus 32 | 6.52 | 7.73 | 6.25 | |
| PC at Bus 20 | 1.24 | 1.24 | 1.12 | |
| Configuration | Restored Network Topology By NSGA-II | Restored Network Topology By MOPSO | |||||
|---|---|---|---|---|---|---|---|
| PC | 150 kW Load | 200 kW Load | Total NLL | 150 kW Load | 200 kW Load | Total NLL | |
| PC at Bus 16 | 1 | 2 | 2 | 1 | 1 | 2 | |
| PC at Bus 32 | 1 | 1 | 2 | 1 | 0 | 1 | |
| PC at Bus 20 | 0 | 1 | 1 | 0 | 1 | 1 | |
| Fitness Value f4 | 1.9107 | 1.9107 | |||||
| PC | Restored Network Topology By NSGA-II | Restored Network Topology By MOPSO | |||||
|---|---|---|---|---|---|---|---|
| Non-Linear Load | PC at Bus 16 | PC at Bus 32 | PC at Bus 20 | PC at Bus 16 | PC at Bus 32 | PC at Bus 20 | |
| Distance of non-linear load at Bus 4 from | 5800 m | X | X | X | X | X | |
| Distance of non-linear load at Bus 7 from | X | X | X | X | X | X | |
| Distance of non-linear load at Bus 17 from | 1300 m | X | X | 1300 m | X | X | |
| Distance of non-linear load at Bus 19 from | X | X | 1500 m | 4500 m | X | 1500 m | |
| Distance of non-linear load at Bus 24 from | X | X | X | X | X | X | |
| Distance of non-linear load at Bus 31 from | X | 300 m | X | X | 300 m | X | |
| Fitness value f5 | 0.1517 × 10⁻³ | 0.184 × 10⁻³ | |||||
| Optimization Algorithm | Switching Sequence | |
|---|---|---|
| On Switches | Off Switches | |
| MOPSO | S(12,22),S(9,15) | S(13,14),S(9,10),S(11,12),S(14,15) |
| NSGA-II | S(12,22),S(33,18),S(9,15) | S(16,17),S(9,10),S(11,12),S(12,13) |
| Out of Service Area Buses | 14 | |
| Manually Controlled Switching Operations | 4 | |
| Remotely Controlled Switching Operations | 2 | |
| THD (%) at Bus No. 16 | 3rd Harmonic Component | 0.02 |
| 5th Harmonic Component | 3.68 | |
| 7th Harmonic Component | 2.56 | |
| Total THD at Bus 16 | 4.44 | |
| THD (%) at Bus No. 32 | 3rd Harmonic Component | 0.03 |
| 5th Harmonic Component | 4.52 | |
| 7th Harmonic Component | 3.25 | |
| Total THD at Bus 32 | 5.62 | |
| THD (%) at Bus No. 20 | 3rd Harmonic Component | 0.01 |
| 5th Harmonic Component | 2.29 | |
| 7th Harmonic Component | 1.64 | |
| Total THD at Bus 20 | 2.87 | |
| Out of Service Area Buses | 17,18 | |
| Manually Controlled Switching Operations | 4 | |
| Remotely Controlled Switching Operations | 3 | |
| THD (%) at Bus No. 16 | 3rd Harmonic Component | 0.02 |
| 5th Harmonic Component | 3.09 | |
| 7th Harmonic Component | 2.10 | |
| Total THD at Bus 16 | 3.74 | |
| THD (%) at Bus No. 32 | 3rd Harmonic Component | 0.06 |
| 5th Harmonic Component | 4.52 | |
| 7th Harmonic Component | 3.21 | |
| Total THD at Bus 32 | 5.55 | |
| THD (%) at Bus No. 20 | 3rd Harmonic Component | 0.03 |
| 5th Harmonic Component | 2.31 | |
| 7th Harmonic Component | 1.68 | |
| Total THD at Bus 20 | 2.87 | |
| Configuration | Initial Network Topology THD(Percent) | THD (Percent) by NSGA-II in Restored Network | THD (Percent) by MOPSO in Restored Network | |
|---|---|---|---|---|
| PC | ||||
| PC at Bus 16 | 4.67 | 3.74 | 4.44 | |
| PC at Bus 32 | 5.66 | 5.55 | 5.62 | |
| PC at Bus 20 | 2.87 | 2.87 | 2.87 | |
| Algorithm | Out-of-Service Buses | MCS | RCS | PC Bus No.16 THD (%) | PC Bus No.32 THD (%) | PC Bus No.20 THD (%) |
|---|---|---|---|---|---|---|
| MOPSO | 17,18 | 3 | 1 | 4.11 | 5.44 | 1.19 |
| NSGA-II | 9,10,11 | 3 | 1 | 6.13 | 5.44 | 1.67 |
| Algorithm | Advantages | Drawbacks |
|---|---|---|
| NSGA-II | • Can be used to solve the multi-objective optimization problem without using weight coefficients. |
|
| MOPSO |
| • Need the addition of a crowding operator to improve the uniformity of the solution distribution |
| Algorithm | Out-of-Service Buses | MCS | RCS | PC Bus No.45 THD (%) | PC Bus No.23 THD (%) | PC Bus No.61 THD (%) |
|---|---|---|---|---|---|---|
| MOPSO | 25,26,27 | 3 | 1 | 4.782 | 5.901 | 0.069 |
| NSGA-II | 18,19,20,21 | 4 | 2 | 4.833 | 0.068 | 0.069 |
| Algorithm | Out-of-Service Buses | MCS | RCS | PC Bus No.45 THD (%) | PC Bus No.23 THD (%) | PC Bus No.61 THD (%) |
|---|---|---|---|---|---|---|
| MOPSO | 60 | 3 | 1 | 3.654 | 4.197 | 3.789 |
| NSGA-II | 64,65 | 3 | 1 | 3.663 | 4.674 | 2.471 |
© 2019 by the authors. Licensee MDPI, Basel, Switzerland. This article is an open access article distributed under the terms and conditions of the Creative Commons Attribution (CC BY) license (http://creativecommons.org/licenses/by/4.0/).
Share and Cite
Srivastava, I.; Bhat, S.; Reddy, A.A. Multi-Objective Service Restoration of Radial Distribution System in the Presence of Non-Linear Loads. Electronics 2019, 8, 369. https://doi.org/10.3390/electronics8030369
Srivastava I, Bhat S, Reddy AA. Multi-Objective Service Restoration of Radial Distribution System in the Presence of Non-Linear Loads. Electronics. 2019; 8(3):369. https://doi.org/10.3390/electronics8030369
Chicago/Turabian StyleSrivastava, Ishan, Sunil Bhat, and Agarala Ajaysekhar Reddy. 2019. "Multi-Objective Service Restoration of Radial Distribution System in the Presence of Non-Linear Loads" Electronics 8, no. 3: 369. https://doi.org/10.3390/electronics8030369