Article

An Evolved Transformer Model for ADME/Tox Prediction

1
College of Computer Science and Technology, Qingdao University, Qingdao 266071, China
2
Aozhilin Inc., Shenzhen 100050, China
*
Author to whom correspondence should be addressed.
These authors contributed equally to this work.
Electronics 2024, 13(3), 624; https://doi.org/10.3390/electronics13030624
Submission received: 26 December 2023 / Revised: 23 January 2024 / Accepted: 24 January 2024 / Published: 2 February 2024
(This article belongs to the Special Issue Deep Learning for Data Mining: Theory, Methods, and Applications)

Abstract

:
Drug discovery aims to keep fueling new medicines to cure and palliate many ailments and some untreatable diseases that still afflict humanity. The ADME/Tox (absorption, distribution, metabolism, excretion/toxicity) properties of candidate drug molecules are key factors that determine the safety, uptake, elimination, metabolic behavior and effectiveness of drug research and development. The predictive technique of ADME/Tox drastically reduces the fraction of pharmaceutics-related failure in the early stages of drug development. Driven by the expectation of accelerated timelines, reduced costs and the potential to reveal hidden insights from vast datasets, artificial intelligence techniques such as Graphormer are showing increasing promise and usefulness to perform custom models for molecule modeling tasks. However, Graphormer and other transformer-based models do not consider the molecular fingerprint, as well as the physicochemicals that have been proved effective in traditional computational drug research. Here, we propose an enhanced model based on Graphormer which uses a tree model that fully integrates some known information and achieves better prediction and interpretability. More importantly, the model achieves new state-of-the-art results on ADME/Tox properties prediction benchmarks, surpassing several challenging models. Experimental results demonstrate an average SMAPE (Symmetric Mean Absolute Percentage Error) of 18.9 and a PCC (Pearson Correlation Coefficient) of 0.86 on ADME/Tox prediction test sets. These findings highlight the efficacy of our approach and its potential to enhance drug discovery processes. By leveraging the strengths of Graphormer and incorporating additional molecular descriptors, our model offers improved predictive capabilities, thus contributing to the advancement of ADME/Tox prediction in drug development. The integration of various information sources further enables better interpretability, aiding researchers in understanding the underlying factors influencing the predictions. Overall, our work demonstrates the potential of our enhanced model to expedite drug discovery, reduce costs, and enhance the success rate of our pharmaceutical development efforts.

1. Introduction

Drug discovery, with roots tracing back through the epochs of human civilization, persists as a central focus for the pharmaceutical industry and dedicated chemical scientists [1,2,3,4]. The prevalent utilization of small-molecule drugs, encapsulated in tablets or capsules, underscores their practical advantages in absorption and cost-effectiveness over larger counterparts. However, the multifaceted challenges inherent in drug discovery, marked by protracted timelines and substantial resource investments, necessitate a closer examination [5,6]. Scrutinizing clinical trial data spanning from 2010 to 2017 illuminates diverse factors contributing to the high incidence of clinical failures in drug development, encompassing issues related to clinical efficacy, toxicity, drug-like properties, and strategic planning oversights [7,8,9]. The late-stage discovery of unfavorable ADME/Tox properties further compounds these challenges, often culminating in attrition during advanced phases of drug development [10,11].
Amidst these challenges, the evolving landscape of drug discovery technologies underscores a critical imperative for the development of robust ADME/Tox prediction models and high-throughput screening (HTS) methodologies. The continuous emergence and evolution of these technologies not only broaden the application domain of small-molecule drugs but also present novel prospects for future advancements.
The preceding half-decade has witnessed a marked surge in interest surrounding the integration of artificial intelligence (AI) approaches into drug research and development [12,13,14,15,16]. Among the diverse array of models and solutions for ADME/Tox prediction, statistical-based approaches such as QikProp employ Monte Carlo statistical mechanics simulations. Simultaneously, AI-based solutions exemplified by Graphormer leverage deep learning models built upon the standard Transformer architecture, renowned for its superior performance in graph-level prediction tasks [17,18,19]. Widely adopted models, including iDrug, Discovery Studio, and ADMETlab, cater to distinct facets of drug discovery, ranging from molecular database integration to protein modeling and pharmacokinetics/toxicity predictions [20,21].
While Graphormer and other transformer-based models excel in extracting the position and connection information of small molecules within the spatial topology, our argument posits that these models may fall short in adequately considering molecular fingerprints and essential physicochemical properties—elements proven effective in traditional computational drug research. To address this limitation, this paper introduces an enhanced model incorporating a tree model for secondary training, synergistically leveraging the strengths of both approaches. This integrated model aims to provide more comprehensive insights, resulting in improved prediction accuracy and interpretability.
This paper aspires to make a substantial contribution to the field of drug discovery by proposing a holistic model that amalgamates state-of-the-art transformer-based techniques with established principles. The organizational structure of this paper is outlined as follows: Section 2 undertakes a thorough analysis of related works, delving into the nuances of Graphormer, CatBoost and SMILES. In Section 3, we meticulously present the key design aspects of our proposed solution, providing readers with an in-depth understanding of its conceptual underpinnings. Section 4 serves as a comprehensive summary, encapsulating the essence of our research and its implications. This structured approach aims to guide readers through a coherent narrative, ensuring a nuanced comprehension of our contributions and methodologies.

2. Related Works

2.1. ADME/Tox Properties

Drug discovery is a supremely challenging mission due to the numerous attributes that must be simultaneously optimized to obtain an efficacious drug compound. It is estimated that close to 50% of drug candidates fail because of unacceptable efficacy and that up to 40% of drug candidates have failed in the past due to toxicity. ADME/Tox [22,23] is a crucial feature in guiding selection and optimization that can investigate how a drug compound is processed by a living organism. It can break down five steps: absorption, distribution, metabolism, excretion and toxicity. Absorption is the process by which a drug enters the bloodstream. And it consists of four ways, including passive diffusion, facilitated diffusion, active diffusion and endocytosis. Distribution is the process by which the drug moves from the absorption site to tissues after absorption. Metabolism is the conversion of generally more lipophilic xenobiotic compounds to hydrophilic metabolites that can be eliminated from the body via excretion. Excretion is the irreversible loss of a substance from the system. In most cases, all drug-related material, including the parent drug and metabolites, are eventually cleared from the body. Toxicity assessment is a systematic and comprehensive examination of the potential harmful effects exerted by a chemical substance or physical agent on living organisms, serving as a critical component in the fields of pharmacology, environmental science, and chemical safety, providing essential insights into the safety profile of substances and guiding regulatory decisions in the realms of drug development.

2.2. Prediction Model

Within the contemporary landscape of pharmaceutical enterprises, the strategic integration of computational methodologies has emerged as a pivotal and transformative practice. This paradigm shift is fundamentally underpinned by the compelling advantages of cost-effectiveness and the expeditious selection of lead molecules, marking a significant transition in drug discovery processes [24,25,26]. The infusion of computational approaches into the fabric of pharmaceutical research reflects a profound recognition of the potential to revolutionize traditional methodologies and expedite the identification of promising drug candidates. The economic advantages inherent in computational methodologies are multifaceted. Notably, these approaches enable the in silico assessment of diverse chemical entities, significantly reducing the necessity for resource-intensive experimental endeavors at early stages. The cost-effectiveness of computational techniques, therefore, extends beyond the fiscal domain to encompass the judicious allocation of resources and a heightened responsiveness to emerging challenges in drug development.
Graphormer [27], an implementation grounded in the standard Transformer architecture, is publicly accessible on GitHub (https://github.com/Microsoft/Graphormer accessed on 1 December 2023). Recognized for its outstanding performance across diverse graph representation learning tasks, Graphormer features a distinctive architectural modification. Specifically, layer normalization (LN) precedes multi-head self-attention (MHA) and feedforward blocks (FFNs), deviating from the conventional post-graph neural network (GNN) operation. Notably, recent enhancements have enabled Graphormer to adeptly address 3D molecular dynamics simulations. These refinements empower Graphormer to outperform its vanilla counterpart, demonstrating noteworthy advancements on expansive molecular modeling datasets. Remarkably, it notably reduces the mean absolute error (MAE) when compared to the originally reported results on the PCQM4M quantum dataset [28].
CatBoost [29], an acronym for categorical boosting, stands out as a state-of-the-art boosting algorithm specifically tailored for seamless handling of categorical data. Incepted in 2017, CatBoost surpasses its contemporaries, such as XGBoost and LightGBM, for various reasons. Comprehensive tutorials (https://catboost.ai/en/docs/concepts/tutorials accessed on 1 December 2023) and the official GitHub repository (https://github.com/catboost/catboost accessed on 1 December 2023) provide detailed insights. In a recent study, Samat et al. (2022) [30] harnessed CatBoost to enhance the classification performance of remote sensing (RS) image classification. The algorithm demonstrated efficacy in facilitating spatial feature extraction, underscoring its utility in complex tasks. CatBoost’s advanced ensemble learning capabilities manifest in classification tasks, effectively mitigating overfitting, even with a substantial number of boosting iterations. Beyond its applications in regression and classification, CatBoost finds utility in diverse domains, including ranking, recommendation systems, forecasting, and notably, drug discovery. It has been employed as a feature selection method [31].
In the dynamic confluence of artificial intelligence and molecular sciences, advanced models play a pivotal role in significantly enhancing the efficiency and precision of drug discovery processes. The synergistic integration of AI within molecular research represents a paradigm shift, expediting the identification of potential drug candidates and enriching our comprehension of intricate molecular interactions. In essence, the amalgamation of artificial intelligence and molecular sciences represents a transformative force in drug discovery, driving advancements that are both efficient and precise. As these technologies continue to evolve, their application holds the promise of revolutionizing the pharmaceutical landscape, ushering in an era of accelerated drug development and more targeted therapeutic solutions.

2.3. Smiles

SMILES (Simplified Molecular Input Line Entry System) is a chemical notation that encodes a molecular structure as single line of text. It was developed to represent molecular structures in a compact and easy-to-read format that can be used in computer databases, search engines, and other software applications. SMILES has five basic syntax rules (atoms and bonds, simple chains, branches, rings and charged atoms) which must be observed. In SMILES notation, atoms are represented by their elemental symbols, with hydrogens typically omitted unless necessary to indicate bonding. Bonds between atoms are represented by various symbols, including “-”, “=”, “#”, and “:”. Parentheses are used to group atoms together, and brackets are used to indicate branches or repeating substructures. The following is an example of SMILES string:
C N 1 C = N C 2 = C 1 C ( = O ) N ( C ( = O ) N 2 C ) C
In this notation, “C” represents a carbon atom, “N” represents a nitrogen atom, and “O” represents an oxygen atom. The numbers and symbols between atoms indicate bonds, with “=” representing a double bond, “-” representing a single bond, and “#” representing a triple bond. The parentheses and brackets group atoms and indicate branching. The SMILES notation for caffeine indicates that it contains 8 carbon atoms, 10 hydrogen atoms, 4 nitrogen atoms, and 2 oxygen atoms, arranged in a specific pattern of bonds to form the caffeine molecule. If the basic rules of chemistry are not followed in SMILES entry, the system will warn the user and ask that the structure be edited or reentered. Anderson et al. (1987), Weininger (1988) and Weininger et al. (1989) [32,33,34] discuss SMILES in more detail.

3. An Enhanced Graphormer Model

3.1. Model Architecture

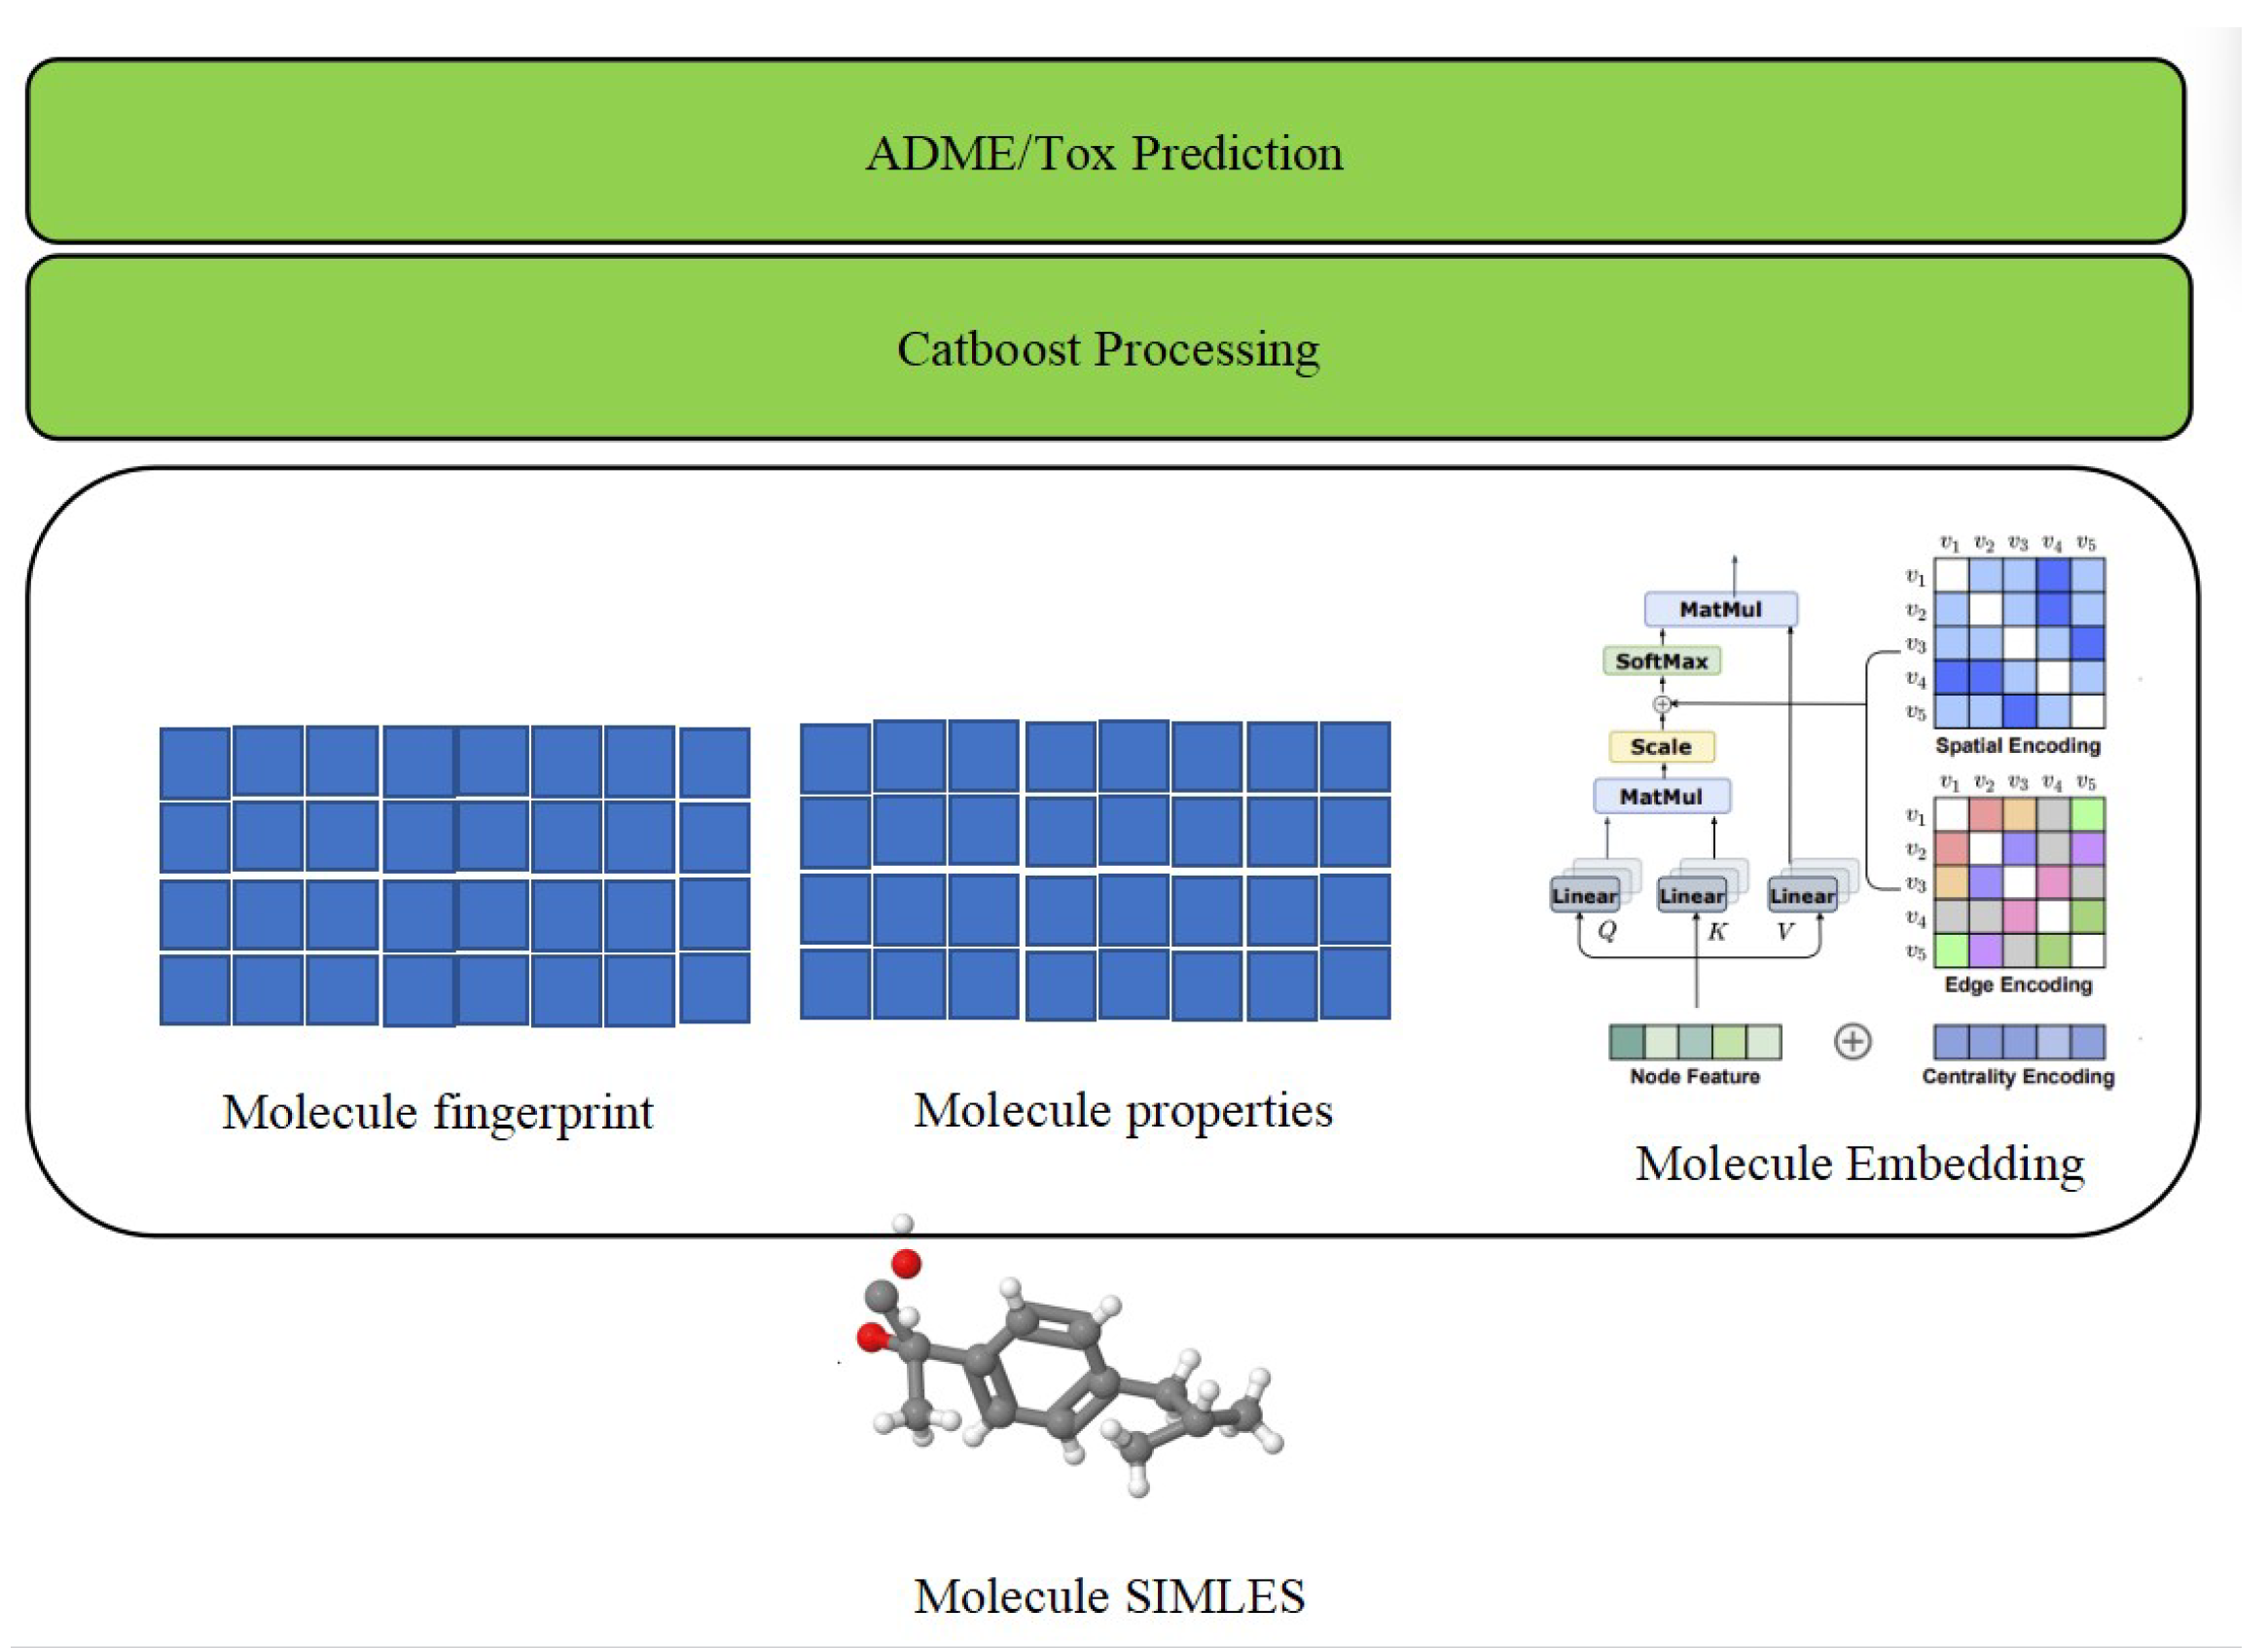
This study builds upon the foundational architecture of the traditional sequence transformer model, extending its capabilities to incorporate graph-oriented features. This augmentation enhances the model’s capacity to effectively discern spatial topology information and connectivity details within molecular structures, shown by Figure 1. In cognizance of the evolving requirements for ADME/Tox prediction, our methodology acknowledges specific limitations within the traditional model. Notably, it lacks the inclusion of molecular fingerprint-like features, recognized for their historical efficacy in traditional computational chemistry research. These features, often grounded in expert knowledge, along with the consideration of key physicochemical properties, are deemed indispensable for a comprehensive understanding of molecular behavior. Our proposed methodology, rooted in the transformer architecture, systematically addresses these limitations through a meticulously designed training regimen. This involves pre-training—initial model training to capture foundational patterns in molecular data; fine-tuning—iterative refinement of the model using task-specific data, adapting it to the nuances of ADME/Tox prediction; and end-to-end training—a comprehensive training phase incorporating both pre-training and fine-tuning, culminating in the generation of specialized embedding for small molecules.
To augment predictive performance, our methodology introduces a secondary training phase utilizing a tree model, specifically CatBoost. This strategic addition is aimed at comprehensively integrating diverse information types, encompassing molecularity. At last, model evaluation is conducted using rigorous performance metrics tailored for ADME/Tox prediction tasks. The key metrics include Symmetric Mean Absolute Percentage Error, which is used to calculate an accuracy measure based on percentage (or relative) errors and is defined as the following:
S M A P E = 2 ( i = 1 n | y i y l ^ | / | y i | + | y l ^ | ) / n ,
where y i is the target value, and ( y i ) is the predictions. The Pearson Correlation Coefficient (PCC) is measuring the linear relationship between predicted and actual values. It is defined as the following:
r x , y = i = 1 n ( x i x ¯ ) ( y i y ¯ ) ) / ( i = 1 n ( x i x ¯ ) 2 i = 1 n ( y i y ¯ ) 2 ) ,
where x ¯ and y ¯ are the mean value x and sample value y, respectively. These metrics provide a quantitative assessment of the model’s predictive capabilities, ensuring a robust evaluation of its performance.
(R-Square) is a statistical measure in a regression model that determines the proportion of variance in the dependent variable that can be explained by the independent variable. It is defined as the following:
R 2 = 1 i = 1 n ( p r e d r e a l ) 2 i = 1 n ( r e a l ¯ r e a l ) 2 .
In the initial phase of our model development, we fine-tune the Graphormer model based on the PCQM4Mv2 dataset, originally curated under the PubChemQC project. This dataset, rooted in quantum chemistry, enables the transfer of 2D/3D molecular graphs represented in SMILES format into embeddings:
h ( l ) = M H A ( L N ( h l 1 ) ) + h l 1
h ( l ) = F F N ( L N ( h ( l ) ) ) + h ( l )
Subsequently, we integrate molecular fingerprinting and molecular properties based on the embeddings generated by the Graphormer model in the preceding step. This integration encompasses three types of information. First, the Molecule Embedding is computed, incorporating Centrality Encoding to describe the importance levels of nodes in a graph, Spatial Encoding to represent the spatial positions of nodes, and Edge Encoding in Graphormer to encode relationships between nodes. Notably, this differs from traditional graph neural networks by not relying solely on the Euclidean distance between node embeddings of connected nodes:
Cemb i ( 0 ) = λ i + d e g i ( i n ) + d e g i ( o u t )
Semb i j = ( C e m d i W Q ) ( C e m d j W K ) T d + Δ i j
Eemb i j = ( C e m d i W Q ) ( C e m d j W K ) T d + Δ i j + β i j
Centrality Encoding refers to describing the importance level of nodes in a graph. Spatial Encoding refers to the process of representing the spatial position of nodes in a graph as part of the input to the Graphormer model. Edge Encoding in Graphormer refers to the process of encoding the relationships between nodes in a graph. This is unlike traditional graph neural networks, which are generated by the Euclidean distance between the node embeddings of two connected nodes. Moreover, the prediction model not only considers the embedding feature, which represents position and connection information, but also considers the molecular fingerprint, as well as the physicochemicals (connectivity, estate, kappa, burden, charge, property, etc.) that have been proved effective in traditional computational drug research. Here, we define the COMBINE operation.
Furthermore, our prediction model extends beyond considering embedding features that capture position and connection information. It incorporates molecular fingerprinting and various physicochemical properties (connectivity, estate, kappa, burden, charge, property, etc.) that have demonstrated effectiveness in traditional computational drug research:
C O M B I N E = { m o l e c u l e _ f i n g e r p r i n t , m o l e c u l e _ p r o p e r t i e s , m o l e c u l e _ e m b e d d i n g } , .
In this paper, we employ CatBoost as the final processing step on the last COMBINE result, the detailed procedure shown by following algorithm. CatBoost is chosen for its robustness in handling heterogeneous data, as it consistently outperforms the majority of boosting algorithms in the initial run. This selection is grounded in its ability to effectively navigate diverse data types and optimize predictive performance, ensuring a reliable and comprehensive analysis of the combined molecular features obtained from the preceding steps.
Algorithm 1: Generative tree.
Electronics 13 00624 i001

3.2. Benchmark

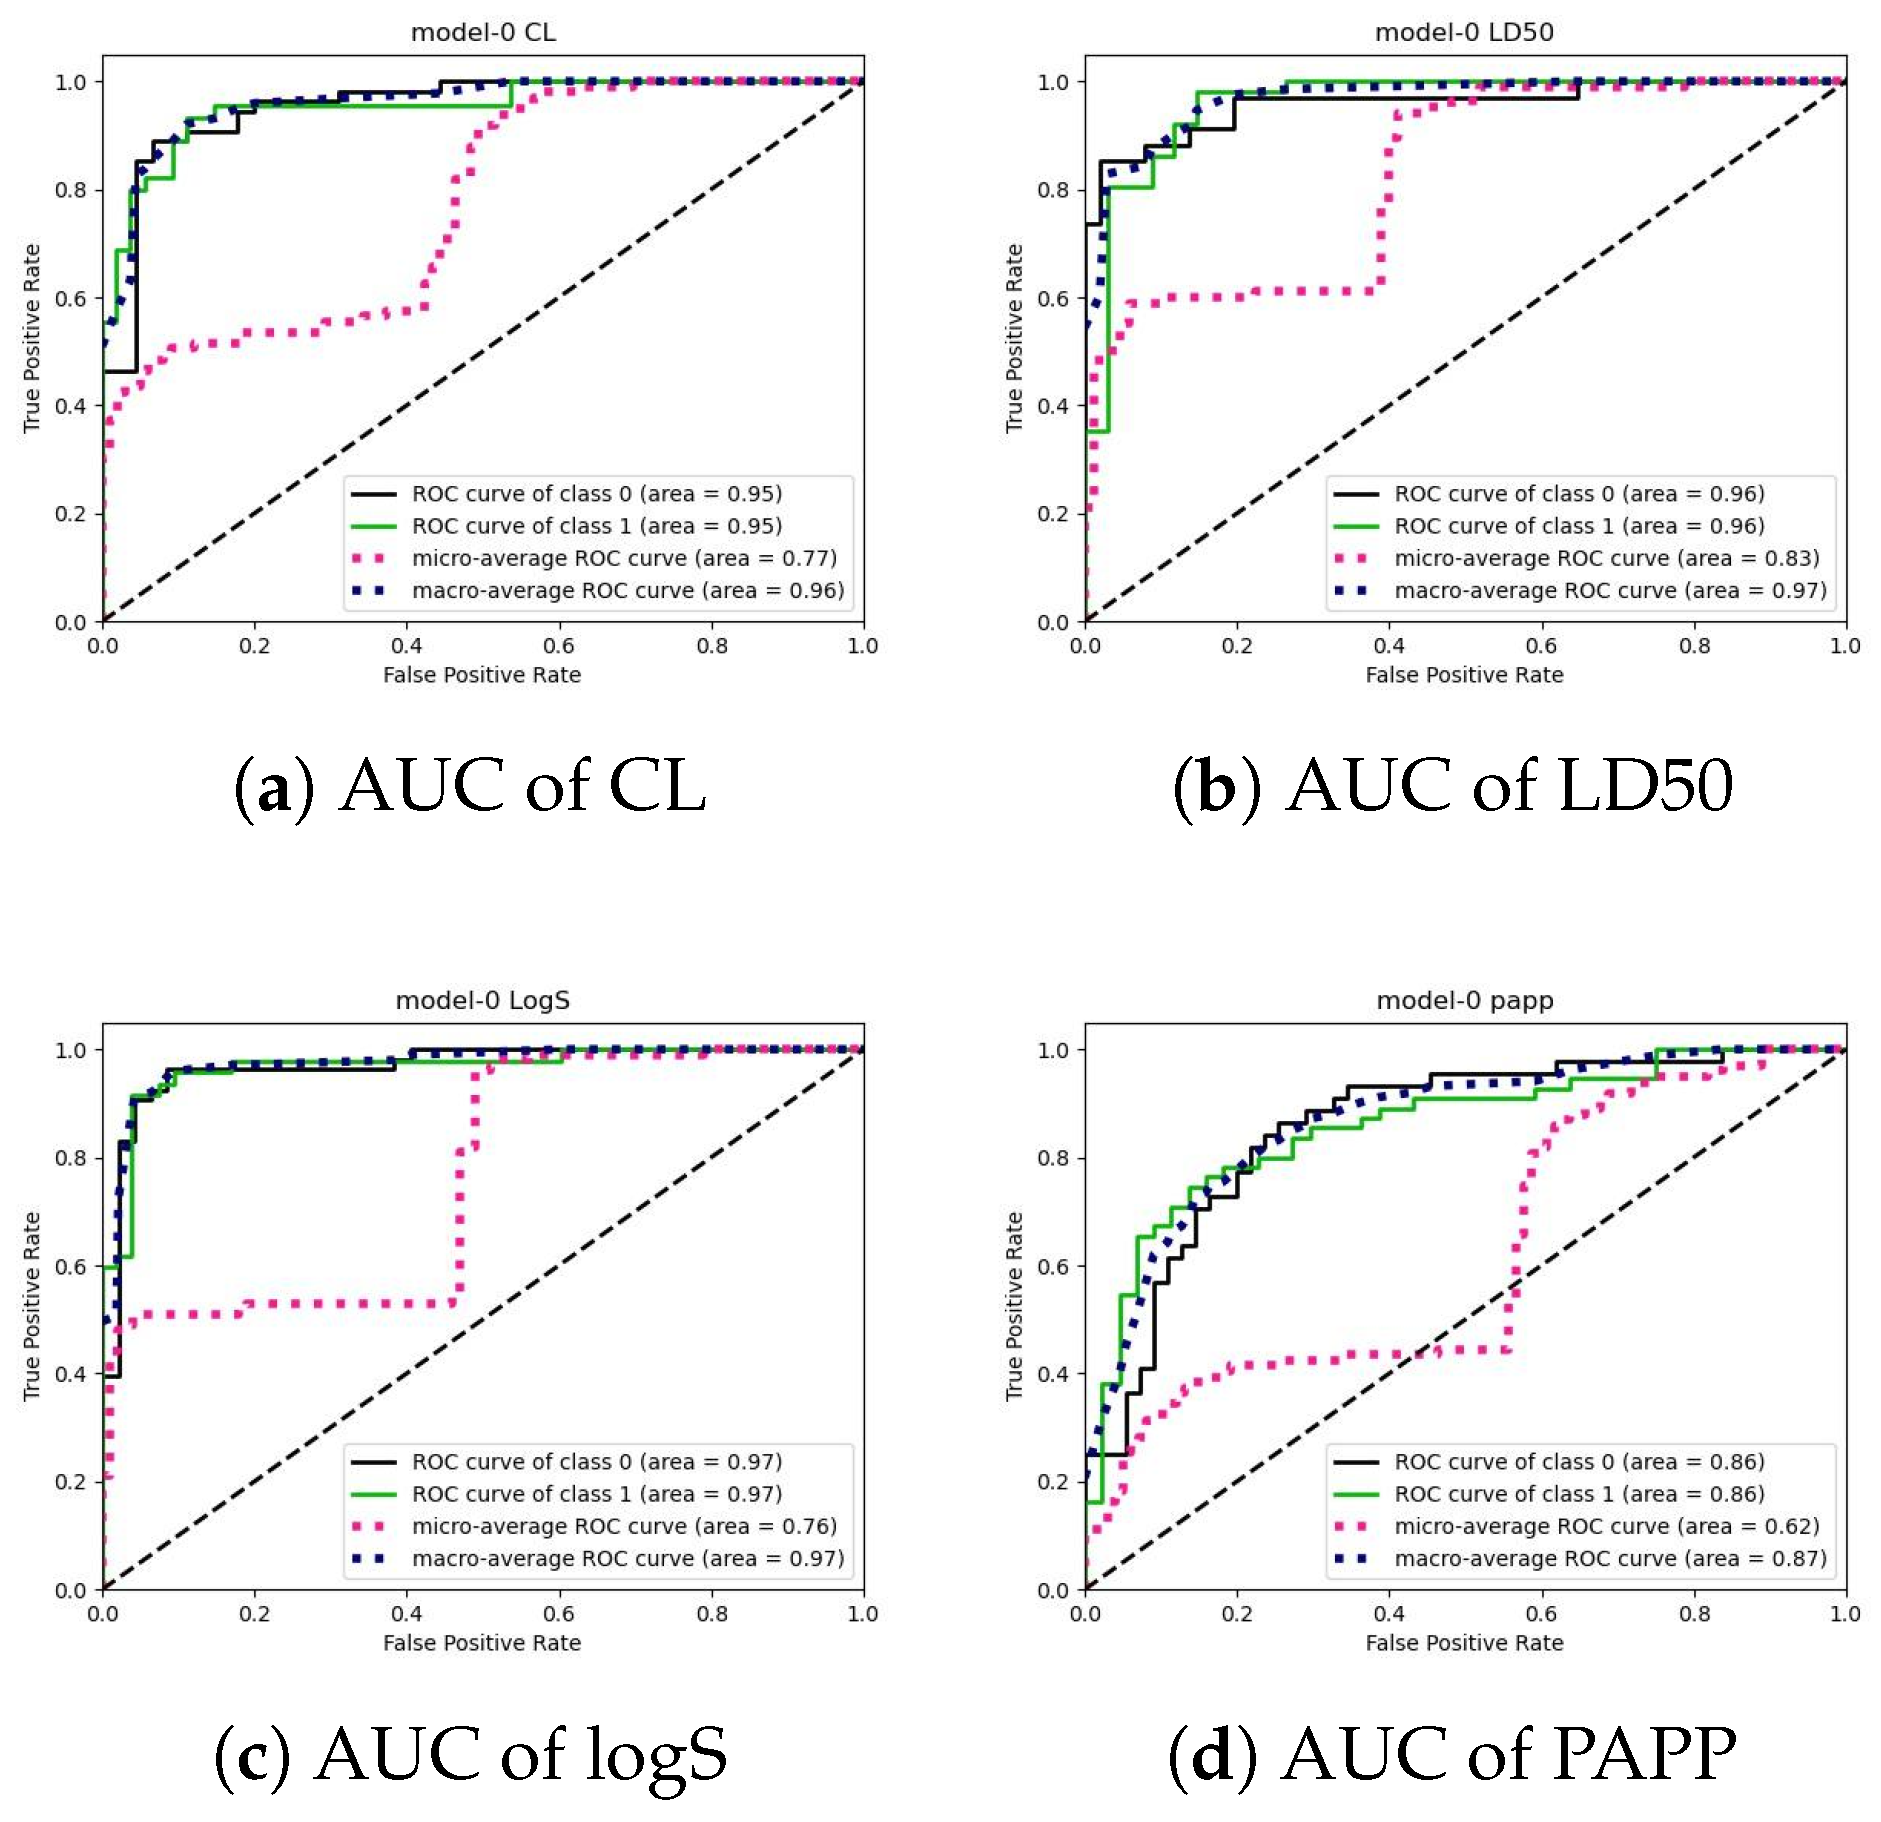
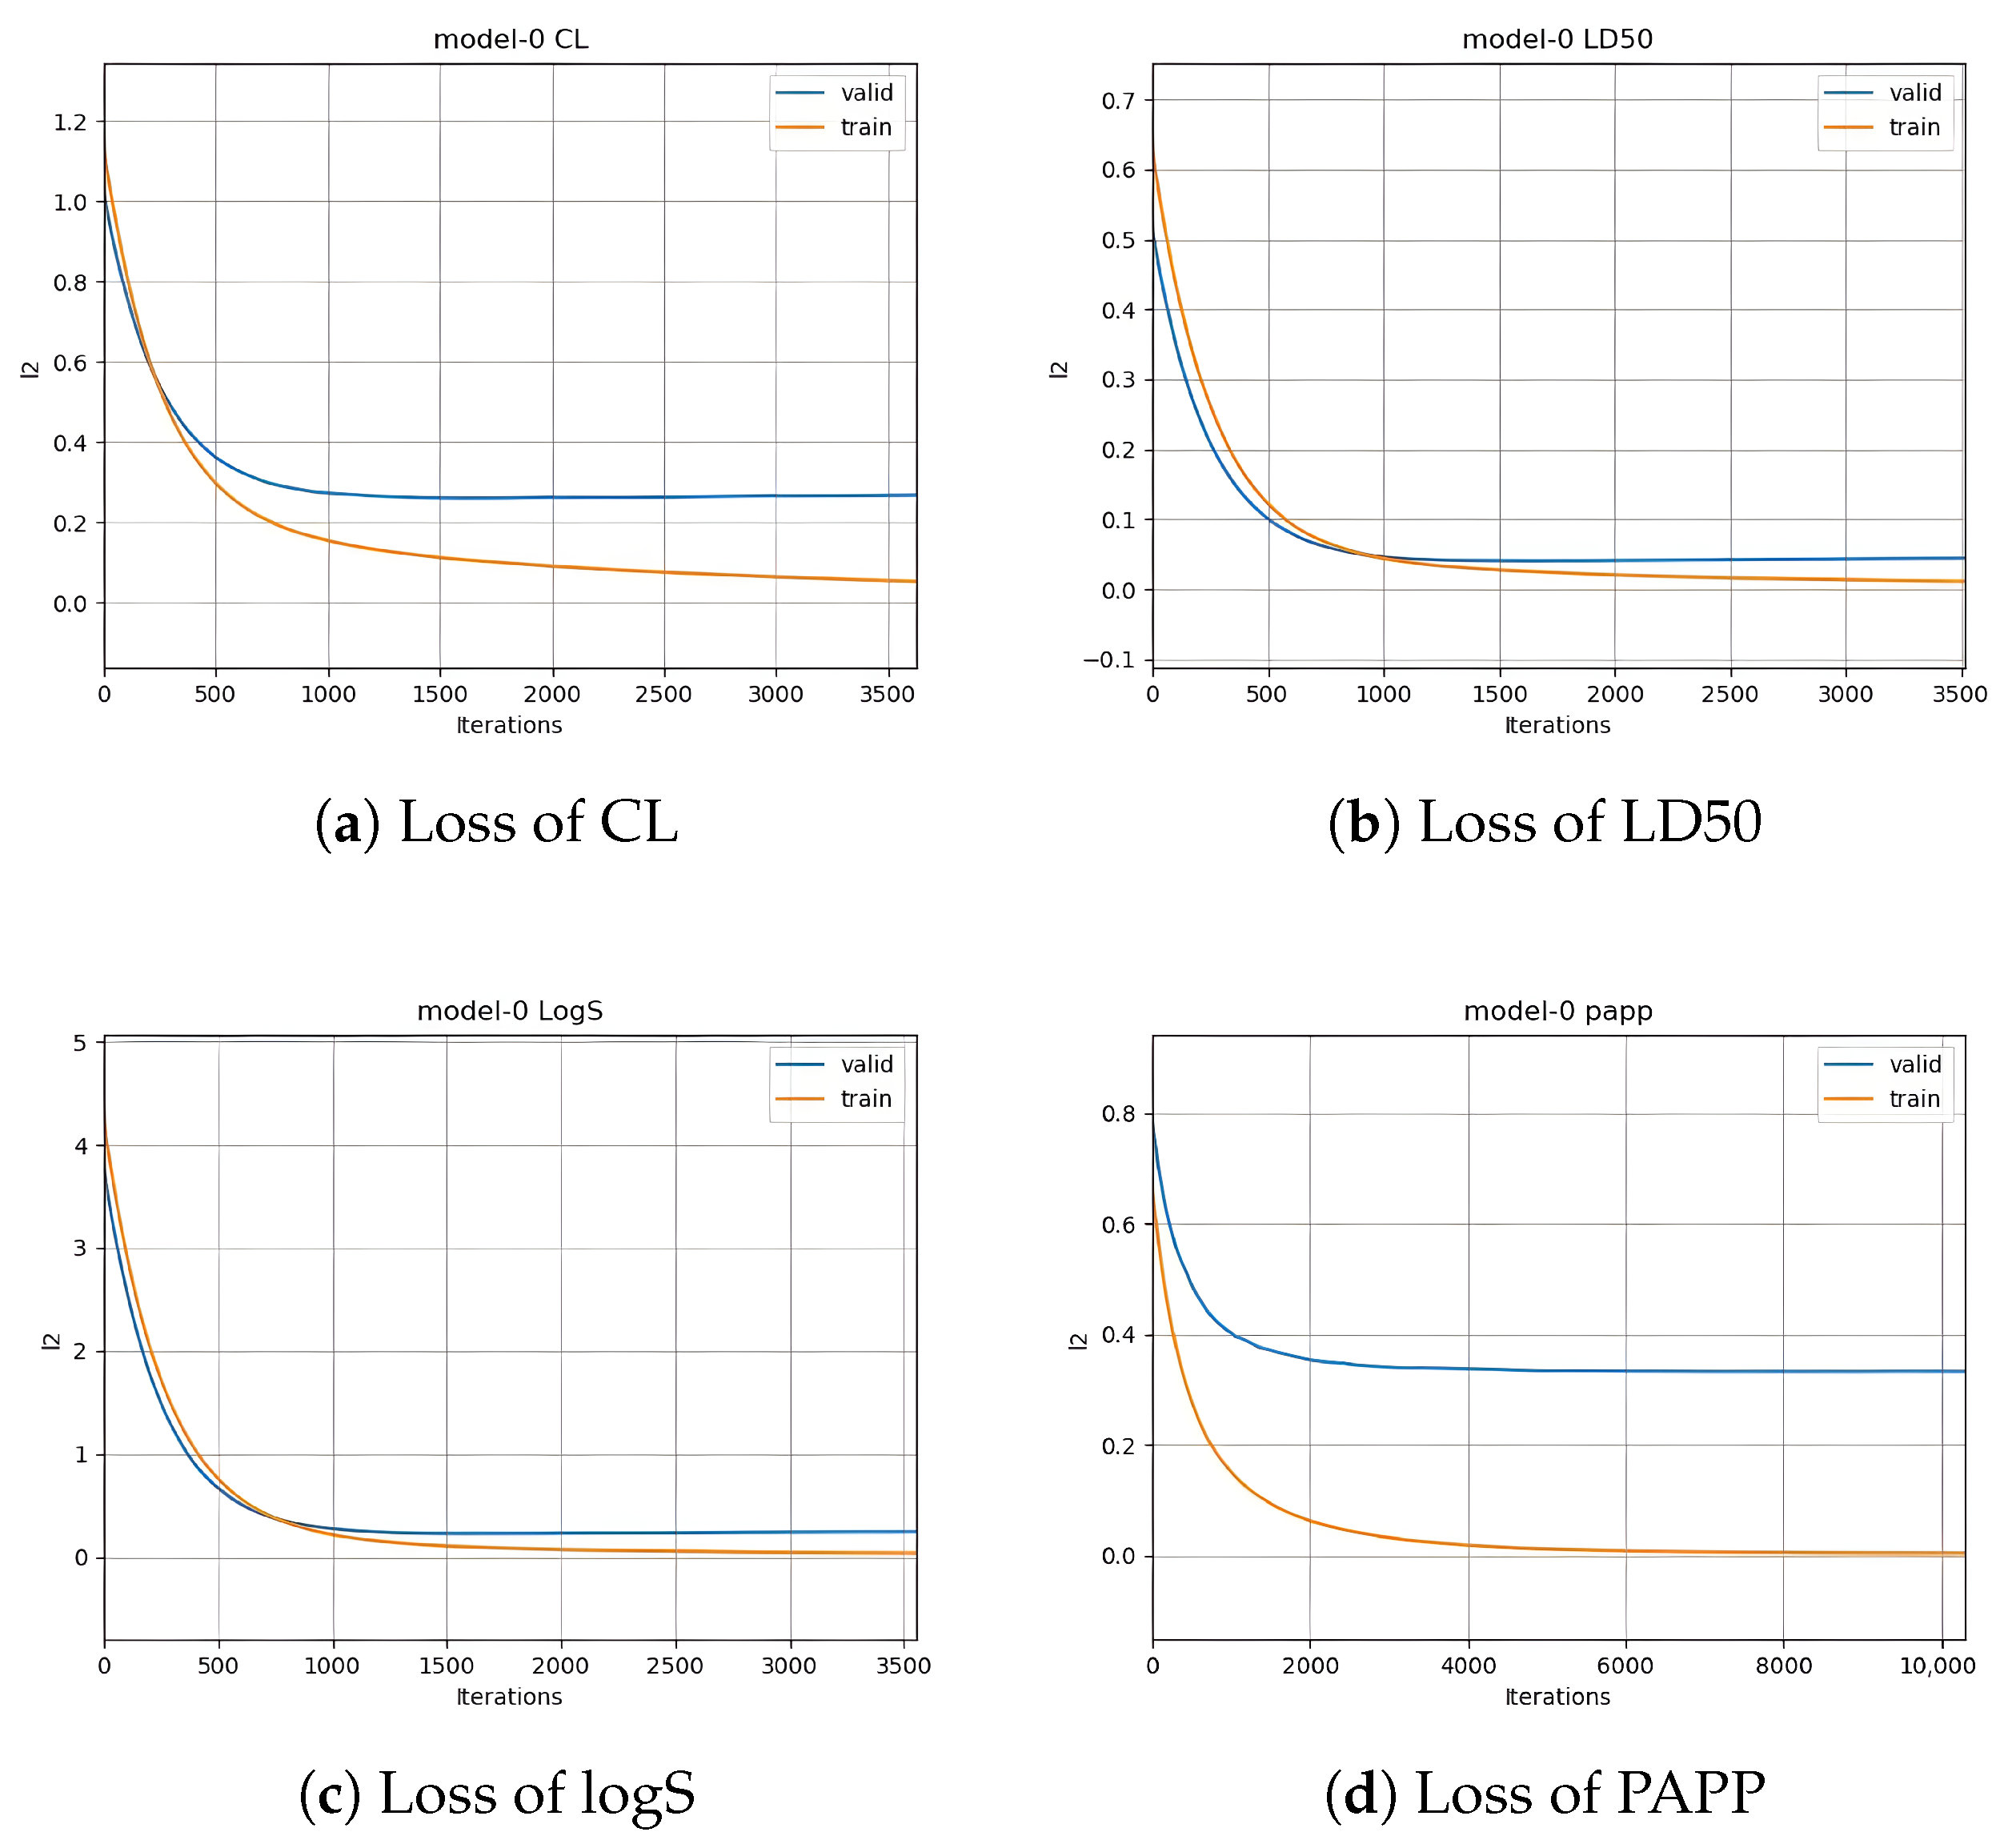
The properties of drug molecules typically encompass fundamental attributes, ADME-related pharmacokinetic properties, and toxicity properties. Given the multitude of relevant properties and to ensure comparability with commercial software and web platforms, we selected five benchmark properties: solubility (logS), clearance (CL), permeability (PAPP), plasma protein binding (PPB), and median lethal dose (LD50). These chosen properties serve as key benchmarks, providing a focused and standardized set of criteria for evaluating and comparing the performance of our model against established commercial tools and web-based platforms in the field of drug discovery and development.
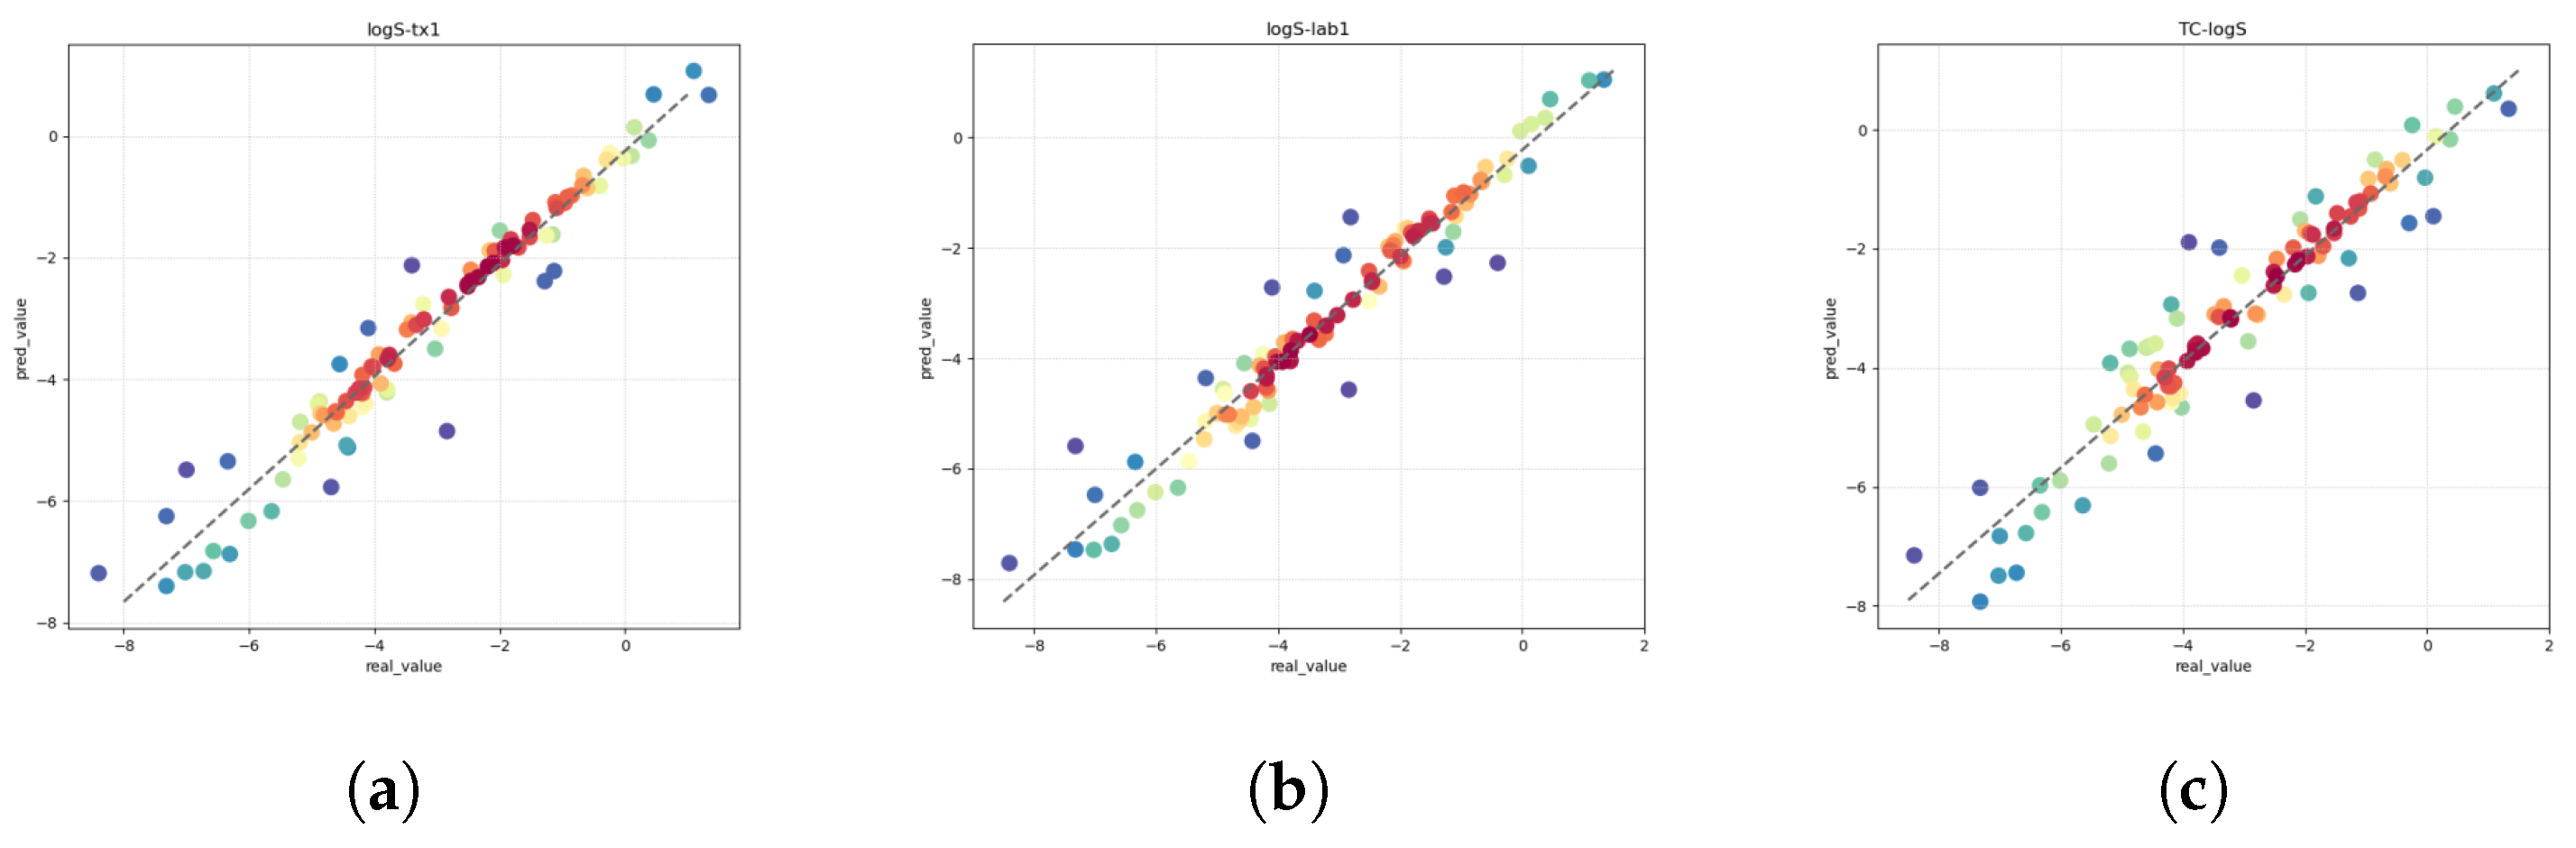
Solubility (logS) constitutes a pivotal parameter in the comprehensive assessment of drug molecules, bearing direct implications for their absorption and distribution within the ADMET framework. This parameter holds particular significance, as it profoundly influences the oral bioavailability of a drug, emerging as a critical pharmacokinetic property necessitating meticulous optimization in the drug discovery process. The quantification of solubility, denoted by the 10-based logarithm (logS), assumes paramount importance in shaping formulations and determining the subsequent therapeutic efficacy of a drug [35,36,37].
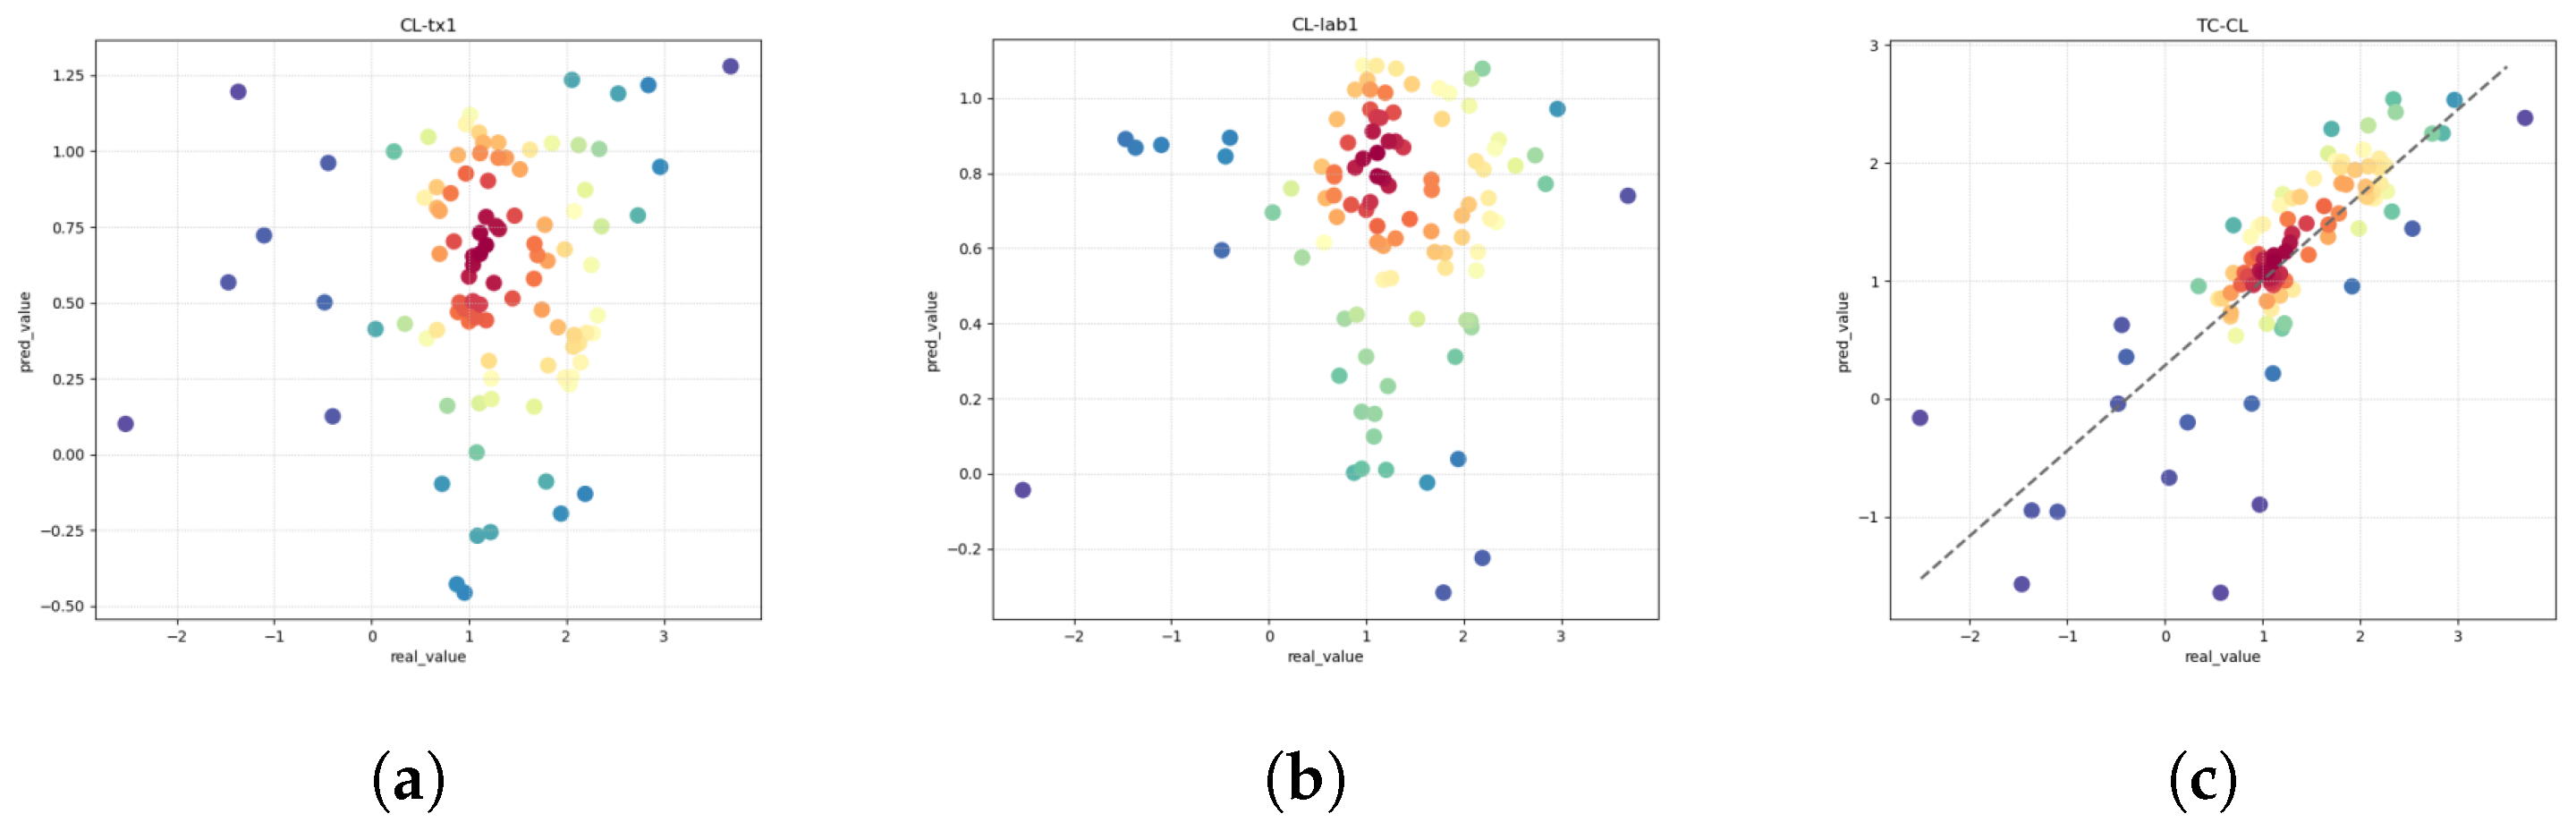
Clearance (CL) is a pivotal pharmacokinetic parameter denoting the volume of plasma from which a drug is systematically removed per unit time. This parameter serves as a critical indicator for evaluating drug metabolism, reflecting the rate at which a drug undergoes elimination from the body. Key organs involved in drug elimination encompass the liver, kidneys, lungs, and intestines, each contributing to diverse drug-specific elimination pathways. Within the intricate landscape of drug metabolism, the clearance rate, represented by the CL value, is subject to multifaceted influences. These encompass intrinsic factors, such as the physicochemical properties of the drug, the prevailing physiological state of the organism, and the activity of the metabolic enzyme system. The resultant CL value becomes a vital quantitative measure, offering insights into the dynamic interplay between a drug and the biological milieu. In academic and clinical contexts, the discernment of drug clearance intricacies stands as an essential foundation, contributing profoundly to the formulation of evidence-based pharmaceutical strategies and clinical decision making [38,39,40].
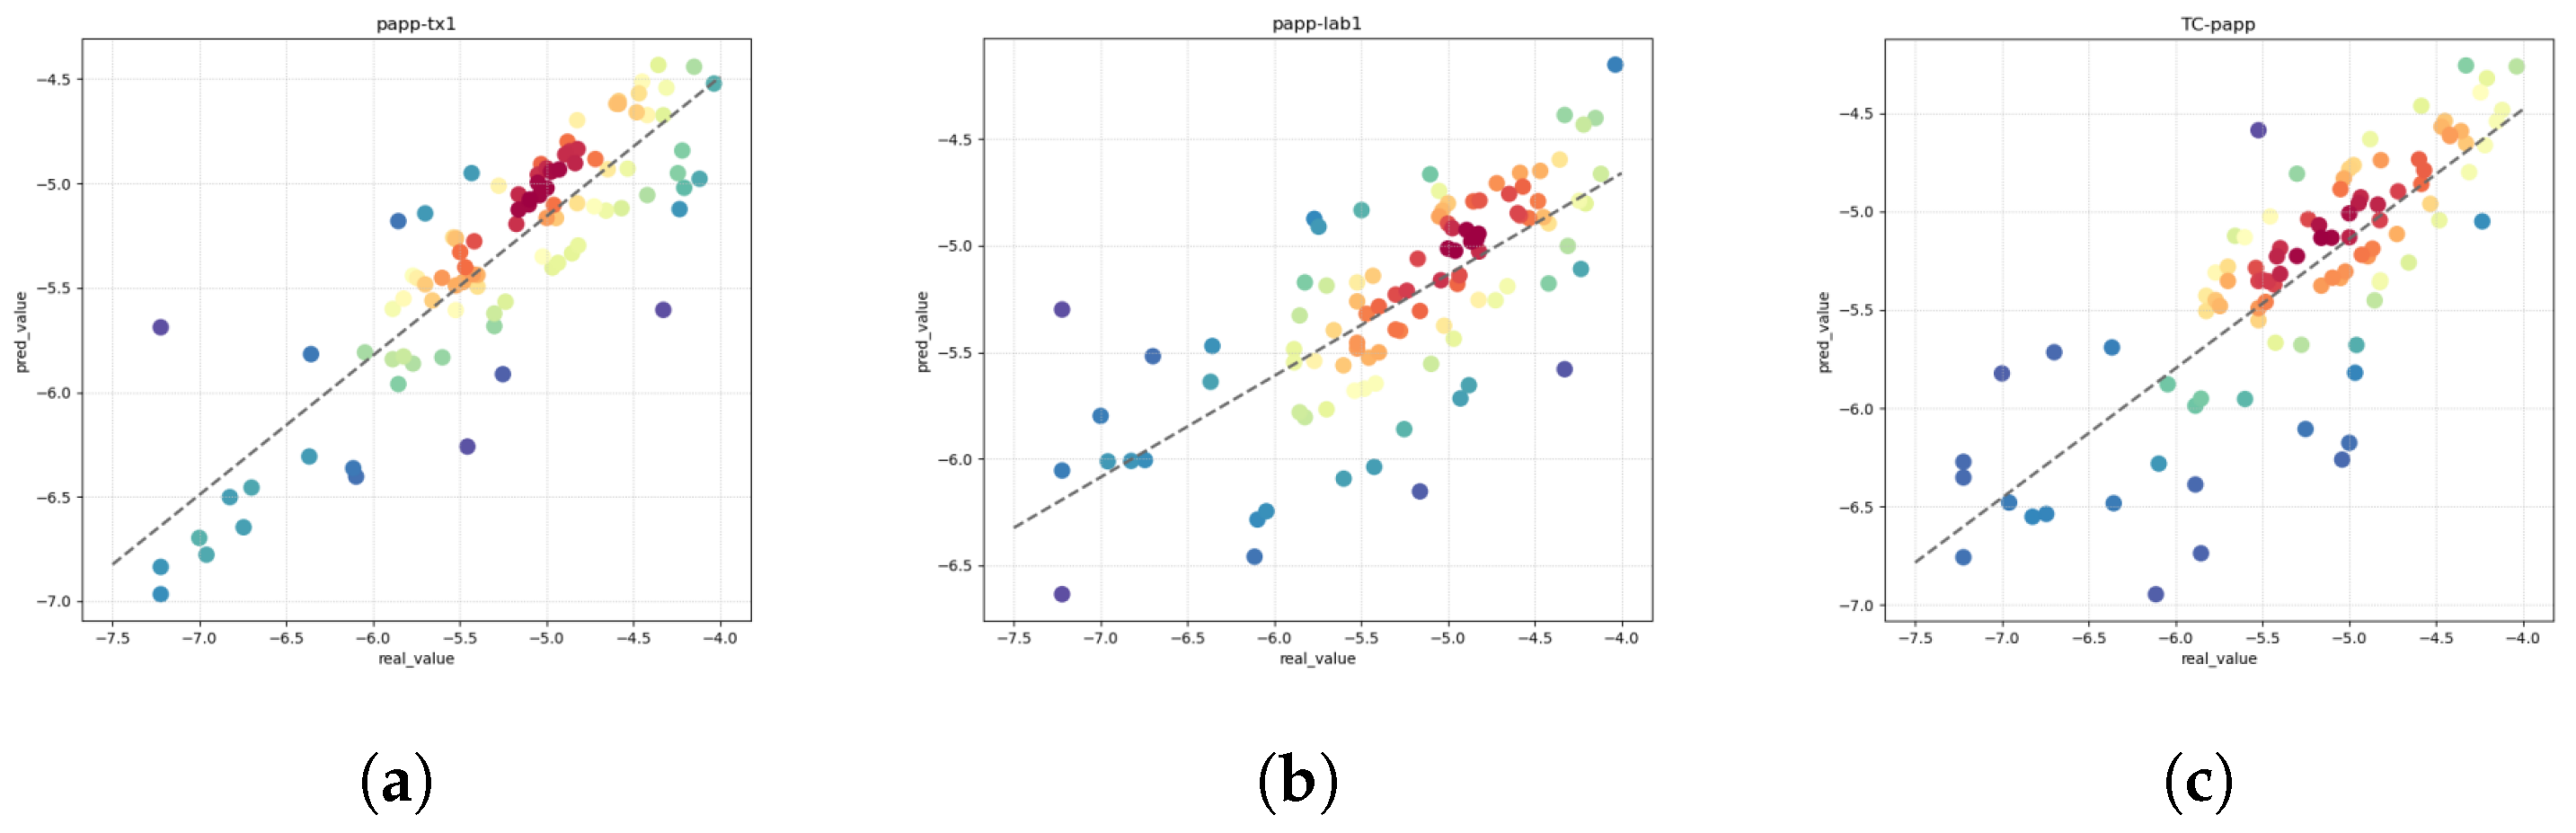
Permeability (PAPP) stands as a pivotal index in assessing a drug’s capability to traverse cell membranes and reach its intended site of action. Widely employed in the realm of drug discovery and development, PAPP furnishes indispensable insights into the pharmacokinetic attributes of potential drug candidates. The discernment gleaned from PAPP assessments serves as a cornerstone for optimizing drug design, enhancing the likelihood of success in subsequent clinical trials. The adoption of PAPP as a metric underscores its significance in shaping the trajectory of drug development endeavors, propelling advancements in the rational design of pharmacotherapeutics [41,42,43,44].
Plasma protein (PPB) denotes the extent to which a drug molecule associates with proteins in the plasma, predominantly with albumin. Upon introduction into the bloodstream, a drug may manifest in two distinct states: as free or unbound drug molecules and as drug molecules bound to plasma proteins. Only the unbound drug molecules retain pharmacological activity, enabling interaction with target sites in the body to elicit the desired therapeutic effects. The intricate binding of drugs to plasma proteins significantly governs their distribution, metabolism, and elimination within the biological milieu. Elevated plasma protein binding has the potential to constrain the availability of free, active drug molecules, thereby exerting a pivotal influence on the drug’s therapeutic efficacy. This underscores the imperative for the meticulous consideration of plasma protein binding dynamics in the determination of dosage regimens [45,46].
The median lethal dose (LD50) stands as a critical measure in the assessment of substance toxicity. This standardized metric involves the systematic administration of progressively increasing doses of the substance to discrete groups of test animals until 50% of them succumb. The ensuing dose–response data are then utilized to derive the LD50 value, representing the quantity of the substance expected to induce mortality in 50% of a population upon exposure. Embraced extensively in regulatory toxicology, the LD50 test retains its fundamental role in evaluating acute toxicity and establishing safety thresholds for substances that carry potential risks to human health. Conventionally expressed in milligrams of the substance per kilogram of the body weight of the test animal, LD50 data are pivotal for informed risk assessment and the development of safety guidelines [47,48].
In our comprehensive investigation of bioactive molecules and their drug-like properties, we meticulously compiled a valuable dataset by amalgamating information from two distinct sources. The primary contributor to our dataset is the Chembl database, a meticulously curated repository of bioactive molecules renowned for possessing drug-like characteristics. This database seamlessly integrates chemical, bioactivity, and genomic data, providing an invaluable resource to facilitate the translation of genomic information into the development of effective new drugs. Specifically, forecast data related to CL (clearance), caco-2 permeability, PPB (plasma protein binding), and LD50 were extracted from the Chembl database. These parameters play pivotal roles in understanding the pharmacokinetics and toxicity of bioactive compounds, critical aspects in drug development. Following a meticulous filtering process, our local dataset now comprises a total of 1128 entries for logS (logarithm of aqueous solubility), 2999 entries for CL, 1209 entries for caco-2 permeability, 2081 entries for PPB, and 2633 entries for LD50. Each entry in this curated dataset encapsulates essential information contributing to a holistic understanding of the properties and behavior of the bioactive molecules under investigation. To enhance the robustness of our dataset and ensure its applicability across diverse scenarios, we incorporated additional test data points for logS, CL, PPB, and LD50. These test data points were randomly generated to provide a representative sample for further validation and assessment of the predictive models. For a more detailed breakdown of the dataset, please refer to Table 1, which encapsulates a comprehensive overview of the entries and properties included in our exploration of bioactive molecules.

4. Experiments

4.1. Overall Result

In this section, a comprehensive comparative analysis is conducted between our proposed model and four commercial models. Models under scrutiny are described as follows: iDrug is an open platform for preclinical drug discovery that utilizes a deep learning algorithm developed by Tencent AI Lab. ADMETLab is a Python-based platform accessible at http://admet.scbdd.com/ (accessed on 1 December 2023) that provides systematic ADME/Tox evaluation for chemicals, relying on an extensive database comprising 288,967 entries. QikProp is serving as a robust screening tool predicting various chemical and physicochemical properties associated with drug candidate molecules. DS (Discovery Studio), developed by Dassault Systemes BIOVIA (formerly Accelrys), specializes in simulating small molecule and macromolecule systems.
In our analysis of key indicators, SMAPE and PCC demonstrated comparability across properties, leading to their selection for multi-property averaging. The comprehensive average results indicate that our fusion model exhibits superior performance, followed by iDrug, ADMETLab, QikProp and DS. Despite the potential utilization of our test set data by other platforms during training, given the use of public datasets, the overall outcome remains satisfactory.
A notable limitation observed in the these existing models is their ability to provide fewer property predictions or exhibit significant differences in caliber. Concerning the key different properties of logS, CL, PAPP, PPB and LD50, there is a notable enhancement across different properties. In relative terms, our fusion model demonstrates stable learning and reasoning capabilities, particularly when the dataset is clearly defined. This leads to more reliable results, emphasizing the importance of a well-defined dataset for model stability and predictive accuracy in complex environments. The experimental results show that the improved model attains an average SMAPE (Symmetric Mean Absolute Percentage Error) of 18.9% and an average PCC (Pearson Correlation Coefficient) of 0.86 on ADME/Tox prediction test sets. Please refer to Table 2 for detailed results.

4.2. Detail Result

(1) logS: It is true that iDrug and our model achieve optimal results on different metrics. It seems that the ambiguity difference of the dataset is relatively small, and the final results of the benchmark has good availability. Please refer to Figure 2 and Table 3 for detailed logS results.
(2) CL: We found that different species and different ways of taking drugs have a greater impact on CL values. For the sake of accuracy, we limited the data to be in the human liver. Experiments show that our enhanced model leads significantly on the benchmark. Please refer to Figure 3 and Table 4 for detailed CL results.
(3) PAPP: On this metric, the PCC and SMAPE results produced by the model significantly outperform ADMETLab and QikProp, while being lower than iDrug. Please refer to Figure 4 and Table 5 for detailed PAPP results.
(4) PPB: On this metric, the R2, PCC and SMAPE results produced by the model significantly outperform iDrug and DS. Please refer to Table 6 for the detailed PPB result.
(5) LD50: On this metric, the PCC and SMAPE results produced by the model significantly outperform iDrug and DS, while the R2 result is higher than DS and lower than iDrug. Please refer to Table 7 for detailed LD50 results.
Moreover, a comprehensive performance analysis of the proposed model was conducted, with a specific emphasis on the dynamics of AUC and Loss. As illustrated in Figure 5, it becomes apparent that, throughout the training process, the AUC attains a peak and subsequently stabilizes, signifying sustained high performance in subsequent training sessions. Figure 6 demonstrates the model’s initial elevated Loss, which progressively diminishes during training, ultimately stabilizing to achieve a favorable convergence effect.

5. Conclusions

Navigating the intricate landscape of drug development requires addressing the intricate challenges posed by the absorption, distribution, metabolism, excretion, and toxicity (ADME/Tox) properties. A substantial portion of molecules in the developmental pipeline face an elevated risk of failure due to deficiencies in these critical attributes. In response to this pressing issue, our paper introduces a sophisticated model aimed at advancing predictive accuracy, with the overarching objective of enhancing success rates in drug discovery. In the crucible of experimentation, our proposed model not only demonstrates cutting-edge performance but also establishes itself as a standard of precision. Attaining an outstanding Symmetric Mean Absolute Percentage Error (SMAPE) of 18.9 and a robust Pearson Correlation Coefficient (PCC) of 0.86 on ADME/Tox prediction test sets, the model substantiates its capacity to furnish accurate and reliable predictions. These metrics stand as a testament to the model’s prowess in distilling complex drug properties into actionable insights, thereby reshaping the landscape of decision making in drug development.
As we project our trajectory into the future, our research endeavors extend beyond the confines of initial success. Our strategic focus revolves around the refinement and augmentation of our model through a series of follow-up initiatives. These initiatives encompass the following:
(1) Feature enrichment based on chemical/physical principles: Our commitment to accuracy compels us to delve deeper into the chemical and physical underpinnings of small molecules. We endeavor to enrich our model by incorporating additional features aligned with fundamental principles, capturing nuanced aspects contributing to the intricacies of drug behavior.
(2) Integration of 3D structural information: Recognizing the three-dimensional nature of molecular structures as a crucial determinant in drug properties, our model is poised for evolution. Efforts are underway to enhance its capability to process and leverage 3D structural information, thereby refining predictions through a more holistic consideration of spatial arrangements.
(3) Sophistication through state-of-the-art graph-based models: To elevate the model’s analytical prowess, we aim to infuse it with the sophistication of state-of-the-art graph-based models and incorporate additional performance metrics. This enhancement will empower our model to unravel complex relationships within molecular structures, providing a more nuanced understanding of small molecules.

Author Contributions

The authors C.S., F.S. and R.S. developed the initial idea for the study. The authors C.S. and S.H. designed the research methodology, including data collection, experimental procedures. The authors S.H. and T.Z. created figures, tables of the presentation of results. The authors C.S., F.S. and R.S. wrote the initial version of the manuscript. The authors C.S. and T.Z. revised and edited the manuscript. The author R.S. provided oversight and guidance throughout the research. All authors have read and agreed to the published version of the manuscript.

Funding

This research received no external funding.

Data Availability Statement

All data generated or analyzed during this study are included in this published article.

Conflicts of Interest

Author Song Huang was employed by the company Aozhilin Inc. The remaining authors declare that the research was conducted in the absence of any commercial or financial relationships that could be construed as a potential conflict of interest.

Abbreviations

Symbols in this model.
SymbolDescription
Cemb Centrality Encoding
Semb Spatial Encoding
Eemb Edge Encoding
λ Feature vector
Δ Distance metric
β Edge metric
d e g ( i n ) In degree
d e g ( o u t ) Out degree
MHA Multi-head self-attention
FFN Feed-forward blocks
LN Layer normalization

References

  1. Sheridan, C. First small-molecule drug targeting RNA gains momentum. Nat. Biotechnol. 2021, 39, 6–8. [Google Scholar] [CrossRef] [PubMed]
  2. Jorgensen, W.L.; Duffy, E.M. Prediction of drug solubility from structure. Adv. Drug Deliv. Rev. 2002, 54, 355–366. [Google Scholar] [CrossRef] [PubMed]
  3. Kennedy, T. Managing the drug discovery/development interface. Drug Discov. Today 1997, 2, 436–444. [Google Scholar] [CrossRef]
  4. DiMasi, J.A. Success rates for new drugs entering clinical testing in the united states. Clin. Pharmacol. Ther. 1995, 58, 1–14. [Google Scholar] [CrossRef]
  5. Paul, S.M.; Mytelka, D.S.; Dunwiddie, C.T.; Persinger, C.C.; Munos, B.H.; Lindborg, S.R.; Schacht, A.L. How to improve r&d productivity: The pharmaceutical industry’s grand challenge. Nat. Rev. Drug Discov. 2010, 9, 203–214. [Google Scholar] [PubMed]
  6. Avorn, J. The 2.6 billion pill—Methodologic and policy considerations. N. Engl. J. Med. 2015, 372, 1877–1879. [Google Scholar] [CrossRef] [PubMed]
  7. Dowden, H.; Munro, J. Trends in clinical success rates and therapeuticfocus. Nat. Rev. Drug Discov. 2019, 18, 495–496. [Google Scholar] [CrossRef]
  8. Harrison, R.K. Phase II and phase III failures: 2013-2015. Nat. Rev. Drug Discov. 2016, 15, 817–818. [Google Scholar] [CrossRef] [PubMed]
  9. Sun, D.; Gao, W.; Hu, H.; Zhou, S. Why 90% of clinical drug development fails and how to improve it? Acta Pharm. Sin. B 2022, 12, 3049–3062. [Google Scholar] [CrossRef] [PubMed]
  10. Daoud, N.E.H.; Borah, P.; Deb, P.K.; Venugopala, K.N.; Hourani, W.; Alzweiri, M.; Bardaweel, S.K.; Tiwari, V. ADMET Profiling in Drug Discovery and Development: Perspectives of In Silico, In Vitro and Integrated Approaches. Curr. Drug Metab. 2021, 22, 503–522. [Google Scholar] [CrossRef]
  11. Jiménez-Luna, J.; Grisoni, F.; Weskamp, N.; Schneider, G. Artificial intelligence in drug discovery: Recent advances and future perspectives. Expert Opin. Drug Discov. 2021, 16, 949–959. [Google Scholar] [CrossRef]
  12. Ma, J.; Sheridan, R.P.; Liaw, A.; Dahl, G.E.; Svetnik, V. Deep neural nets as a method for quantitative structurecactivity relationships. Chem. Inf. Model. 2015, 55, 263–274. [Google Scholar] [CrossRef] [PubMed]
  13. Cáceres, E.L.; Tudor, M.; Cheng, A.C. Deep learning approaches in predicting admet properties. Future Med. Chem. 2020, 12, 1995–1999. [Google Scholar] [CrossRef] [PubMed]
  14. Schneider, P.; Walters, W.P.; Plowright, A.T.; Sieroka, N.; Listgarten, J.; Goodnow, R.A., Jr.; Fisher, J.; Jansen, J.M.; Duca, J.S.; Rush, T.S.; et al. Rethinking drug design in the artificial intelligence era. Nat. Rev. Drug Discov. 2020, 19, 353–364. [Google Scholar] [CrossRef] [PubMed]
  15. Gupta, R.; Srivastava, D.; Sahu, M.; Tiwari, S.; Ambasta, R.K.; Kumar, P. Artificial intelligence to deep learning: Machine intelligence approach for drug discovery. Mol. Divers. 2021, 25, 1315–1360. [Google Scholar] [CrossRef] [PubMed]
  16. Yu, Y.; Xu, T.; Li, J.; Qiu, Y.; Rong, Y.; Gong, Z.; Cheng, X.; Dong, L.; Liu, W.; Li, J.; et al. A Novel Scalarized Scaffold Hopping Algorithm with Graph-Based Variational Autoencoder for Discovery of JAK1 Inhibitors. ACS Omega 2021, 6, 22945–22954. [Google Scholar] [CrossRef] [PubMed]
  17. Jorgensen, W.L.; Duffy, E.M. Prediction of drug solubility from Monte Carlo simulations. Bioorganic Med. Chem. Lett. 2000, 10, 1155–1158. [Google Scholar] [CrossRef]
  18. Duffy, A.; Jorgensen, W.L. Prediction of Properties from Simulations: Free Energies of Solvation in Hexadecane, Octanol, and Waterr. Am. Chem. Soc. 2000, 122, 2878–2888. [Google Scholar] [CrossRef]
  19. Ying, C.; Cai, T.; Luo, S.; Zheng, S.; Ke, G.; He, D.; Shen, Y.; Liu, T.Y. Do transformers really perform badly for graph representation? Adv. Neural Inf. Process. Syst. 2021, 34, 28877–28888. [Google Scholar]
  20. Shen, T.; Wu, J.; Lan, H.; Zheng, L.; Pei, J.; Wang, S.; Liu, W.; Huang, J. When homologous sequences meet structural decoys: Accurate contact prediction by tfold in casp14-(tFold for CASP14 contact prediction). Proteins Struct. Funct. Bioinform. 2021, 89, 1901–1910. [Google Scholar] [CrossRef]
  21. Xiong, G.; Wu, Z.; Yi, J.; Fu, L.; Yang, Z.; Hsieh, C.; Yin, M.; Zeng, X.; Wu, C.; Lu, A.; et al. Admetlab 2.0: An integrated online platform for accurate and comprehensive predictions of admet properties. Nucleic Acids Res. 2021, 49, W5–W14. [Google Scholar] [CrossRef]
  22. Klaassen, C.D. Casarett & doull’s toxicology: The basic science of poisons. In Biotransformation of Xenobiotics, 9th ed.; McGraw Hill: New York, NY, USA, 2019. [Google Scholar]
  23. Wu, Z.; Lei, T.; Shen, C.; Wang, Z.; Cao, D.; Hou, T. ADMET evaluation in drug discovery. 19. Reliable prediction of human cytochrome P450 inhibition using artificial intelligence approaches. J. Chem. Inf. Model. 2019, 59, 4587–4601. [Google Scholar] [CrossRef]
  24. Bocci, G.; Carosati, E.; Vayer, P.; Arrault, A.; Lozano, S.; Cruciani, G. Adme-space: A new tool for medicinal chemists to explore adme properties. Sci. Rep. 2017, 7, 6359. [Google Scholar] [CrossRef]
  25. Zin, P.P.K.; Williams, G.J.; Ekins, S. Cheminformatics Analysis and Modeling with MacrolactoneDB. Sci. Rep. 2020, 10, 6284. [Google Scholar] [CrossRef]
  26. Vamathevan, J.; Clark, D.; Czodrowski, P.; Dunham, I.; Ferran, E.; Lee, G.; Li, B.; Madabhushi, A.; Shah, P.; Spitzer, M.; et al. Applications of machine learning in drug discovery and development. Nat. Rev. Drug Discov. 2019, 18, 463–477. [Google Scholar] [CrossRef] [PubMed]
  27. Xu, K.; Hu, W.; Leskovec, J.; Jegelka, S. How powerful are graph neural networks? In Proceedings of the International Conference on Learning Representations, New Orleans, LA, USA, 6–9 May 2019. [Google Scholar]
  28. Shi, Y.; Zheng, S.; Ke, G.; Shen, Y.; You, J.; He, J.; Luo, S.; Liu, C.; He, D.; Liu, T.-Y. Benchmarking graphormeron large-scale molecular modeling datasets. Mach. Learn. 2022. [Google Scholar] [CrossRef]
  29. Prokhorenkova, L.; Gusev, G.; Vorobev, A.; Dorogush, A.V.; Gulin, A. Catboost: Unbiased boosting with categorical features. In Proceedings of the 31st International Conference on Neural Information Processing Systems, Long Beach, CA, USA, 4–9 December 2017. [Google Scholar]
  30. Samat, A.; Li, E.; Du, P.; Liu, S.; Miao, Z.; Zhang, W. CatBoost for RS Image Classification with Pseudo Label Support From Neighbor Patches-Based Clustering. IEEE Geosci. Remote. Sens. Lett. 2022, 19, 1–5. [Google Scholar] [CrossRef]
  31. Hamzah, H.; Bustamam, A.; Yanuar, A.; Sarwinda, D. Predicting the molecular structure relationship and the biological activity of dpp-4 inhibitor using deep neural network with catboost method as feature selection. In Proceedings of the 2020 International Conference on Advanced Computer Science and Information Systems, Depok, Indonesia, 17–18 October 2020; pp. 101–108. [Google Scholar]
  32. Anderson, E.; Veith, G.; Weininger, D. SMILES: A Line Notation and Computerized Interpreter for Chemical Structures; U.S. Environmental Protection Agency: Washington, DC, USA, 1987.
  33. Weininger, D. Smiles, a chemical language and information system. Chem. Inf. Comput. Sci. 1988, 28, 31–36. [Google Scholar] [CrossRef]
  34. Weininger, D.; Weininger, A.; Weininger, J.L. SMILES. 2. Algorithm for generation of unique SMILES notation. Chem. Inf. Comput. Sci. 1989, 29, 97–101. [Google Scholar] [CrossRef]
  35. Boobier, S.; Hose, D.R.J.; Blacker, A.J.; Nguyen, B.N. Machine learning with physicochemical relationships: Solubility prediction in organic solvents and water. Nat. Commun. 2020, 11, 5753. [Google Scholar] [CrossRef]
  36. Sorkun, M.C.; Khetan, A.; Er, S. AqSolDB, a curated reference set of aqueous solubility and 2D descriptors for a diverse set of compounds. Sci. Data 2019, 6, 143. [Google Scholar] [CrossRef] [PubMed]
  37. Huuskonen, J. Estimation of Aqueous Solubility for a Diverse Set of Organic Compounds Based on Molecular Topology. Chem. Inf. Comput. Sci. 2000, 40, 773–777. [Google Scholar] [CrossRef] [PubMed]
  38. Shargel, L.; Wu-Pong, S.; Yu, A.C. Applied Biopharmaceutics & Pharmacokinetics, 6th ed.; McGraw Hill: New York, NY, USA, 2012. [Google Scholar]
  39. Kaboudi, N.; Shayanfar, A. Predicting the Drug Clearance Pathway with Structural Descriptors. Eur. J. Drug Metab. Pharmacokinet. 2022, 47, 363–369. [Google Scholar] [CrossRef] [PubMed]
  40. Benet, L.Z.; Kroetz, D.L.; Sheiner, L.B. The Pharmacological Basis of Therapeutics, 10th ed.; McGraw Hill: New York, NY, USA, 2001. [Google Scholar]
  41. Volpe, D.A. Advances in cell-based permeability assays to screen drugs for intestinal absorption. Expert Opin. Drug Discov. 2020, 15, 539–549. [Google Scholar] [CrossRef] [PubMed]
  42. Gao, D.; Liu, H.; Lin, J.M.; Wang, Y.; Jiang, Y. Characterization of drug permeability in Caco-2 monolayers by mass spectrometry on a membrane-based microfluidic device. Lab Chip 2013, 13, 978–985. [Google Scholar] [CrossRef]
  43. Thomas, S.N.; French, D.; Jannetto, P.J.; Rappold, B.A.; Clarke, W.A. Liquid chromatography–tandem mass spectrometry for clinical diagnostics. Nat. Rev. Methods Prim. 2022, 2, 96. [Google Scholar] [CrossRef]
  44. Geldenhuys, W.J.; Mohammad, A.S.; Adkins, C.E.; Lockman, P.R. Molecular determinants of blood-brain barrier permeation. Ther. Deliv. 2015, 6, 961–971. [Google Scholar] [CrossRef]
  45. Trainor, G.L. The importance of plasma protein binding in drug discovery. Expert Opin. Drug Discov. 2007, 2, 51–64. [Google Scholar] [CrossRef]
  46. Williams, S.A.; Kivimaki, M.; Langenberg, C.; Hingorani, A.D.; Casas, J.P.; Bouchard, C.; Jonasson, C.; Sarzynski, M.A.; Shipley, M.J.; Alexander, L.; et al. Plasma protein patterns as comprehensive indicators of health. Nat. Med. 2019, 25, 1851–1857. [Google Scholar] [CrossRef] [PubMed]
  47. Kelly, G.E.; Lindsey, J.K. Robust estimation of the median lethal dose. J. Biopharm. Stat. 2002, 12, 137–147. [Google Scholar] [CrossRef]
  48. Dearden, J.C.; Hewitt, M. Prediction of Human Lethal Doses and Concentrations of MEIC Chemicals from Rodent LD50 Values: An Attempt to Make Some Reparation. Altern. Lab. Anim. 2021, 49, 10–21. [Google Scholar] [CrossRef] [PubMed]
Figure 1. Enhanced Graphormer model architecture.
Electronics 13 00624 g001
Figure 2. (a) Scatter-plot of logS for iDrug; (b) Scatter-plot of logS for ADMETLab; (c) Scatter-plot of logS for the enhanced model.
Electronics 13 00624 g002
Figure 3. (a) Scatter-plot of CL for iDrug; (b) Scatter-plot of CL for ADMETLab; (c) Scatter-plot of CL for the enhanced model.
Electronics 13 00624 g003
Figure 4. (a) Scatter-plot of PAPP for iDrug; (b) Scatter-plot of PAPP for ADMETLab; (c) Scatter-plot of PAPP for the enhanced model.
Electronics 13 00624 g004
Figure 5. AUC of the model.
Electronics 13 00624 g005
Figure 6. Loss of the model.
Electronics 13 00624 g006
Table 1. Data source of the experiments. logS/CL/caco-2/PPB/LD50 contain 1128, 2999, 1209, 2081, and 2633 entries, respectively.
FeatureOutput UnitData SourceData Size
logSlog (mol/L)data-src (Delaney)1128
CLmL/min/kgchembl2999
Caco-2 (papp)cm/schembl1209
PPB%chembl2081
LD50mg/kgchembl2633
Table 2. The results of SMAPE and PCC on various tasks.
ModelSMAPE ResultPCC ResultSMAPE Rank#PCC Rank#
iDrug34.10.4645
ADMETLab31.70.5833
QikProp29.40.6022
DS74.20.5654
Enhanced Graphormer18.90.8611
Table 3. The logS results of R2, SMAPE and PCC on various tasks.
ModelR2 ResultPCC ResultSMAPE ResultR2 Rank#PCC Rank#SAMPE Rank#
iDrug0.9440.97217.4112
ADMETLab0.9360.96918.2223
QikProp0.80.932.1554
DS0.880.952844445
Enhanced Graphormer0.90.95325.1331
Table 4. The CL results of R2, SMAPE and PCC on various tasks.
ModelR2 ResultPCC ResultSMAPE ResultR2 Rank#PCC Rank#SAMPE Rank#
iDrug0.620.9896112
ADMETLab0.50.3286323
QikProp//////
DS//////
Enhanced Graphormer0.70.8438211
Table 5. The PAPP results of R2, SMAPE and PCC on various tasks.
ModelR2 ResultPCC ResultSMAPE ResultR2 Rank#PCC Rank#SAMPE Rank#
iDrug0.740.875.2211
ADMETLab0.520.727.1433
QikProp1.580.2514.8444
DS//////
Enhanced Graphormer0.620.86.6322
Table 6. The PPB results of R2, SMAPE and PCC on various tasks.
ModelR2 ResultPCC ResultSMAPE ResultR2 Rank#PCC Rank#SAMPE Rank#
iDrug0.230.5117.5333
ADMETLab0.330.5915.9222
QikProp//////
DS//////
Enhanced Graphormer0.650.8112.2111
Table 7. The LD50 results of R2, SMAPE and PCC on various tasks.
ModelR2 ResultPCC ResultSMAPE ResultR2 Rank#PCC Rank#SAMPE Rank#
iDrug0.90.16834.2123
ADMETLab//////
QikProp//////
DS0.780.169104.3332
Enhanced Graphormer0.7810.8712.8211
Disclaimer/Publisher’s Note: The statements, opinions and data contained in all publications are solely those of the individual author(s) and contributor(s) and not of MDPI and/or the editor(s). MDPI and/or the editor(s) disclaim responsibility for any injury to people or property resulting from any ideas, methods, instructions or products referred to in the content.

