Article

Detection of Underground Dangerous Area Based on Improving YOLOV8

College of Communication and Information Engineering, Xi’an University of Science and Technology, Xi’an 710054, China
*
Author to whom correspondence should be addressed.
Electronics 2024, 13(3), 623; https://doi.org/10.3390/electronics13030623
Submission received: 12 October 2023 / Revised: 12 December 2023 / Accepted: 31 January 2024 / Published: 2 February 2024
(This article belongs to the Special Issue Deep Learning in Computer Vision and Image Processing)

Abstract

:
In order to improve the safety needs of personnel in the dark environment under the well, this article adopts the improved YOLOV8 algorithm combined with the ray method to determine whether underground personnel are entering dangerous areas and to provide early warning. First of all, this article introduces the coordinate attention mechanism on the basis of YOLOV8 target detection so that the model pays attention to the location information of the target area so as to improve the detection accuracy of obstruction and small target areas. In addition, the Soft-Non-Maximum Suppression (SNMS) module is introduced to further improve accuracy. The improved model is then combined with the ray method to be deployed and applied under a variety of angles and different scenic information cameras. The experimental results show that the proposed method obtains 99.5% of the identification accuracy and a frame speed of 45 Frames Per Second (FPS) on the self-built dataset. Compared with the YOLOV8 model, it has a higher accuracy and can effectively cope with the changes and interference factors in the underground environment. Further, it meets the requirements for real-time testing in dangerous underground areas.

1. Introduction

The coal industry plays a foundational role in the rapid development of China’s national economy. In 2022, China possessed approximately 15.1% of the world’s coal reserves, ranking third globally, only behind the United States and Russia. Coal production increased by 7.9% compared to the previous year, exceeding 50.8% of global coal production. Coal consumption also saw a 0.6% increase, reaching 161.10 EJ, accounting for 27% of the world’s total and making China the leading consumer in the world [1]. In China, coal mining environments are complex, and accidents can result in significant economic losses and casualties. Therefore, personnel detection in hazardous underground areas is a necessary safety measure [2].
Typically, many key safety areas underground are primarily managed through personnel monitoring. Currently, video surveillance systems are widely used in coal mining production management. The underground environment is dimly lit, the mine tunnels are intricate, and workers are susceptible to entering dangerous zones. Blind spots in the line of sight exist for coal mining underground excavation and transportation equipment. Presently, manual shift monitoring is employed at various workstations to determine whether individuals have entered hazardous areas. However, the multiple monitoring points and small monitor screens impose high demands on the workers, leading to fatigue and reduced concentration over time. This may result in a delayed response to the occurrence of danger or erroneous judgments of certain behaviors. Therefore, the automated detection of underground personnel in coal mines is essential [3].
In recent years, with the improvement of hardware equipment, deep learning technology has developed rapidly. Convolutional neural networks can replace traditional hand-designed features [4], and the extracted features have advanced semantic expression capabilities, strong feature expression capabilities, and better robustness [5,6,7,8]. They are used in image classification and great achievements have been made in computer vision fields such as detection [9,10]. Currently, underground personnel detection methods in coal mines primarily utilize deep-learning-based object-detection frameworks. The first category involves regression-based deep convolutional object detection algorithms, with notable examples being the YOLO (you only look once) series, particularly YOLOv5 [11]. YOLOv5 has designed two CSP structures to adapt to different tasks and incorporated the Focus operation for slicing to enhance speed. YOLOv8 shares a similar backbone with YOLOv5, but the C3 module is replaced by the C2f module based on the CSP concept [12]. This substitution in YOLOv8 ensures lightweight processing while obtaining richer gradient flow information, achieving the highest accuracy to date. Zhuo et al. [13] proposed a lightweight network called DAMP-YOLO. It combines the deformable CSP bottleneck (DCB) module, aggregated triple attention (ATA) mechanism, instrumented data augmentation (MDA), and network pruning (NP) with the YOLOv8 model to overcome the problem of missed detection or incorrect identification, thereby confirming the feasibility of its practical application. Wang et al. [14] proposed a road defect detection model YOLOv8s based on the enhanced version. This method uses the BiFPN method to reconstruct the neck structure of the original model, reduces the model size, and enhances feature fusion capabilities. It then uses the SimSPPF module to optimize the spatial pyramid pooling layer to improve the detection speed of the model. Finally, the LSK attention mechanism of the dynamic large convolution kernel is introduced to improve the detection accuracy of the model. Experimental results show that the model is effective in detecting road defects from images captured by drones and on-board cameras. Kumar et al. [15] proposed using combined data from multiple severe weather datasets for transfer learning training to enhance yolov8-based severe weather target detection. Szrek et al. [16] proposed many scenarios involving underground mine rescue and introduced the test results of a UGV robot system equipped with a sensing system and image processing module. This module is based on an adaptation of the YOLO and histogram of oriented gradients (HOG) algorithms. Li and Wang et al. [17] proposed an enhanced YOLOv4 model for safety monitoring and real-time positioning of underground miners, achieving 96.25% and 48.2 fps in global AP (average accuracy) and detection speed, respectively. The enhanced YOLOv4 model also has excellent robustness and generalization capabilities and is very suitable for the detection of underground individuals, providing a solid guarantee for the safety management and monitoring of underground workers. Wang and Guo et al. [18] proposed an improved YOLOv3 (YOLOv3-4l) algorithm for intelligent obstacle detection. By locating the track and extending it a certain distance outside the track, unsafe areas for electric locomotives to travel can be found. In response to the need for the real-time detection of obstacles in front of underground rail mine cars, Biao et al. [19] proposed a new system that simultaneously utilizes camera and lidar information. The system uses a custom point cloud clustering algorithm designed for challenging mine environments to extract obstacle information and then uses the YOLOv5 algorithm to identify obstacles in the generated images. Imam et al. [20] proposed a new underground pedestrian detection and anti-collision system based on RGB images collected from five different mines. The accuracy of the yolov5 they used reached 75%, and the MAP reached 71%. Li and Zhang et al. [21] combined YOLOv2 with the FCN skip structure to improve the accuracy of pedestrian recognition in coal mines. Fengbo et al. [22] proposed an improved algorithm for pedestrian detection in mines, yolov4-tinySPP, based on yolov4-tiny. This algorithm solves the problem of pedestrian occlusion in mines. Tumas et al. [23] proposed a deep-learning-based data augmentation technology that uses six of the most accurate and fastest detectors (TinyV3, TinyL3, YOLOv3, YOLOv4, ResNet50, and ResNext50) to enrich the data under good weather conditions. The far-infrared images are collected with distortions similar to those caused by severe weather. Based on the YOLOv5 target detection algorithm and OpenPose human posture estimation algorithm to analyze the status of objects and human behavior in video data, Hou et al. [24] proposed a behavior determination method to identify the unsafe behaviors of miners. In order to solve the problem of the low obstacle recognition accuracy of the existing underground unmanned electric locomotives in coal mines due to the harsh tunnel environment, Yang et al. [25] proposed a PDM-YOLO model for the accurate and real-time detection of obstacles on unmanned electric locomotives. The SSD (single-shot multi-box detector) object detection algorithm is based on a feedforward convolutional network. Different convolutional kernel sizes are used in each feature layer of the base network for detection. This allows the algorithm to obtain predictions at multiple scales, enabling the multi-scale detection of images. After processing the predictions with a non-maximal suppression (NMS) algorithm, the final detection results are obtained. Fu et al. [26] proposed the DSSD algorithm based on the SSD, introducing a residual module before classification and regression. This deepens the network, fusing various semantic pieces of information and improving detection accuracy. Jeong et al. [27] introduced an RSSD fusion algorithm, which further integrates network features from different layers through a combination of feature map pooling and deconvolution [28]. This synchronous process effectively addresses the issue of duplicate boxes in the original SSD feature maps, enhancing the success rate of detecting small target objects. Li et al. [29] presented FSSD, which adjusts some features in the network to the same size before connecting, creating a pixel layer as the foundation for generating a feature pyramid. The second category involves deep convolutional neural network object detection algorithms based on candidate regions. Representative algorithms include R-CNN [30], Fast R-CNN [31], and Faster R-CNN [32]. These algorithms divide object detection into two steps: first, a region proposal algorithm generates candidate regions possibly containing targets; then, CNN is used to classify and position these candidate regions. Mansouri et al. [33] proposed a convolutional neural network (CNN) method for autonomous navigation of a low-cost micro air vehicle (MAV) platform in dark underground mines. Song et al. [34] proposed an illumination-aware faster R-CNN (IAF R-CNN). To provide an illumination measure of the input image, an illumination-aware network is introduced. And it was found that the confidence in detecting pedestrians in color or thermal images is directly proportional to the lighting conditions. Cui et al. [35] proposed a CNN-LSTM underground personnel-behavior-pattern-recognition model based on the convolutional neural network CNN and LSTM network to assist the underground smartphone personnel positioning algorithm to update the miner’s location, thereby improving the anti-interference of the underground personnel positioning algorithm. In order to realize the recognition of abnormal gestures of water exploration and discharge in coal mines, Ren et al. [36] studied the long-short-term-memory CNN network model that integrates the attention mechanism and verified the feasibility of abnormal behavior recognition. This process is repeated for each candidate region, limiting detection speed [37].
After careful evaluation, YOLOv8 stands out as the most optimal algorithm in current object detection, striking a balance between speed and accuracy. Therefore, to meet the safety requirements of personnel in the dim underground environment, this paper employs an improved YOLOv8 algorithm combined with a ray method [38] to determine whether personnel have entered hazardous areas and issue warnings. First, this paper introduces a coordinate attention mechanism based on the YOLOv8 object detection to make the model focus on the location information of target regions, thereby improving the accuracy of detection for obscured and small target areas. Additionally, the SNMS module is introduced to further enhance accuracy. Then, the improved model is combined with the ray method and deployed using cameras with various angles and different depths of field information. Based on the division of training and validation datasets, the detection performance of different algorithms is evaluated. Compared to the traditional YOLOv8 algorithm, this approach enhances model accuracy, robustness, and application performance.

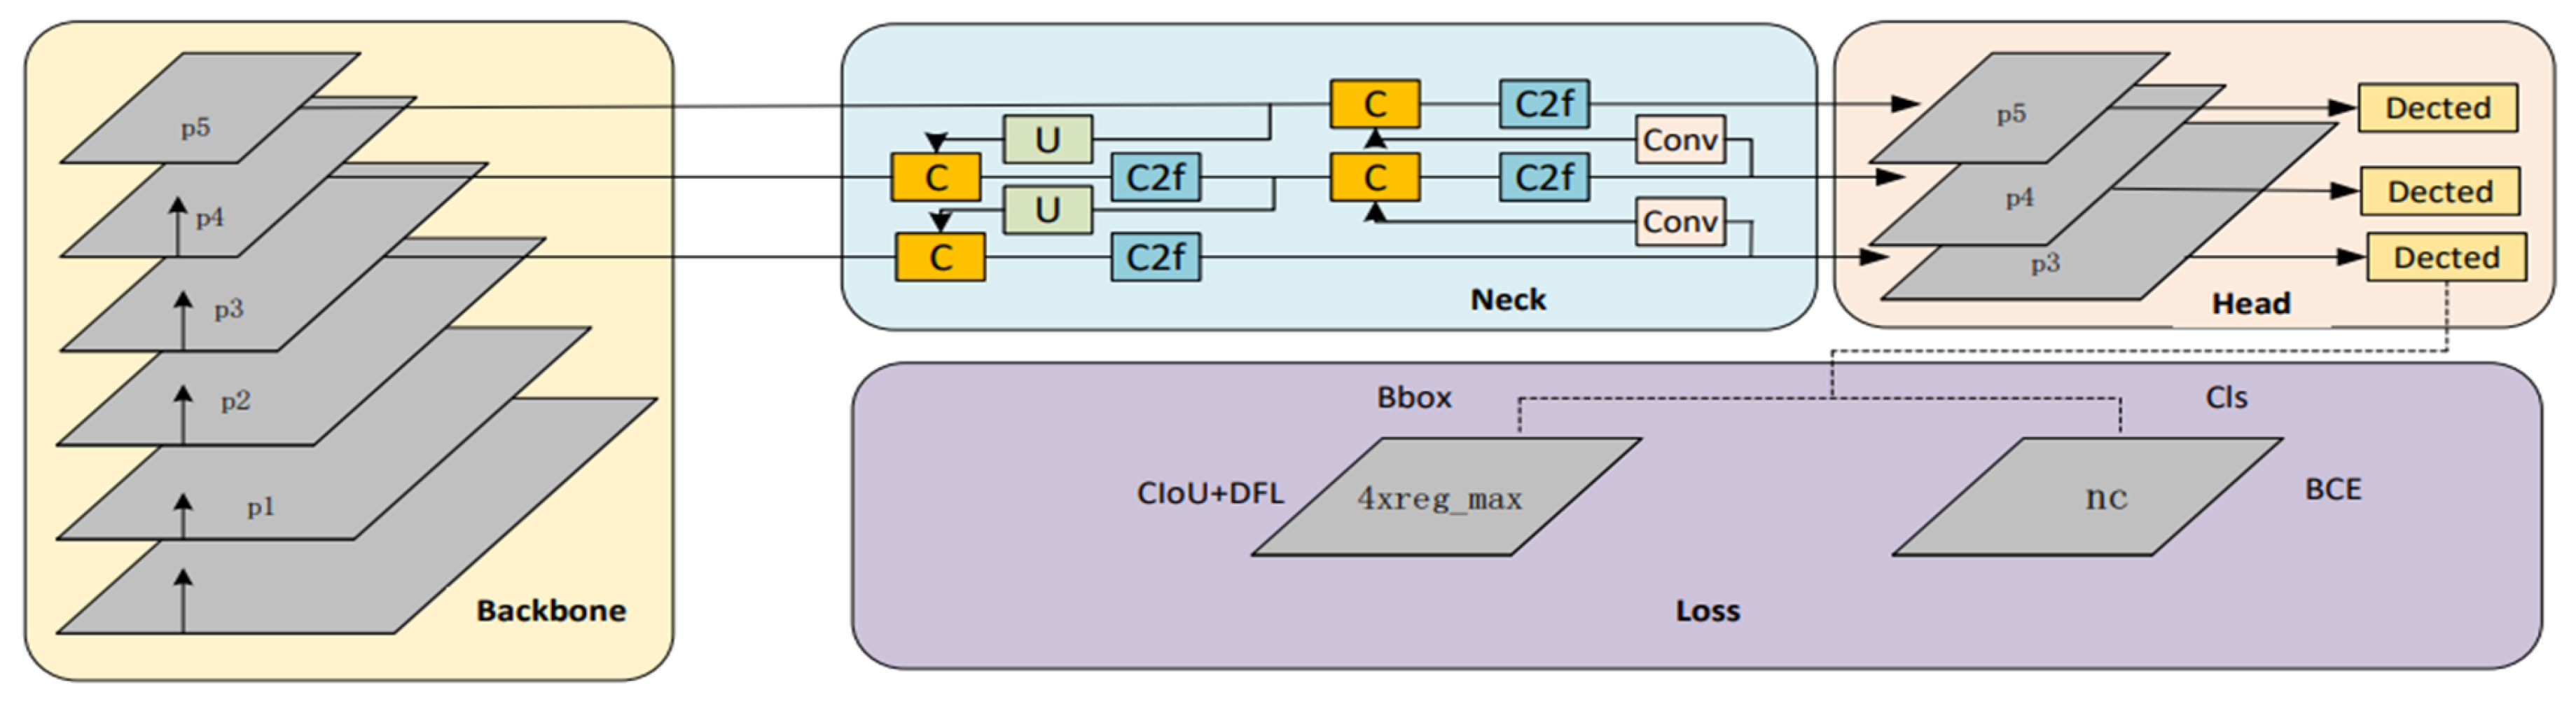
2. YOLOV8 Algorithm Principle

The YOLOv8 algorithm, the latest addition to the YOLO series, was introduced by Ultralytics in 2023. One of its key features is its scalability. YOLOv8 is designed as a framework that supports all the previous versions of YOLO. This allows for easy switching between different versions and performance comparisons [12]. In addition to its scalability, YOLOv8 introduces numerous innovations that make it applicable to a wide range of object detection and image segmentation tasks. These innovations include a new backbone network, a novel anchor-free network detection head, and a new loss function. YOLOv8 is also highly efficient, capable of running on a range of hardware platforms from CPUs to GPUs. The backbone architecture of YOLOv8 is similar to YOLOv5, based on the concept of CSP. It replaces the C3 module with the C2f module, drawing inspiration from the ELAN concept introduced in YOLOv7, resulting in the C2f module. This design not only keeps YOLOv8 lightweight but also enhances gradient flow information. At the end of the backbone, the popular SPPF module is still used. It passes through three Maxpools, each of size 5 × 5, and concatenates the layers to ensure accuracy across different object scales while maintaining efficiency. In the neck section, YOLOv8 continues to use the PAN-FPN feature fusion method. This strengthens the fusion and utilization of feature layers across different scales. YOLOv8’s authors incorporate two up-sampling layers, multiple C2f modules, and a final decoupled head structure to create the neck module. The idea of head decoupling from YOLOx is employed in the final part of the neck. It combines confidence scores with regression boxes, achieving a new level of precision. For positive and negative sample allocation, the YOLOv8 algorithm employs the TOOD task-aligned allocator, which selects positive samples based on weighted scores from classification and regression.
YOLOv8 supports all versions of YOLO and offers the flexibility to switch between them seamlessly. It can run on various hardware platforms, including CPUs and GPUs, making it highly adaptable. The network architecture of YOLOv8 is depicted in Figure 1.

3. Improvement Model

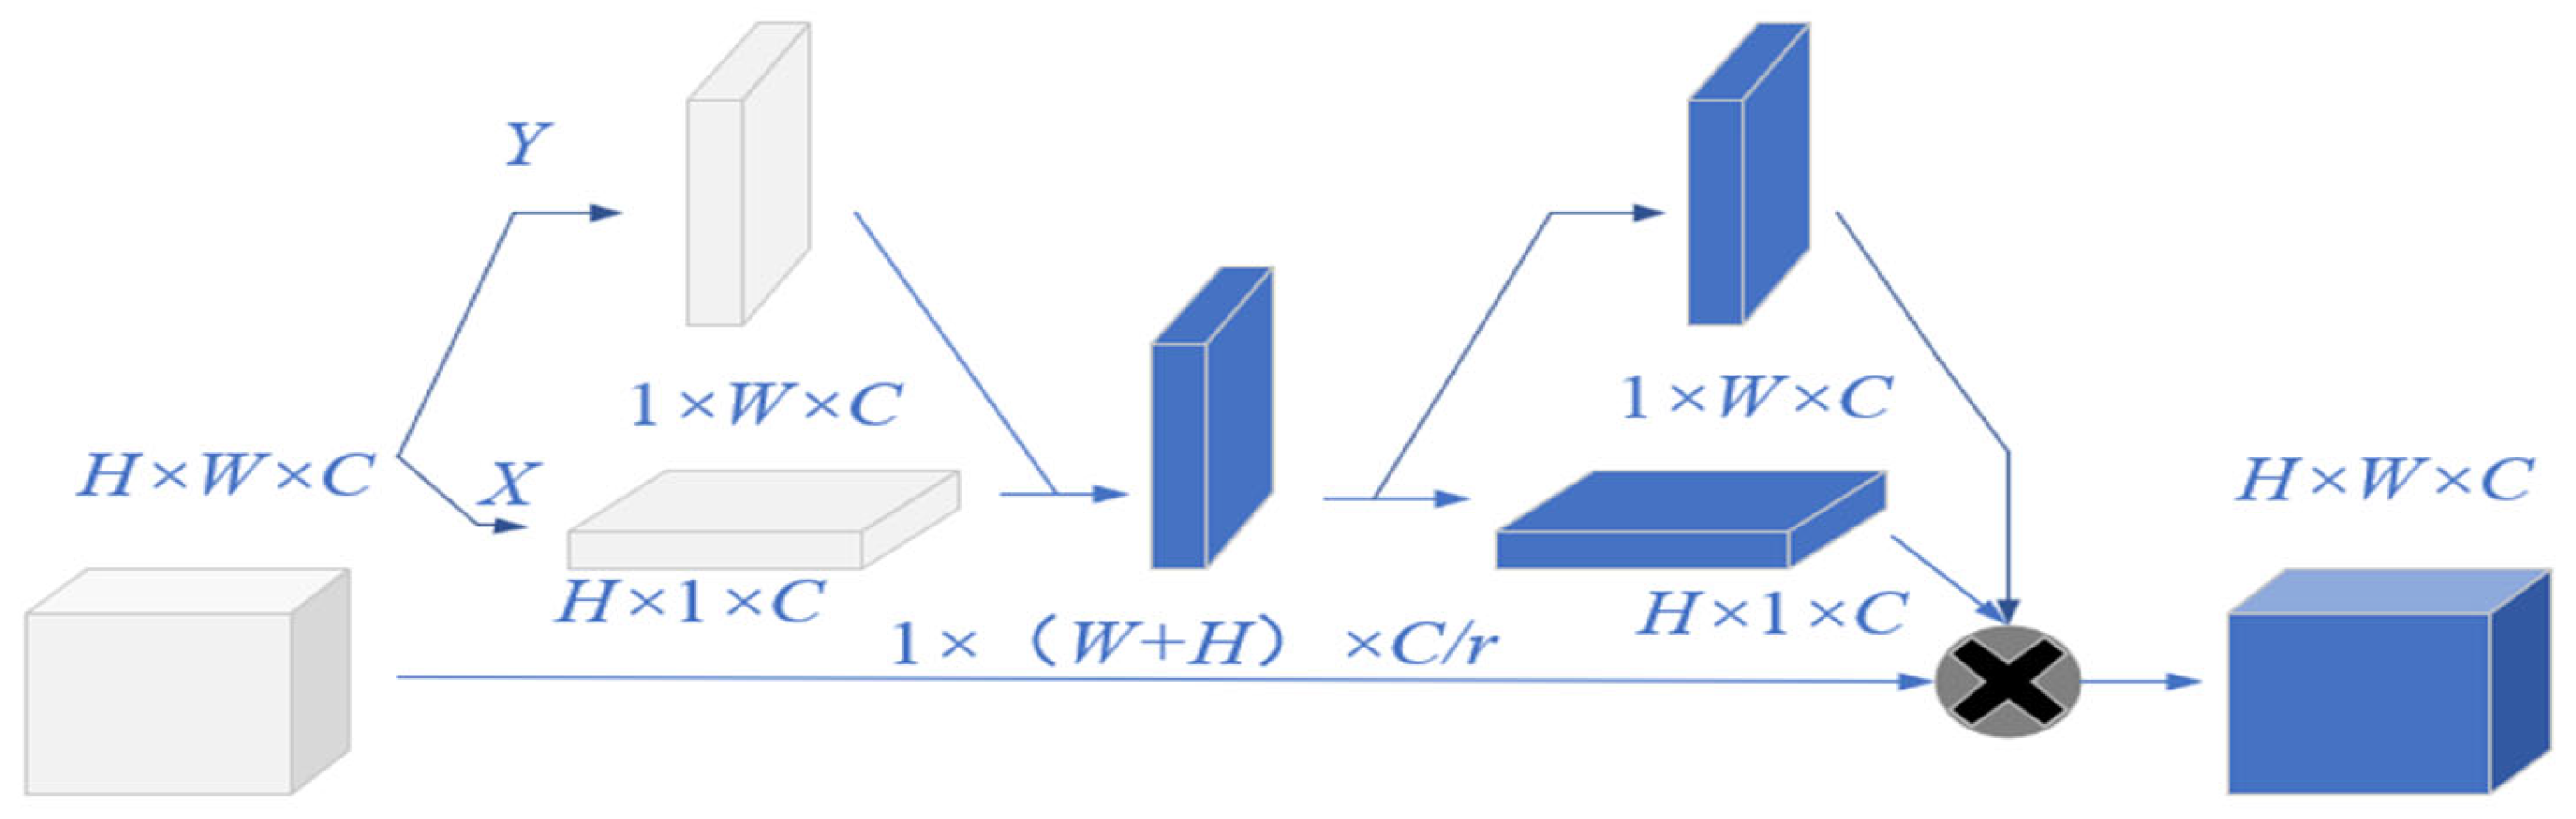
3.1. Introduce CA Attention Mechanism

The attention mechanism originates from the human visual attention system, which involves extracting relevant target information from a vast amount of data. By highlighting valuable information and suppressing low-value data, effective feature extraction is achieved. Therefore, integrating attention at appropriate locations in the network can effectively reduce interference from complex background information, obtain more accurate target feature information, and consequently improve the algorithm’s detection precision. Currently, various attention mechanisms exist. For instance, squeeze and excitation (SE) attention significantly enhances the model’s detection performance by allocating computational resources reasonably across different channels. However, due to channel compression, it also affects the dependency relationships between learned channels. Efficient channel attention (ECA) improves upon SE attention by using one-dimensional convolutional layers to aggregate cross-channel information, yielding more accurate attention information. Nevertheless, ECA overlooks the positional information of image features, limiting its effectiveness. The convolutional block attention module (CBAM), based on a convolutional block attention mechanism, combines both channel and spatial domains, reinforcing the relationship between channel features and spatial dimensions. However, it falls short in capturing dependency information around the target. The lightweight attention models in the channel domain mentioned above only consider singular channel information, neglecting position information in the image. While CBAM considers both channel and position information, it lacks the ability to extract long-range relationships. Coordinate attention (CA), as a lightweight channel attention mechanism, is simple, fast, and plug-and-play mechanism, making it flexible to integrate into the core structure of the algorithm. Balancing both channel and long-distance positional information, CA significantly enhances the expressive power of mobile networks, enabling them to participate in larger regions without incurring substantial computational costs. This capability facilitates better target localization and recognition, outperforming attention mechanisms such as SE, ECA, and CBAM. Therefore, this paper introduces the coordinate attention (CA) module [39] into the yellow-highlighted section, as shown in Figure 2.
The coordinate attention (CA) mechanism first performs average pooling independently in both the width and height directions, followed by convolution and concatenation to reduce the dimensionality to C/r. It then further expands to obtain attention weights in both directions. Finally, these obtained weights are used to perform element-wise multiplication and weighting on the input feature map. The CA structure is illustrated in Figure 3.
To effectively capture both positional information and channel relationships, we decompose the two-dimensional global pooling operation into two one-dimensional pooling encodings by replacing the H × W pooling kernel in the SE module with two separate kernels, H × 1 and 1 × W. The encoding along the width and height directions is represented as shown in Equation (1):
Z σ h h = 1 W 0 i W x σ h , j   , Z σ w h = 1 H 0 i H x σ h , j
where H and W represent the height and width of the feature tensor, h denotes the height of the row where horizontal pooling occurs, w indicates the width of the column where vertical pooling takes place, Z σ h represents the encoding value along the height direction, and Z σ w represents the encoding value along the width direction.

3.2. Improve Non-Maximum Suppression

NMS, short for non-maximum suppression, does exactly what its name implies—it suppresses elements that are not maximum values, seeking local maxima. In recent years, common object detection algorithms, including RCNN, Faster R-CNN, YOLO, and others, all aim to locate numerous rectangular boxes in an image that could potentially contain objects, and subsequently assign a class probability to each of these boxes.
Non-maximum suppression (NMS) is an integral component of object detection. NMS involves sorting all detection boxes based on their scores. The detection box with the highest score, referred to as “M”, is selected, and all other detection boxes that overlap with “M” above a predefined threshold (using intersection over union or IOU) are suppressed. The formula for IOU is shown in Equation (2):
IOU = S I S A + S B + S I .
In the equation, “ S I ” represents the area of overlap between detection boxes A and B, “ S A ” represents the area of detection box A, and “ S B ” represents the area of detection box B.
YOLOv8 employs DIoU as the threshold to filter out other prediction boxes. When two objects are in very close proximity, there is a high likelihood that the prediction box of one object is eliminated. To address this issue, this paper replaces DIoU-NMS with soft-NMS. This algorithm gradually reduces the detection scores of all other objects as they overlap with “m”, ensuring that no objects are entirely eliminated during this process.
S i = { 0 , iou M , b i N t S i , iou M , b i < N t
In Equation (3), “ S i ” represents the score of the i-th detection box, “ b i ” represents the i-th detection box within the set “b” detection boxes, and “ N t ” is a predefined threshold. According to the design of the NMS algorithm, if an object falls within a predefined overlap threshold and has a score below a certain threshold, it may not be detected.
SNMS improves the scores of neighboring detections, reducing their scores to a level where the likelihood of increasing error rates is minimized. The SNMS score reset function is represented as shown in Equation (4):
S i = { S i 1 iou M , b i , iou M , b i < N t S i , iou M , b i < N t .
SNMS achieves a score reduction for other detection boxes that overlap with “M”, ensuring that detection boxes far away from “M” remain unaffected. However, those detection boxes in very close proximity are assigned a higher weight. This effectively addresses the problem of DIoU-NMS failing to detect another object when objects are in close proximity.

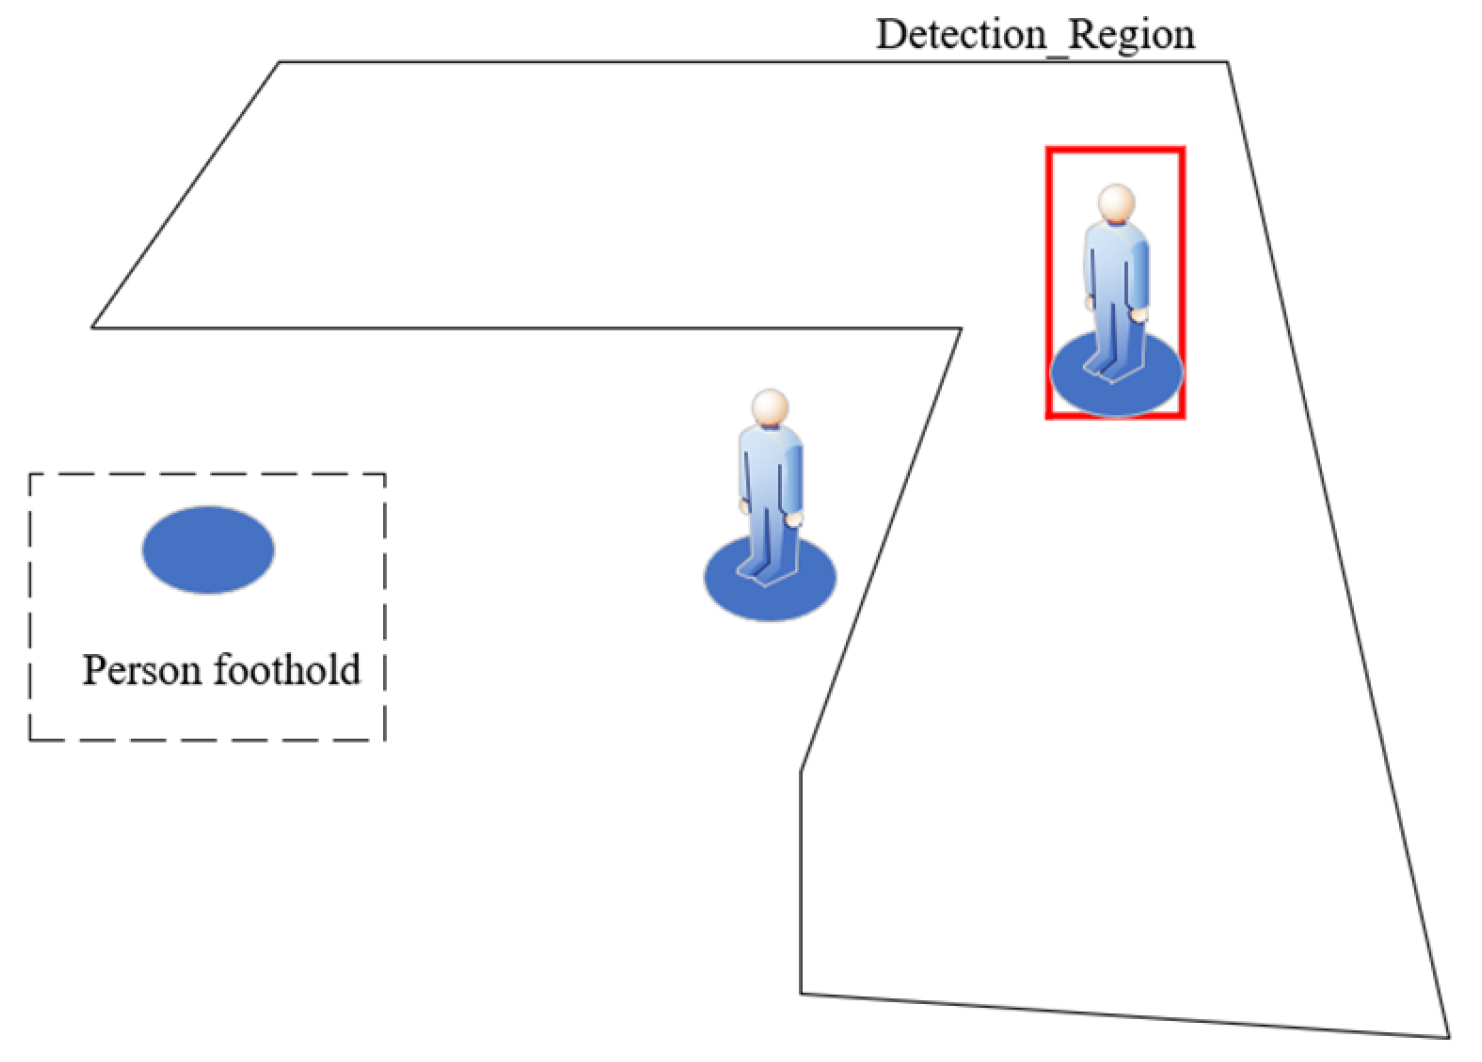
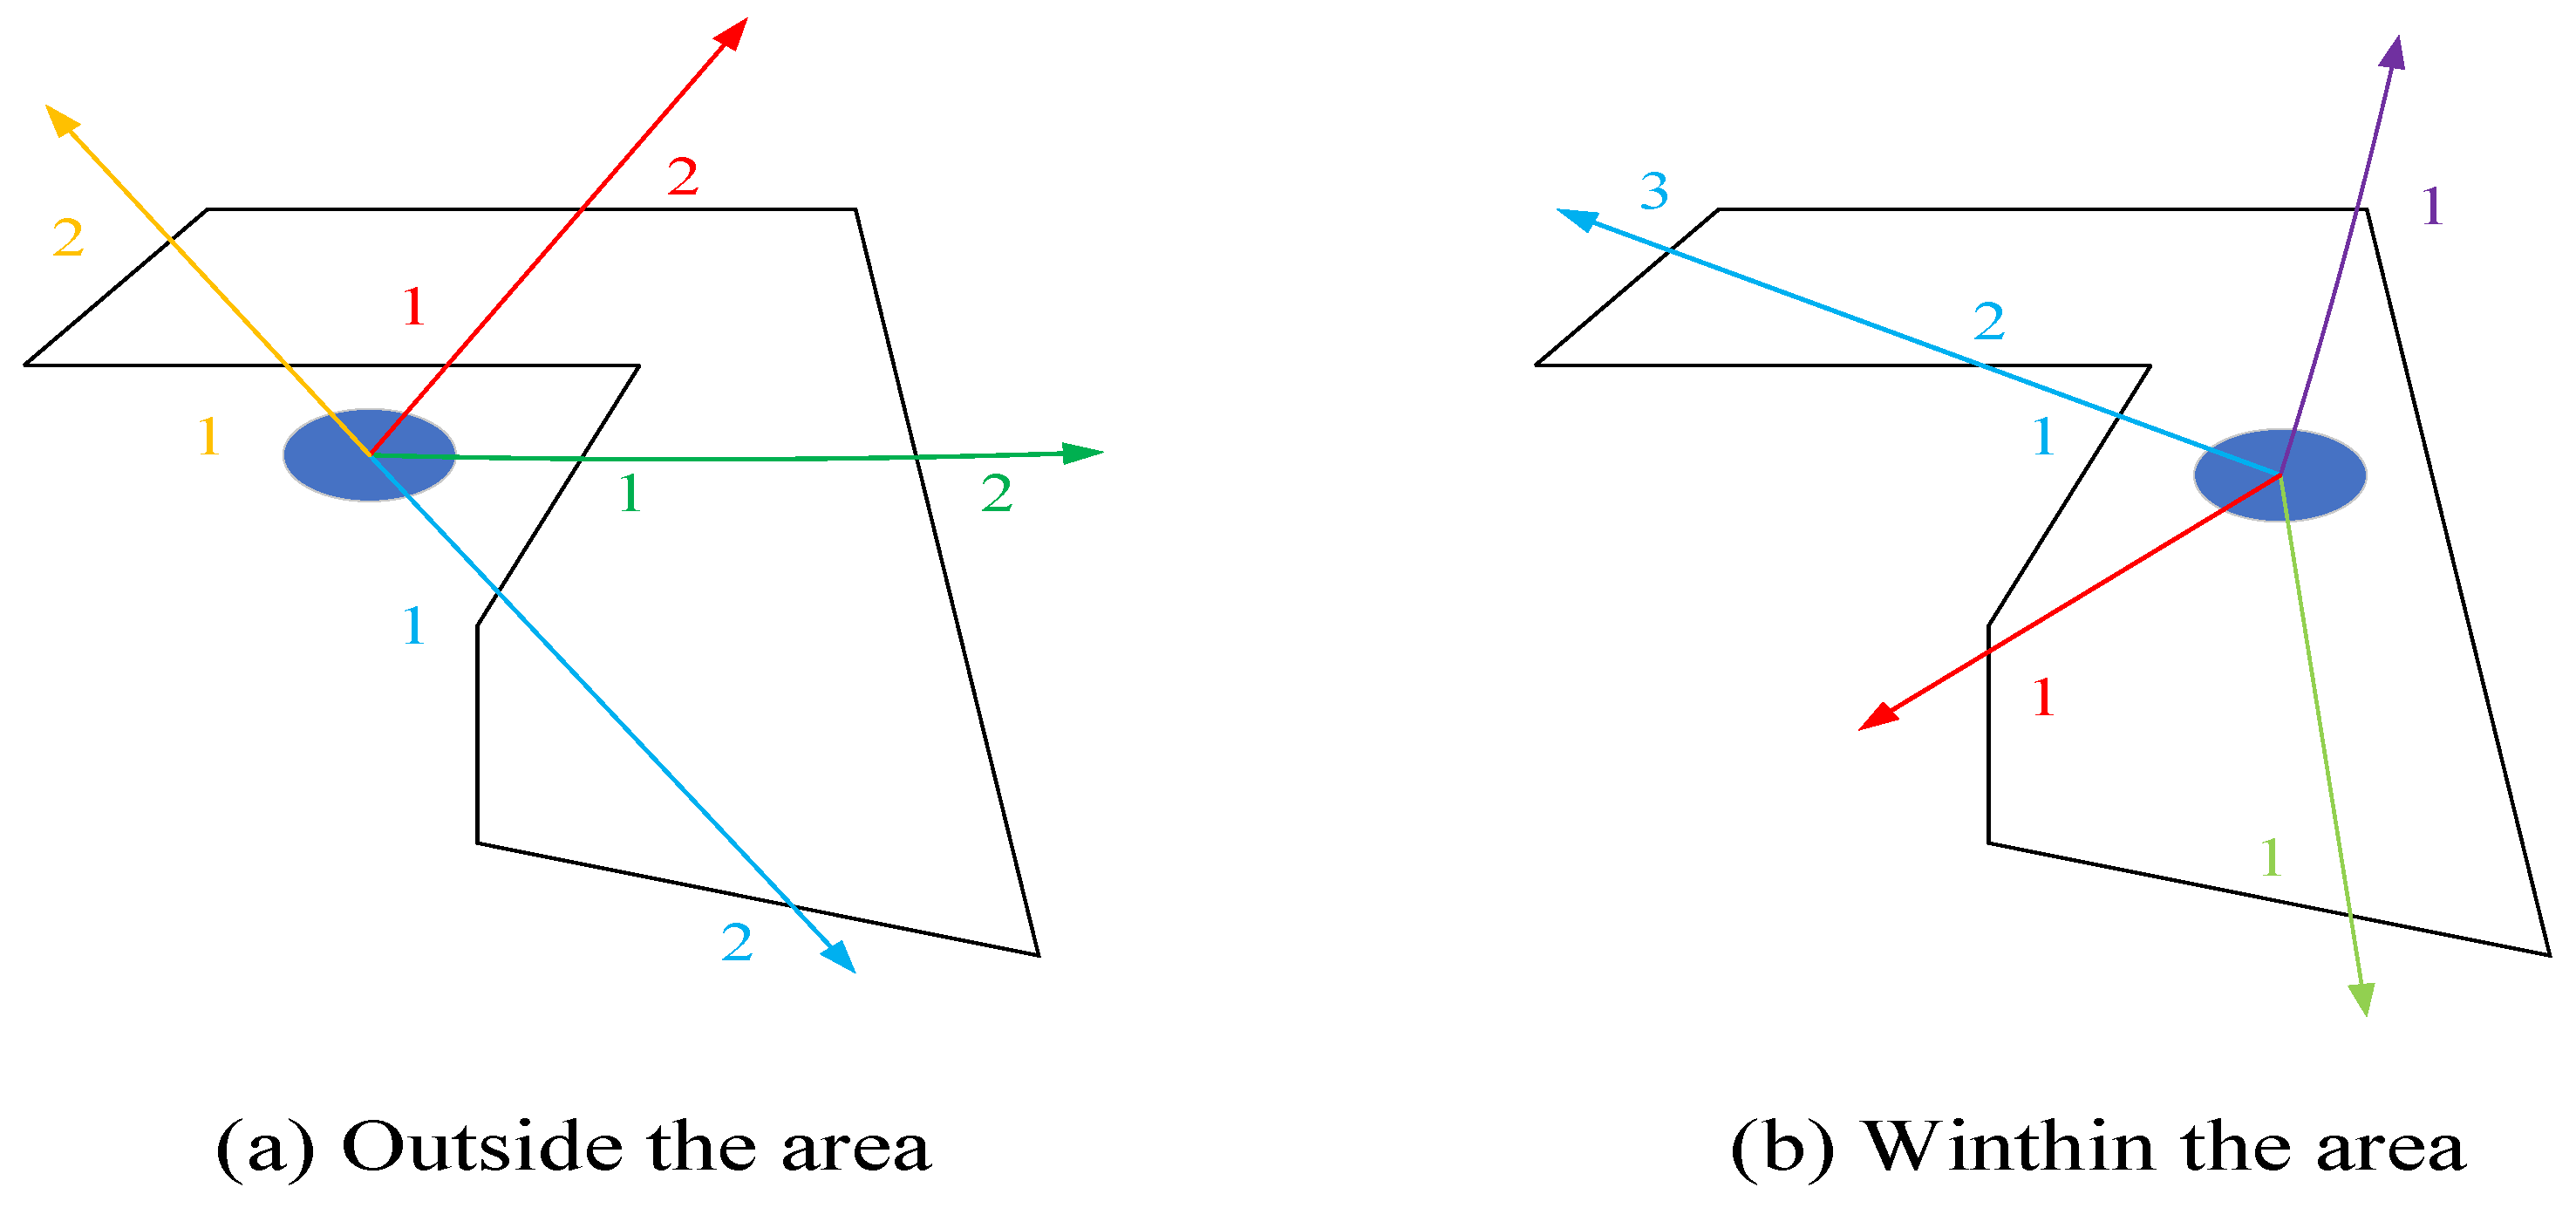
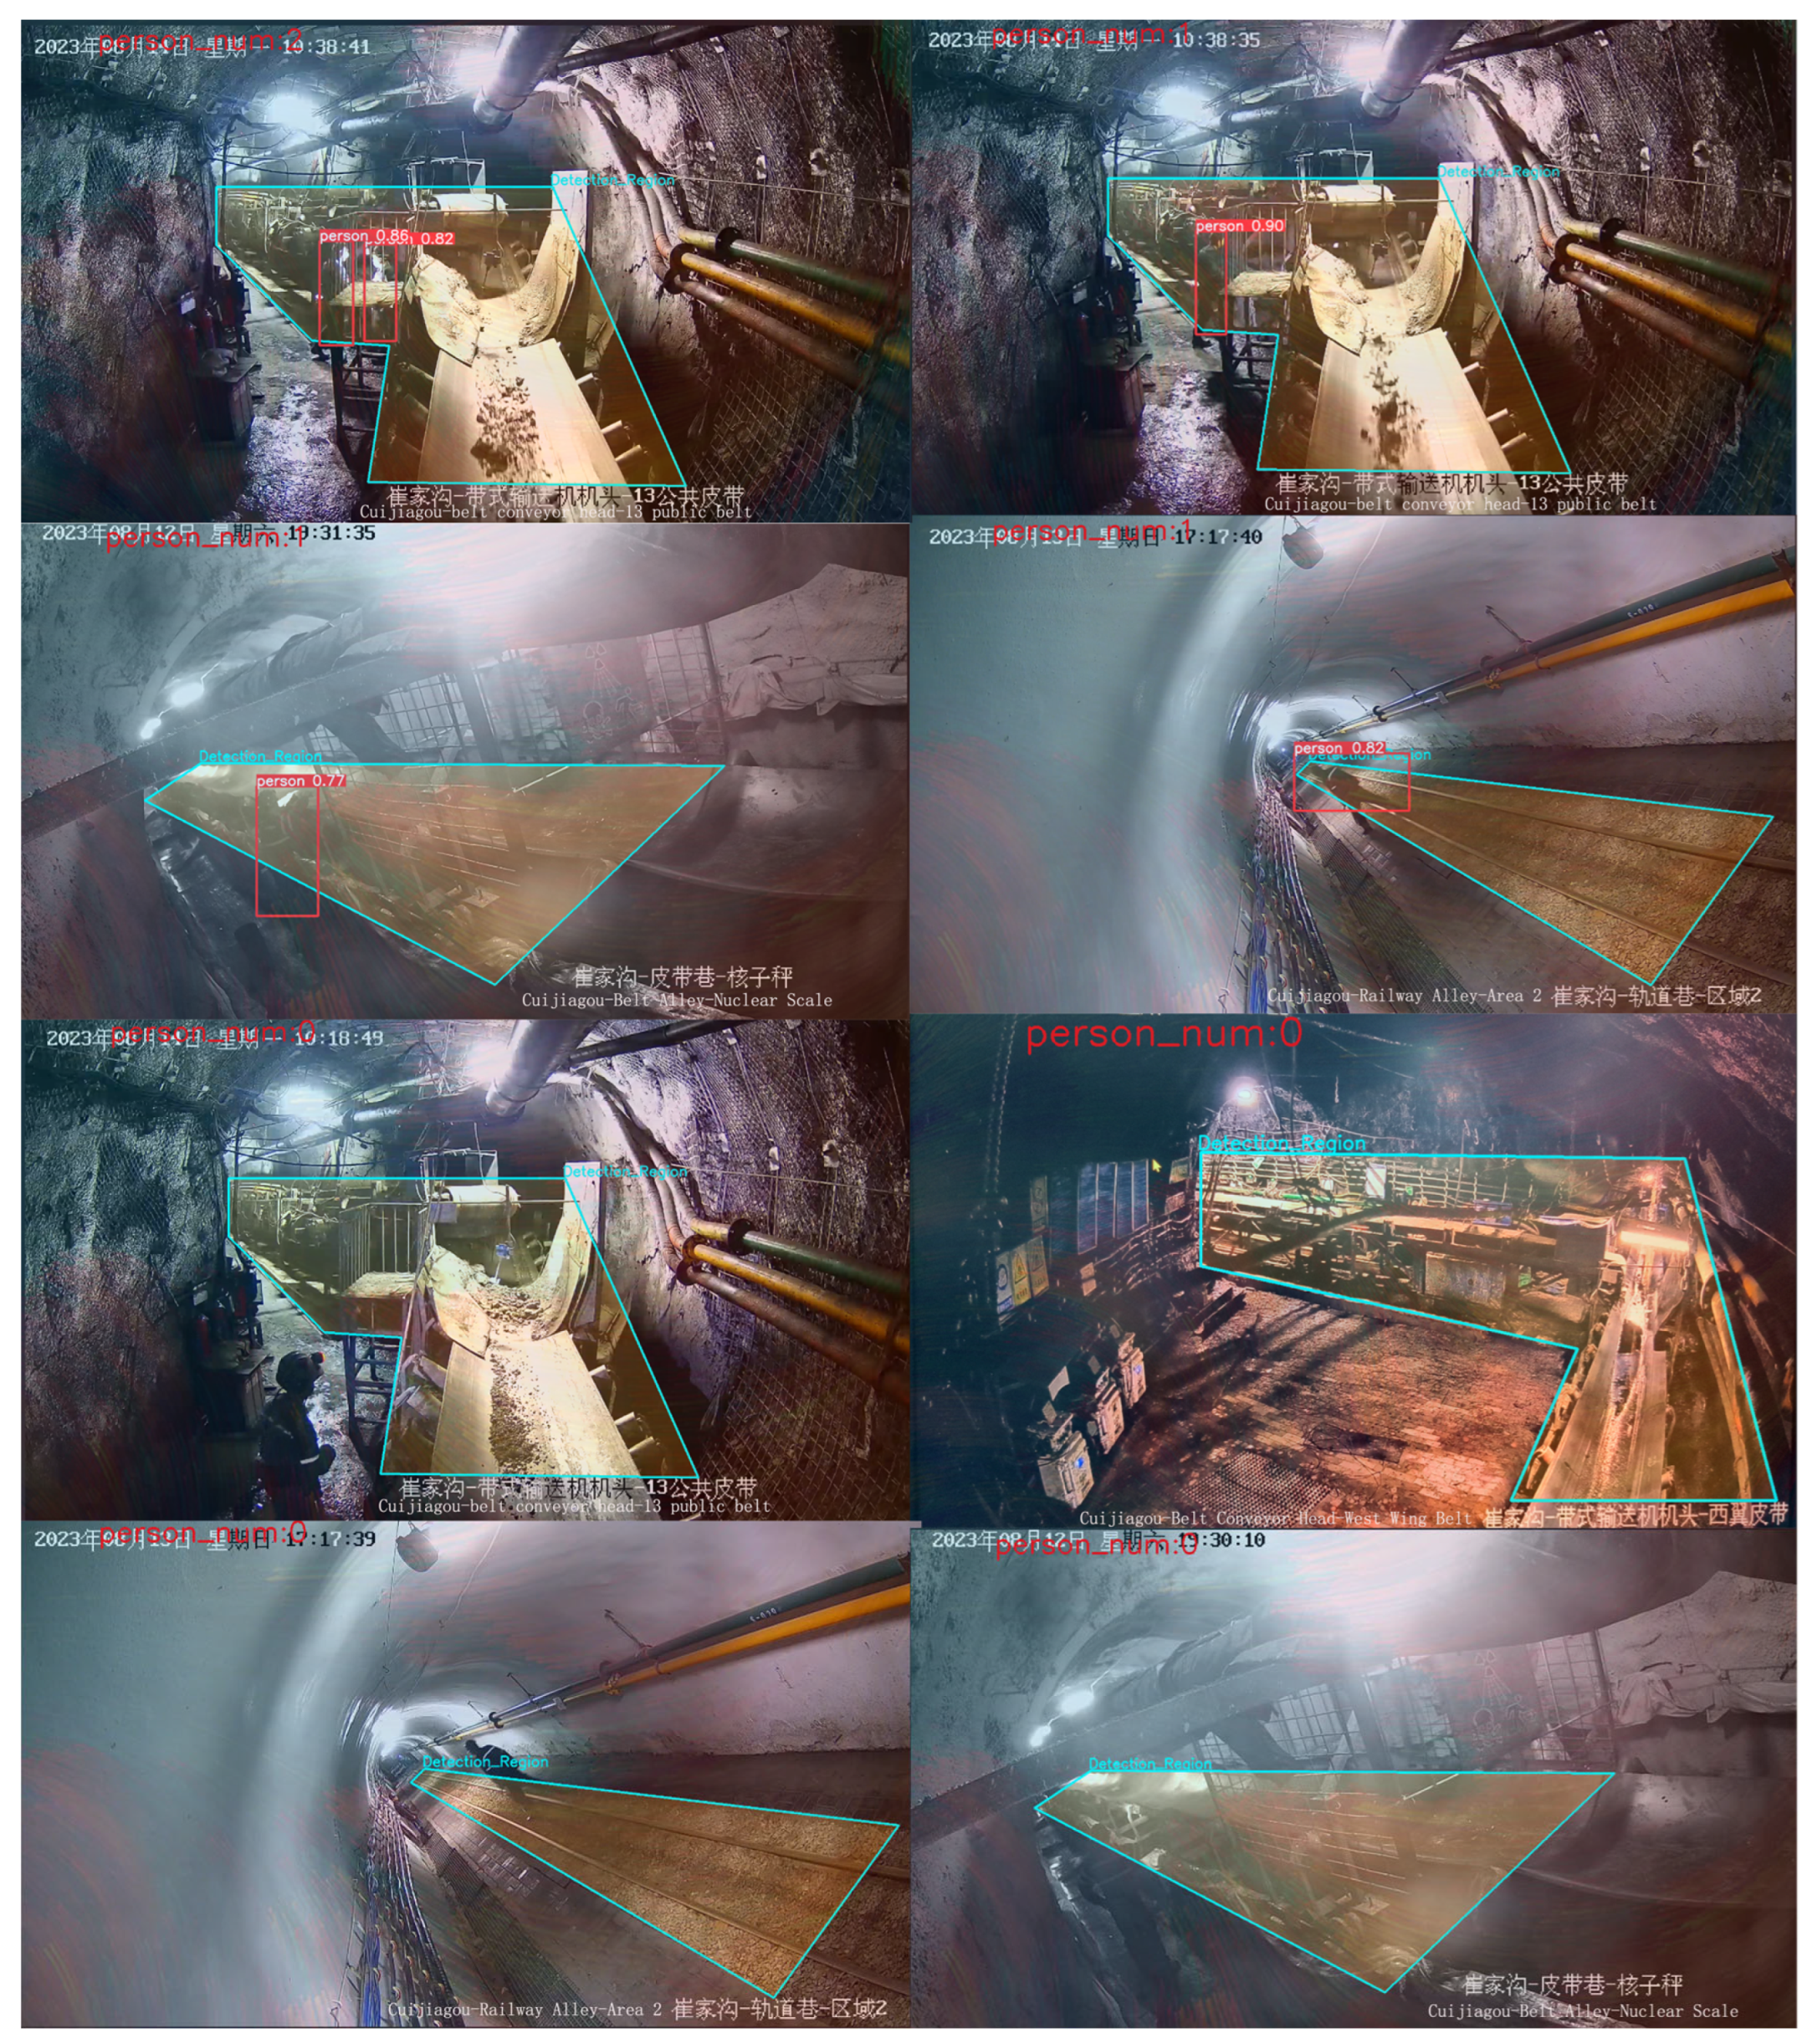
3.3. Invasion in Dangerous Areas

Determining the occurrence of intrusions by underground coal mine workers is a crucial aspect of this study. Considering the dim and complex underground environment, the paper first calculates the relative position between the extracted hazardous perimeter and the detected targets of underground personnel to determine whether they are intruding into hazardous areas. Taking into account the depth information provided by camera positions at different angles, rather than just overhead two-dimensional views, it is essential to accurately determine the occurrence of area intrusions. In cases where the camera position has a small inclination angle or is nearly parallel, determining area intrusions solely based on the overlap between detected targets and the area is not accurate.
The determination of whether individuals enter hazardous areas relies on the position of their footsteps. As depicted in Figure 4, the process involves first obtaining the target’s position through target detection. Subsequently, the issue of area intrusion, where a person steps into a hazardous area, is abstracted as a question of whether the stepping point intersects with the irregular polygon of the hazardous area, in other words, whether the stepping point is inside the irregular polygon.
Calculating the stepping point P x of underground personnel, as illustrated in Equation (5):
P x = b x 1 , h 2 + y 1 .
In the equation: “b” represents the acquired detection box coordinate function, “ x 1 ” and “ y 1 ” are the coordinates of the center point, and “h” signifies the height of the output bounding box.
For any closed curve within a plane, the curve divides the plane into two regions: interior and exterior. For any given straight line within the plane, when it intersects the boundary of a polygon, there are only two possibilities: it either enters or exits the polygon. Therefore, this paper employs the ray-casting method to determine intrusions into hazardous areas. We determine whether polygon area intrusion occurs according to Equation (6):
R = s q P x , x % 2 .
In the equation: “q” is a ray cast in any direction from point P x , “s” represents summation, “x” denotes a custom hazardous area, “R” signifies the occurrence of area intrusion, and “%2” indicates taking the remainder after division by 2. When a target appears in the frame, as shown in Figure 5, rays are cast in any direction from the target’s stepping point. Area intrusion occurs when the number of intersection points of the rays is odd.
This paper addresses the problem of detecting area intrusions by underground coal mine workers, taking into account the practical conditions of hazardous areas at underground work sites. Given the high-risk and irregular nature of these areas, the design is tailored to the underground environment, providing a solution for detecting area intrusions by personnel in underground coal mines.

4. Experiments

4.1. Experiment Environment

The computer operating system used in this experiment is Windows 11 64-bit, with an Intel i7-12700H processor, NVIDIA GeForce RTX 3060 graphics card, and 8 GB of RAM. The programming environment is based on the PyTorch framework and implemented in Python 3.8.

4.2. Datasets and Preprocessing
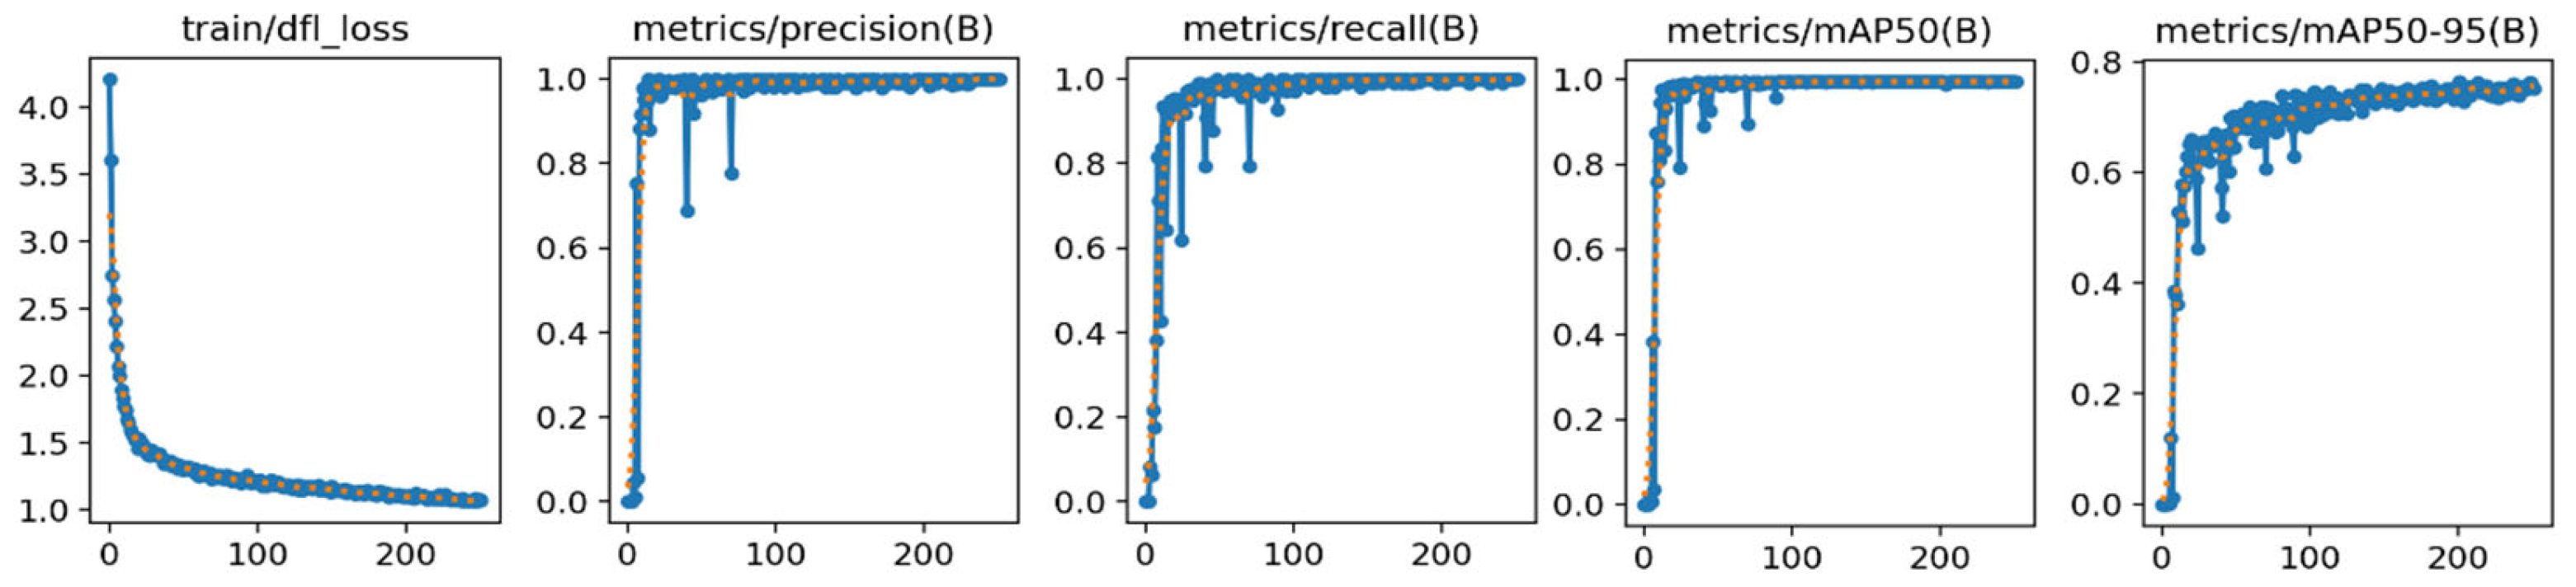
To validate the effectiveness of the intrusion detection method for underground personnel in this article, experiments were conducted on a self-constructed underground dataset. A total of 1830 images were collected, with the label “person” representing intruders and “Detection_Region” indicating the dangerous area. To meet the diversity requirements of the dataset and enhance the model’s robustness, three image processing techniques were employed to expand the dataset’s breadth and depth, thereby improving the model’s flexibility. These techniques include horizontal flipping to introduce orientation invariance, adding random Gaussian noise to enhance robustness against camera distortions, and random brightness adjustments to simulate variations in lighting conditions at the same location.
The augmented dataset consisted of 6584 images, which were split into training, testing, and validation sets in a 7:2:1 ratio.

4.3. Training Model

The dataset used in this paper is derived from a self-constructed underground dataset containing images captured in a specific coal mine, all with a resolution of 1920 × 1080. The dataset comprises nearly 6584 images, with annotations for personnel. The total number of images in the training set is 4600, while the testing set consists of 1300 images. The label “person” represents information related to individuals, and “Detection_Region” denotes the hazardous areas. The PyTorch framework was employed to train and refine the network structure proposed in this paper. During the training process, each batch contained 8 images, and the model was trained for 300 epochs with a learning rate of 0.0001. If the loss did not decrease continuously over 3 consecutive epochs, the learning rate was reduced by a factor of 10. Training would be terminated if the parameters did not decrease over 10 consecutive epochs.
As shown in Figure 6, the training process of the improved model demonstrated changes in accuracy and loss over iterations. As the number of iterations increased, the model continuously updated its weights, resulting in increasing accuracy and decreasing loss. This indicates that within a certain range of iterations, more iterations lead to the model learning more feature information, approaching correct weight updates, and achieving higher accuracy. In the early stages of iteration, the loss decreased rapidly, and accuracy increased quickly. At around 100 iterations, mAP@0.5 stabilized at approximately 0.99, and the loss function also reached a relatively stable state. However, the performance of mAP@0.5:0.95 was poorer due to the high IoU threshold, which imposed stringent requirements on the detection box positions.

5. Results and Analysis

5.1. Evaluation Index

In order to assess the model’s effectiveness and detection performance, precision (P), mean average precision (mAP), and F1 score have been chosen as evaluation metrics.
(1) Precision: Precision indicates the proportion of true positive samples among all samples classified as positives. Precision can measure the accuracy of the algorithm, specifically the classifier’s ability to correctly identify positive instances.
The calculation of precision is represented by Equation (7):
P = T P T P + F P .
(2) Mean Average Precision (mAP): mAP is one of the key performance metrics for evaluating object detection algorithms. It combines precision and recall for different classes and calculates their average. A higher mAP value indicates better algorithm performance in detecting objects across various categories.
The calculation of mAP is represented by Equation (8):
m A P = i = 1 C A P i C m ,
where C represents the total number of classes, and AP represents the AP value for the ith class. In this study, single-object detection for underground personnel is conducted; hence, C is equal to one, resulting in the calculation of the mean average precision (AP).
(3) F1 score: This is an evaluation metric that comprehensively considers both precision and recall and is commonly used to assess the performance of classification models. It is the harmonic mean of precision and recall, designed to provide a balanced measurement of a model’s accuracy and recall capability.
The calculation of the F1 score is represented by Equation (9):
F 1 = 2 × P × R P + R
The F1 score ranges from 0 to 1, with higher values indicating better model performance. When both precision and recall are high, the F1 score will also be correspondingly high, and vice versa. Therefore, it can assist in evaluating the model’s performance in balancing accuracy and recall.
The experimental results analysis section of this paper will comprehensively consider the above metrics to evaluate the prediction outcomes.

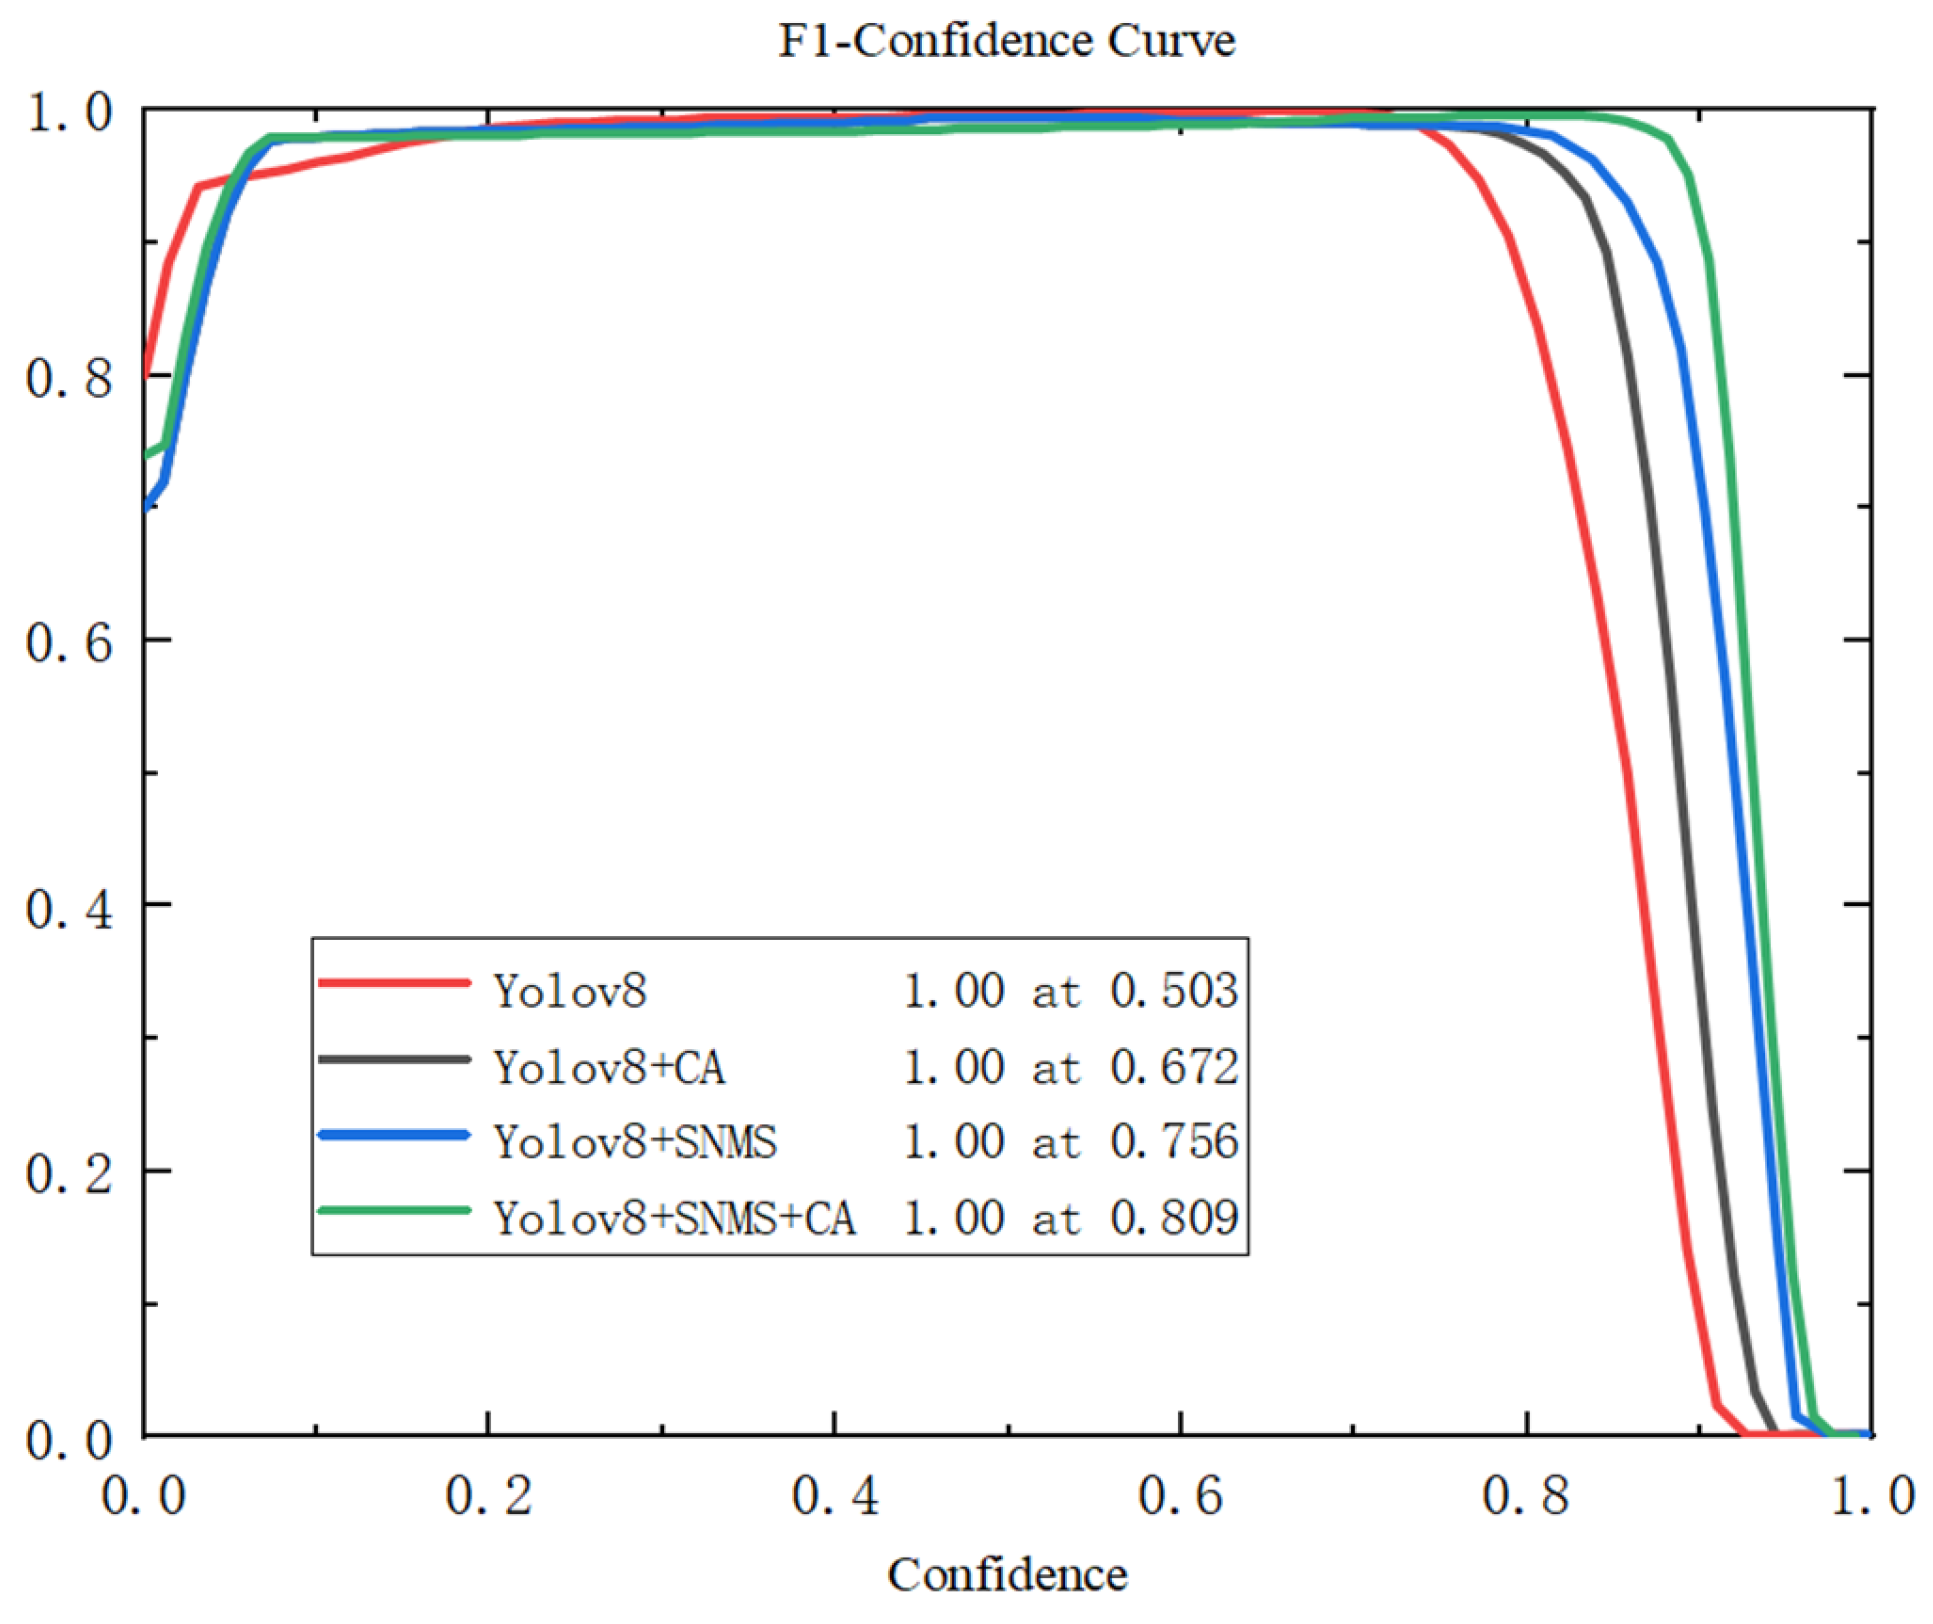
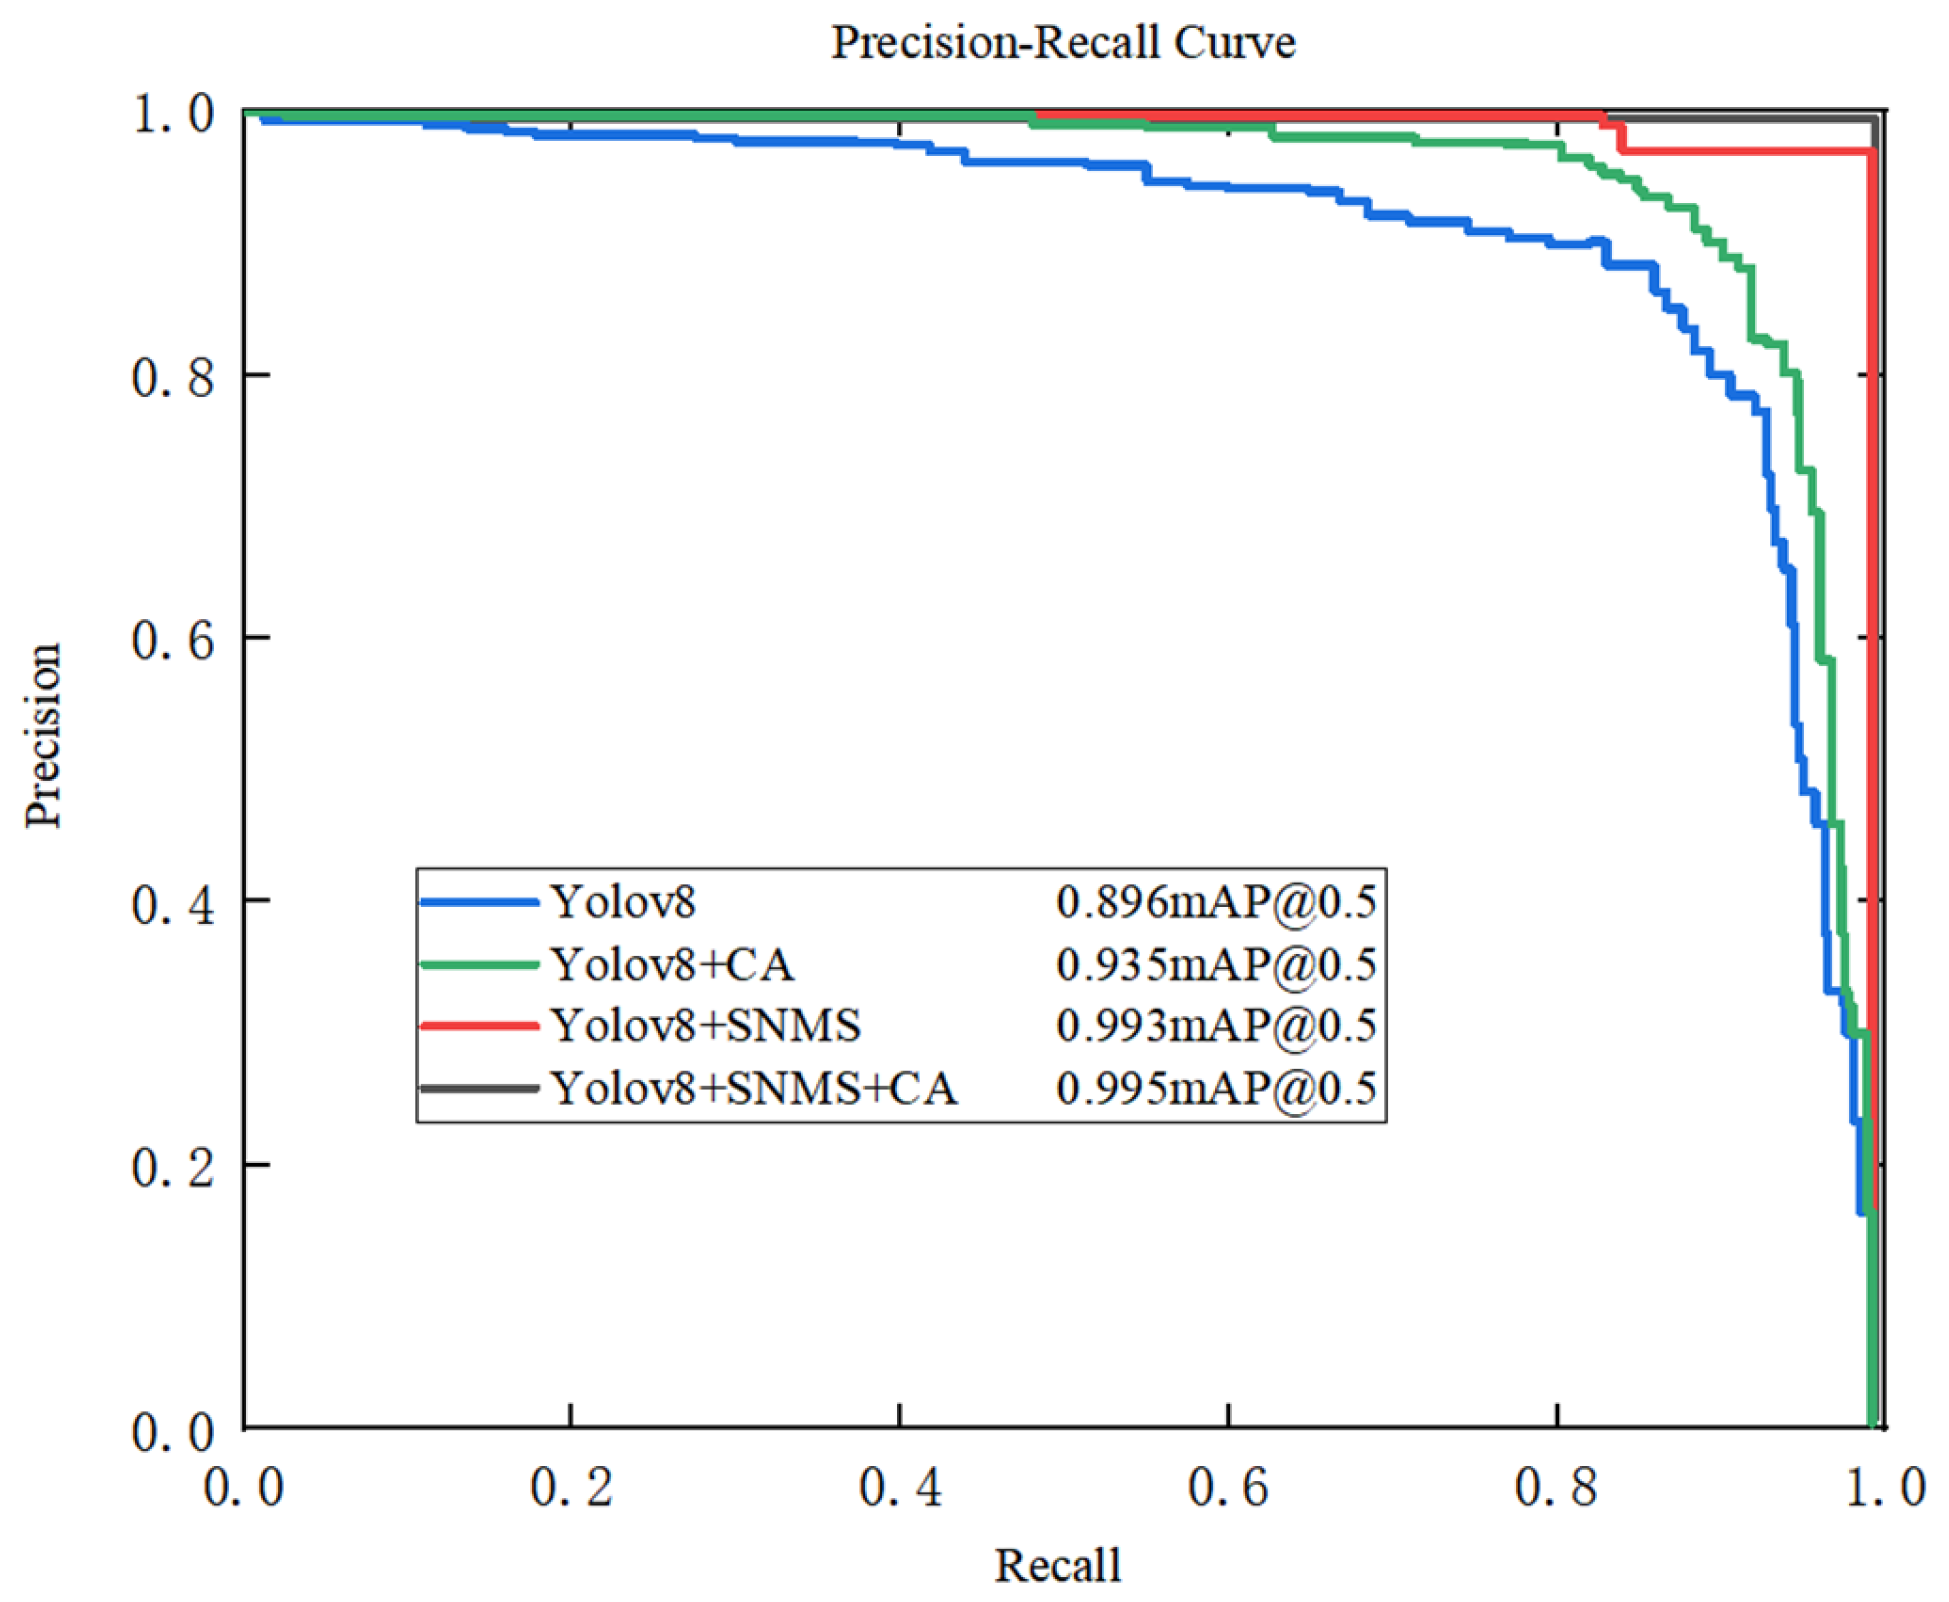
5.2. Ablation Experiment

To further confirm the effectiveness of the aforementioned improvements, this paper conducted ablation experiments, with the results presented in Table 1. Since this paper primarily focuses on improving the YOLOv8 network, the YOLOv8 network was chosen as the baseline for comparison.
During the training process on the training set, F1 score and PR curves were plotted based on the performance results, as shown in Figure 7 and Figure 8. It can be observed that, to enhance the accuracy of the YOLOv8 network, the introduction of the CA attention mechanism module resulted in an increase in model accuracy from 81.2% to 87.4%, marking a 6-percentage-point improvement, with a 17-percentage-point increase in the F1 score. The incorporation of the SNMS module reduced the likelihood of errors in adjacent detections, thereby improving network performance. Accuracy increased from 81.2% to 89.3%, leading to more-accurate final detection results.
Compared to the original YOLOv8 network, the YOLOv8+CA+SNMS model’s accuracy improved from 81.2% to 88%, the F1 score increased from 50.3% to 80.9%, and the mean average precision improved by 9.9%. These results further enhance the model’s accuracy and demonstrate its effectiveness.
The improved model demonstrates notably high F1 score and PR curve coverage, indicating a high level of accuracy in the operational results.

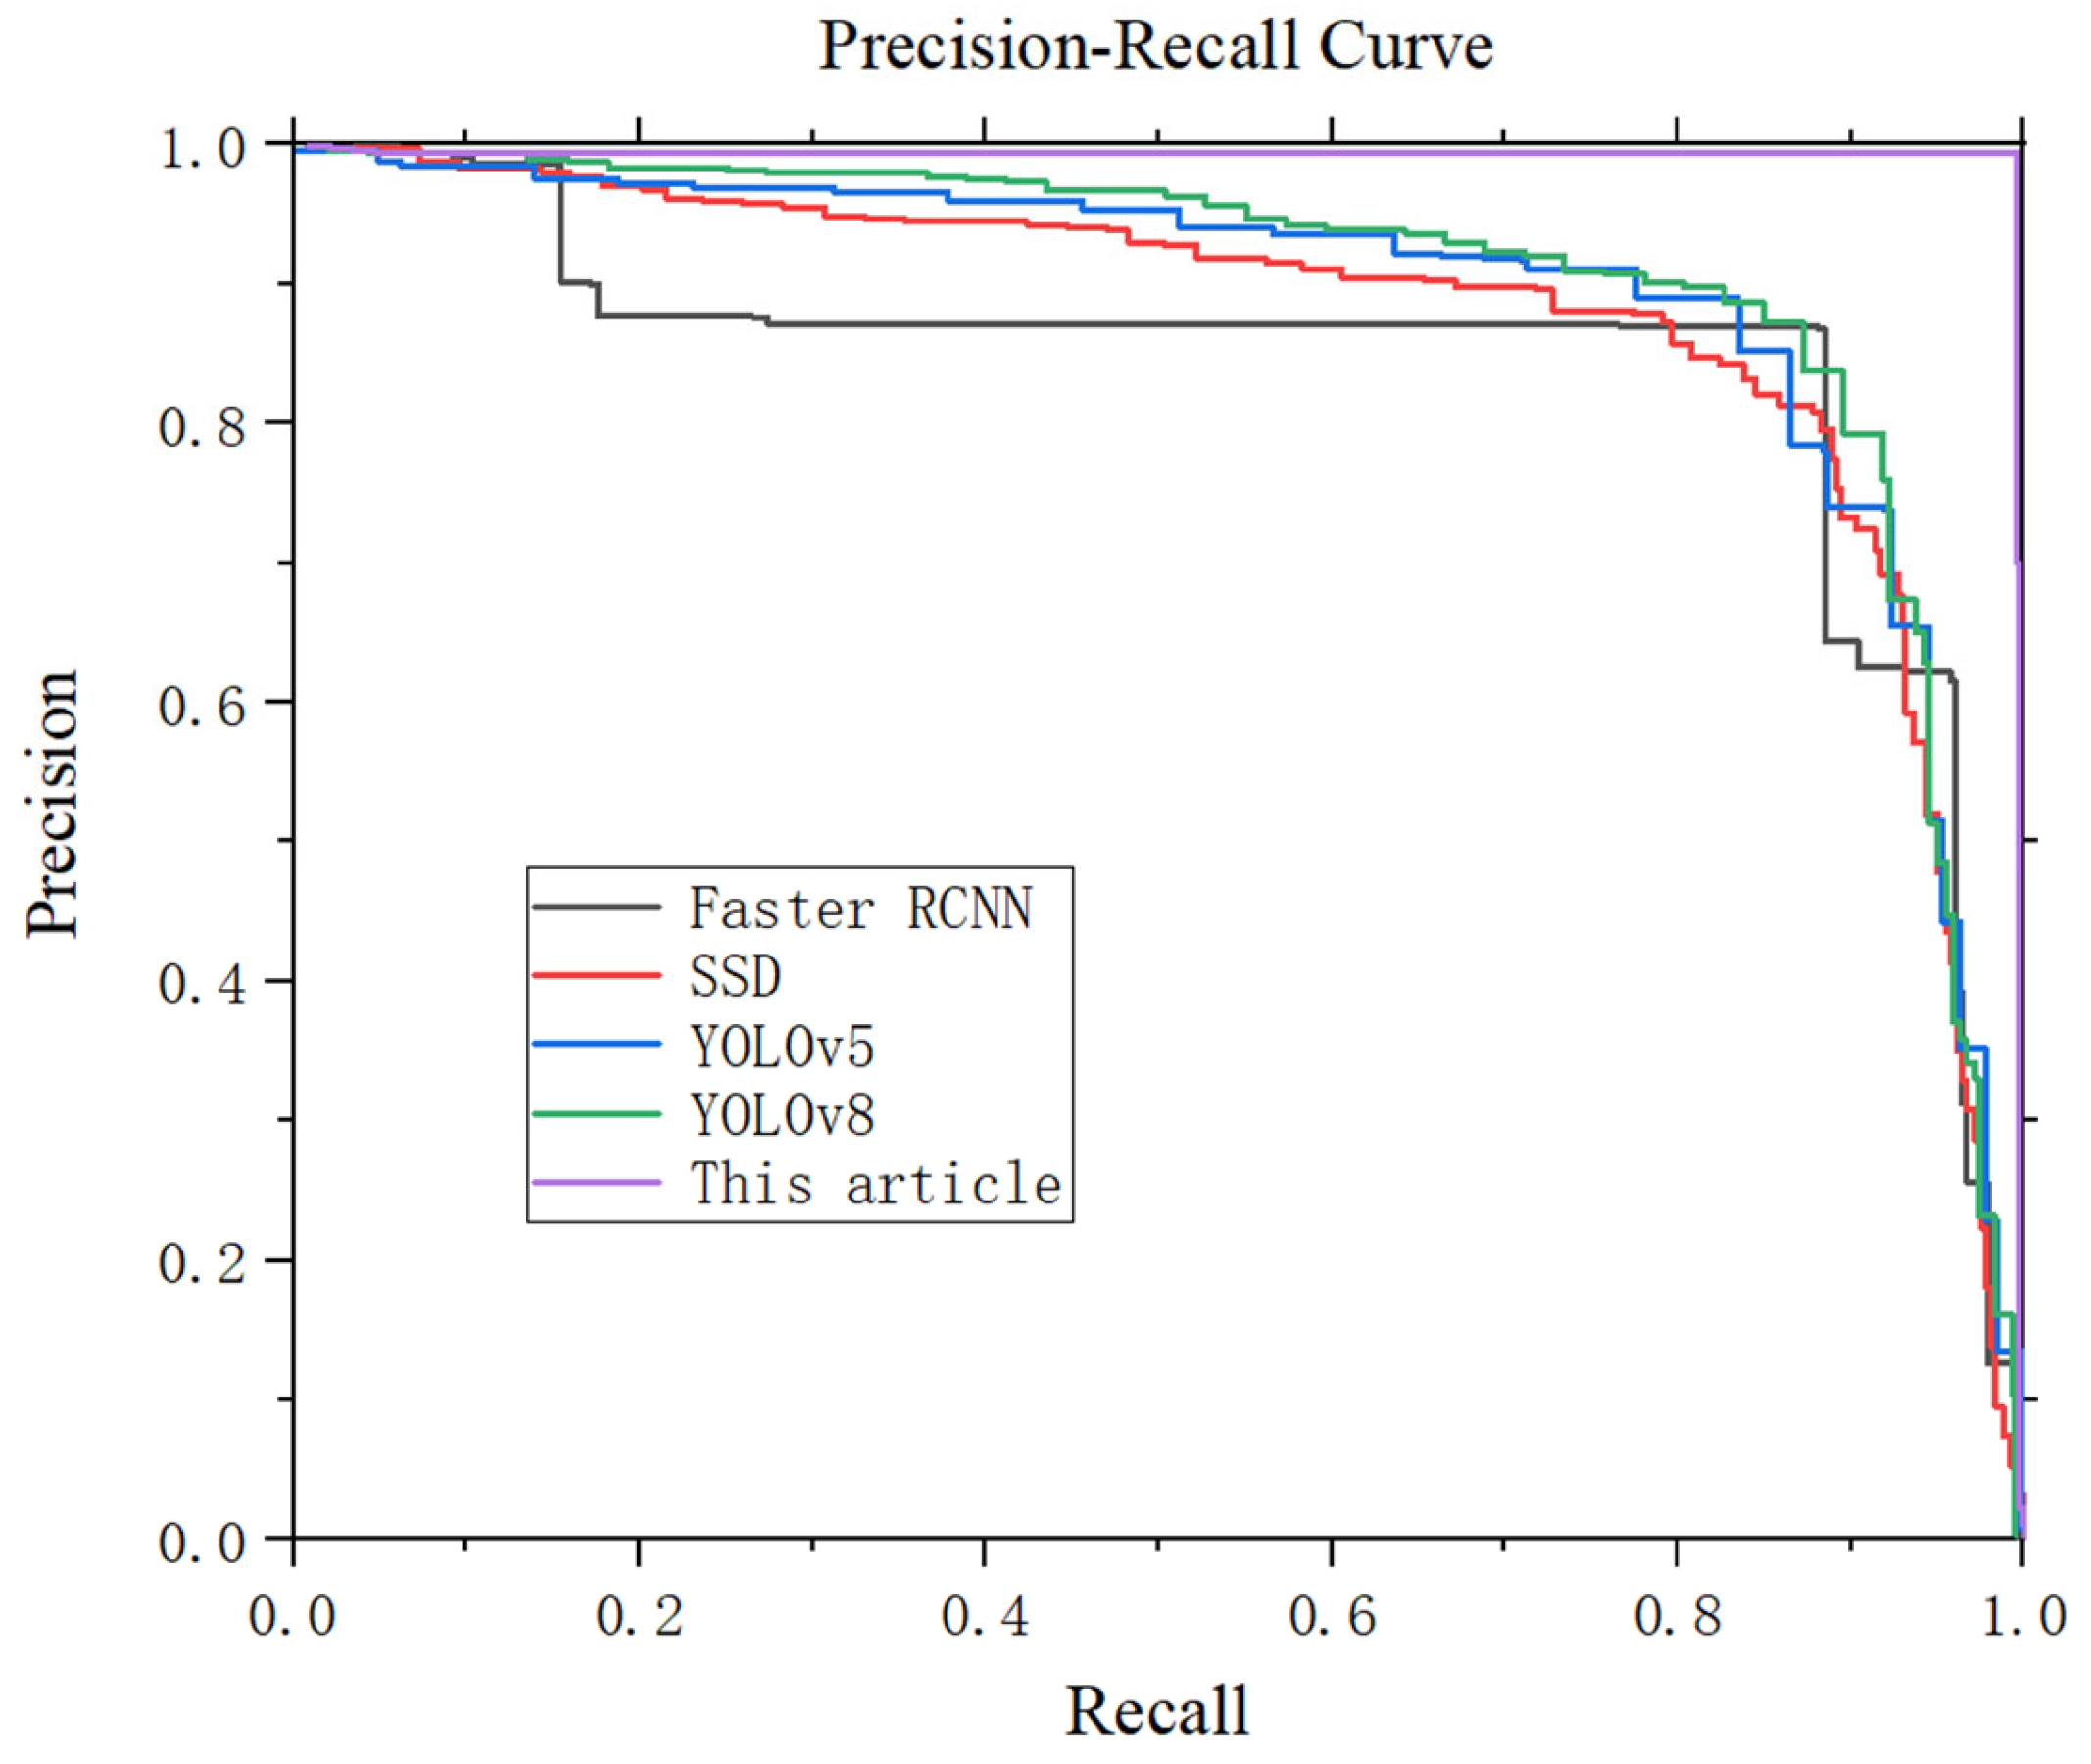
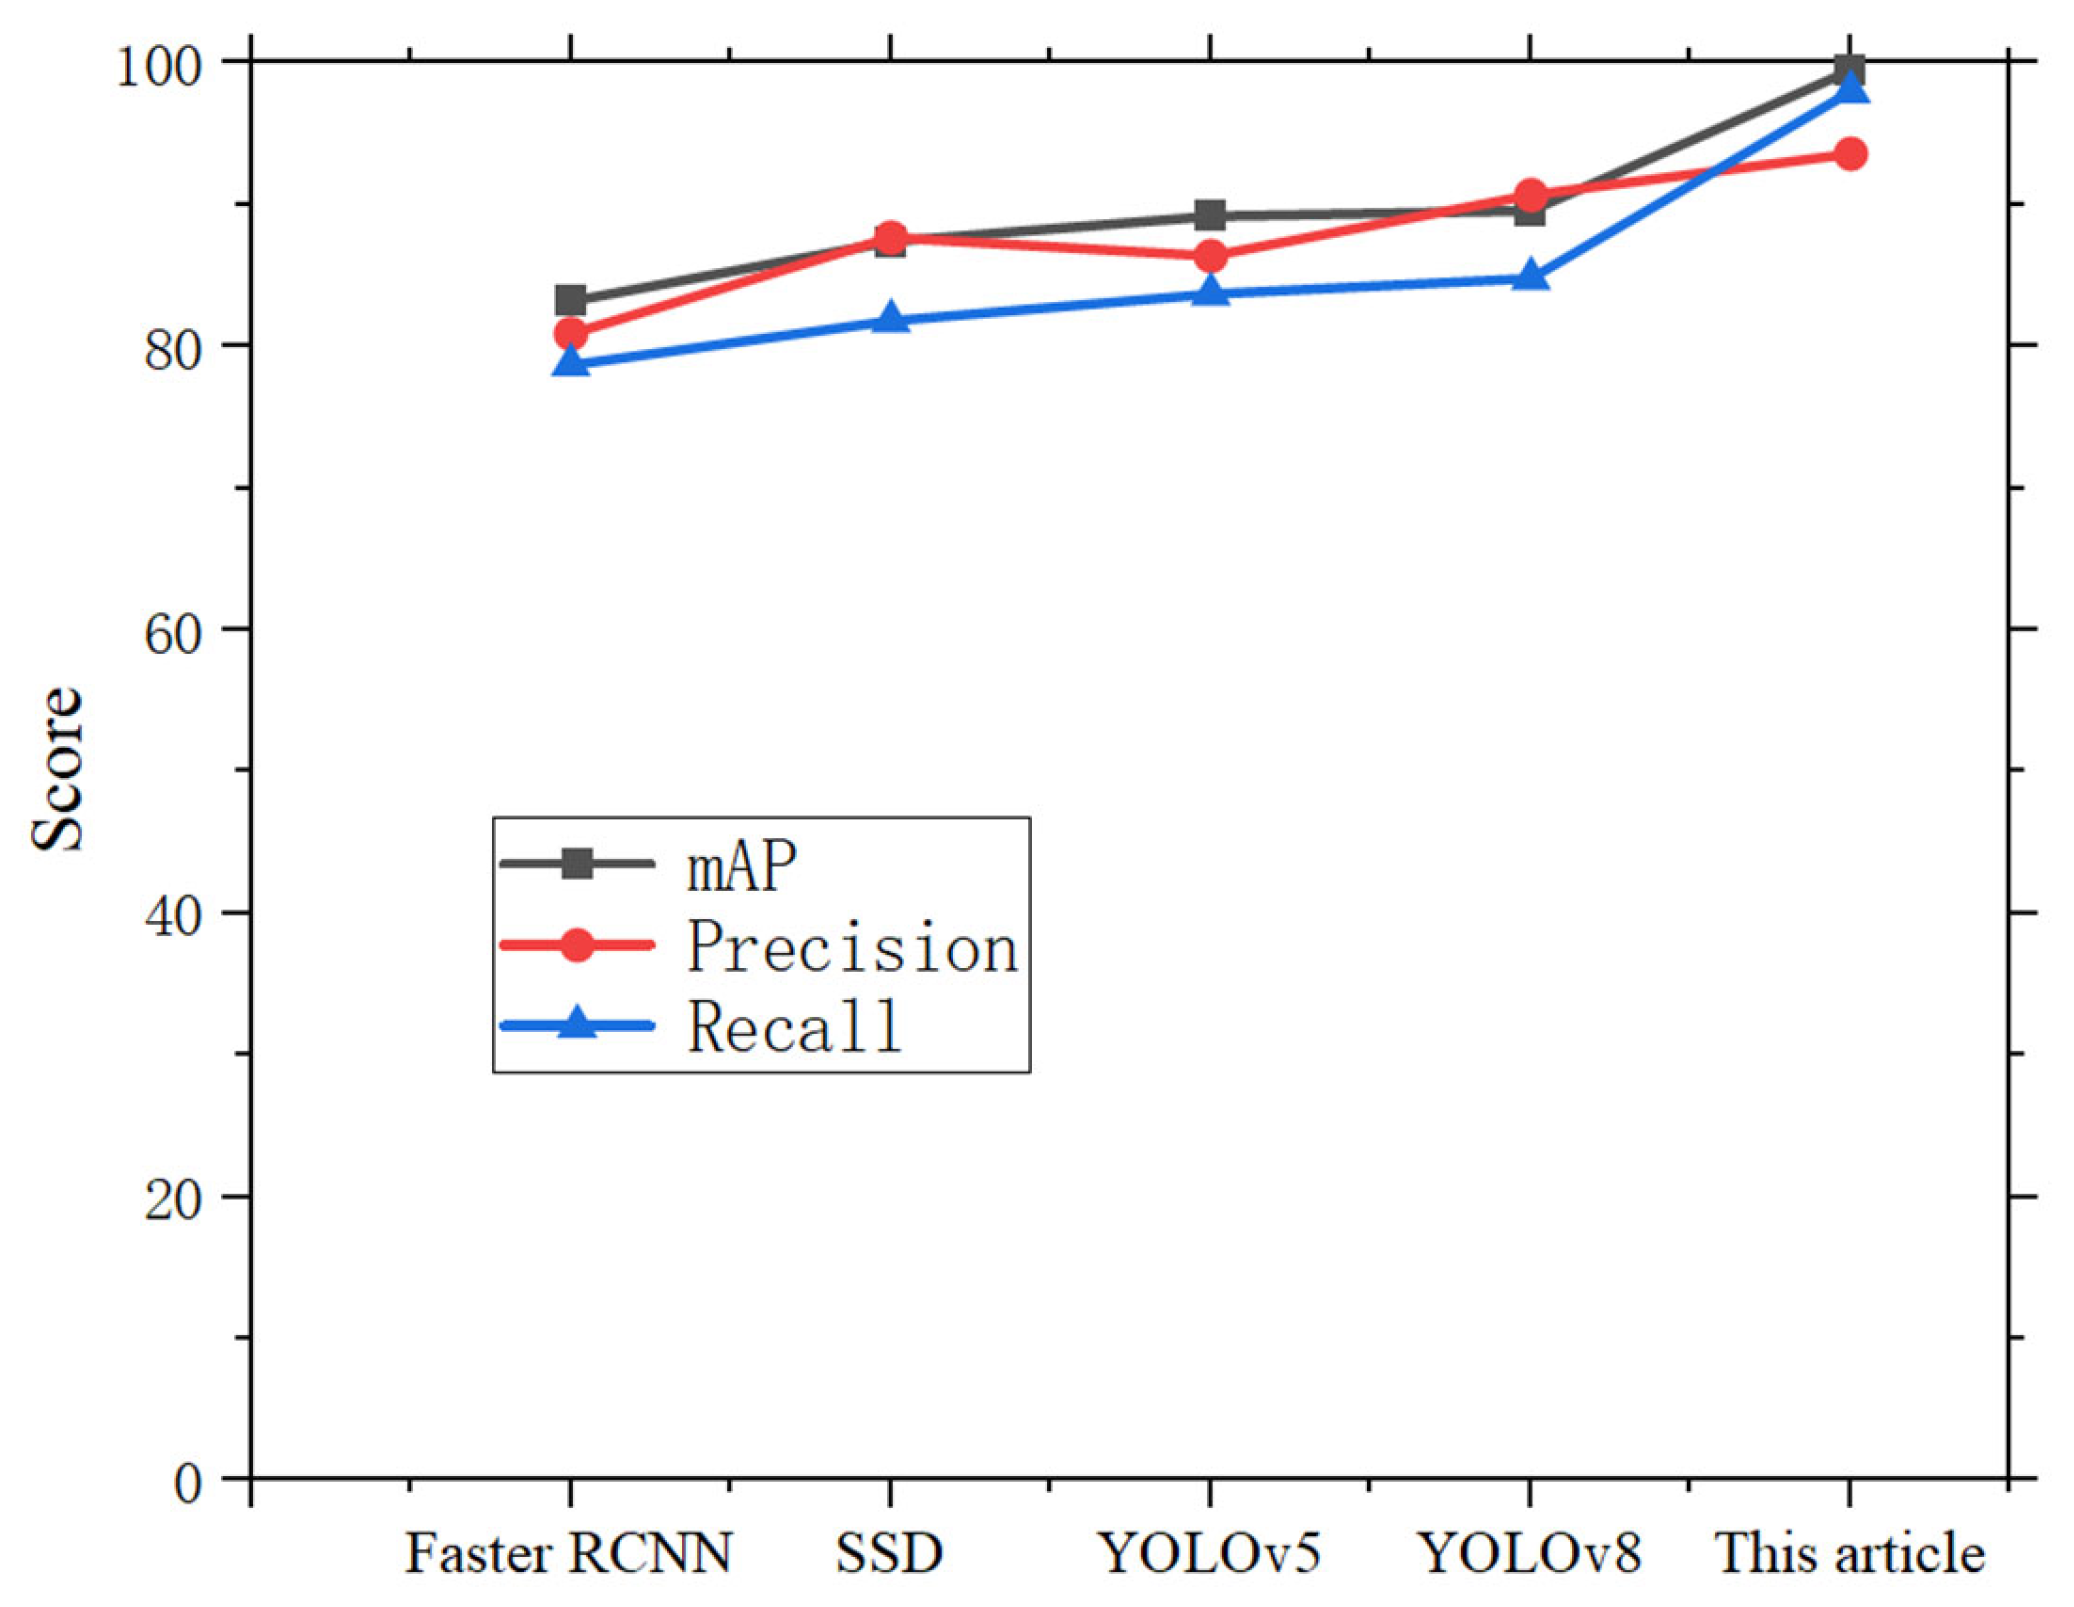
5.3. Comparison of Experimental Results

The experimental results, as shown in Table 2 and Figure 9, indicate that the algorithm proposed in this paper, in comparison to other models, maintains a comparable detection accuracy while ensuring a similar running speed. This demonstrates its effectiveness in underground scenarios. To comprehensively assess the detection capabilities of our algorithm, in this section, we conducted a thorough performance test on the model. Four popular object detection models, namely, Faster R-CNN, SSD, YOLOv5, and YOLOv8, were employed for comparison with the proposed YOLOv8+CA+SNMS model on a self-constructed dataset. This ensured consistency in dataset partitioning and experimental conditions for a fair evaluation of each model’s performance.
The experimental results, as illustrated in Figure 10, reveal performance improvements for various detection algorithms on our self-constructed underground worker dataset. This dataset encompasses diverse scenarios, worker poses, and targets at different angles and scales. The enhanced detection results across these algorithms affirm their effectiveness in underground personnel detection. Our proposed detection algorithm achieves a mean average precision (mAP) of 99.5%, with a model size of 86 MB and a processing speed of 45 frames per second. In comparison with other models, our algorithm demonstrates optimal detection accuracy while maintaining speed and model parameter efficiency.
The improved model, in conjunction with the ray method, is used to jointly assess intrusions into underground hazardous areas and count the number of intruders within these regions. The results of intrusions in different scenarios are depicted in Figure 11. In this figure, the detection of hazardous areas is represented by blue polygonal frames, the upper-left corner displays the number of intruders in the hazardous area, and the detection results are represented by red rectangular frames, with labels for recognized categories and their respective probabilities. The top two rows of detection images in Figure 11 sequentially show the following scenarios: two individuals invading the head area of a conveyor belt, one individual invading the head area of a conveyor belt, one individual invading the belt corridor area, and one individual invading the track corridor area. In these cases, when the underground personnel’s point of entry enters a hazardous area, it is considered an intrusion and counted. The bottom two rows of detection images in Figure 11 show scenarios in which no individuals intruded into the four different hazardous areas: head area of a conveyor belt, head area to the west wing of the conveyor belt, track corridor, and belt corridor. It is evident that when the entry point of underground personnel does not enter a hazardous area, it is considered as no intrusion into the hazardous area.

6. Conclusions

We propose a comprehensive video-based all-day detection method that enhances the YOLOv8 model. In the feature extraction network, we introduce the CA convolutional attention module to improve the model’s feature extraction capabilities. In the feature inference phase, we incorporate the SNMS module to make the model more robust in extracting personnel location information, reducing false alarms. Simultaneously, we create an underground worksite dataset to enhance the model’s generalization. This model is combined with the ray method and deployed for use with cameras capturing information from various angles and depths. Deployment results demonstrate that the improved method enhances the accuracy of detecting intrusions by personnel into underground hazardous areas, meeting real-time safety requirements for underground workers and effectively preventing accidents in these areas.
In future research, we will focus on addressing the lack of a large numbers of training samples in the dataset. We intend to collect images of different underground operations from multiple coal mines. Our work involves a wide range of complex conditions (such as large amounts of dust, high noise, and vibration) and studies the performance of the network in different underground environments, which will help improve the generalization and stability of the model. As for the underground camera settings, we plan to study the camera positions under different viewing angles to further verify its applicability in practical applications.

Author Contributions

Conceptualization, Y.N. and J.H.; methodology, Y.H. and J.H.; software, J.H.; validation, J.H.; formal analysis, J.H.; investigation, J.H.; resources, J.H.; writing—original draft preparation, J.H.; writing—review and editing, J.H.; visualization, J.H.; supervision, Y.N.; project administration, J.W. and P.G.; funding acquisition, Y.N. and J.H. All authors have read and agreed to the published version of the manuscript.

Funding

This work was supported in part by the National Natural Science Foundation of China under Grant 61701393 and the Scientific Research Program of Shaanxi Provincial Department of Education under Grant 19JK0528, 19JK0531.

Institutional Review Board Statement

Not applicable.

Informed Consent Statement

Not applicable.

Data Availability Statement

Derived data supporting the findings of this study are available from the corresponding author on request.

Acknowledgments

The authors would like to thank the funding and the support of the reviewers as well as the editors for their insightful comments.

Conflicts of Interest

The authors declare no conflicts of interest.

References

  1. Zou, C.; Wu, S.; Yang, Z.; Pan, S.; Wang, G.; Jiang, X.; Guan, M.; Yu, C.; Yu, Z.; Shen, Y. Progress, challenge and significance of building a carbon industry system in the context of carbon neutrality strategy. Pet. Explor. Dev. 2023, 50, 210–228. [Google Scholar] [CrossRef]
  2. Zeeshan, M.; Chavda, M.; Ehshan, K.M.; Nayek, R.; Malik, S. A Review on Non-RF Underground Positioning Techniques for Mining Applications. IEEE Trans. Instrum. Meas. 2023, 72, 9510217. [Google Scholar] [CrossRef]
  3. Imam, M.; Baïna, K.; Tabii, Y.; Ressami, E.M.; Adlaoui, Y.; Benzakour, I.; Abdelwahed, E.H. The Future of Mine Safety: A Comprehensive Review of Anti-Collision Systems Based on Computer Vision in Underground Mines. Sensors 2023, 23, 4294. [Google Scholar] [CrossRef]
  4. El-gayar, M.M.; Soliman, H.; Meky, N. A comparative study of image low level feature extraction algorithms. Egypt. Inform. J. 2013, 14, 175–181. [Google Scholar] [CrossRef]
  5. Huang, S.Y.; An, W.J.; Zhang, D.S.; Zhou, N.R. Image classification and adversarial robustness analysis based on hybrid quantum–classical convolutional neural network. Opt. Commun. 2023, 533, 129287. [Google Scholar] [CrossRef]
  6. Tian, Y. Artificial intelligence image recognition method based on convolutional neural network algorithm. IEEE Access 2020, 8, 125731–125744. [Google Scholar] [CrossRef]
  7. Zhou, D.X. Deep distributed convolutional neural networks: Universality. Anal. Appl. 2018, 16, 895–919. [Google Scholar] [CrossRef]
  8. Gaba, S.; Budhiraja, I.; Kumar, V.; Garg, S.; Kaddoum, G.; Hassan, M.M. A federated calibration scheme for convolutional neural networks: Models, applications and challenges. Comput. Commun. 2022, 192, 144–162. [Google Scholar] [CrossRef]
  9. Wang, J.; Zeng, X.; Duan, S.; Zhou, Q.; Peng, H. Image Target Recognition Based on Improved Convolutional Neural Network. Math. Probl. Eng. 2022, 2022, 2213295. [Google Scholar] [CrossRef]
  10. Zhang, J.; Meng, Y.; Chen, Z. A small target detection method based on deep learning with considerate feature and effectively expanded sample size. IEEE Access 2021, 9, 96559–96572. [Google Scholar] [CrossRef]
  11. Cao, W. A wheat spike detection method in UAV images based on improved YOLOv5. Remote Sens. 2021, 13, 3095. [Google Scholar]
  12. Wang, C.Y.; Bochkovskiy, A.; Liao, H.Y.M. YOLOv7: Trainable bag-of-freebies sets new state-of-the-art for real-time object detectors. In Proceedings of the IEEE/CVF Conference on Computer Vision and Pattern Recognition, Vancouver, BC, Canada, 17–24 June 2023; pp. 7464–7475. [Google Scholar]
  13. Zhuo, S.; Zhang, X.; Chen, Z.; Wei, W.; Wang, F.; Li, Q.; Guan, Y. DAMP-YOLO: A Lightweight Network Based on Deformable Features and Aggregation for Meter Reading Recognition. Appl. Sci. 2023, 13, 11493. [Google Scholar] [CrossRef]
  14. Wang, X.; Gao, H.; Jia, Z.; Li, Z. BL-YOLOv8: An Improved Road Defect Detection Model Based on YOLOv8. Sensors 2023, 23, 8361. [Google Scholar] [CrossRef] [PubMed]
  15. Kumar, D.; Muhammad, N. Object Detection in Adverse Weather for Autonomous Driving through Data Merging and YOLOv8. Sensors 2023, 23, 8471. [Google Scholar] [CrossRef] [PubMed]
  16. Szrek, J.; Zimroz, R.; Wodecki, J.; Michalak, A.; Góralczyk, M.; Worsa-Kozak, M. Application of the Infrared Thermography and Unmanned Ground Vehicle for Rescue Action Support in Underground Mine—The AMICOS Project. Remote Sens. 2021, 13, 69. [Google Scholar] [CrossRef]
  17. Li, X.; Wang, S.; Liu, B.; Chen, W.; Fan, W.; Tian, Z. Improved YOLOv4 network using infrared images for personnel detection in coal mines. J. Electron. Imaging 2022, 31, 013017. [Google Scholar] [CrossRef]
  18. Wang, W.; Wang, S.; Guo, Y.; Zhao, Y. Obstacle detection method of unmanned electric locomotive in coal mine based on YOLOv3-4L. J. Electron. Imaging 2022, 31, 023032. [Google Scholar]
  19. Biao, L.; Tian, B.; Qiao, J. Mine Track Obstacle Detection Method Based on Information Fusion. J. Phys. Conf. Ser. 2022, 2229, 012023. [Google Scholar]
  20. Imam, M.; Baïna, K.; Tabii, Y.; Benzakour, I.; Adlaoui, Y.; Ressami, E.M.; Abdelwahed, E.H. Anti-Collision System for Accident Prevention in Underground Mines using Computer Vision. In Proceedings of the 6th International Conference on Advances in Artificial Intelligence (ICAAI’22), Brimingham, UK, 21–23 October 2023; Association for Computing Machinery: New York, NY, USA, 2023; pp. 94–101. [Google Scholar]
  21. Wang, L.; Li, W.; Zhang, Y.; Wei, C. Pedestrian Detection Based on YOLOv2 with Skip Structure in Underground Coal Mine. In Proceedings of the 2017 IEEE 3rd Information Technology and Mechatronics Engineering Conference (ITOEC), Chongqing, China, 3–5 October 2017. [Google Scholar]
  22. Fengbo, W.; Liu, W.; Wang, S.; Zhang, G. Improved Mine Pedestrian Detection Algorithm Based on YOLOv4-Tiny. In Proceedings of the Third International Symposium on Computer Engineering and Intelligent Communications (ISCEIC 2022), Xi’an, China, 16–18 September 2023. [Google Scholar]
  23. Tumas, P.; Serackis, A.; Nowosielski, A. Augmentation of Severe Weather Impact to Far-Infrared Sensor Images to Improve Pedestrian Detection System. Electronics 2021, 10, 934. [Google Scholar] [CrossRef]
  24. Hou, Y.; Yao, L.; Jia, Z.; Su, D.; Wang, X.; Guo, K. Analysis method for identifying unsafe behaviors in coal mines based on video data. Coal 2023, 32, 33–36+91. [Google Scholar]
  25. Yang, D.; Guo, Y.; Wang, S.; Ma, X. Obstacle identification of unmanned electric rail locomotives in coal mines. J. Zhejiang Univ. (Eng. Ed.) 2024, 58, 29–39. [Google Scholar]
  26. Fu, C.; Liu, W.; Ranga, A.; Tyagi, A.; Berg, A.C. DSSD: Deconvolutional single shot detector. arXiv 2017, arXiv:1701.06659. [Google Scholar] [CrossRef]
  27. Jeong, J.; Park, H.; Kwak, N. Enhancement of SSD by concatenating feature maps for object detection. arXiv 2017, arXiv:1705.09587. [Google Scholar] [CrossRef]
  28. Guo, C.; He, J. Improved single shot multiboxdetector based on the transposed convolution. J. Comput. Appl. 2018, 38, 2833–2838. [Google Scholar]
  29. Li, Z.; Zhou, F. FSSD: Feature fusion singleshot Multibox detector. arXiv 2017, arXiv:1712.00960. [Google Scholar] [CrossRef]
  30. He, K.; Gkioxari, G.; Dollár, P.; Girshick, R. Mask R-CNN. IEEE Trans. Pattern Anal. Mach. Intell. 2020, 42, 386–397. [Google Scholar] [CrossRef] [PubMed]
  31. Girshick, R. Fast R-CNN. In Proceedings of the 2015 IEEE International Conference on Computer Vision, Santiago, Chile, 7–13 December 2015; pp. 1440–1448. [Google Scholar]
  32. Su, J.; Yi, H.; Ling, L.; Shu, A.; Lu, E.; Jiao, Y.; Wang, S. Multi-object surface roughness grade detection based on Faster R-CNN. Meas. Sci. Technol. 2022, 34, 015012. [Google Scholar] [CrossRef]
  33. Mansouri, S.S.; Karvelis, P.; Kanellakis, C.; Kominiak, D.; Niko-lakopoulos, G. Vision-Based MAV Navigation in Underground Mine Using Convolutional Neural Network. In Proceedings of the IECON 2019—45th Annual Conference of the IEEE Industrial Electronics Society, Lisbon, Portugal, 14–17 October 2019. [Google Scholar]
  34. Li, C.; Song, D.; Tong, R.; Tang, M. Illumination-aware faster R-CNN for robust multi-spectral pedestrian detection. Pattern Recognit. 2019, 85, 161–171. [Google Scholar] [CrossRef]
  35. Cui, L.; Zhang, Q.; Guo, Q.; Ma, B. Underground personnel behavior pattern recognition model based on CNN-LSTM. Radio Eng. 2023, 53, 1375–1381. [Google Scholar]
  36. Ren, H. Recognition of Abnormal Human Behavior Based on Underground Coal Mine Surveillance Videos. Master’s Thesis, Taiyuan University of Science and Technology, Taiyuan, China, 2023. [Google Scholar]
  37. Wang, Q.; Zhang, L.; Li, Y.; Kpalma, K. Overview ofdeep-learning based methods for salient object detection in videos. Pattern Recognit. 2020, 104, 107340. [Google Scholar] [CrossRef]
  38. Van den Broeck, W.A.J.; Goedemé, T. Combining Deep Semantic Edge and Object Segmentation for Large-Scale Roof-Part Polygon Extraction from Ultrahigh-Resolution Aerial Imagery. Remote Sens. 2022, 14, 4722. [Google Scholar] [CrossRef]
  39. Wang, X.; Gao, J.; Hou, B.; Wang, Z.; Ding, H.; Wang, J. A lightweight modified YOLOX network using coordinate attention mechanism for PCB surface defect detection. IEEE Sens. J. 2022, 22, 20910–20920. [Google Scholar]
Figure 1. YOLOv8 network structure diagram.
Electronics 13 00623 g001
Figure 2. YOLOv8-CA backbone network structure diagram.
Electronics 13 00623 g002
Figure 3. CA structure.
Electronics 13 00623 g003
Figure 4. Ray method.
Electronics 13 00623 g004
Figure 5. Determine whether the point is in the polygon. (Numbers represent the number of intersections; different colors represent different directions).
Electronics 13 00623 g005
Figure 6. Training results.
Electronics 13 00623 g006
Figure 7. F1 score.
Figure 7. F1 score.
Electronics 13 00623 g007
Figure 8. PR curve.
Figure 8. PR curve.
Electronics 13 00623 g008
Figure 9. PR Curve of the five methods.
Electronics 13 00623 g009
Figure 10. Results of different models.
Electronics 13 00623 g010
Figure 11. The detection effect of different dangerous areas under the well.
Electronics 13 00623 g011
Table 1. Ablation experiment.
CASNMSP/%Map/%F1/%
81.289.650.3
87.493.567.2
89.399.375.6
88.099.580.9
Table 2. Different algorithm model comparison.
AlgorithmMap/%Model Size/MBFPS/s
Faster RCNN83.252828
SSD87.411051
YOLOv5l89.210139
YOLOv8l89.68246
This article99.58645
Disclaimer/Publisher’s Note: The statements, opinions and data contained in all publications are solely those of the individual author(s) and contributor(s) and not of MDPI and/or the editor(s). MDPI and/or the editor(s) disclaim responsibility for any injury to people or property resulting from any ideas, methods, instructions or products referred to in the content.

