
Deep-Learning-Based Action and Trajectory Analysis for Museum Security Videos

Abstract
:1. Introduction
Related Works
2. Materials and Methods
2.1. Video Anomaly Detection
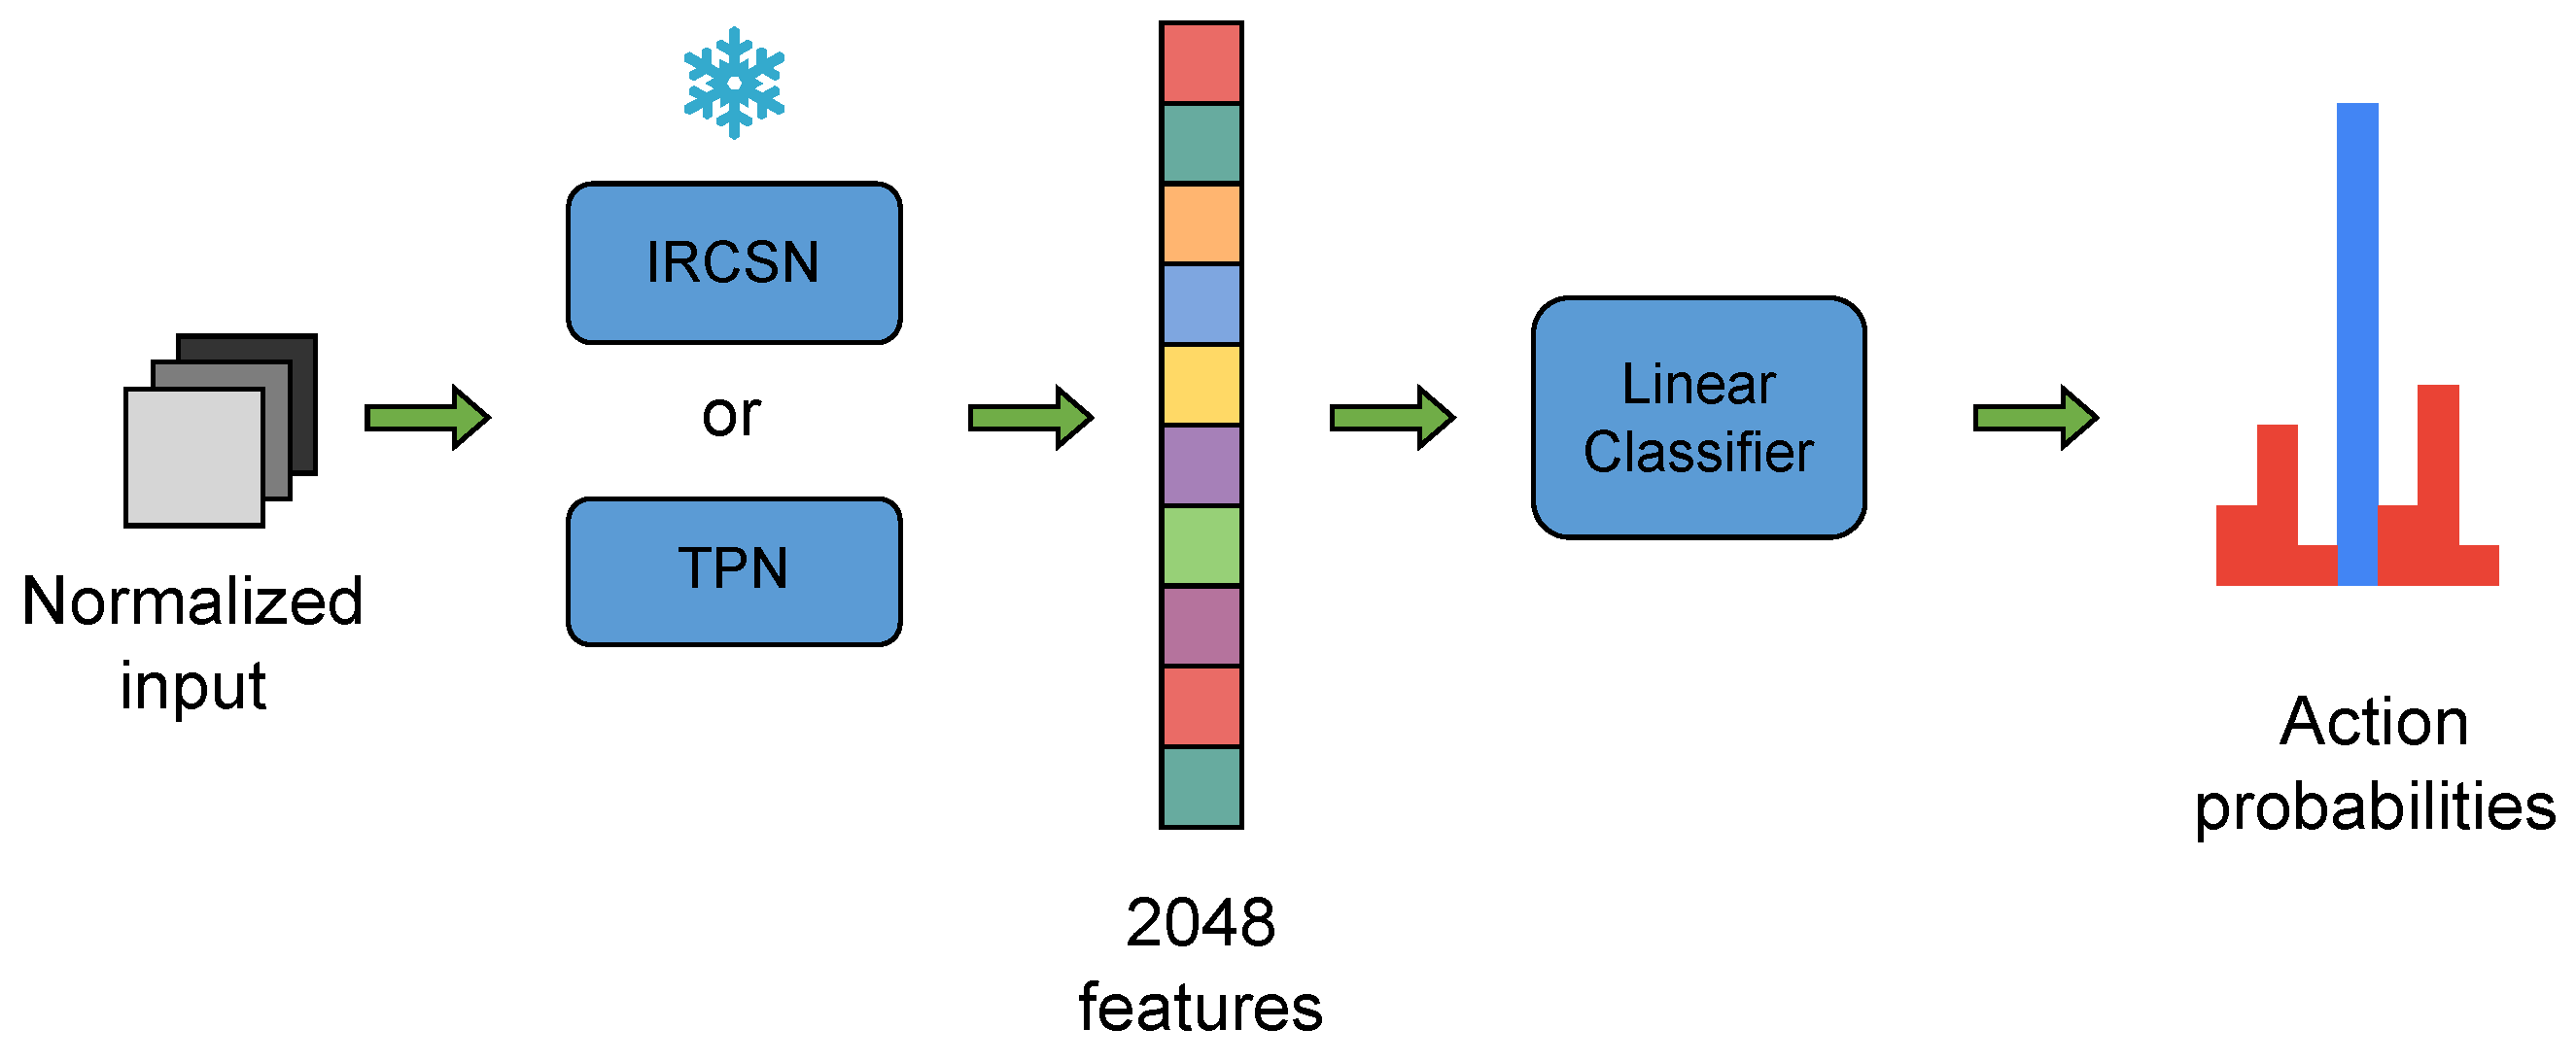
Method Description
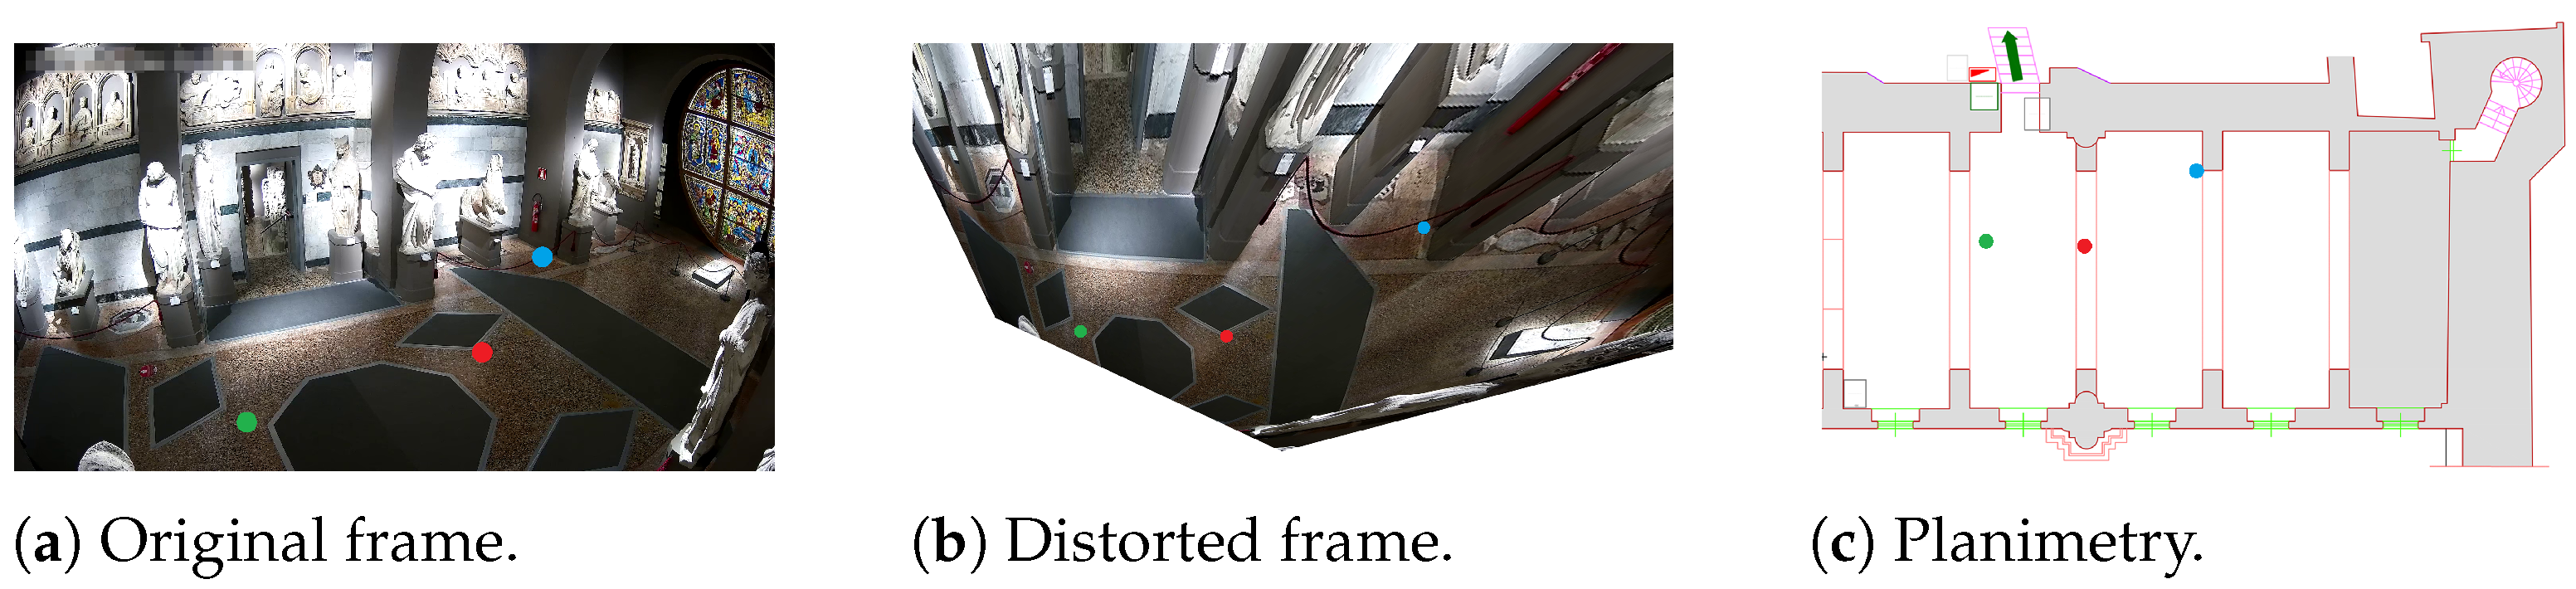
2.2. Trajectory Extraction and Analysis
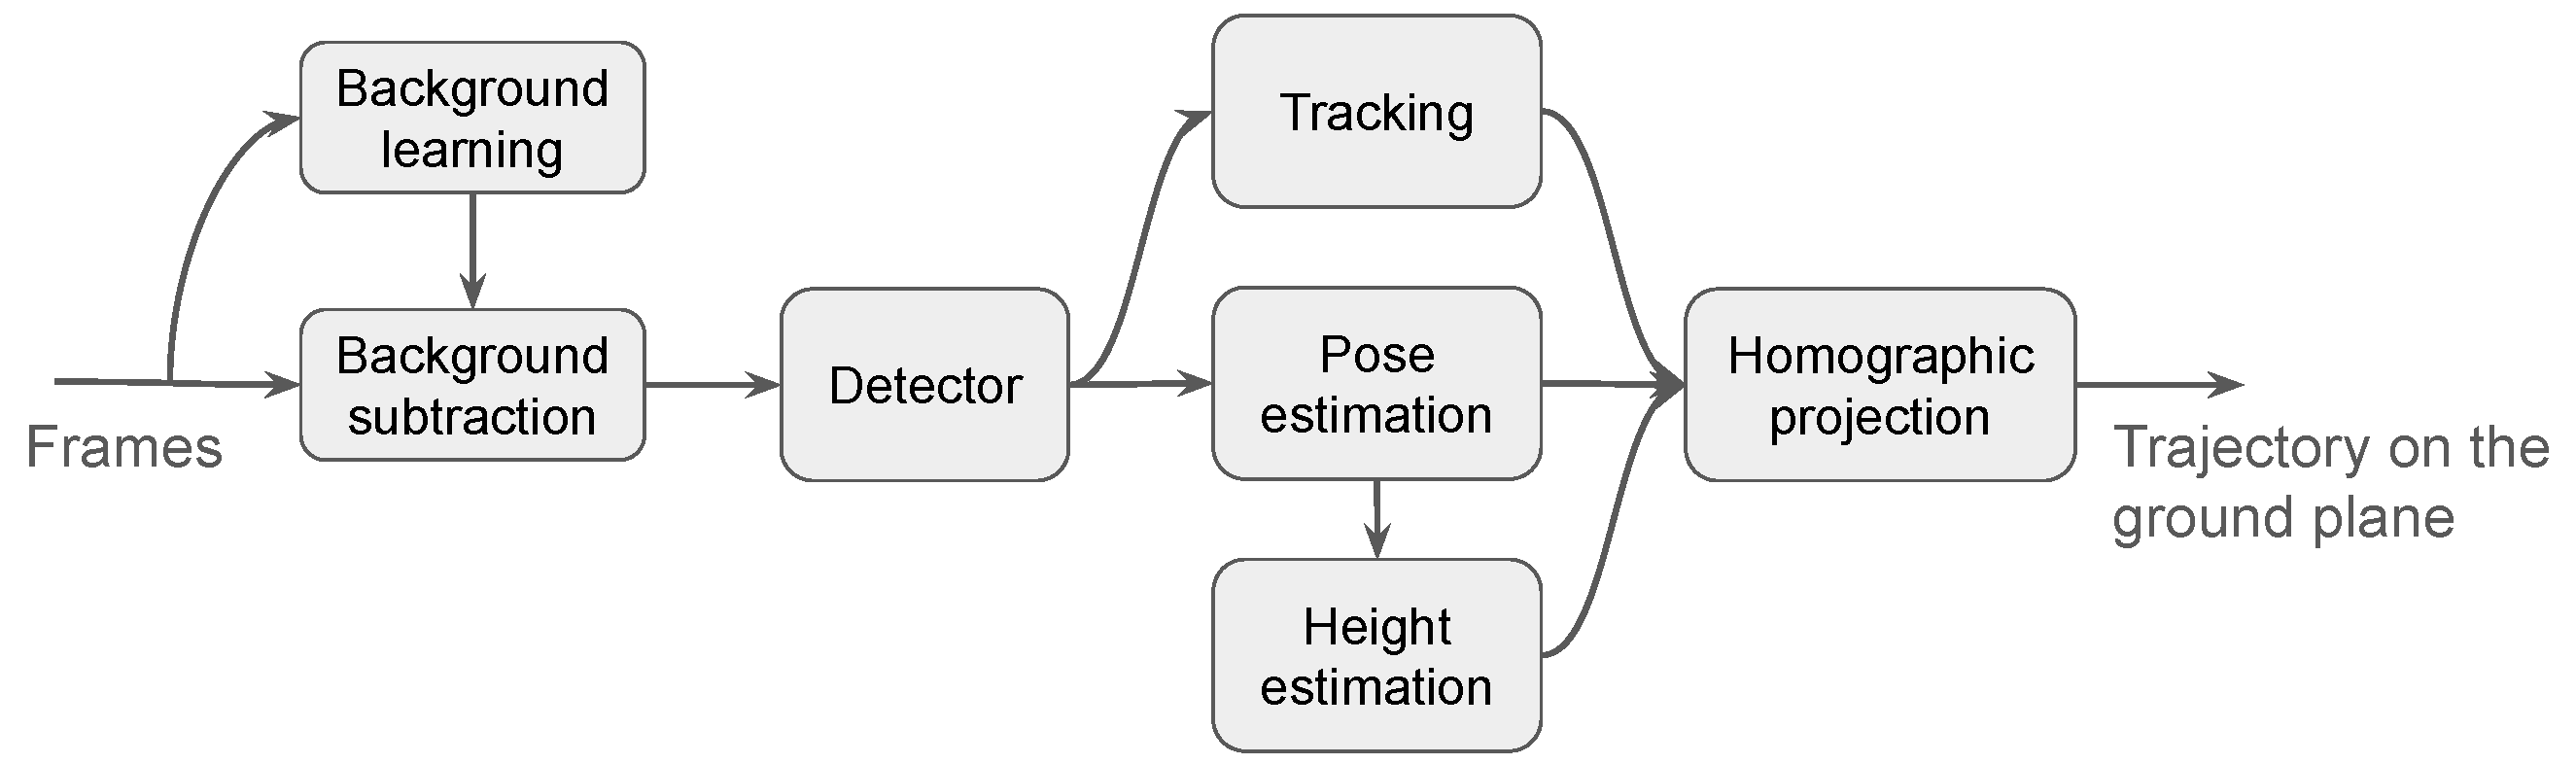
Method Description
- Background learning and subtraction to exclude the static portions of the video frame from the analysis;
- Detection of people in the scene;
- Tracking and re-identification of detected people to maintain consistent identities across frames;
- Pose estimations of the detected people to infer the positions of their heads and feet;
- Estimations of the heights of the detected people, whenever possible, to project their position onto the ground plane, even if the feet are occluded in some frames;
- Projection of the people’s positions onto the ground plane using homographic transformations and exploiting the information about the feet and/or head positions, combined with the estimated height of each individual.
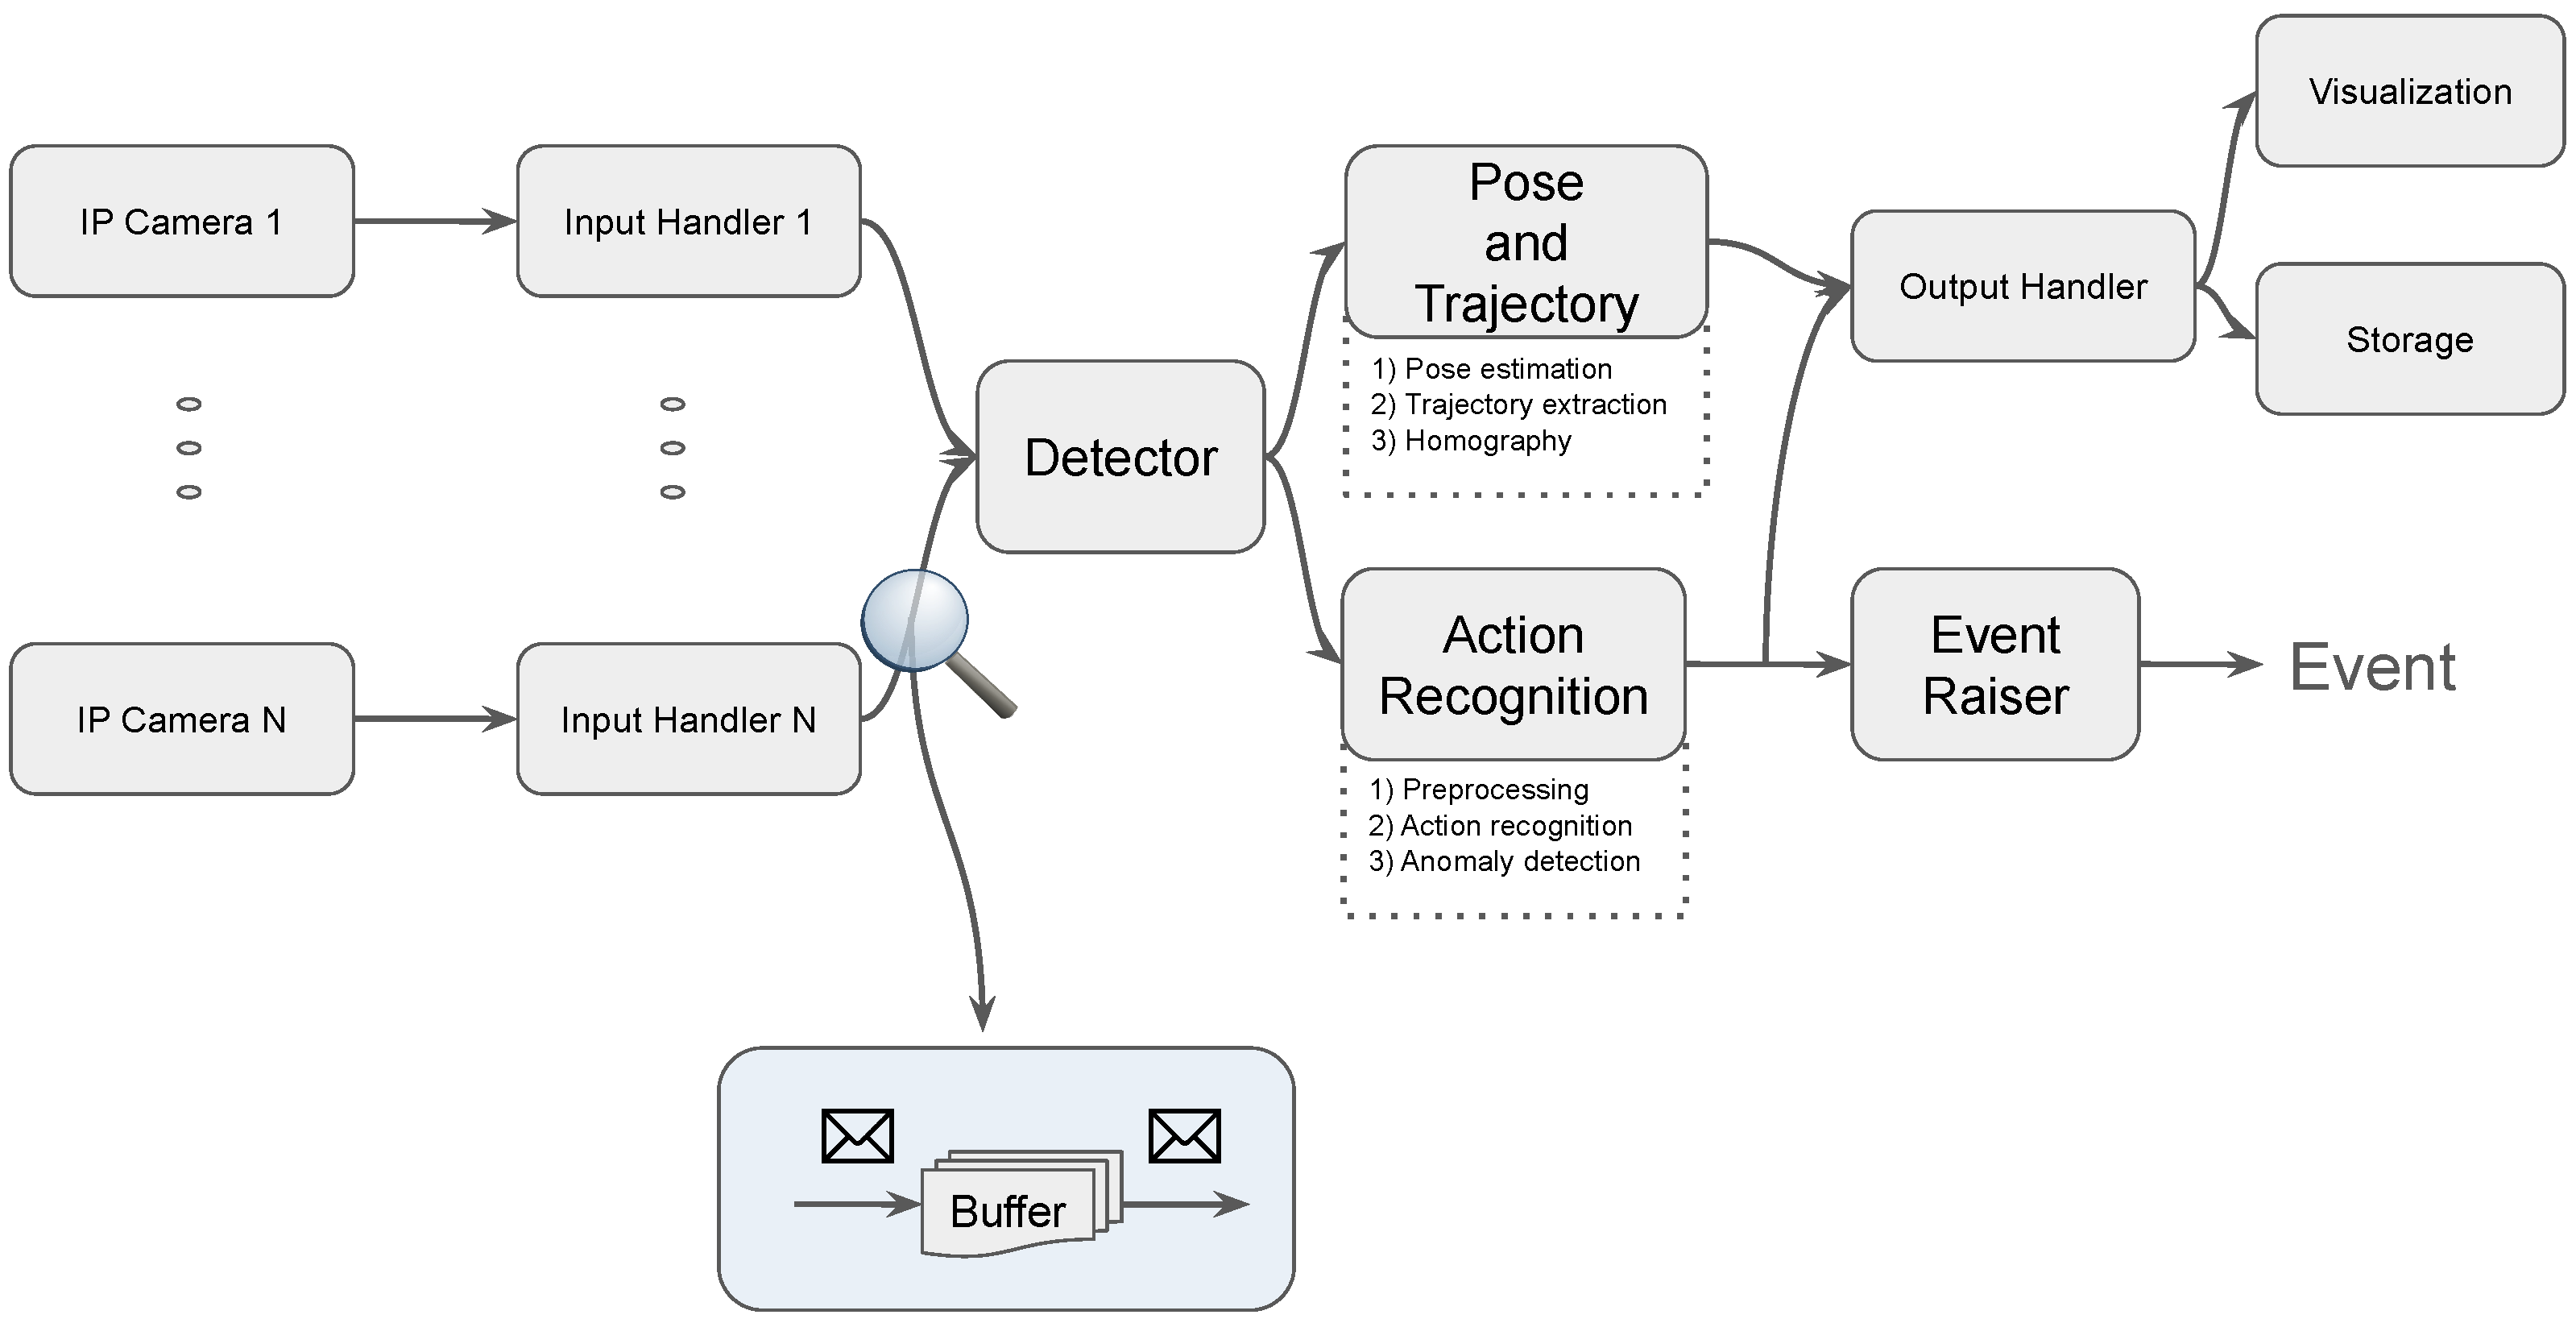
2.3. Integration and Video Stream Processing
3. Experiments
3.1. Video Anomaly Detection
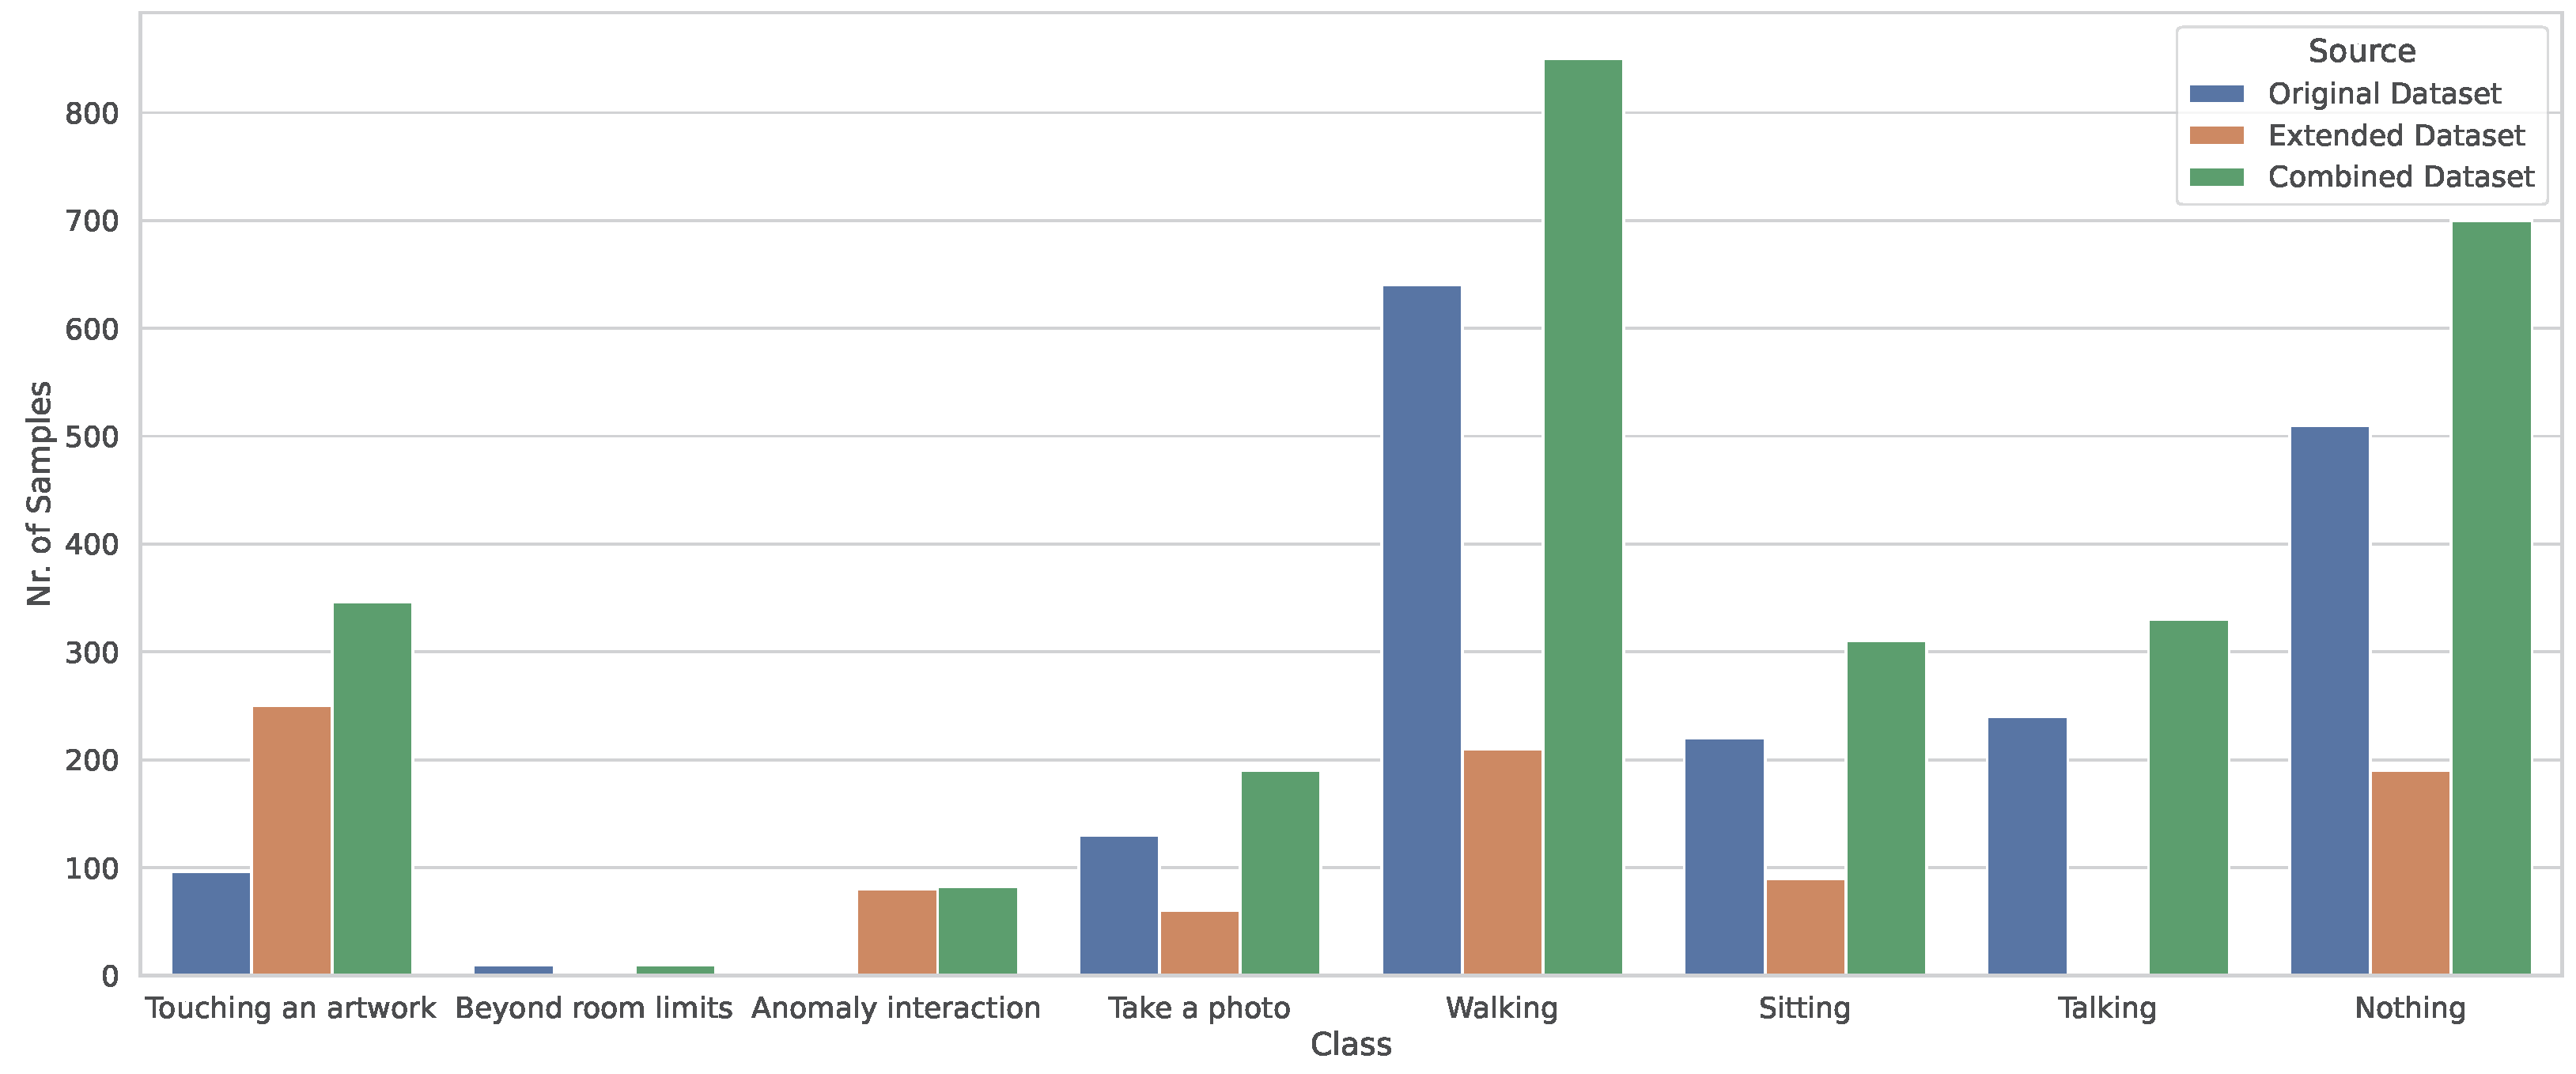
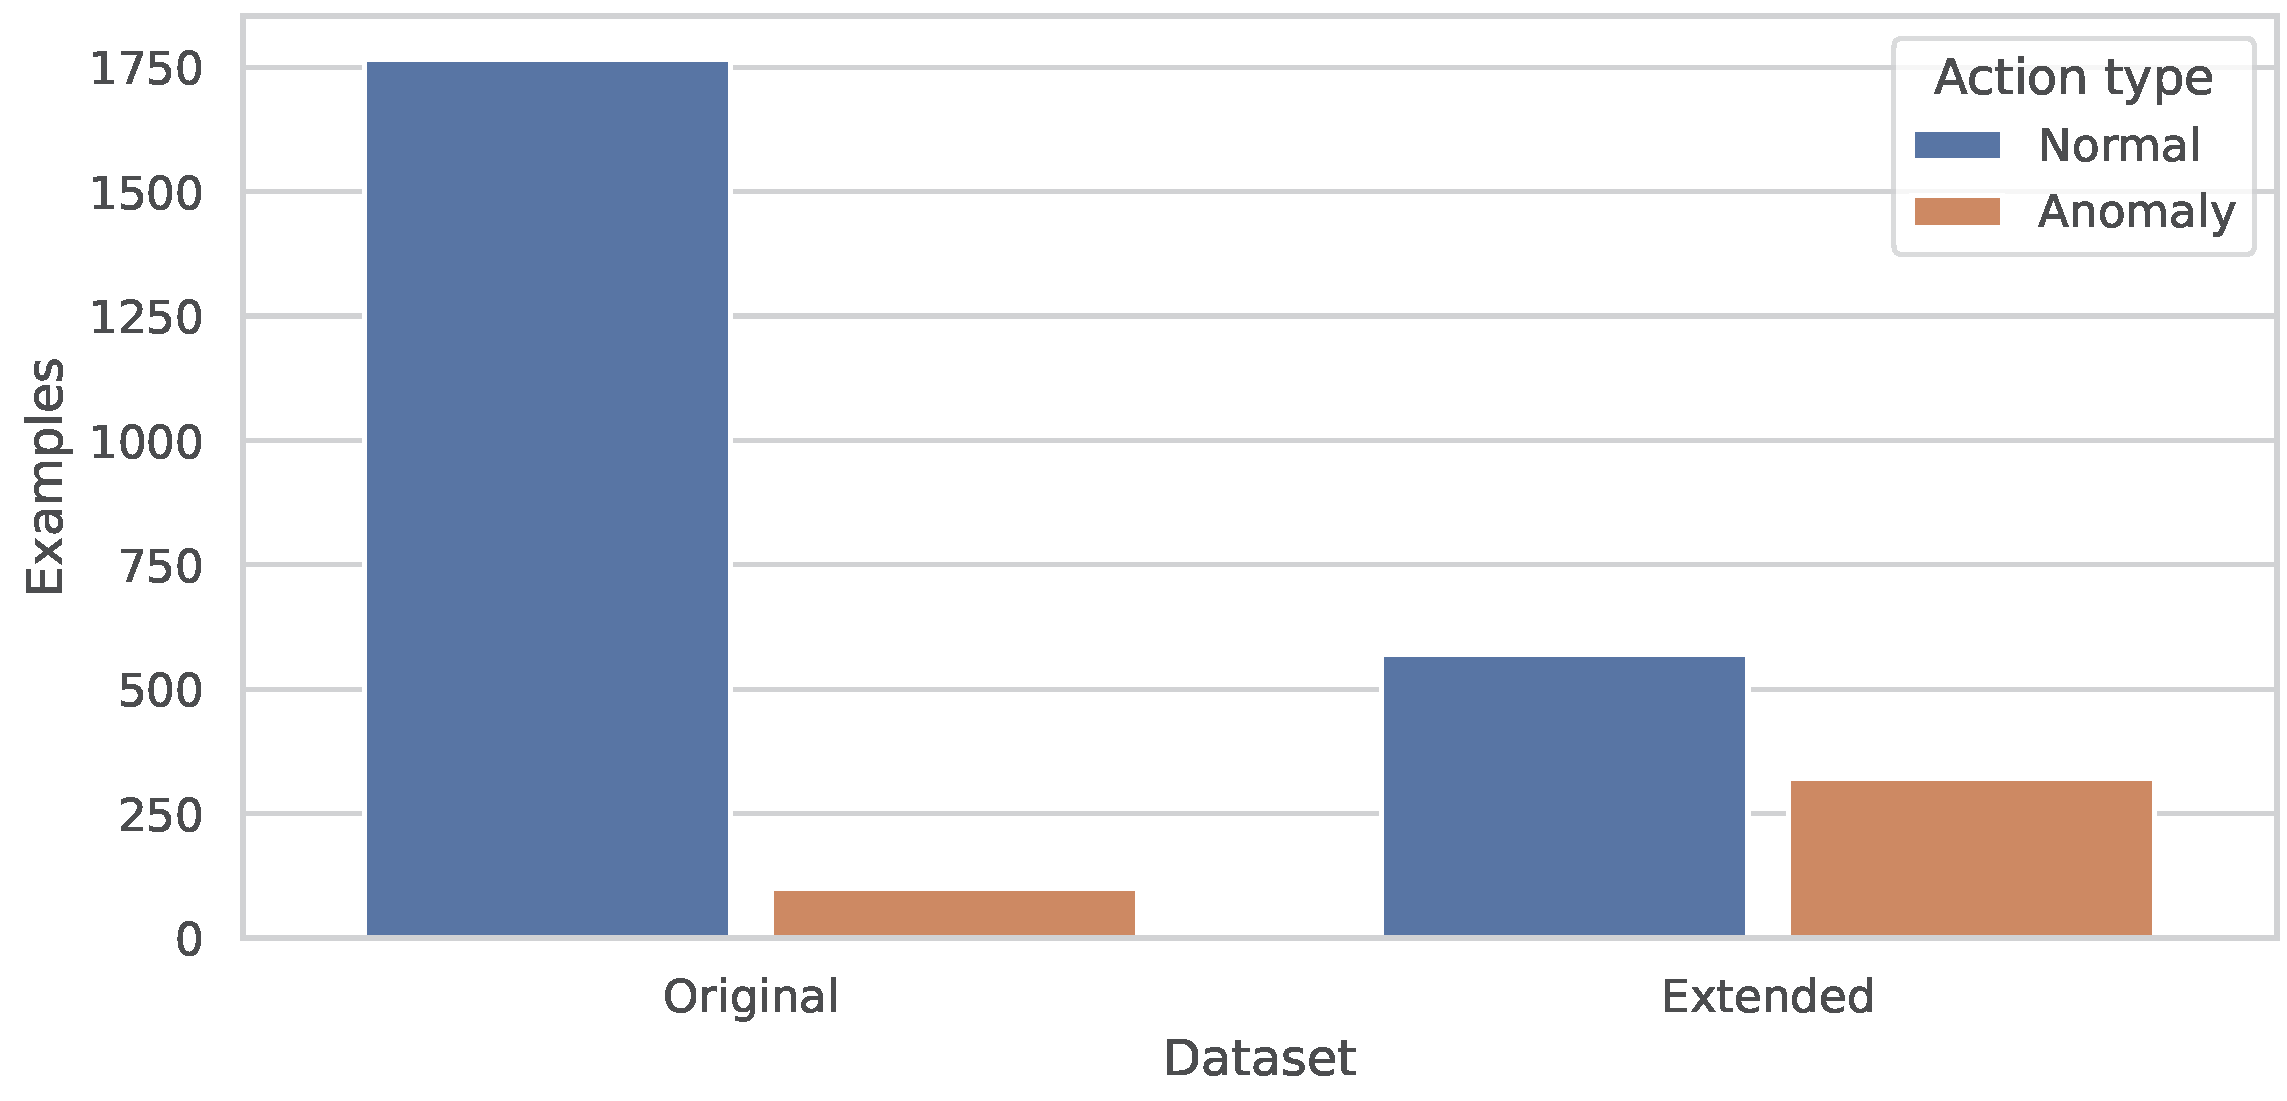
3.1.1. Dataset Composition
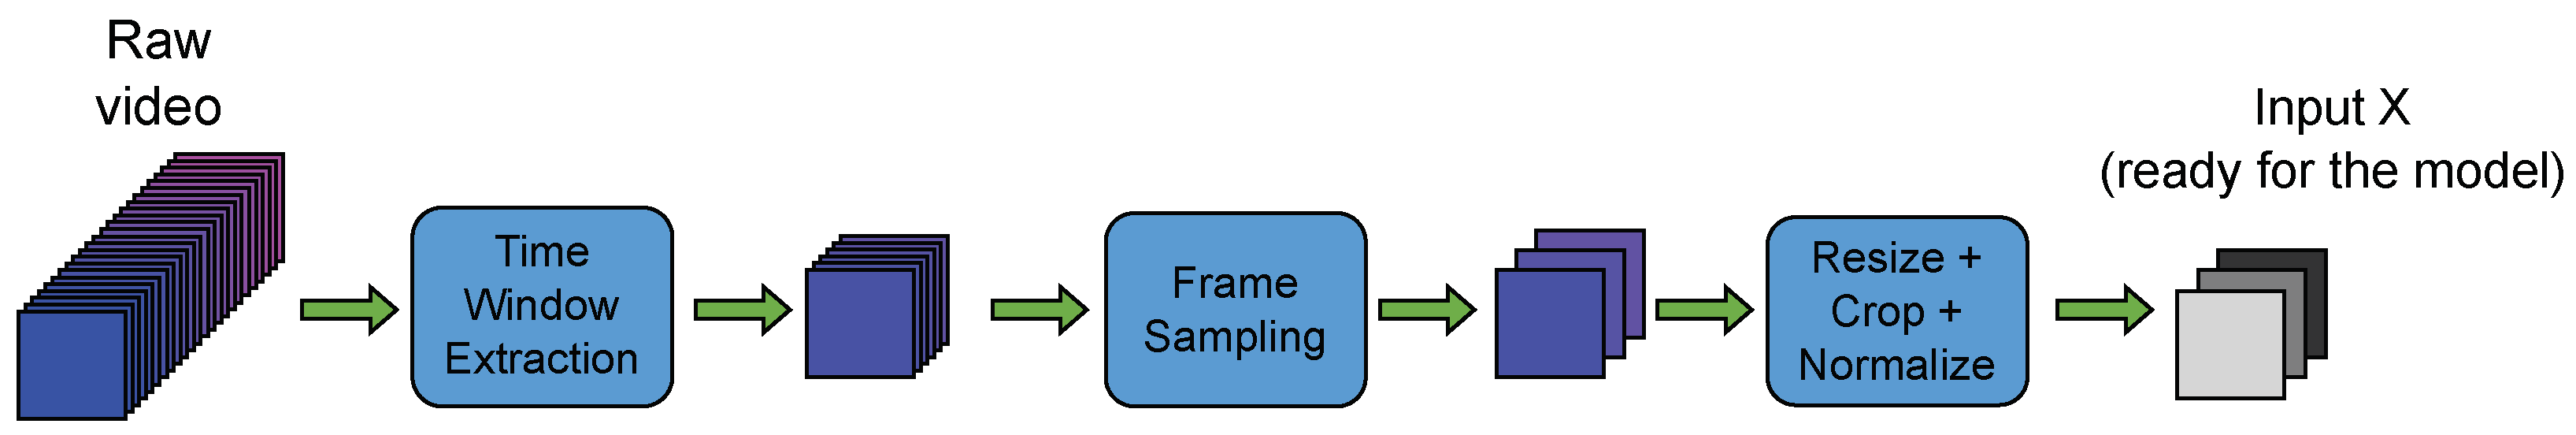
3.1.2. Experimental Setup
- Decoding: extracting the corresponding sequence of frames;
- Time window sampling: randomly selecting a frame window of 64 frames;
- Uniform frame sampling: dividing the obtained frame window into eight equally long parts and selecting the first frame of each part while ignoring the others;
- Resizing: adjusting the spatial dimensions to ensure their shortest side is 256 pixels;
- Cropping: center-cropping the frames to obtain eight RGB square frames with a side length of 224 pixels;
- Normalization: channel-wise normalization of the resulting images by subtracting the mean and dividing by the standard deviation of the color distribution.
- Accuracy (acc@1): This metric measures the percentage of video clips in which the action is correctly recognized by the model. It serves as a reliable indicator of the model’s ability to identify different actions in the videos.
- Area under the ROC curve (ROCAUC): The goal of anomaly detection is to distinguish between normal and abnormal actions. To evaluate the performance in scenarios with unbalanced datasets, where anomalies occur much less frequently than normal instances, the ROCAUC was adopted for the binary classification task. The ROCAUC is a suitable method for this purpose.
- Mean class accuracy (MCA): The MCA represents the mean accuracy of the system and it is calculated as the average of the acc@1 metrics computed on the examples of each class individually. This metric provides valuable insight into the performance of the model for each specific action category.
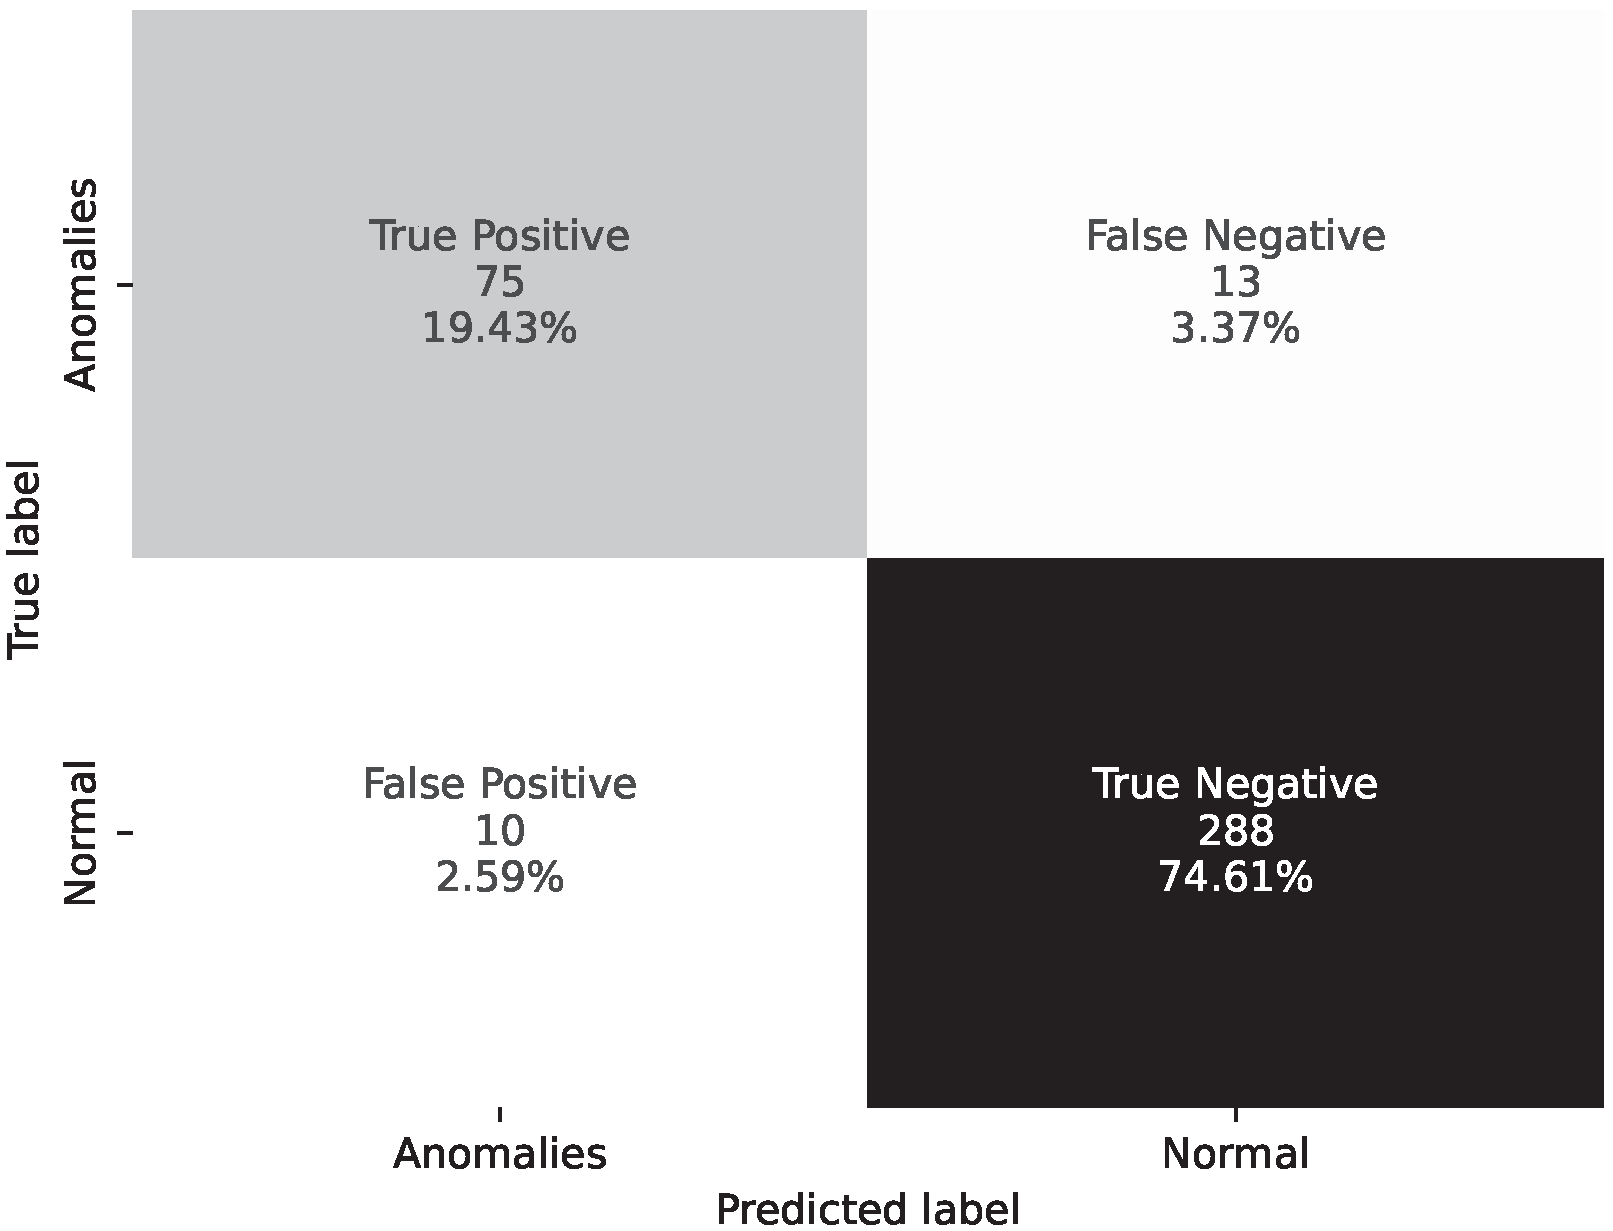
- Confusion matrix: In addition, an in-depth analysis of the confusion matrix was performed to better understand the model’s ability to minimize false positives and false negatives, which is a critical aspect, especially in real-world museum settings.
- F1-score: The F1-score is suitable to assess the overall performance of the binary classification system that is supposed to distinguish between normal and anomalous clips. This metric gives a trade-off between precision and recall, providing a measure of the minimization of false positives and false negatives.
3.2. Trajectory Extraction and Analysis
3.2.1. Dataset Composition
3.2.2. Experimental Setup
3.3. Integration and Video Stream Processing
4. Results and Discussion
4.1. Video Anomaly Detection
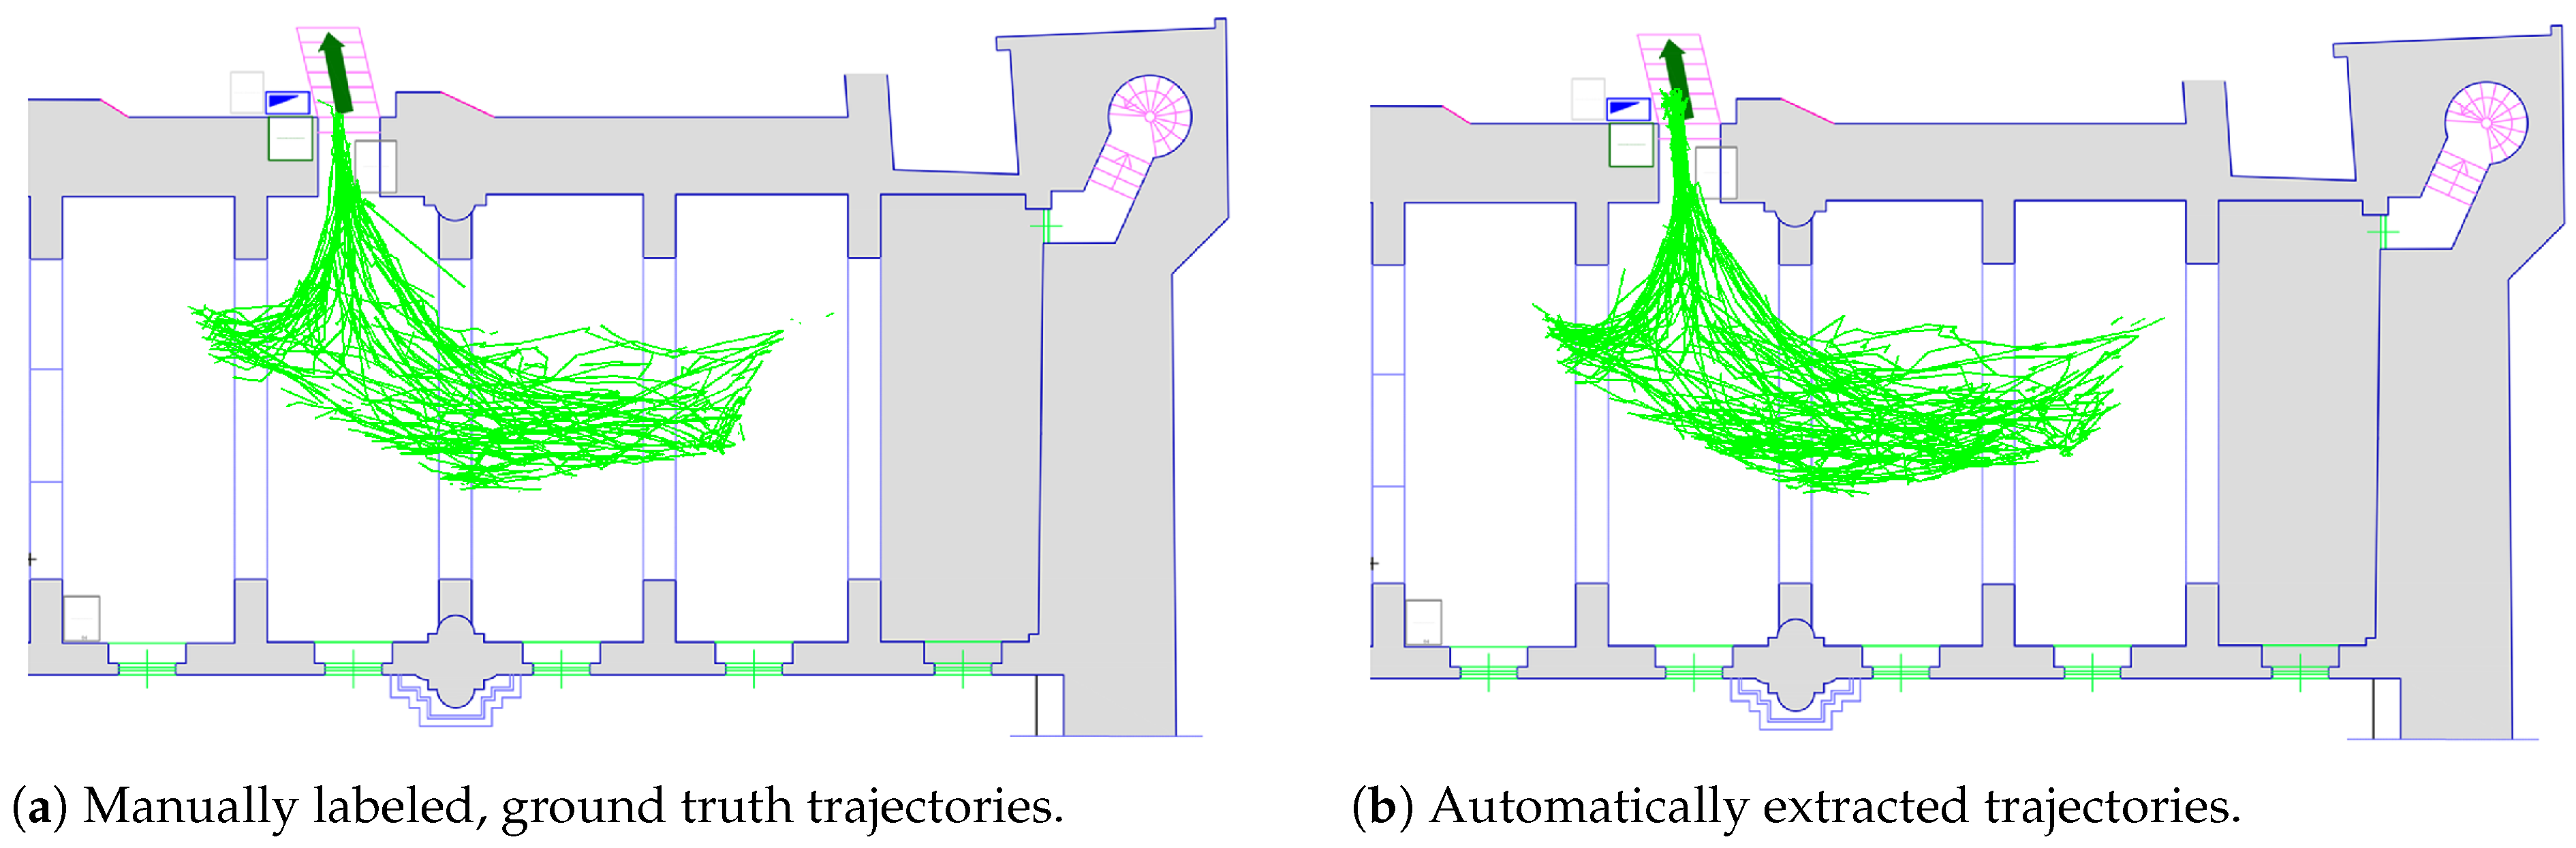
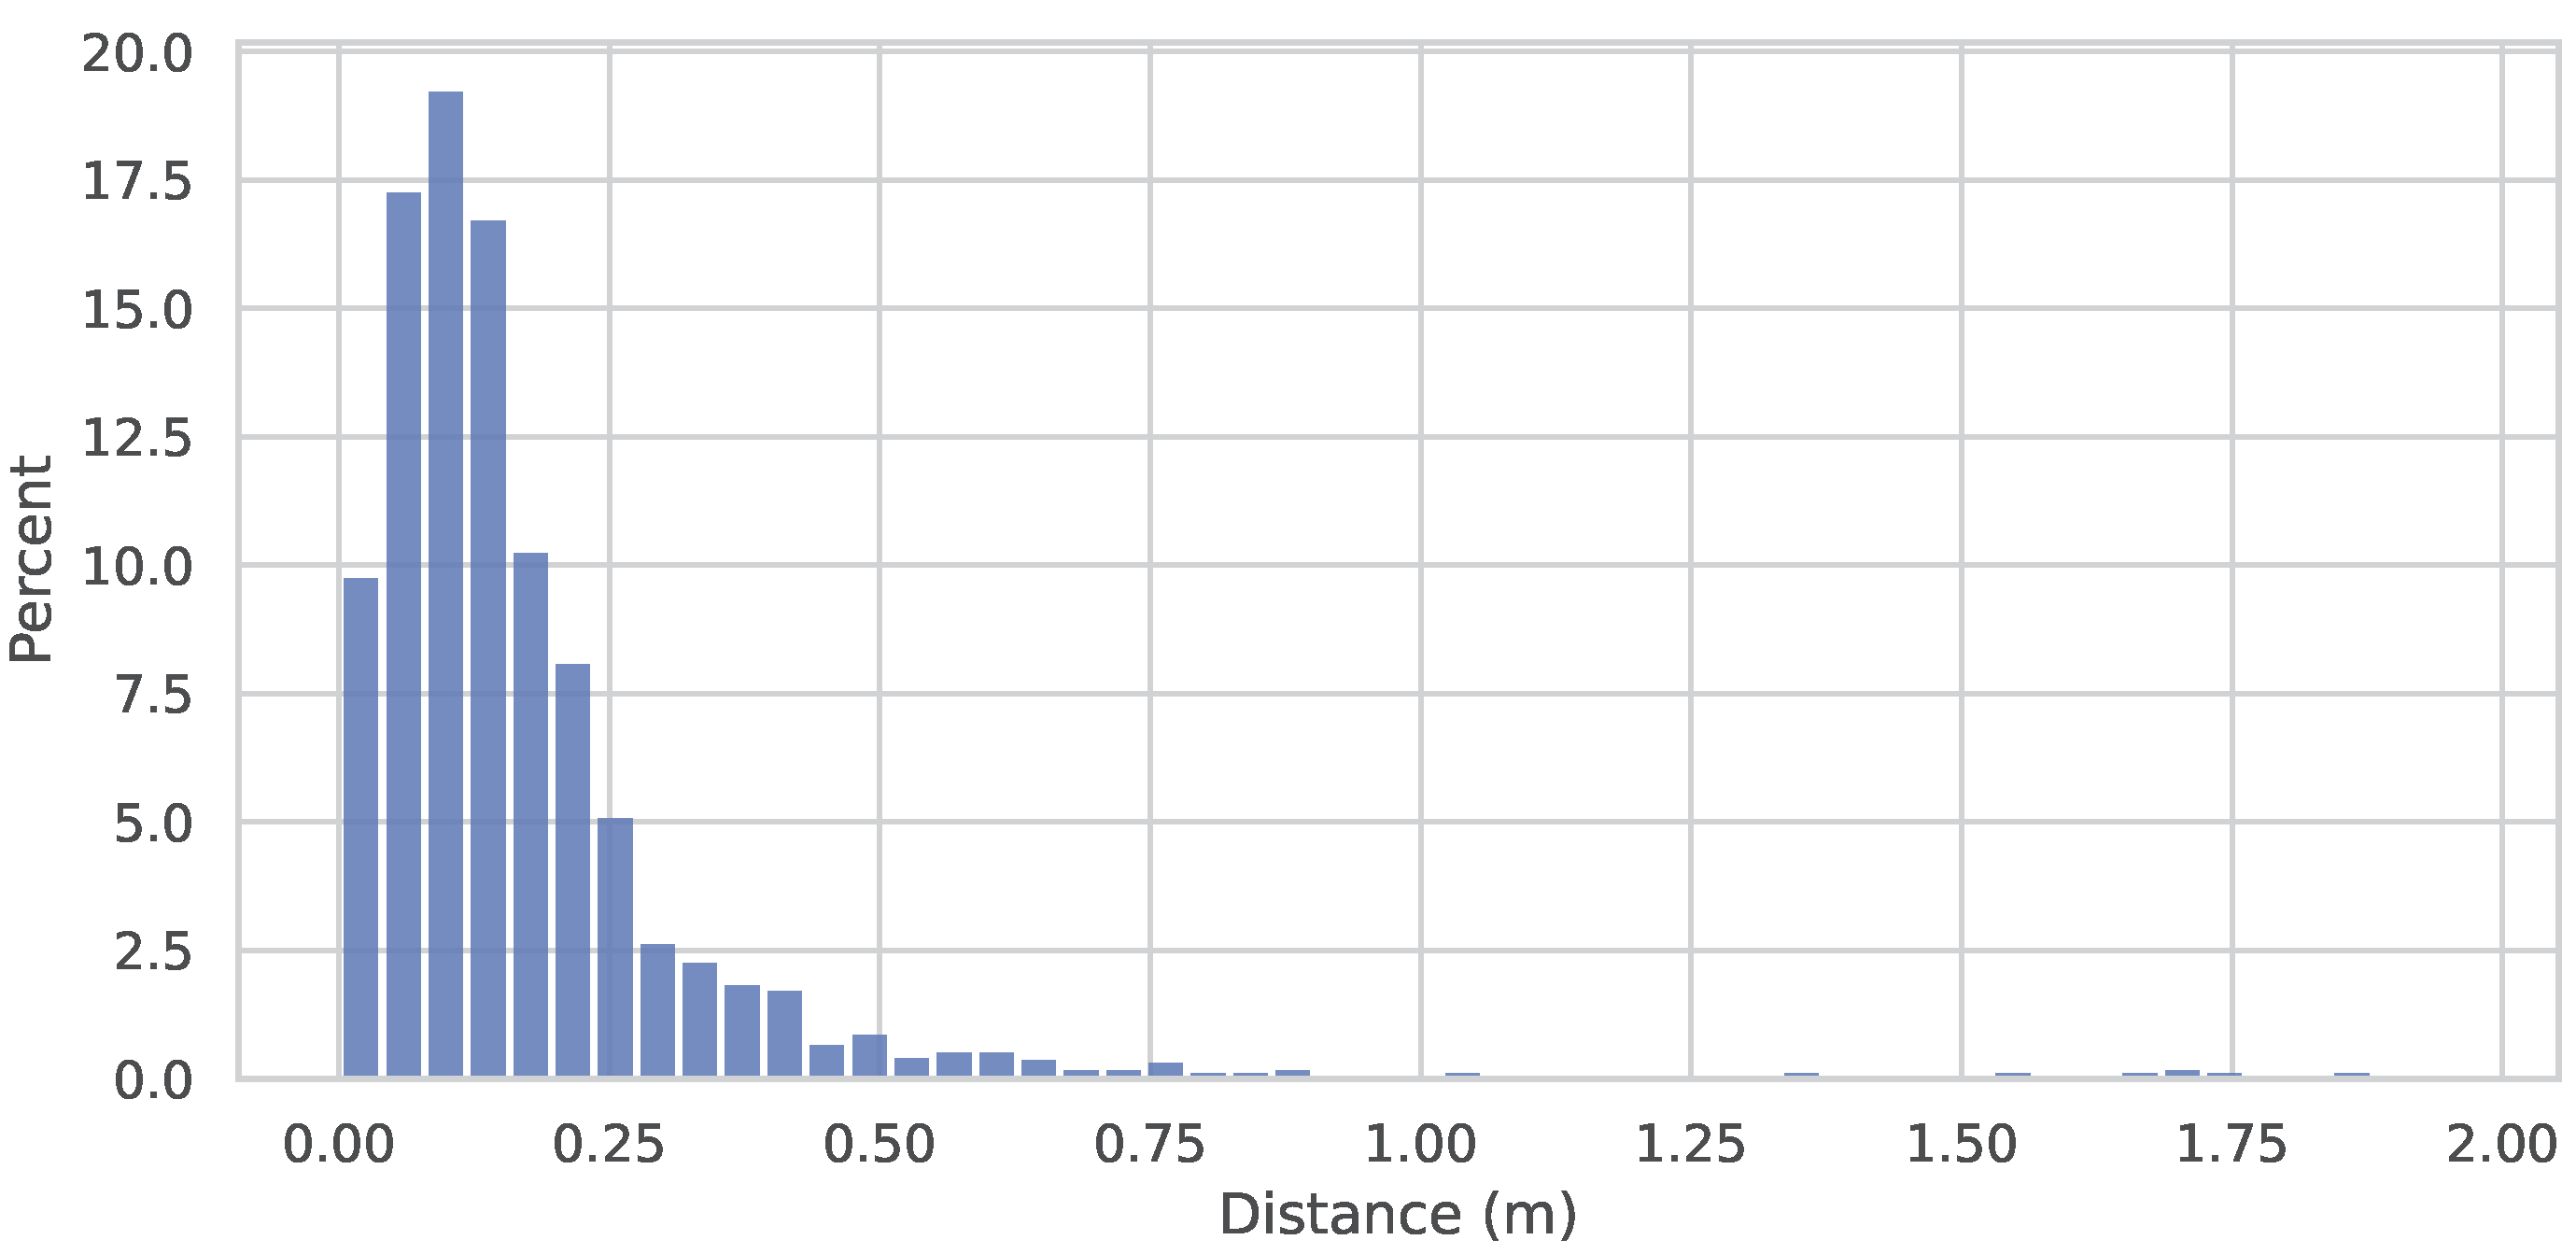
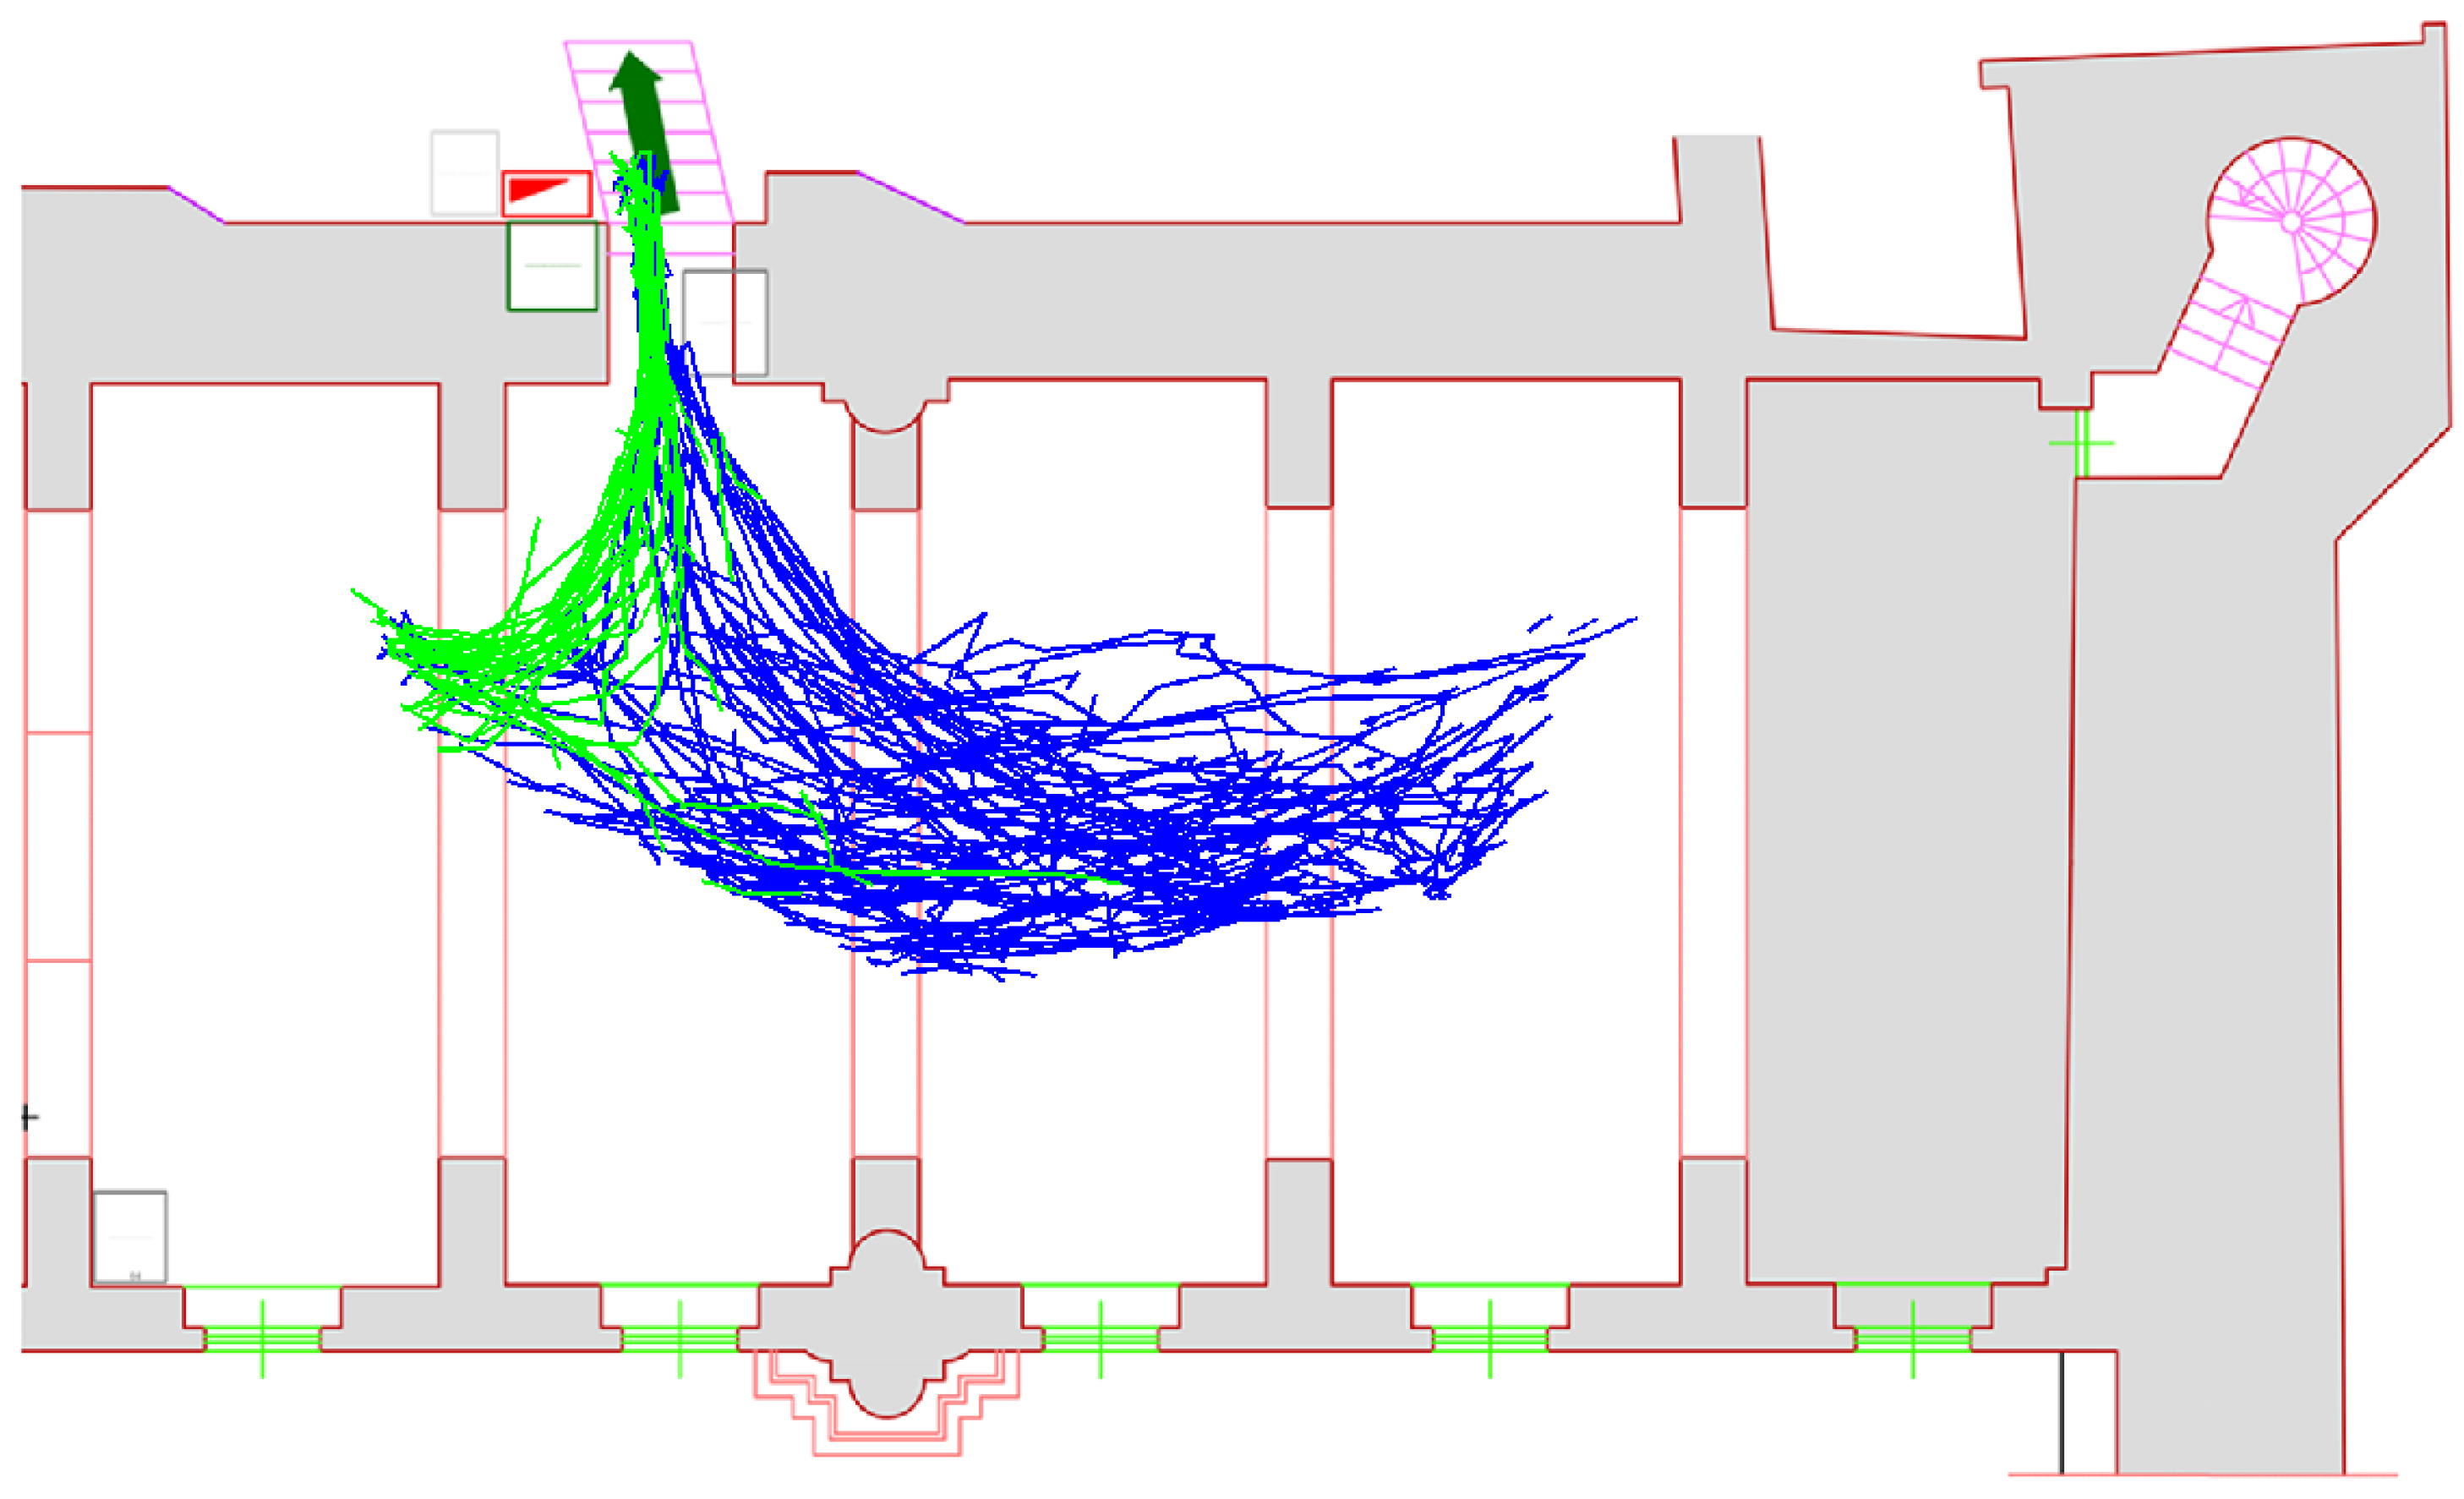
4.2. Trajectory Extraction and Analysis
4.3. Integration and Video Stream Processing
5. Conclusions
- Identification of effective models: The investigation successfully identified and validated models that are valuable in a museum setting. These models demonstrated their utility in addressing the specific anomaly detection challenges encountered in this environment.
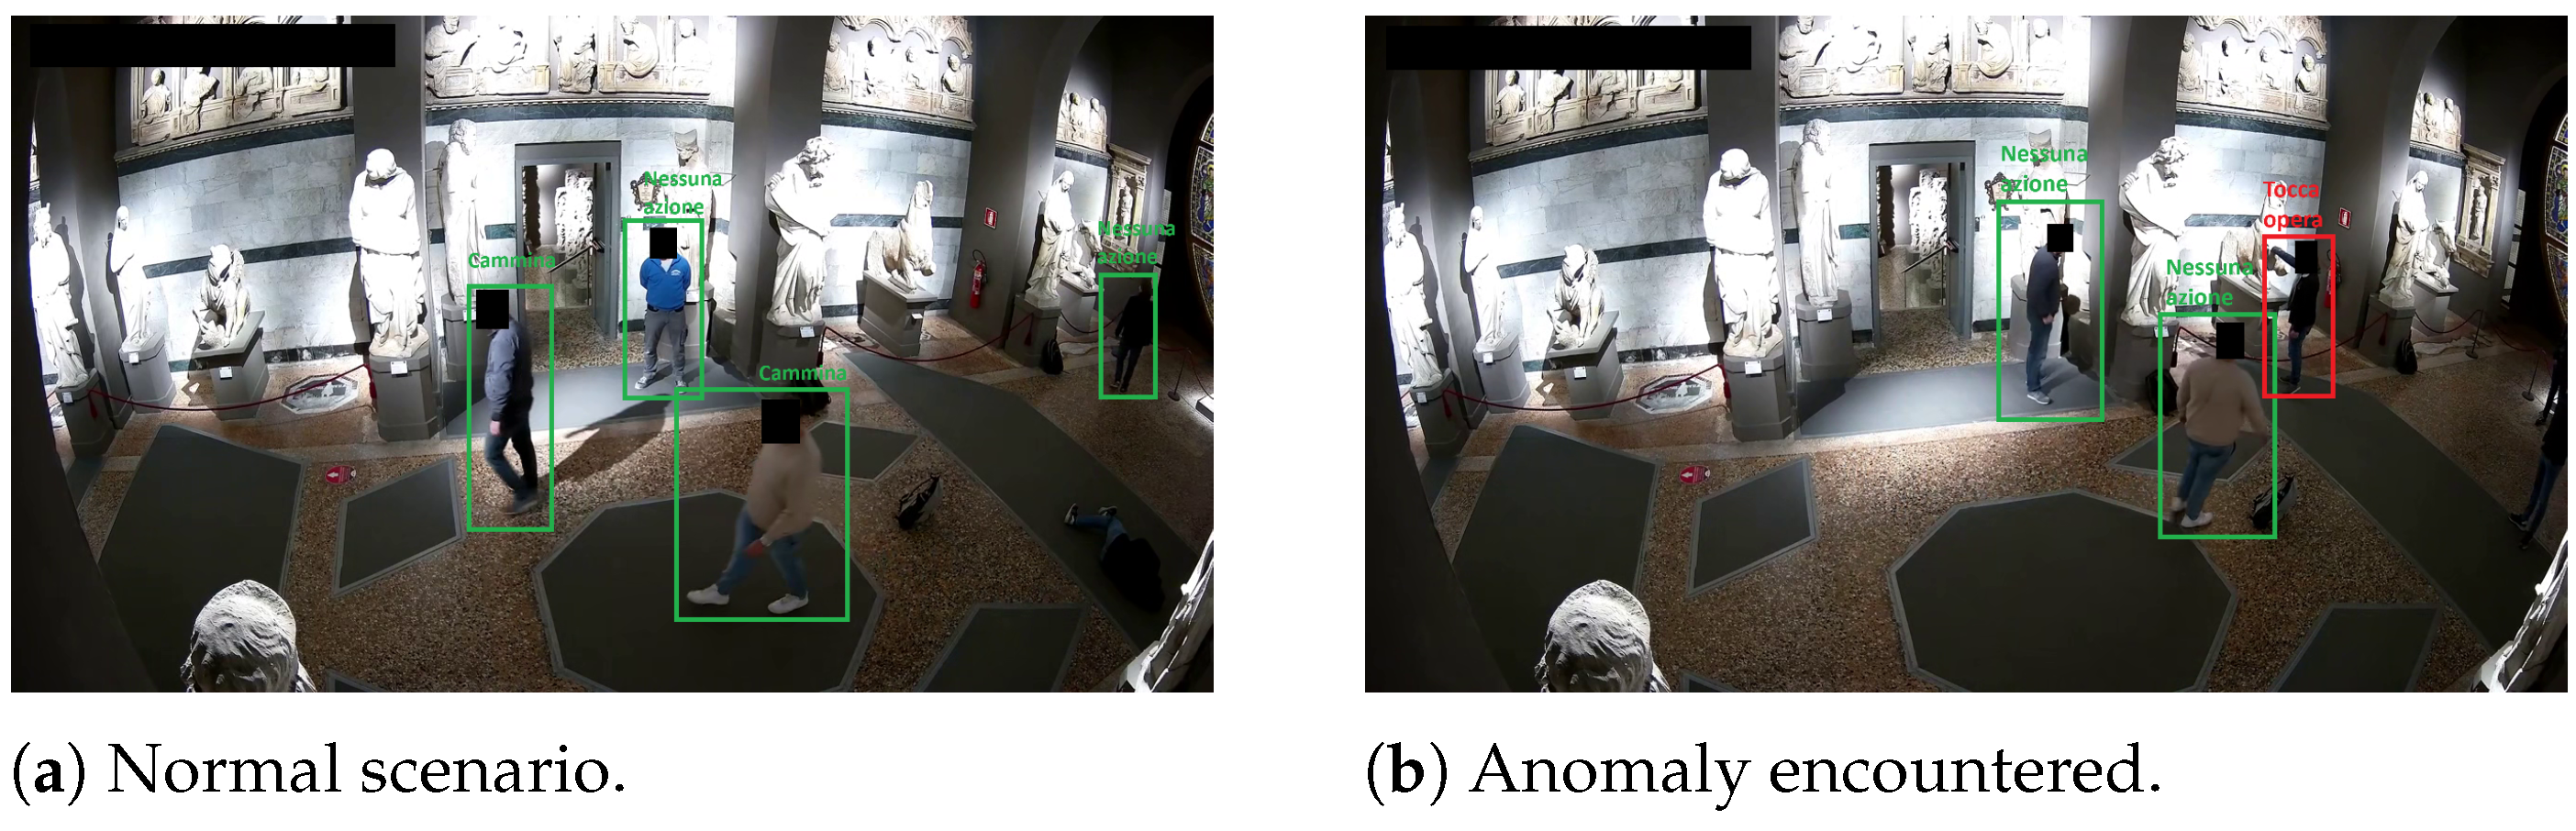
- Priority policy for actions: Our study introduced a novel approach to prioritizing actions within the anomaly detection framework. This policy addresses the challenge of ambiguous action prediction by establishing a hierarchical system for determining the importance of detected actions. This approach effectively allows for the use of scene-based action recognition to detect anomalies, also in the presence of multiple individuals.
- Dataset improvement techniques: The experiments that involved data-augmentation techniques, dataset balancing, and the introduction of new and out-of-domain examples resulted in positive outcomes of model generalization. These techniques enhanced the model’s ability to adapt to various scenarios, improving its performance and robustness.
- Ground plane trajectory extraction: a novel approach for ground plane trajectory extraction was proposed and validated, demonstrating a degree of accuracy sufficient for most tasks required in a museum environment.
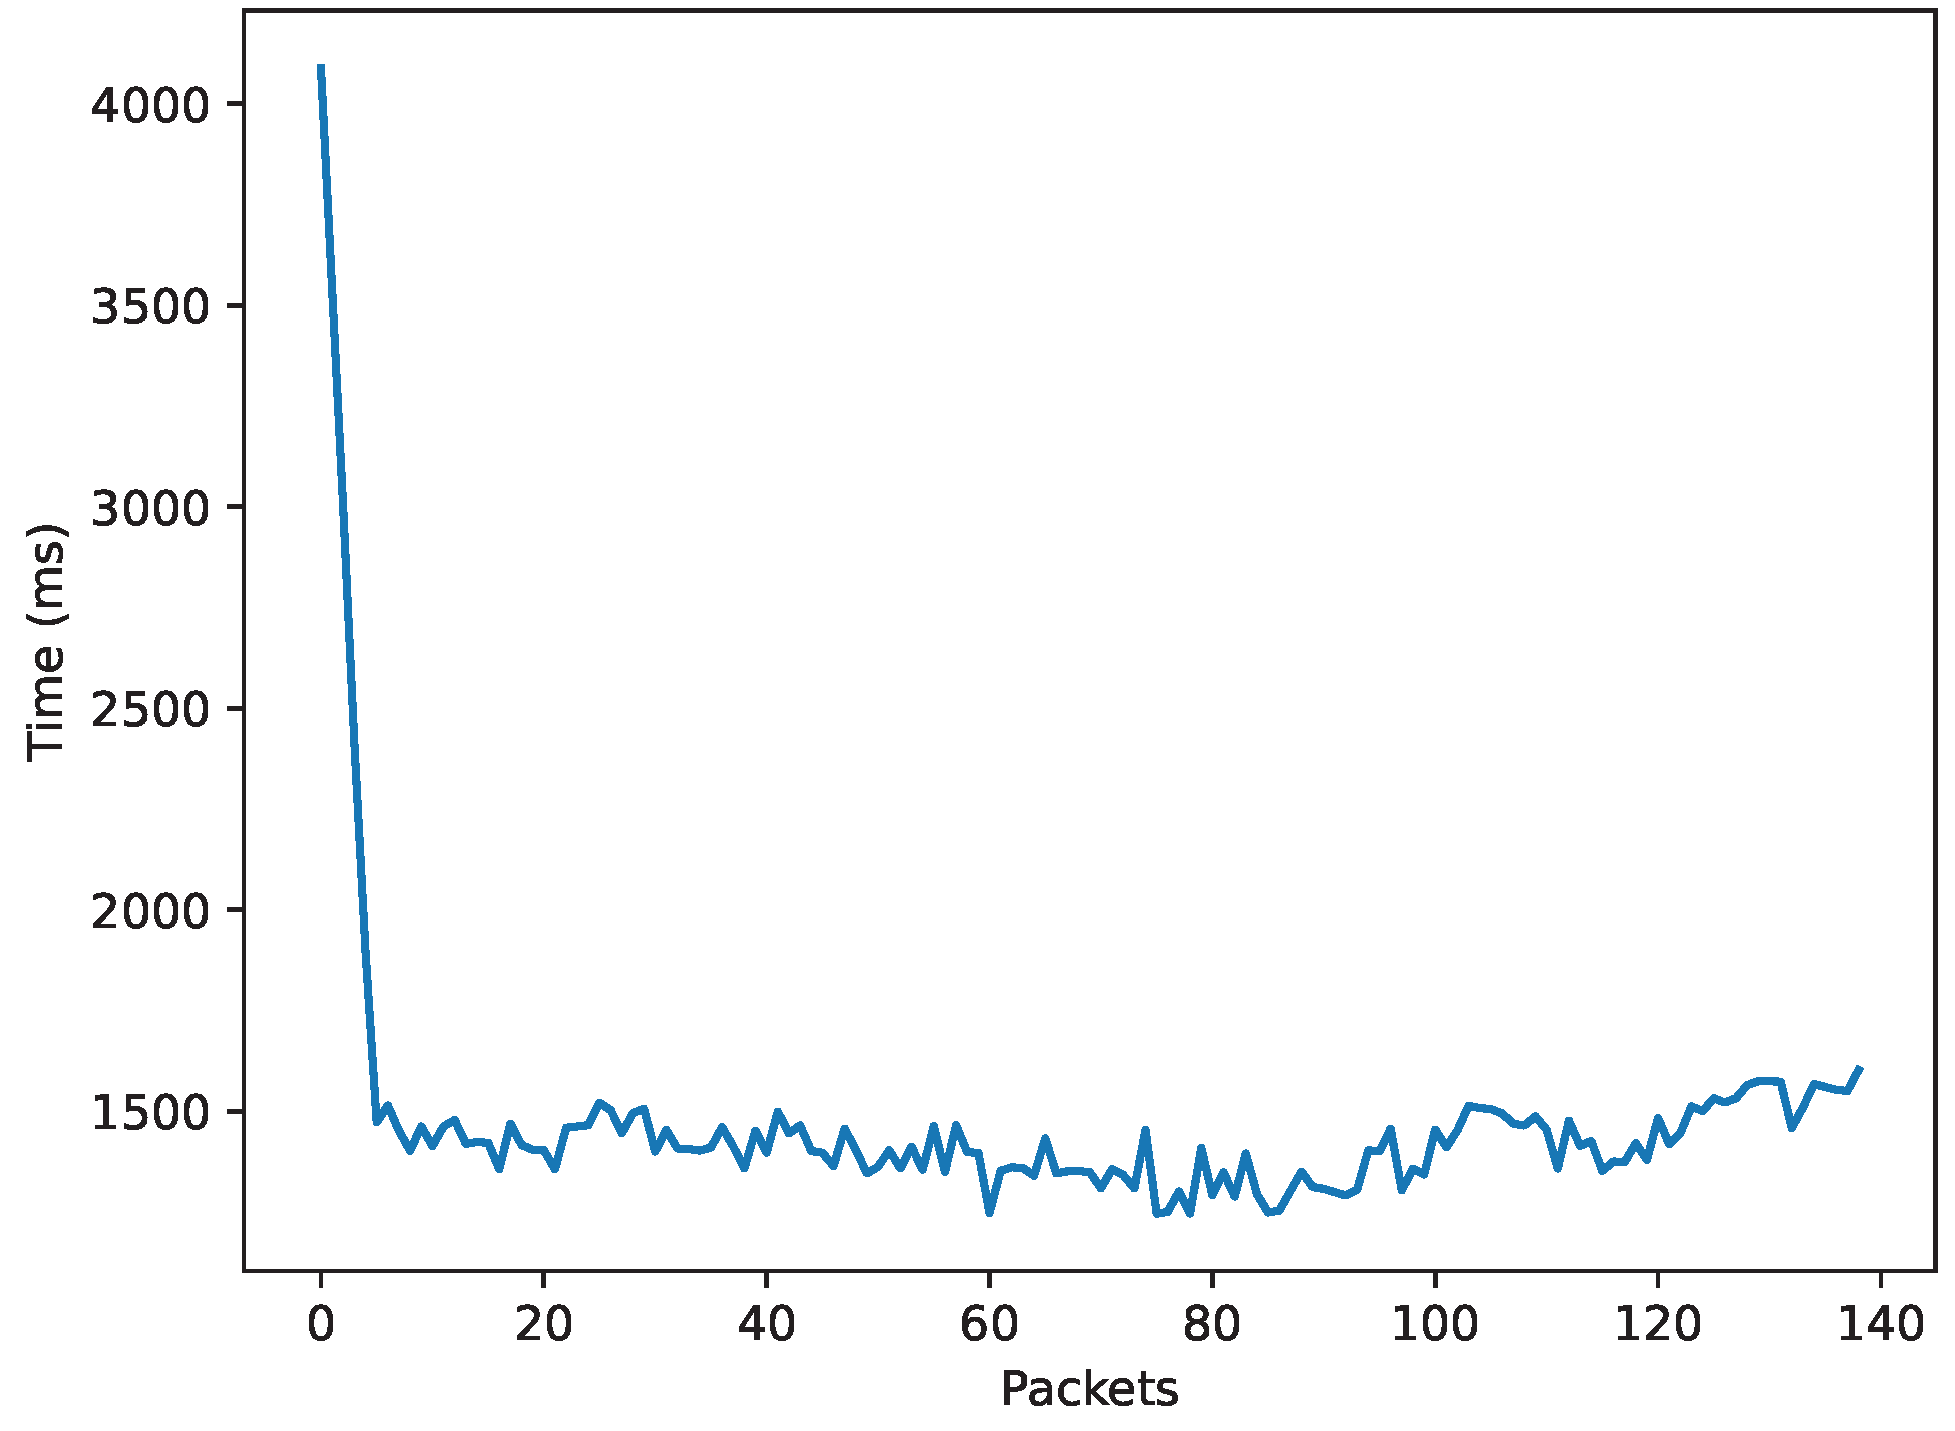
- Real-time video processing system: The anomaly detection and trajectory extraction systems were seamlessly integrated into a unified video processing architecture capable of processing a video stream in real-time. The performance of the system was tested to assess its ability to operate in real-time, demonstrating its potential for practical deployment in real-world scenarios.
5.1. Limitations
5.2. Future Work
Author Contributions
Funding
Data Availability Statement
Acknowledgments
Conflicts of Interest
References
- Sulman, N.; Sanocki, T.; Goldgof, D.; Kasturi, R. How effective is human video surveillance performance? In Proceedings of the 2008 19th International Conference on Pattern Recognition, Tampa, FL, USA, 8–11 December 2008; pp. 1–3. [Google Scholar]
- Shindell, L.M. Provenance and title risks in the art industry: Mitigating these risks in museum management and curatorship. Mus. Manag. Curatorship 2016, 31, 406–417. [Google Scholar] [CrossRef]
- Sharma, V.; Gupta, M.; Kumar, A.; Mishra, D. Video processing using deep learning techniques: A systematic literature review. IEEE Access 2021, 9, 139489–139507. [Google Scholar] [CrossRef]
- Sreenu, G.; Durai, S. Intelligent video surveillance: A review through deep learning techniques for crowd analysis. J. Big Data 2019, 6, 48. [Google Scholar] [CrossRef]
- Voulodimos, A.; Doulamis, N.; Doulamis, A.; Protopapadakis, E. Deep learning for computer vision: A brief review. Comput. Intell. Neurosci. 2018, 2018, 7068349. [Google Scholar] [CrossRef] [PubMed]
- Chai, J.; Zeng, H.; Li, A.; Ngai, E.W. Deep learning in computer vision: A critical review of emerging techniques and application scenarios. Mach. Learn. Appl. 2021, 6, 100134. [Google Scholar] [CrossRef]
- O’Mahony, N.; Campbell, S.; Carvalho, A.; Harapanahalli, S.; Hernandez, G.V.; Krpalkova, L.; Riordan, D.; Walsh, J. Deep learning vs. traditional computer vision. In Advances in Computer Vision, CVC 2019; Advances in Intelligent Systems and Computing; Springer: Cham, Switzerland, 2020; Volume 943, pp. 128–144. [Google Scholar]
- LeCun, Y.; Boser, B.; Denker, J.; Henderson, D.; Howard, R.; Hubbard, W.; Jackel, L. Handwritten digit recognition with a back-propagation network. Adv. Neural Inf. Process. Syst. 1989, 2, 396–404. [Google Scholar]
- Gu, J.; Wang, Z.; Kuen, J.; Ma, L.; Shahroudy, A.; Shuai, B.; Liu, T.; Wang, X.; Wang, G.; Cai, J.; et al. Recent advances in convolutional neural networks. Pattern Recognit. 2018, 77, 354–377. [Google Scholar] [CrossRef]
- Karpathy, A.; Toderici, G.; Shetty, S.; Leung, T.; Sukthankar, R.; Li, F.-F. Large-scale video classification with convolutional neural networks. In Proceedings of the IEEE Conference on Computer Vision and Pattern Recognition, Columbus, OH, USA, 23–28 June 2014; pp. 1725–1732. [Google Scholar]
- Diba, A.; Fayyaz, M.; Sharma, V.; Karami, A.H.; Arzani, M.M.; Yousefzadeh, R.; Van Gool, L. Temporal 3d convnets: New architecture and transfer learning for video classification. arXiv 2017, arXiv:1711.08200. [Google Scholar]
- Bansod, S.; Nandedkar, A. Transfer learning for video anomaly detection. J. Intell. Fuzzy Syst. 2019, 36, 1967–1975. [Google Scholar] [CrossRef]
- Cauli, N.; Reforgiato Recupero, D. Survey on videos data augmentation for deep learning models. Future Internet 2022, 14, 93. [Google Scholar] [CrossRef]
- Polson, N.; Sokolov, V. Deep learning: Computational aspects. Wiley Interdiscip. Rev. Comput. Stat. 2020, 12, e1500. [Google Scholar] [CrossRef]
- Reuther, A.; Michaleas, P.; Jones, M.; Gadepally, V.; Samsi, S.; Kepner, J. Survey and benchmarking of machine learning accelerators. In Proceedings of the 2019 IEEE High Performance Extreme Computing Conference (HPEC), Waltham, MA, USA, 24–26 September 2019; pp. 1–9. [Google Scholar]
- Reuther, A.; Michaleas, P.; Jones, M.; Gadepally, V.; Samsi, S.; Kepner, J. Survey of machine learning accelerators. In Proceedings of the 2020 IEEE High Performance Extreme Computing Conference (HPEC), Waltham, MA, USA, 22–24 September 2020; pp. 1–12. [Google Scholar]
- Saiyeda, A.; Mir, M.A. Cloud computing for deep learning analytics: A survey of current trends and challenges. Int. J. Adv. Res. Comput. Sci. 2017, 8, 68. [Google Scholar]
- Jauro, F.; Chiroma, H.; Gital, A.Y.; Almutairi, M.; Shafi’i, M.A.; Abawajy, J.H. Deep learning architectures in emerging cloud computing architectures: Recent development, challenges and next research trend. Appl. Soft Comput. 2020, 96, 106582. [Google Scholar] [CrossRef]
- Elharrouss, O.; Almaadeed, N.; Al-Maadeed, S. A review of video surveillance systems. J. Vis. Commun. Image Represent. 2021, 77, 103116. [Google Scholar] [CrossRef]
- Xu, Z.; Liu, Y.; Mei, L.; Hu, C.; Chen, L. Semantic based representing and organizing surveillance big data using video structural description technology. J. Syst. Softw. 2015, 102, 217–225. [Google Scholar] [CrossRef]
- Xu, Z.; Hu, C.; Mei, L. Video structured description technology based intelligence analysis of surveillance videos for public security applications. Multimed. Tools Appl. 2016, 75, 12155–12172. [Google Scholar] [CrossRef]
- El Harrouss, O.; Moujahid, D.; Tairi, H. Motion detection based on the combining of the background subtraction and spatial color information. In Proceedings of the 2015 Intelligent Systems and Computer Vision (ISCV), Fez, Morocco, 25–26 March 2015; pp. 1–4. [Google Scholar]
- Kim, M.; Suh, T. A Low-Cost Surveillance and Information System for Museum Using Visible Light Communication. IEEE Sens. J. 2019, 19, 1533–1541. [Google Scholar] [CrossRef]
- Viani, F.; Salucci, M.; Rocca, P.; Oliveri, G.; Massa, A. A multi-sensor WSN backbone for museum monitoring and surveillance. In Proceedings of the 2012 6th European Conference on Antennas and Propagation (EUCAP), Prague, Czech Republic, 26–30 March 2012; pp. 51–52. [Google Scholar] [CrossRef]
- Bahadori, S.; Iocchi, L. A stereo vision system for 3d reconstruction and semi-automatic surveillance of museum areas. In Proceedings of the AI*IA 2003: Advances in Artificial Intelligence, Pisa, Italy, 23–26 September 2003; Volume 147, p. 148. [Google Scholar]
- Ramachandra, B.; Jones, M.J.; Vatsavai, R.R. A Survey of Single-Scene Video Anomaly Detection. IEEE Trans. Pattern Anal. Mach. Intell. 2022, 44, 2293–2312. [Google Scholar] [CrossRef]
- Nayak, R.; Pati, U.C.; Das, S.K. A comprehensive review on deep learning-based methods for video anomaly detection. Image Vis. Comput. 2021, 106, 104078. [Google Scholar] [CrossRef]
- Li, S.; Liu, F.; Jiao, L. Self-Training Multi-Sequence Learning with Transformer for Weakly Supervised Video Anomaly Detection. Proc. AAAI Conf. Artif. Intell. 2022, 36, 1395–1403. [Google Scholar] [CrossRef]
- Doshi, K.; Yilmaz, Y. Rethinking video anomaly detection–A continual learning approach. In Proceedings of the IEEE/CVF Winter Conference on Applications of Computer Vision, Waikoloa, HI, USA, 3–8 January 2022; pp. 3961–3970. [Google Scholar]
- Chang, Y.; Tu, Z.; Xie, W.; Luo, B.; Zhang, S.; Sui, H.; Yuan, J. Video anomaly detection with spatio-temporal dissociation. Pattern Recognit. 2022, 122, 108213. [Google Scholar] [CrossRef]
- Hao, Y.; Li, J.; Wang, N.; Wang, X.; Gao, X. Spatiotemporal consistency-enhanced network for video anomaly detection. Pattern Recognit. 2022, 121, 108232. [Google Scholar] [CrossRef]
- Tran, D.; Bourdev, L.; Fergus, R.; Torresani, L.; Paluri, M. Learning spatiotemporal features with 3d convolutional networks. In Proceedings of the IEEE International Conference on Computer Vision, Santiago, Chile, 7–13 December 2015; pp. 4489–4497. [Google Scholar]
- Carreira, J.; Zisserman, A. Quo vadis, action recognition? A new model and the kinetics dataset. In Proceedings of the IEEE Conference on Computer Vision and Pattern Recognition, Honolulu, HI, USA, 21–26 July 2017; pp. 6299–6308. [Google Scholar]
- Tran, D.; Wang, H.; Torresani, L.; Feiszli, M. Video classification with channel-separated convolutional networks. In Proceedings of the IEEE/CVF International Conference on Computer Vision, Seoul, Republic of Korea, 27 October–2 November 2019; pp. 5552–5561. [Google Scholar]
- Yang, C.; Xu, Y.; Shi, J.; Dai, B.; Zhou, B. Temporal pyramid network for action recognition. In Proceedings of the IEEE/CVF Conference on Computer Vision and Pattern Recognition, Seattle, WA, USA, 13–19 June 2020; pp. 591–600. [Google Scholar]
- Berroukham, A.; Housni, K.; Lahraichi, M.; Boulfrifi, I. Deep learning-based methods for anomaly detection in video surveillance: A review. Bull. Electr. Eng. Inform. 2023, 12, 314–327. [Google Scholar] [CrossRef]
- Hasan, M.; Choi, J.; Neumann, J.; Roy-Chowdhury, A.K.; Davis, L.S. Learning temporal regularity in video sequences. In Proceedings of the IEEE Conference on Computer Vision and Pattern Recognition, Las Vegas, NV, USA, 27–30 June 2016; pp. 733–742. [Google Scholar]
- Sabokrou, M.; Fathy, M.; Hoseini, M. Video anomaly detection and localisation based on the sparsity and reconstruction error of auto-encoder. Electron. Lett. 2016, 52, 1122–1124. [Google Scholar] [CrossRef]
- Liu, W.; Luo, W.; Lian, D.; Gao, S. Future frame prediction for anomaly detection–a new baseline. In Proceedings of the IEEE Conference on Computer Vision and Pattern Recognition, Salt Lake City, UT, USA, 18–23 June 2018; pp. 6536–6545. [Google Scholar]
- Medel, J.R.; Savakis, A. Anomaly detection in video using predictive convolutional long short-term memory networks. arXiv 2016, arXiv:1612.00390. [Google Scholar]
- Sabokrou, M.; Fayyaz, M.; Fathy, M.; Moayed, Z.; Klette, R. Deep-anomaly: Fully convolutional neural network for fast anomaly detection in crowded scenes. Comput. Vis. Image Underst. 2018, 172, 88–97. [Google Scholar] [CrossRef]
- Sultani, W.; Chen, C.; Shah, M. Real-world anomaly detection in surveillance videos. In Proceedings of the IEEE Conference on Computer Vision and Pattern Recognition, Salt Lake City, UT, USA, 18–23 June 2018; pp. 6479–6488. [Google Scholar]
- Xu, D.; Yan, Y.; Ricci, E.; Sebe, N. Detecting anomalous events in videos by learning deep representations of appearance and motion. Comput. Vis. Image Underst. 2017, 156, 117–127. [Google Scholar] [CrossRef]
- Carreira, J.; Noland, E.; Hillier, C.; Zisserman, A. A Short Note on the Kinetics-700 Human Action Dataset. arXiv 2019, arXiv:1907.06987. [Google Scholar]
- Alahi, A.; Goel, K.; Ramanathan, V.; Robicquet, A.; Li, F.-F.; Savarese, S. Social lstm: Human trajectory prediction in crowded spaces. In Proceedings of the IEEE Conference on Computer Vision and Pattern Recognition, Las Vegas, NV, USA, 27–30 June 2016; pp. 961–971. [Google Scholar]
- Zhao, Y.; Chen, Q.; Cao, W.; Yang, J.; Xiong, J.; Gui, G. Deep learning for risk detection and trajectory tracking at construction sites. IEEE Access 2019, 7, 30905–30912. [Google Scholar] [CrossRef]
- Redmon, J.; Farhadi, A. Yolov3: An incremental improvement. arXiv 2018, arXiv:1804.02767. [Google Scholar]
- Kalman, R.E. A new approach to linear filtering and prediction problems. J. Basic Eng. Mar. 1960, 82, 35–45. [Google Scholar] [CrossRef]
- Kuhn, H.W. The Hungarian method for the assignment problem. Nav. Res. Logist. Q. 1955, 2, 83–97. [Google Scholar] [CrossRef]
- Oikonomopoulos, A.; Patras, I.; Pantic, M.; Paragios, N. Trajectory-based representation of human actions. In Artifical Intelligence for Human Computing: ICMI 2006 and IJCAI 2007 International Workshops, Banff, Canada, November 3, 2006, Hyderabad, India, January 6, 2007, Revised Seleced and Invited Papers; Springer: Berlin/Heidelberg, Germany, 2007; pp. 133–154. [Google Scholar]
- Ahmed, M.; Seraj, R.; Islam, S.M.S. The k-means algorithm: A comprehensive survey and performance evaluation. Electronics 2020, 9, 1295. [Google Scholar] [CrossRef]
- Khan, K.; Rehman, S.U.; Aziz, K.; Fong, S.; Sarasvady, S. DBSCAN: Past, present and future. In Proceedings of the Fifth International Conference on the Applications of Digital Information and Web Technologies (ICADIWT 2014), Chennai, India, 17–19 February 2014; pp. 232–238. [Google Scholar]
- Bach, F.; Jordan, M. Learning spectral clustering. Adv. Neural Inf. Process. Syst. 2003, 16, 305–312. [Google Scholar]
- Nielsen, F.; Nielsen, F. Hierarchical clustering. InIntroduction to HPC with MPI for Data Science; Springer: Cham, Switzerland, 2016; pp. 195–211. [Google Scholar]
- He, K.; Zhang, X.; Ren, S.; Sun, J. Deep residual learning for image recognition. In Proceedings of the IEEE Conference on Computer Vision and Pattern Recognition, Las Vegas, NV, USA, 27–30 June 2016; pp. 770–778. [Google Scholar]
- Simonyan, K.; Zisserman, A. Very Deep Convolutional Networks for Large-Scale Image Recognition. arXiv 2014, arXiv:1409.1556. [Google Scholar]
- Chollet, F. Xception: Deep learning with depthwise separable convolutions. In Proceedings of the IEEE Conference on Computer Vision and Pattern Recognition, Honolulu, HI, USA, 21–26 July 2017; pp. 1251–1258. [Google Scholar]
- Howard, A.G.; Zhu, M.; Chen, B.; Kalenichenko, D.; Wang, W.; Weyand, T.; Andreetto, M.; Adam, H. Mobilenets: Efficient convolutional neural networks for mobile vision applications. arXiv 2017, arXiv:1704.04861. [Google Scholar]
- Zhang, X.; Zhou, X.; Lin, M.; Sun, J. Shufflenet: An extremely efficient convolutional neural network for mobile devices. In Proceedings of the IEEE Conference on Computer Vision and Pattern Recognition, Salt Lake City, UT, USA, 18–23 June 2018; pp. 6848–6856. [Google Scholar]
- Szeliski, R. Computer Vision: Algorithms and Applications; Springer Nature: Berlin, Germany, 2022. [Google Scholar]
- Zivkovic, Z. Improved adaptive Gaussian mixture model for background subtraction. In Proceedings of the 17th International Conference on Pattern Recognition, 2004, ICPR 2004, Cambridge, UK, 26–26 August 2004; Volume 2, pp. 28–31. [Google Scholar]
- Lee, D.S. Effective Gaussian mixture learning for video background subtraction. IEEE Trans. Pattern Anal. Mach. Intell. 2005, 27, 827–832. [Google Scholar] [PubMed]
- Jocher, G.; Chaurasia, A.; Qiu, J. Ultralytics YOLOv8. 2023. Available online: https://github.com/ultralytics/ultralytics (accessed on 5 February 2024).
- Lin, T.Y.; Maire, M.; Belongie, S.; Hays, J.; Perona, P.; Ramanan, D.; Dollár, P.; Zitnick, C.L. Microsoft coco: Common objects in context. In Proceedings of the Computer Vision–ECCV 2014: 13th European Conference, Zurich, Switzerland, 6–12 September 2014; pp. 740–755. [Google Scholar]
- Terven, J.; Cordova-Esparza, D. A comprehensive review of YOLO: From YOLOv1 to YOLOv8 and beyond. arXiv 2023, arXiv:2304.00501. [Google Scholar]
- Aboah, A.; Wang, B.; Bagci, U.; Adu-Gyamfi, Y. Real-time multi-class helmet violation detection using few-shot data sampling technique and yolov8. In Proceedings of the IEEE/CVF Conference on Computer Vision and Pattern Recognition, Vancouver, BC, Canada, 17–24 June 2023; pp. 5349–5357. [Google Scholar]
- Saeed, S.M.; Akbar, H.; Nawaz, T.; Elahi, H.; Khan, U.S. Body-Pose-Guided Action Recognition with Convolutional Long Short-Term Memory (LSTM) in Aerial Videos. Appl. Sci. 2023, 13, 9384. [Google Scholar] [CrossRef]
- Elbarrany, A.M.; Mohialdin, A.; Atia, A. The Use of Pose Estimation for Abnormal Behavior Analysis in Poultry Farms. In Proceedings of the 2023 5th Novel Intelligent and Leading Emerging Sciences Conference (NILES), Giza, Egypt, 21–23 October 2023; pp. 33–36. [Google Scholar]
- Aharon, N.; Orfaig, R.; Bobrovsky, B.Z. BoT-SORT: Robust associations multi-pedestrian tracking. arXiv 2022, arXiv:2206.14651. [Google Scholar]
- MMAction2 Contributors. OpenMMLab’s Next Generation Video Understanding Toolbox and Benchmark. 2020. Available online: https://github.com/open-mmlab/mmaction2 (accessed on 5 February 2024).
- Kingma, D.; Ba, J. Adam: A Method for Stochastic Optimization. In Proceedings of the International Conference on Learning Representations (ICLR), San Diega, CA, USA, 7–9 May 2015. [Google Scholar]
- Ge, R.; Kakade, S.M.; Kidambi, R.; Netrapalli, P. The step decay schedule: A near optimal, geometrically decaying learning rate procedure for least squares. Adv. Neural Inf. Process. Syst. 2019, 32, 14977–14988. [Google Scholar]
- Lu, X.; Wang, W.; Ma, C.; Shen, J.; Shao, L.; Porikli, F. See More, Know More: Unsupervised Video Object Segmentation With Co-Attention Siamese Networks. In Proceedings of the IEEE Conference on Computer Vision and Pattern Recognition (CVPR), Long Beach, CA, USA, 15–20 June 2019. [Google Scholar]
- Lu, X.; Wang, W.; Shen, J.; Crandall, D.; Luo, J. Zero-Shot Video Object Segmentation with Co-Attention Siamese Networks. IEEE Trans. Pattern Anal. Mach. Intell. 2020, 44, 2228–2242. [Google Scholar] [CrossRef] [PubMed]
- Im, S.K.; Chan, K.H. Distributed Spatial Transformer for Object Tracking in Multi-Camera. In Proceedings of the 2023 25th International Conference on Advanced Communication Technology (ICACT), Pyeongchang, Republic of Korea, 19–22 February 2023; pp. 122–125. [Google Scholar]
- Chan, K.H.; Im, S.K.; Ian, V.K.; Chan, K.M.; Ke, W. Enhancement spatial transformer networks for text classification. In Proceedings of the 4th International Conference on Graphics and Signal Processing, Nagoya, Japan, 26–29 June 2020; pp. 5–10. [Google Scholar]
- Raisi, Z.; Younes, G.; Zelek, J. Arbitrary shape text detection using transformers. In Proceedings of the 2022 26th International Conference on Pattern Recognition (ICPR), Montreal, QC, Canada, 21–25 August 2022; pp. 3238–3245. [Google Scholar]


| Action | Anomaly | Priority |
|---|---|---|
| Touching an artwork | 🗸 | 1 |
| Beyond room limits | 🗸 | 2 |
| Anomaly interaction | 🗸 | 3 |
| Take a photo | 4 | |
| Walking | 5 | |
| Talking | 6 | |
| Sitting | 7 | |
| Nothing | 8 |
| Model | Optimizer | Balancing | acc@1 ↑ | MCA ↑ | ROCAUC ↑ |
|---|---|---|---|---|---|
| IRCSN | Adam | 68.6% | 55.2% | 95.1% | |
| IRCSN | SGD | 71.2% | 61.7% | 98.8% | |
| TPN | Adam | 45.6% | 30.8% | 68.4% | |
| TPN | SGD | 66.0% | 59.7% | 98.3% | |
| IRCSN | Adam | 🗸 | 59.0% | 58.1% | 84.4% |
| IRCSN | SGD | 🗸 | 57.4% | 51.1% | 88.73% |
| TPN | Adam | 🗸 | 27.9% | 25.4% | 88.2% |
| TPN | SGD | 🗸 | 57.4% | 56.8% | 88.7% |
| Model | Balancing | Augmentation | acc@1 ↑ | MCA ↑ | ROCAUC ↑ |
|---|---|---|---|---|---|
| IRCSN | Staged | 72.7% | 62.2% | 95.3% | |
| TPN | Staged | 70.7% | 63.1% | 94.1% | |
| IRCSN | 🗸 | Staged | 67.1% | 51.6% | 97.1% |
| TPN | 🗸 | Staged | 60.6% | 52.6% | 94.0% |
| IRCSN | Staged + augmented | 73.0% | 53.4% | 96.9% | |
| TPN | Staged + augmented | 72.1% | 66.9% | 95.1% | |
| IRCSN | 🗸 | Staged + augmented | 66.1% | 59.2% | 96.7% |
| TPN | 🗸 | Staged + augmented | 69.2% | 66.8% | 93.6% |
| MAE [m] ↓ | RMSE [m] ↓ | MaxAE [m] ↓ | STD [m] ↓ |
|---|---|---|---|
| 0.18 | 0.30 | 4.36 | 0.23 |
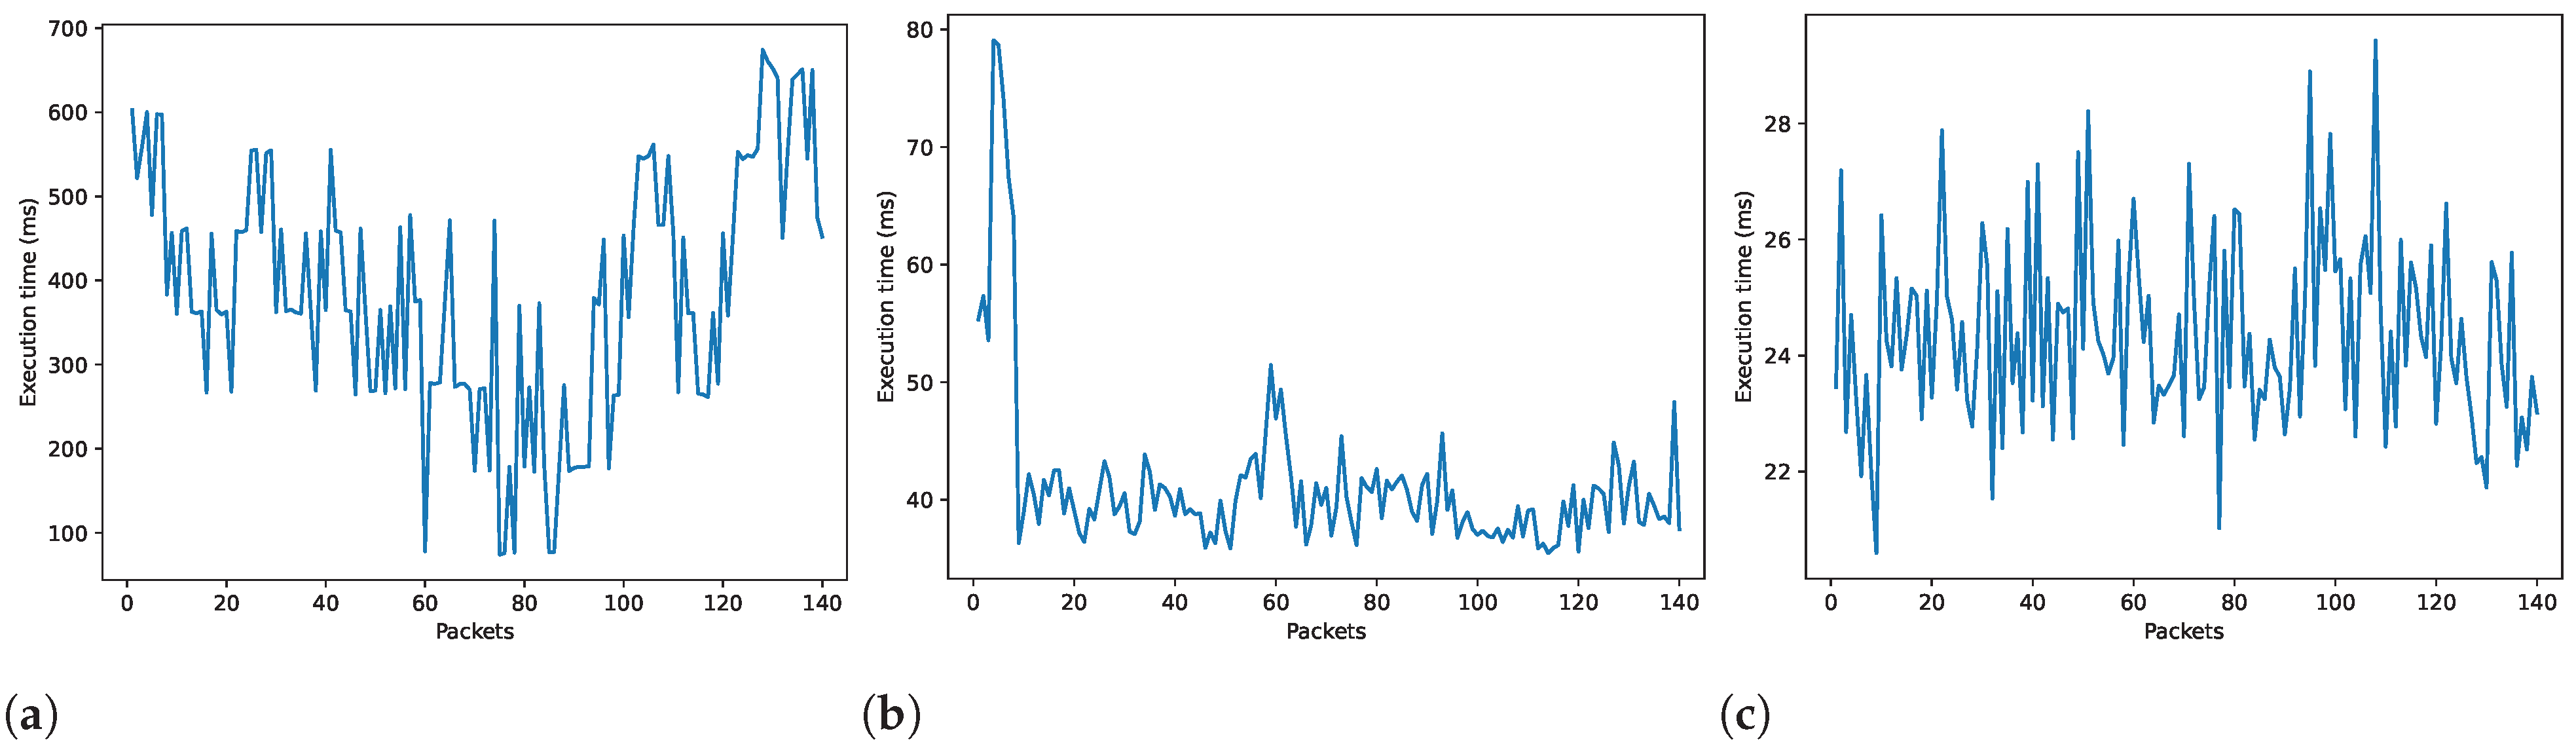
| Operation | Execution Time (ms) | |
|---|---|---|
| Mean | Std | |
| Action recognition | 386.72 | 145.75 |
| Person detection | 41.31 | 7.14 |
| Pose estimation | 24.36 | 1.61 |
Disclaimer/Publisher’s Note: The statements, opinions and data contained in all publications are solely those of the individual author(s) and contributor(s) and not of MDPI and/or the editor(s). MDPI and/or the editor(s) disclaim responsibility for any injury to people or property resulting from any ideas, methods, instructions or products referred to in the content. |
© 2024 by the authors. Licensee MDPI, Basel, Switzerland. This article is an open access article distributed under the terms and conditions of the Creative Commons Attribution (CC BY) license (https://creativecommons.org/licenses/by/4.0/).
Share and Cite
Di Maio, C.; Nunziati, G.; Mecocci, A. Deep-Learning-Based Action and Trajectory Analysis for Museum Security Videos. Electronics 2024, 13, 1194. https://doi.org/10.3390/electronics13071194
Di Maio C, Nunziati G, Mecocci A. Deep-Learning-Based Action and Trajectory Analysis for Museum Security Videos. Electronics. 2024; 13(7):1194. https://doi.org/10.3390/electronics13071194
Chicago/Turabian StyleDi Maio, Christian, Giacomo Nunziati, and Alessandro Mecocci. 2024. "Deep-Learning-Based Action and Trajectory Analysis for Museum Security Videos" Electronics 13, no. 7: 1194. https://doi.org/10.3390/electronics13071194