Article

Self-Supervised Clustering Models Based on BYOL Network Structure

1
Shandong Provincial Key Laboratory of Network-Based Intelligent Computing, University of Jinan, Jinan 250022, China
2
Quancheng Laboratory, Jinan 250103, China
*
Authors to whom correspondence should be addressed.
Electronics 2023, 12(23), 4723; https://doi.org/10.3390/electronics12234723
Submission received: 17 October 2023 / Revised: 18 November 2023 / Accepted: 19 November 2023 / Published: 21 November 2023
(This article belongs to the Special Issue Deep Learning for Data Mining: Theory, Methods, and Applications)

Abstract

:
Contrastive-based clustering models usually rely on a large number of negative pairs to capture uniform representations, which requires a large batch size and high computational complexity. In contrast, some self-supervised methods perform non-contrastive learning to capture discriminative representations only with positive pairs, but suffer from the collapse of clustering. To solve these issues, a novel end-to-end self-supervised clustering model is proposed in this paper. The basic self-supervised learning network is first modified, followed by the incorporation of a Softmax layer to obtain cluster assignments as data representation. Then, adversarial learning on the cluster assignments is integrated into the methods to further enhance discrimination across different clusters and mitigate the collapse between clusters. To further encourage clustering-oriented guidance, a new cluster-level discrimination is assembled to promote clustering performance by measuring the self-correlation between the learned cluster assignments. Experimental results on real-world datasets exhibit better performance of the proposed model compared with the existing deep clustering methods.

1. Introduction

As an effective machine learning technique, clustering plays an important role in data mining [1,2,3], statistical analysis [4,5,6], and pattern recognition [7,8,9]. It aims to partition the data into different clusters according to the similarity between the data samples [10]. Therefore, various clustering methods have been developed over the past decades to extract the inherent features and structures of the data [11,12]. In the current era of big data, more and more high-dimensional data pose huge challenges to traditional clustering due to insufficient representability. For this reason, some dimensionality reduction [13] and representation transformation [14] techniques have been widely studied to map the original data into a new feature space, where the data representation is easier to separate by the existing classifiers. Nevertheless, limited to their high computational complexity, the traditional data transformation methods [15,16,17] fail to process large-scale and high-dimensional data. Although some random feature [18] methods and random projection [19] methods can yield a low-dimensional representation and a better approximation of user-specified kernel, the representation ability of features learned from these shallow models is generally limited.
In recent decades, deep learning [20] based on neural networks has been widely studied to discover good representation of the data. Meanwhile, the optimization of the deep neural network along with unsupervised clustering has exhibited great promise and excellent clustering performance, which is referred to as deep clustering [21]. Most deep clustering methods can be categorized as either generative models [22] or discriminative models [23]. Generative models aim to learn the embedding representation or distribution of the original data through the generative process. The clustering then processes the learned distribution or representation in a simultaneous (end-to-end) or asynchronous fashion. Some of the prominent techniques that have a significant impact are deep clustering methods based on autoencoder (AE) [24], deep clustering methods based on variational autoencoder (VAE) [25], and deep clustering methods based on generative adversarial network (GAN) [26]. However, these clustering methods, which rely on generative models, necessitate complex data generation procedures, which can be computationally expensive and may not be necessary for both clustering and representation learning purposes.
Different from generative models, discriminative models, such as contrastive learning-based methods, remove the costly generation step and directly discriminate the representation by learning the decision boundary. As the most representative contrastive learning method, Simple Framework for Contrastive Learning of Representations (SimCLR) [27] exploits the representation between different views of samples, wherein the similarities between different views of one sample (positive pairs) are maximized and those between different samples (negative pairs) are minimized. Based on this idea, some two-step clustering models have been designed. Supervised Contrastive Learning for Pretrained Visual Representations (SCAN) [28] mines the nearest neighbors of each image as prior guidance to optimize the cluster network, while Semantic Pseudo-labeling for Image Clustering (SPICE) [29] and Robust learning for Unsupervised Clustering (RUC) [30] generate pseudo-labels via self-learning methods to guide the clustering. These methods employed a two-stage operation where the clustering and the representation learning were decoupled. They focus more on the optimization of the neural networks to achieve more discriminative representations but suffer from a lack of clustering-oriented guidance, which results in suboptimal clustering performance.
Recently, more contrastive learning-based models have been constructed to excavate representation and perform clustering in an end-to-end fashion. Among these methods, Contrastive Clustering (CC) [31] performs both instance-level contrastive learning for exploiting the discriminative representations and clustering-level contrastive learning for separating different clusters. Following this idea, Graph Contrastive Clustering (GCC) [32] proposes a graph Laplacian-based contrastive loss to enhance the discriminative and clustering-specific characteristics of features. To further improve the quality of learned representations, Cross-instance guided Contrastive Clustering (C3) [33] takes into account the cross-sample relationships, thereby increasing the number of positive pairs and reducing the impact of false negatives. Even though the contrastive models above yield excellent clustering results, they usually rely on a large number of negative pairs to capture the uniform representations, which requires a large batch size and high computational complexity. Moreover, different instances from the same cluster are regarded as negative pairs and wrongly pushed away, which may inevitably lead to the cluster collision issue.
Different from these traditional contrastive learning-based models, some self-supervised methods, such as Bootstrap Your Own Latent (BYOL) [34], perform non-contrastive learning to capture discriminative representations only with positive pairs. However, the absence of negative pairs in contrastive learning hinders the ability of self-supervised representation learning methods to achieve uniform representations across clusters, which may lead to the issue of the collapse of clustering [35], i.e., assigning all data samples into fewer clusters than desired. Therefore, it is crucial to introduce an effective clustering enhancement method to improve the quality of the clustering assignment.
To solve these issues, a novel end-to-end Self-supervised Clustering model based on BYOL network structure with Instance-level and Cluster-level discriminations (BSC-IC) is proposed in this paper to perform clustering and representation learning simultaneously only with positive pairs. Taking inspiration from the concept of “cluster assignments as representations” [36], we enhance the original BYOL network by incorporating a Softmax layer to convert representations into cluster assignments. Subsequently, we also integrate adversarial learning [37] into cluster assignments not only to improve discrimination among clusters but also to mitigate the issue of collapsed clusters. To mitigate the high interdependence between the target and online networks in BYOL, we propose a novel self-enhancement loss. This loss evaluates the similarity of cluster assignments among positive pairs within a mini-batch across the online network itself. To further enhance the clustering-oriented guidance. A new cluster-level discrimination is integrated into the discriminative network to promote clustering performance by measuring the self-correlation between the learned cluster assignments.
The rest of this paper is organized as follows. The related work is presented in Section 2. The contrastive clustering model with instance-level and cluster-level discrimination is designed in Section 3. Experiments are performed in Section 4. The ablation study and its analysis are provided in Section 5. Conclusions are given in Section 6.

2. Related Work

2.1. Contrastive Clustering

CC [31] is a contrastive learning-based clustering method that aims to discover meaningful groups or patterns in a given dataset by emphasizing the dissimilarity or contrast between data points. In CC, instance-level and cluster-level contrastive learning are respectively conducted in the row and column spaces by maximizing the similarities of positive pairs while minimizing those of negative ones. However, this method usually relies on a large number of negative pairs to capture the uniform representations, which requires a large batch size and high computational complexity.

2.2. Bootstrap Your Own Latent

BYOL [34] is a self-supervised deep learning method used for representation learning. It is designed to learn meaningful representations from unlabeled data, allowing the model to capture useful patterns and information without the need for negative samples. BYOL consists of two identical neural networks called the online network and the target network. From an augmented view of a data sample, BYOL trains the online network to predict the representation of the target network from a different augmented view of the same data sample.

3. BSC with Instance-Level and Cluster-Level Discriminations

The contrastive-based clustering models usually rely on a large number of negative pairs to capture uniform representations, which requires a large batch size and high computational complexity. In contrast, some self-supervised methods perform non-contrastive learning to capture discriminative representations with only positive pairs but suffer from the collapse of clustering. To solve these issues, a novel end-to-end Self-supervised Clustering model based on BYOL network structure with Instance-level and Cluster-level discriminations (BSC-IC) is designed in this section. 
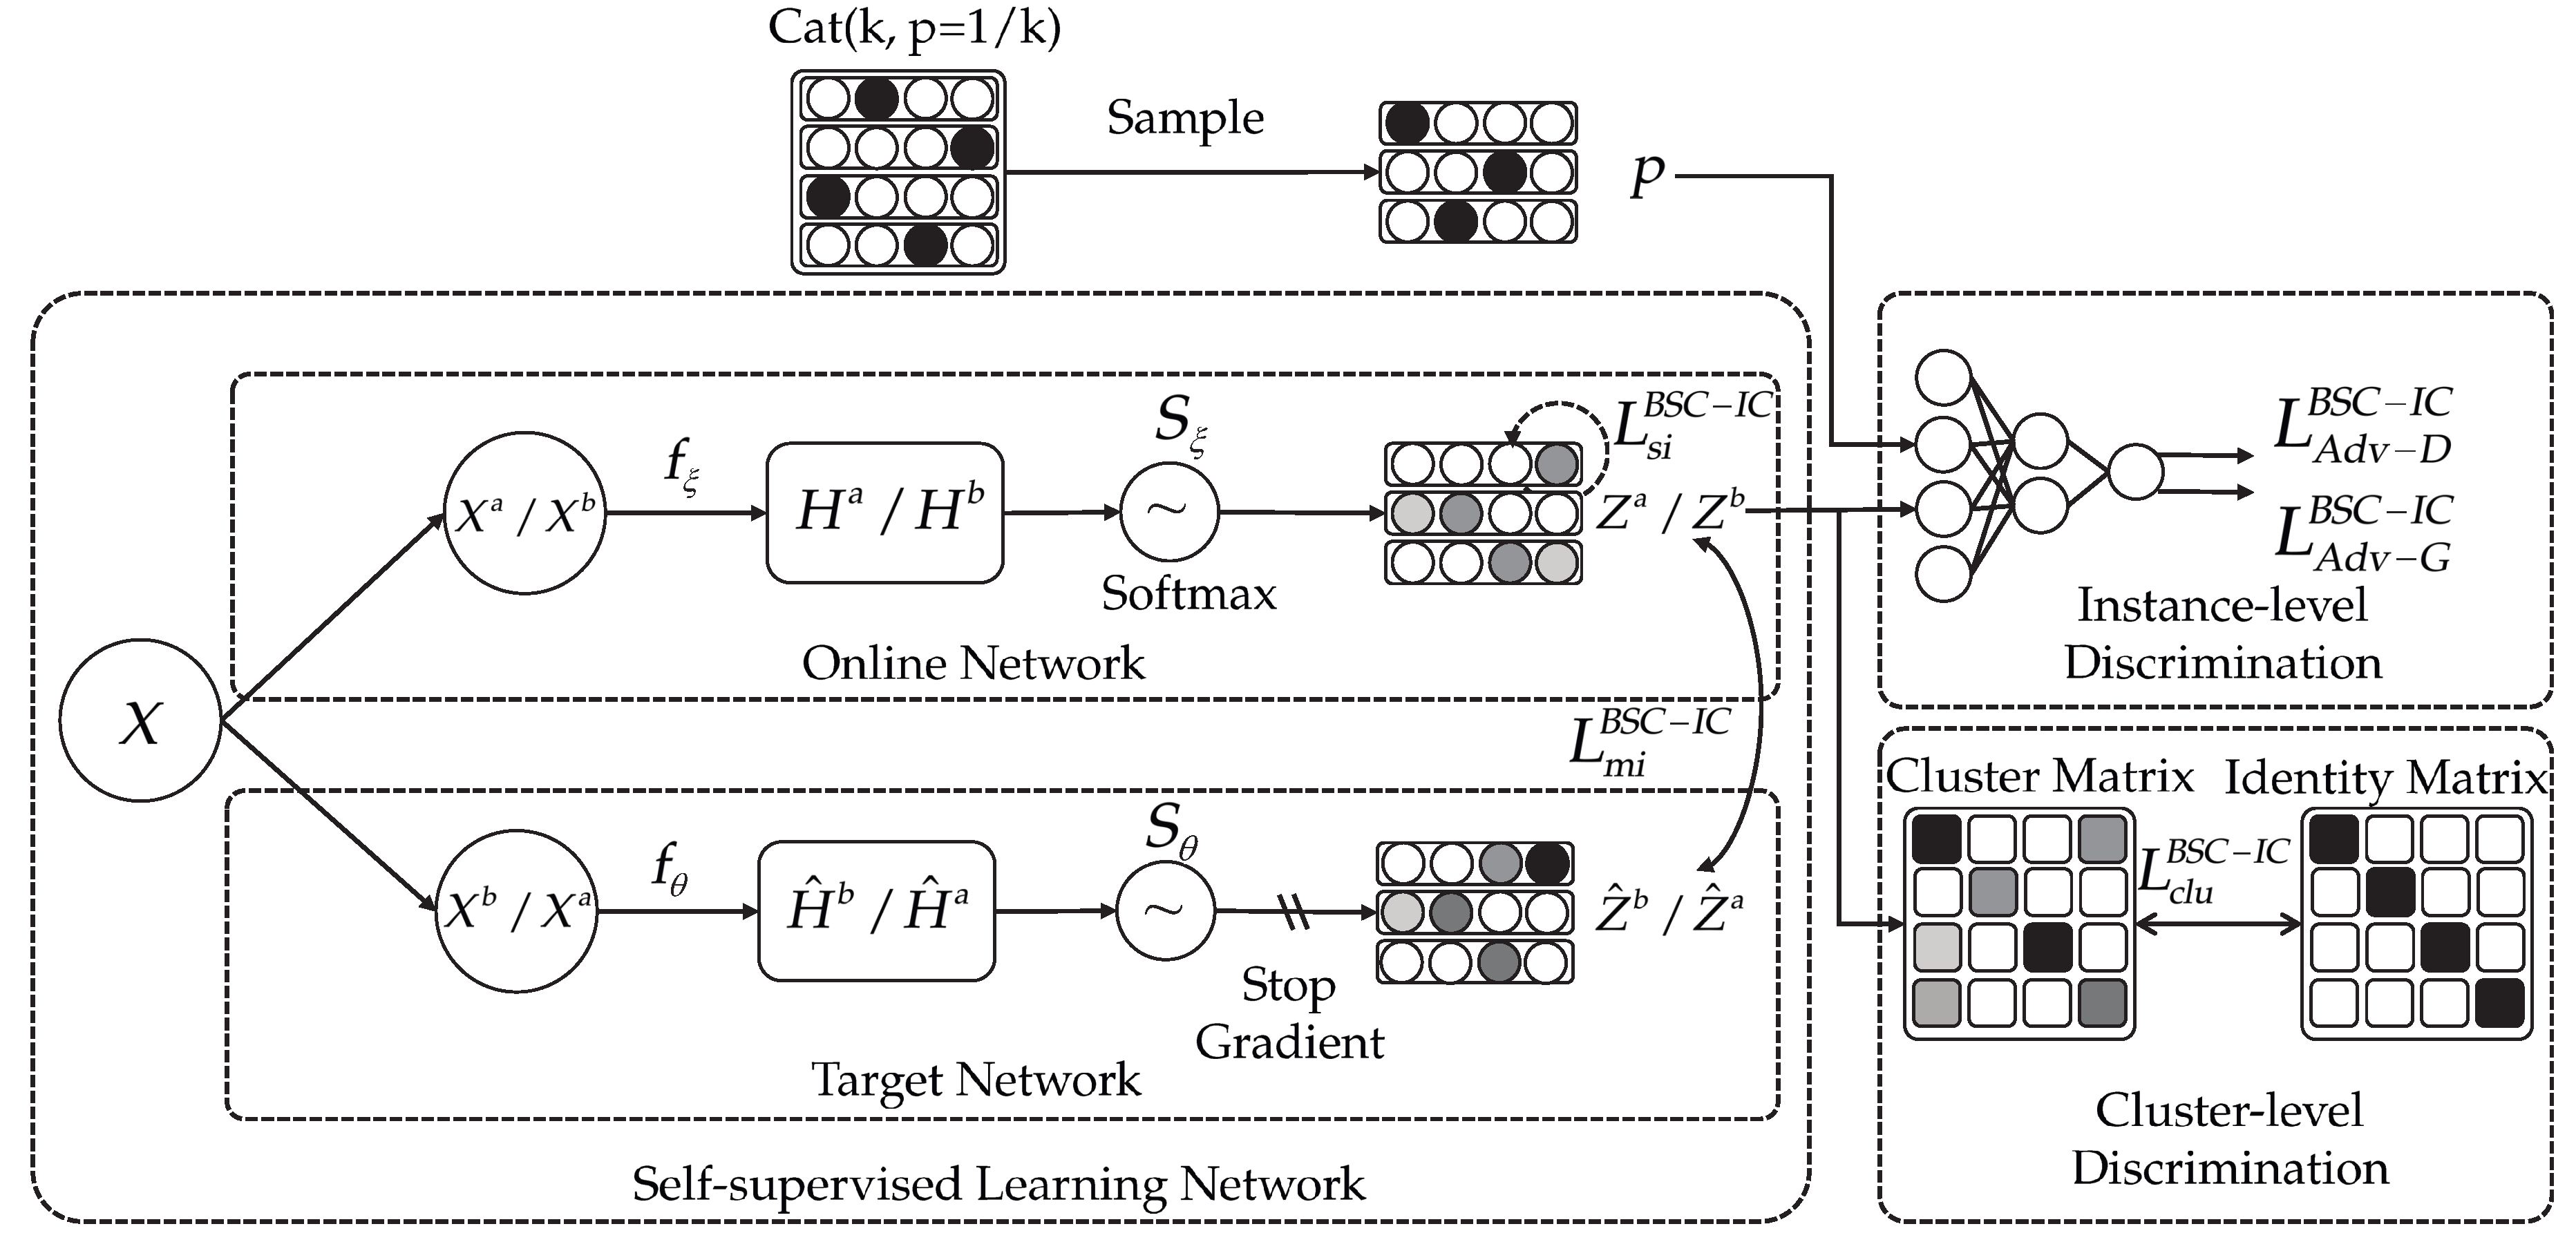
Figure 1 illustrates the framework of the BSC-IC model, which consists of three joint learning components: the self-supervised learning network, the instance-level discriminative network, and the cluster-level discriminative network. The self-supervised learning network adopts a similar structure to BYOL to capture the good cluster assignments of the data with only positive pairs, which includes an online-target network and a target network. A little different from BYOL, the Softmax layer is equipped to convert the representation to the cluster assignment. The novel instance-level discriminative network and cluster-level discriminative network are designed to provide clustering-oriented guidance for self-supervised learning.

3.1. The Self-Supervised Learning Network for Representation Capturing

The self-supervised learning network in BSC-IC is designed for representation learning, and contains an online network and a target network. The online network with parameters ξ is defined by an encoder, f ξ , to extract the representation features, which is followed by a Softmax layer, S ξ , to convert the representation to the cluster assignment of the input data. The target network has the same architecture as the online network but adopts a different set of parameters, θ .
In detail, given a set of data X = { x i 1 i N } R N × D in a mini-batch, N is the batch size and D is the dimension of the data. Data augmentations are first conducted to obtain two augmented views of the original data X a = { x i a 1 i N } and X b = { x i b 1 i N } as positive pairs. The first augmented view X a then feeds into the online network to outputs the cluster assignment Z a = { z i a 1 i N } R N × K . Simultaneously, the second augmented view X b is fed into the target network to generate the cluster assignment Z ^ b = { z ^ i b 1 i N } R N × K , where K is the number of clusters.
Self-supervised learning is then performed to maximize the similarity of positive pairs and realize the mutual optimization between the target and online networks. Unlike the cosine distance metric used in BYOL, the similarity of cluster assignments for positive pairs is measured using Kullback–Leibler (KL) divergence. The KL divergence is more suitable for capturing the difference between probability distributions. The loss for the mutual improvement in the self-supervised learning network is defined as (1).
L mi = K L ( Z a , Z ^ b )
In order to calculate the overall mutual-improvement loss of BSC-IC, we symmetrize the loss L mi by separately inputting X a into the target network and inputting X b into the online network to compute L ˜ m i = K L ( Z b , Z ^ a ) . Finally, the overall mutual-improvement loss of BSC-IC is denoted as (2).
L m i B S C I C = L m i + L ˜ m i = K L ( Z a , Z ^ b ) + K L ( Z b , Z ^ a )
The self-supervised learning network above is made up of two highly interdependent networks, in which the poor optimization of any network can deteriorate the whole structure. Particularly, the subsequent clustering may corrupt the quality of representation space and destroy the preservation of local structure. Moreover, to break the highly mutual interdependence across online and target networks, we define a novel loss, named the self-improvement loss, as (3) to evaluate the similarity of the cluster assignments between positive pairs of the online network itself.
L s i B S C I C = K L ( Z a , Z b )
where Z a and Z b indicate the cluster assignments obtained by the online network itself from two augmented views, respectively.

3.2. The Instance-Level Discriminative Network for Data Clustering

To alleviate the collapse of clustering, the instance-level discriminative network D ( · ) with parameters η in BSC-IC is constructed to provide clustering-oriented guidance for the self-supervised learning network.
Given the data X in a mini-batch, we input their two augmented views X a and X b to the online network, and obtain the corresponding cluster assignments Z a and Z b . Then, a one-hot-style prior distribution P C a t ( K , p = 1 / K ) is imposed on the learned cluster assignments Z (the alternative to Z a or Z b ), and the adversarial learning between Z and P is conducted to make Z closer to the form of one-hot, so as to enhance the discrimination of clusters and alleviate the collapse problem. Referring to the WGAN-GP method [38], the adversarial losses of the instance-level discriminative network for the generator L A d v - G B S C I C and the discriminator L A d v - D B S C I C are defined as (4) and (5), respectively.
L A d v - G B S C I C = E z Z D ( z ]
L A d v - D B S C I C = E z Z D z E p P D p + δ E r R r D r 2 1 2 w h e r e   r = ϵ p + ( 1 ϵ ) z   a n d   ϵ U 0 , 1
where r = ϵ p + ( 1 ϵ ) z subject to ϵ U 0 , 1 is a representation sampled uniformly along straight lines between the prior distribution P and the soft assignments Z, r D r 2 1 2 is the one-centered gradient penalty that limits the gradient of the instance-level discriminative network to be around 1, and δ is the gradient penalty coefficient.
Here, the adversarial loss for the generator L A d v - G B S C I C is designed to minimize the Wasserstein distance between the generated assignments and the one-hot distribution, which encourages the generator network to generate more sharp cluster assignments. In contrast, the adversarial loss for the discriminator L A d v - D B S C I C is formulated to maximize the Wasserstein distance between the generated assignments and the one-hot distribution. Both adversarial losses train the model through the competitive process between the generator and the discriminator.

3.3. Cluster-Level Discriminations Network for Clusters Enhancement

To further benefit from the strength of capturing clustering-oriented information, a new cluster-level discrimination is integrated into the discriminative network to promote clustering performance by measuring the self-correlation between the learned cluster assignments.
Specifically, given a set of data X = x i 1 i N in a mini-batch, the online network takes in two augmented views as input, denoted as X a and X b . Subsequently, the cluster assignments Z a R N × K and Z b R N × K are obtained, where N is the batch size and K is the number of clusters. Each column of the cluster assignments can be regarded as the representation of one cluster. Let y i a and y i b be the i-th column of Z a and Z b for 1 i K , and we combine y i a with y i b to form the same cluster pair ( y i a , y i b ) and leave the other K−1 pairs as ( y i a , y j b ) for j i to be different cluster pairs. A cluster-level similarity matrix C c l u = [ c i j c l u ] with size K is defined in the column space of the cluster assignments, where c i j c l u is measured by the cosine distance as (6)
c i j c l u = ( y i a ) T ( y j b ) y i a 2 y j b 2
Then, the cluster-level discriminative loss L c l u B S C I C is defined as (7).
L c l u B S C I C = i ( 1 c i i c l u ) 2 + λ c l u i j i ( c i j c l u ) 2
where the diagonal elements as c i i c l u are restricted to 1 to maximize the similarity between the same clusters, the non-diagonal elements as c i j c l u for i j are restricted to 0 to minimize the similarity between different clusters, and λ c l u is a positive constant to trade off two terms.

3.4. Training of the BSC-IC

Integrating the self-supervised learning network and the instance-level discriminative network, the final loss function of BSC-IC is defined as (8).
L B S C I C = L A d v G B S C I C + α c l u · L c l u B S C I C + α s i · L s i B S C I C + α m i · L m i B S C I C
The parameters α c l u , α s i , and α m i are used to balance the significance of different loss terms. We use the adaptive moment estimation (Adam) to optimize the parameters of both the self-supervised learning network and the instance-level discriminative network. Notably, the self-supervised learning network is optimized specifically for minimizing L B S C I C in respect of the online network only while keeping the target network unchanged. This is indicated by the stop-gradient operation in Figure 1. Consequently, Equation (9) is only used to update the parameters of the online network ξ .
ξ = ξ α L B S C I C ξ
where α is the learning rate. Drawing inspiration from BYOL, the target network’s parameters θ are updated using a weighted moving average of the online parameters ξ . This update process can be performed using Equation (10).
θ τ θ + ( 1 τ ) ξ
where τ [ 0 , 1 ] represent the target decay rate that controls the moving rate of parameters updating.
Similar to the online network, Equation (11) is employed to update the parameters of the instance-level discriminative network η . And the overall algorithm of BSC-IC is presented in Algorithm 1.
η = η α L A d v - D B S C I C η
 Algorithm 1 BSC-IC
 Input: 
Input data X, the batch size N, the number of clusters K, the maximum iterations
 
       M a x I t e r , the hyperparameters α m i , α s i and α c l u .
 
for epoch { 0 , 1 , , M a x I t e r }  do
 
   for each batch do
 
      Calculate the mutual-improvement loss L m i B S C I C by (2), the self-improvement loss
 
       L s i B S C I C by (3), and the instance-level discriminative losses L A d v - G B S C I C by (4) and
 
       L A d v - D B S C I C by (5), the cluster-level discriminative loss L c l u B S C I C by Equation (7);
 
      Calculate the self-supervised learning network loss L B S C I C by (8);
 
      Update the parameter of online network ξ by (9);
 
      Update the parameter of target network θ by (10);
 
      Update the parameter of discriminative network η by (11);
 
   end for
 
end for
  Output: 
The online network as clustering network.

4. Experiments

In this section, we perform experiments on six well-known real-world datasets to verify the efficiency of the presented model. All the datasets, methods of comparison, evaluation metrics, implementation details, and experimental results are elaborated.

4.1. Datasets, Methods in Comparison, and Evaluation Metrics

For our evaluation, we assess the effectiveness of the proposed method using six image datasets that are divided into two distinct categories. The first category consists of low-detailed grayscale images like Fashion-MNIST and MNIST. Meanwhile, the second category includes high-detailed color images, such as ImageNet-10, CIFAR-10, CIFAR-100, and Tiny-ImageNet. Table 1 provides a concise description of these datasets.
Twenty-two mainstream clustering methods as the baseline are adopted for the comparative analysis, including traditional distance-based clustering methods, like K-means [39], SC [40], AC [41], and NMF [42]; deep generative clustering methods, such as AE [43], DEC [44], JULE [45], DEPICT [46], DAC [47], VAE [48], and GAN [37]; and contrastive-based clustering models, such as IIC [49], BYOL [34], DCCM [50], DCCS [51], DHOG [52], GATCluster [53], DRC [54], PICA [55], CC [31], GCC [32], and C3 [33]. It is important to mention that clustering results for the NMF, SC, AE, GAN, VAE, and BYOL methods are obtained by applying k-means on the extracted image features.
Three metrics, i.e., the clustering accuracy (ACC), the normalized mutual information (NMI), and the adjusted rand index (ARI), are utilized to evaluate the clustering performance of different algorithms. For all metrics, a higher value is better. All clustering algorithms are conducted on a computer with two Nvidia TITAN RTX 24G GPUs.

4.2. Implementation Details

Similar image augmentations as DCCS [51] and CC [31] are conducted first to obtain the augmented samples. For low-detailed grayscale image datasets, cropping and horizontal flipping are employed as the augmentation strategies. For high-detailed color image datasets, color distortion and grayscale conversion are incorporated. Specifically, the color distortion method alters various attributes of the image, including contrast, saturation, brightness, and hue, while the grayscale conversion step transforms the color image into a grayscale format.
ResNet-18 is employed to extract the representation for the self-supervised learning network of BSC-IC. A Softmax layer is used to convert the representation into the cluster assignment of data with a dimension of cluster number K. A three-layer fully connected network is utilized as the instance-level discriminative network to divide the data samples into different clusters, and the dimensions of various layers are set to K-1024-512-1.
The Adam optimizer with a learning rate of 0.0003 is adopted to simultaneously optimize the self-supervised learning network and the discriminative network. The moving average parameter τ in the self-supervised learning network is set to 0.99, the discriminative network’s gradient penalty coefficient δ is set to 10, and the default batch size N is set to 64. The BSC-IC model involves three control parameters, which are utilized to trade off the effects of different terms in the total loss function. The recommended values of various parameters on different datasets are listed in Table 2.
Table 3 lists the number of hyperparameters of different models. It can be seen that the proposed BSC-IC model has fewer hyperparameters compared with other models, which indicates a simpler model architecture and ease for parameter tuning in BSC-IC.

4.3. Experimental Results

The clustering results of the testing algorithms on six datasets in terms of ACC, NMI, and ARI are listed in Table 4, Table 5, and Table 6, separately, and reveal some interesting observations. The best results are shown in bold.
First and foremost, compared with the traditional distance-based clustering methods, like K-means, AC, NMF, and SC, all the deep clustering methods show obvious advantages. This emphasizes that deep clustering has the ability to enhance clustering performance by the capturing semantic information of samples through deep neural networks.
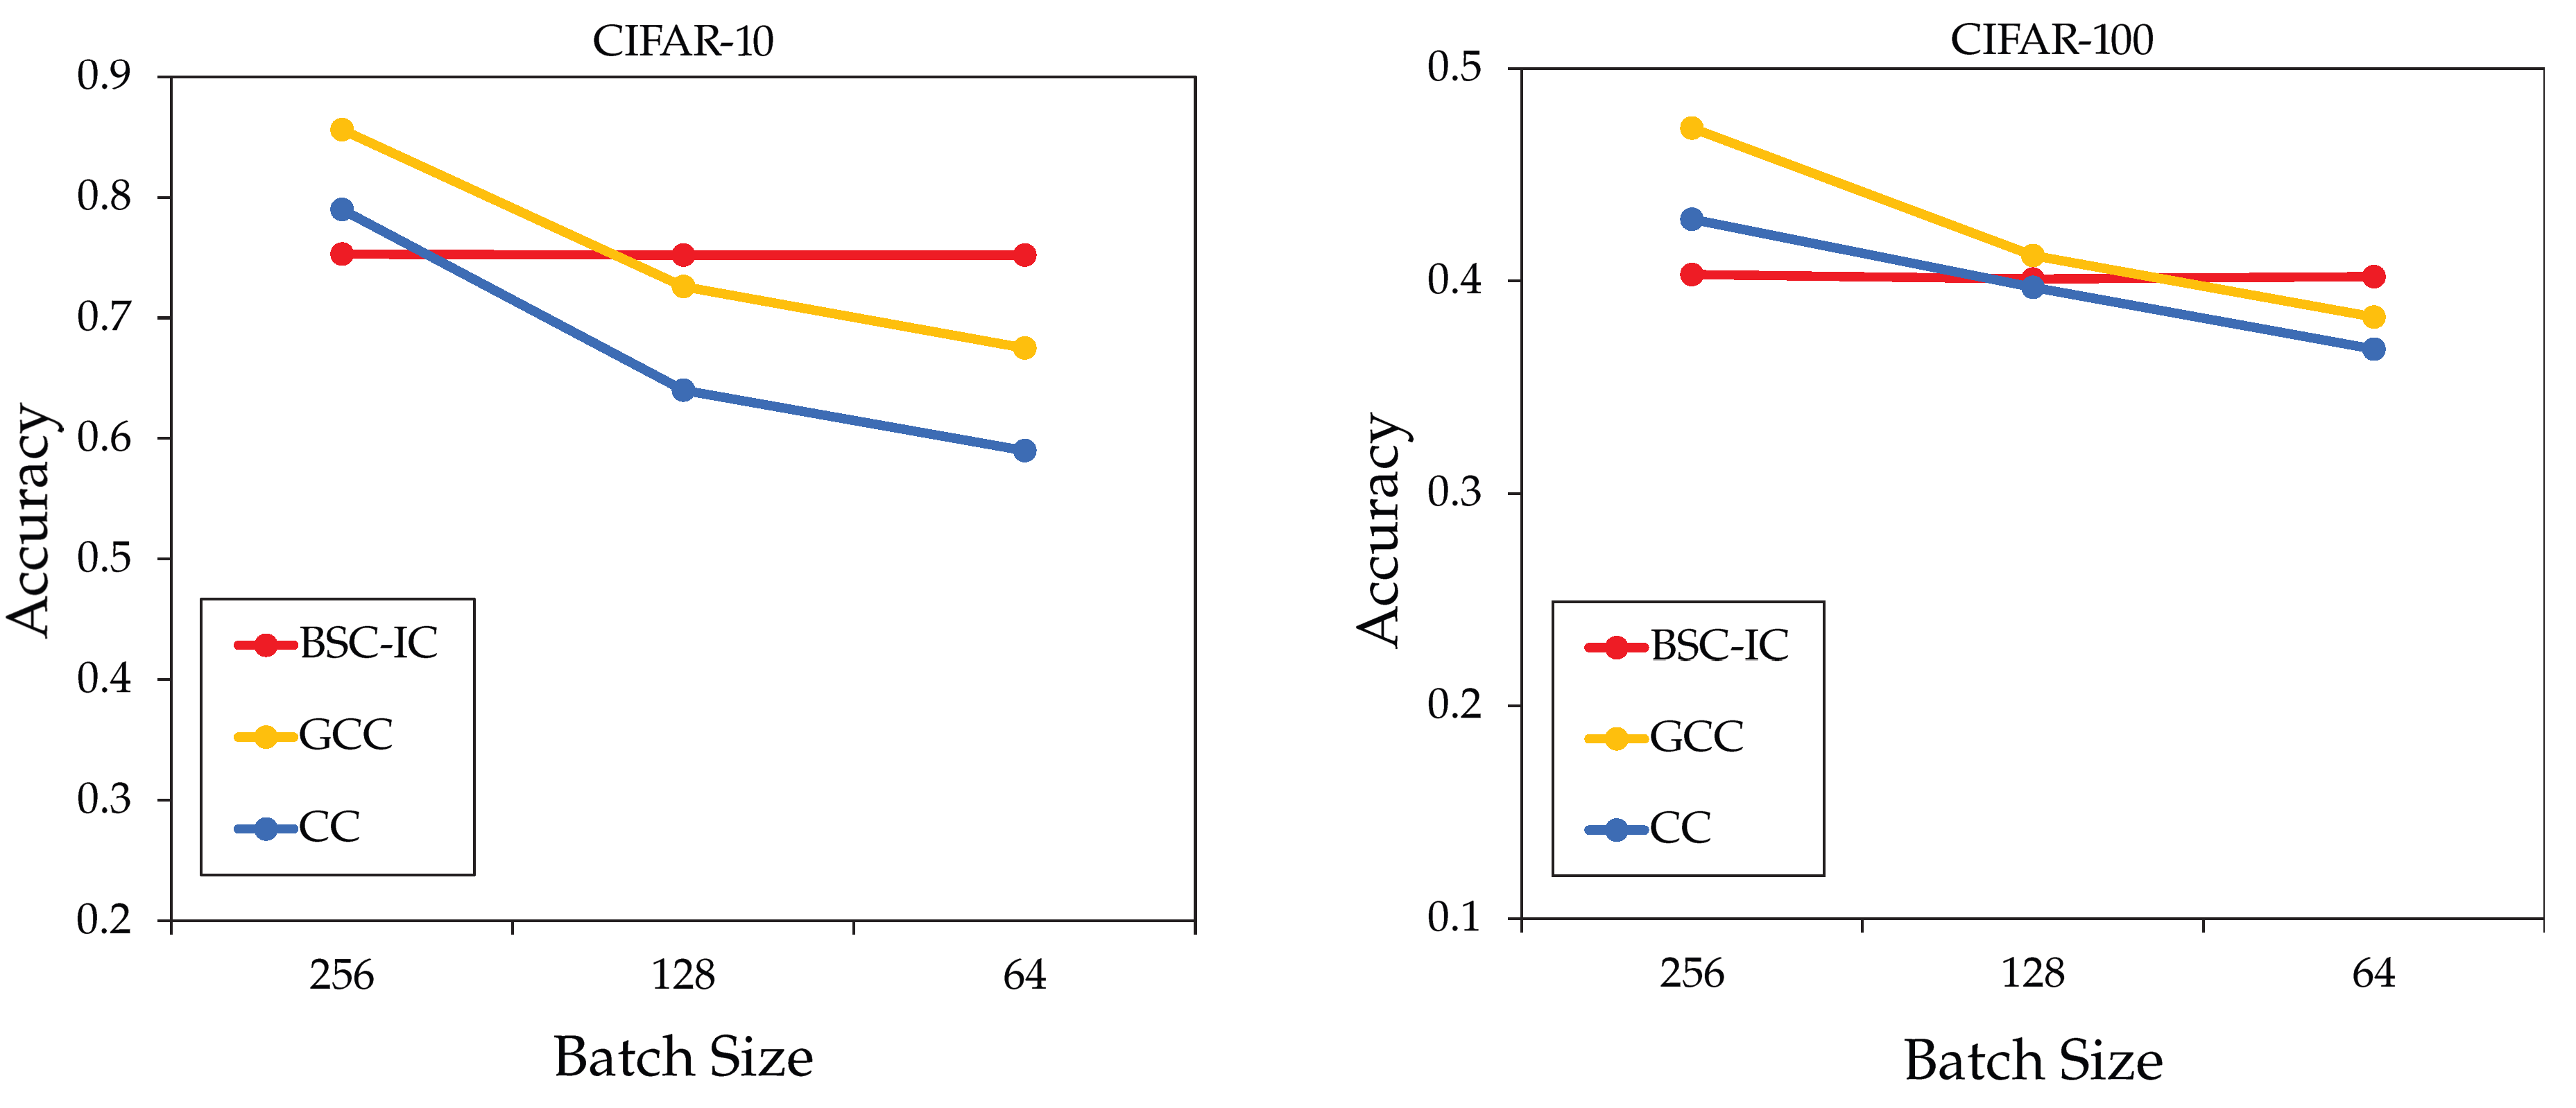
Secondly, BSC-IC significantly outperforms most deep clustering methods on all six datasets. This demonstrates the efficiency of self-supervised representation learning only with positive pairs in our model, which helps to extract the similarities and dissimilarities between different views of samples and capture important clustering-orientated information. It is worth noting that GCC achieves the best performance on the CIFAR-10 and CIFAR-100 datasets. But this relies on a large number of negative pairs to capture the uniform representations, which requires a large batch size, like 256, and high computational complexity. In our model, a smaller batch size, like 64, and only positive pairs can also achieve good clustering performance. Figure 2 shows the ACC curves obtained by CC, GCC, and our model with different batch sizes on the CIFAR-10 and CIFAR-100 datasets. It can be seen that the ACCs of CC and GCC drop sharply with the decrease in batch size. Specifically, when the batch size changes from 256 to 64, the ACC of GCC drops by approximately 18 percentage points on the CIFAR-10 dataset and 9 percentage points on the CIFAR-100 dataset. Similarly, the ACC of CC drops by about 20 percentage points on the CIFAR-10 dataset and 6 percentage points on the CIFAR-100 dataset. In contrast, our model yields a more stable ACC without the influence of the value of the batch size.

5. Ablation Study and Analysis

The ablation study and analysis are carried out in this section to further understand the effect of each term in the loss function, including the self-improvement term (denoted as SI), the mutual-improvement term (denoted as MI), the instance-level discriminative term (denoted as IL), and the cluster-level discriminative term (denoted as CL). The ablation study of BSC-IC on the MNIST and ImageNet-10 datasets is presented in Table 7. The check mark and the cross mark respectively represent the inclusion and exclusion of each terms.
In the discriminative network, the instance-level discriminative term focuses on optimizing the assignment of instances within clusters, while the cluster-level discriminative term aims to optimize the relationships between clusters. Together, they provide effective clustering guidance for self-supervised learning. From ➀ and ➁ in Table 7, it can be seen that the absence of any of them will lead to a suboptimal solution for cluster assignments. The most fatal is that the absence of both of them will lead to a collapse of the clustering as ➂ in Table 7.
In the self-supervised learning network, the self-improvement term aims to ensure the stability of the network structure, while the mutual-improvement term provides the alignment between positive pairs for the capture of uniform representations. Together, they provide effective optimization over the online and target networks for the capture of discriminative representations. From ➃ and ➄ in Table 7, it can be seen that the absence of any of them will lead to a decrease in cluster accuracy. Moreover, the absence of both terms as ➅ will disrupt the optimization over the online and target networks and prevent our method from performing clustering.

6. Conclusions

This paper develops a novel end-to-end self-supervised clustering model based on the BYOL network structure method to jointly seek high-quality representation and perform clustering. The basic self-supervised learning network is first modified, followed by the incorporation of a Softmax layer to capture the cluster assignments as data representation. The mutual-improvement loss and the self-improvement loss together provide effective optimization over online and target networks in BYOL for the capture of discriminative representations. Then, adversarial learning and self-correlation measuring are performed on the learned cluster assignments to promote clustering. The instance-level discriminative loss and the cluster-level discriminative loss together provide effective clustering guidance for self-supervised learning. Experimental results on real-world datasets show the efficiency of the proposed model.

Author Contributions

All the authors contributed extensively to the manuscript. X.C.: Contributed to algorithm development, programming, paper writing and revision, investigation, and methodology. J.Z.: Contributed to project administration, resources, supervision, and paper revisions and suggestions. Y.C.: Helped with formatting, resources, supervision, and review and editing of the paper. S.H.: Contributed to resources, supervision, and paper writing and revision. Y.W.: Contributed to resources and paper revisions and suggestions. T.D.: Contributed to resources and supervision. C.Y.: Contributed to resources, supervision, and helped with formatting. B.L.: Contributed to resources, supervision, and helped with grammar correction. All authors have read and agreed to the published version of the manuscript.

Funding

This work was supported in part by the National Natural Science Foundation of China under grants No. 62273164 and No. 62373164, the Key Research Project of Quancheng Laboratory, China, under grant No. QCLZD202303, and the Research Project of Provincial Laboratory of Shandong, China, under grant No. SYS202201.

Data Availability Statement

The data presented in this study are openly available in: https://github.com/FrostaQ31/BSC.

Conflicts of Interest

The authors declare no conflict of interest.

References

  1. Krishnapuram, R.; Joshi, A.; Nasraoui, O.; Yi, L. Low-complexity fuzzy relational clustering algorithms for web mining. IEEE Trans. Fuzzy Syst. 2001, 9, 595–607. [Google Scholar] [CrossRef]
  2. Berkhin, P. A survey of clustering data mining techniques. In Grouping Multidimensional Data: Recent Advances in Clustering; Springer: Berlin/Heidelberg, Germany, 2006; pp. 25–71. [Google Scholar]
  3. Gulati, H.; Singh, P.K. Clustering techniques in data mining: A comparison. In Proceedings of the 2015 2nd International Conference on Computing for Sustainable Global Development (INDIACom), New Delhi, India, 11–13 March 2015; pp. 410–415. [Google Scholar]
  4. Norberg, P.; Baugh, C.M.; Gaztanaga, E.; Croton, D.J. Statistical analysis of galaxy surveys—I. Robust error estimation for two-point clustering statistics. Mon. Not. R. Astron. Soc. 2009, 396, 19–38. [Google Scholar] [CrossRef]
  5. Dransfield, E.; Morrot, G.; Martin, J.F.; Ngapo, T. The application of a text clustering statistical analysis to aid the interpretation of focus group interviews. Food Qual. Prefer. 2004, 15, 477–488. [Google Scholar] [CrossRef]
  6. Srivastava, A.; Joshi, S.H.; Mio, W.; Liu, X. Statistical shape analysis: Clustering, learning, and testing. IEEE Trans. Pattern Anal. Mach. Intell. 2005, 27, 590–602. [Google Scholar] [CrossRef]
  7. Baraldi, A.; Blonda, P. A survey of fuzzy clustering algorithms for pattern recognition. I. IEEE Trans. Syst. Man Cybern. Part B 1999, 29, 778–785. [Google Scholar] [CrossRef]
  8. Diday, E.; Govaert, G.; Lechevallier, Y.; Sidi, J. Clustering in pattern recognition. In Proceedings of the Digital Image Processing: Proceedings of the NATO Advanced Study Institute, Bonas, France, 23 June–4 July 1980; Springer: Berlin/Heidelberg, Germany, 1981; pp. 19–58. [Google Scholar]
  9. Namratha, M.; Prajwala, T. A comprehensive overview of clustering algorithms in pattern recognition. IOSR J. Comput. Eng. 2012, 4, 23–30. [Google Scholar]
  10. Bicego, M.; Murino, V.; Figueiredo, M.A. Similarity-based clustering of sequences using hidden Markov models. In Proceedings of the International Workshop on Machine Learning and Data Mining in Pattern Recognition, Leipzig, Germany, 5–7 July 2003; Springer: Berlin/Heidelberg, Germany, 2003; pp. 86–95. [Google Scholar]
  11. Guyon, I.; Elisseeff, A. An introduction to feature extraction. In Feature Extraction: Foundations and Applications; Springer: Berlin/Heidelberg, Germany, 2006; pp. 1–25. [Google Scholar]
  12. Salahat, E.; Qasaimeh, M. Recent advances in features extraction and description algorithms: A comprehensive survey. In Proceedings of the 2017 IEEE International Conference on Industrial Technology (ICIT), Toronto, ON, Canada, 22–25 March 2017; pp. 1059–1063. [Google Scholar]
  13. Cohen, M.B.; Elder, S.; Musco, C.; Musco, C.; Persu, M. Dimensionality reduction for k-means clustering and low rank approximation. In Proceedings of the Forty-Seventh Annual ACM Symposium on Theory of Computing, Portland, OR, USA, 14–17 June 2015; pp. 163–172. [Google Scholar]
  14. Tian, D.P. A review on image feature extraction and representation techniques. Int. J. Multimed. Ubiquitous Eng. 2013, 8, 385–396. [Google Scholar]
  15. Bro, R.; Smilde, A.K. Principal component analysis. Anal. Methods 2014, 6, 2812–2831. [Google Scholar] [CrossRef]
  16. Hofmann, T.; Schölkopf, B.; Smola, A.J. Kernel methods in machine learning. Ann. Statist. 2008, 36, 1171–1220. [Google Scholar] [CrossRef]
  17. Saul, L.K.; Weinberger, K.Q.; Sha, F.; Ham, J.; Lee, D.D. Spectral methods for dimensionality reduction. Semi-Supervised Learn. 2006, 3. [Google Scholar]
  18. Wang, Y.; Dong, J.; Zhou, J.; Xu, G.; Chen, Y. Random feature map-based multiple kernel fuzzy clustering with all feature weights. Int. J. Fuzzy Syst. 2019, 21, 2132–2146. [Google Scholar] [CrossRef]
  19. Fern, X.Z.; Brodley, C.E. Random projection for high dimensional data clustering: A cluster ensemble approach. In Proceedings of the 20th International Conference on Machine Learning (ICML-03), Washington, DC, USA, 21–24 August 2003; pp. 186–193. [Google Scholar]
  20. Aljalbout, E.; Golkov, V.; Siddiqui, Y.; Strobel, M.; Cremers, D. Clustering with deep learning: Taxonomy and new methods. arXiv 2018, arXiv:1801.07648. [Google Scholar]
  21. Ren, Y.; Pu, J.; Yang, Z.; Xu, J.; Li, G.; Pu, X.; Yu, P.S.; He, L. Deep clustering: A comprehensive survey. arXiv 2022, arXiv:2210.04142. [Google Scholar]
  22. Zhong, S.; Ghosh, J. Generative model-based document clustering: A comparative study. Knowl. Inf. Syst. 2005, 8, 374–384. [Google Scholar] [CrossRef]
  23. Tu, Z. Probabilistic boosting-tree: Learning discriminative models for classification, recognition, and clustering. In Proceedings of the Tenth IEEE International Conference on Computer Vision (ICCV’05) Volume 1, Beijing, China, 17–21 October 2005; Volume 2, pp. 1589–1596. [Google Scholar]
  24. Yang, Z.; Xu, B.; Luo, W.; Chen, F. Autoencoder-based representation learning and its application in intelligent fault diagnosis: A review. Measurement 2022, 189, 110460. [Google Scholar] [CrossRef]
  25. Yang, L.; Cheung, N.M.; Li, J.; Fang, J. Deep clustering by gaussian mixture variational autoencoders with graph embedding. In Proceedings of the IEEE/CVF International Conference on Computer Vision, Seoul, Republic of Korea, 27 October–2 November 2019; pp. 6440–6449. [Google Scholar]
  26. Mukherjee, S.; Asnani, H.; Lin, E.; Kannan, S. Clustergan: Latent space clustering in generative adversarial networks. In Proceedings of the AAAI Conference on Artificial Intelligence, Honolulu, HI, USA, 27 January–1 February 2019; Volume 33, pp. 4610–4617. [Google Scholar]
  27. Chen, T.; Kornblith, S.; Norouzi, M.; Hinton, G. A simple framework for contrastive learning of visual representations. In Proceedings of the International Conference on Machine Learning, Vienna, Austria, 12–18 July 2020; pp. 1597–1607. [Google Scholar]
  28. Van Gansbeke, W.; Vandenhende, S.; Georgoulis, S.; Proesmans, M.; Van Gool, L. Scan: Learning to classify images without labels. In Proceedings of the European Conference on Computer Vision, Glasgow, UK, 23–28 August 2020; pp. 268–285. [Google Scholar]
  29. Niu, C.; Shan, H.; Wang, G. Spice: Semantic pseudo-labeling for image clustering. IEEE Trans. Image Process. 2022, 31, 7264–7278. [Google Scholar] [CrossRef]
  30. Park, S.; Han, S.; Kim, S.; Kim, D.; Park, S.; Hong, S.; Cha, M. Improving unsupervised image clustering with robust learning. In Proceedings of the IEEE/CVF Conference on Computer Vision and Pattern Recognition, Nashville, TN, USA, 20–25 June 2021; pp. 12278–12287. [Google Scholar]
  31. Li, Y.; Hu, P.; Liu, Z.; Peng, D.; Zhou, J.T.; Peng, X. Contrastive clustering. In Proceedings of the AAAI Conference on Artificial Intelligence, Vancouver, BC, Canada, 2–9 February 2021; Volume 35, pp. 8547–8555. [Google Scholar]
  32. Zhong, H.; Wu, J.; Chen, C.; Huang, J.; Deng, M.; Nie, L.; Lin, Z.; Hua, X.S. Graph contrastive clustering. In Proceedings of the IEEE/CVF International Conference on Computer Vision, Montreal, QC, Canada, 10–17 October 2021; pp. 9224–9233. [Google Scholar]
  33. Sadeghi, M.; Hojjati, H.; Armanfard, N. C3: Cross-instance guided contrastive clustering. arXiv 2022, arXiv:2211.07136. [Google Scholar]
  34. Grill, J.B.; Strub, F.; Altché, F.; Tallec, C.; Richemond, P.; Buchatskaya, E.; Doersch, C.; Avila Pires, B.; Guo, Z.; Gheshlaghi Azar, M.; et al. Bootstrap your own latent-a new approach to self-supervised learning. Adv. Neural Inf. Process. Syst. 2020, 33, 21271–21284. [Google Scholar]
  35. Oord, A.v.d.; Li, Y.; Vinyals, O. Representation learning with contrastive predictive coding. arXiv 2018, arXiv:1807.03748. [Google Scholar]
  36. Pedrycz, W.; Gomide, F. An Introduction to Fuzzy Sets: Analysis and Design; MIT Press: Cambridge, MA, USA, 1998. [Google Scholar]
  37. Goodfellow, I.; Pouget-Abadie, J.; Mirza, M.; Xu, B.; Warde-Farley, D.; Ozair, S.; Courville, A.; Bengio, Y. Generative adversarial networks. Commun. ACM 2020, 63, 139–144. [Google Scholar] [CrossRef]
  38. Gulrajani, I.; Ahmed, F.; Arjovsky, M.; Dumoulin, V.; Courville, A.C. Improved Training of Wasserstein GANs. In Proceedings of the Advances in Neural Information Processing Systems, Long Beach, CA, USA, 4–9 December 2017; Guyon, I., Luxburg, U.V., Bengio, S., Wallach, H., Fergus, R., Vishwanathan, S., Garnett, R., Eds.; Curran Associates, Inc.: Red Hook, NY, USA, 2017; Volume 30. [Google Scholar]
  39. MacQueen, J. Some methods for classification and analysis of multivariate observations. In Proceedings of the Fifth Berkeley Symposium on Mathematical Statistics and Probability, Oakland, CA, USA; 1967; Volume 1, pp. 281–297. [Google Scholar]
  40. Ng, A.; Jordan, M.; Weiss, Y. On spectral clustering: Analysis and an algorithm. Adv. Neural Inf. Process. Syst. 2001, 14. [Google Scholar]
  41. Gowda, K.C.; Krishna, G. Agglomerative clustering using the concept of mutual nearest neighbourhood. Pattern Recognit. 1978, 10, 105–112. [Google Scholar] [CrossRef]
  42. Cai, D.; He, X.; Wang, X.; Bao, H.; Han, J. Locality preserving nonnegative matrix factorization. In Proceedings of the Twenty-First International Joint Conference on Artificial Intelligence, Pasadena, CA, USA, 11–17 July 2009. [Google Scholar]
  43. Bengio, Y.; Lamblin, P.; Popovici, D.; Larochelle, H. Greedy layer-wise training of deep networks. Adv. Neural Inf. Process. Syst. 2006, 19. [Google Scholar]
  44. Xie, J.; Girshick, R.; Farhadi, A. Unsupervised deep embedding for clustering analysis. In Proceedings of the International Conference on Machine Learning, New York, NY, USA, 19–24 June 2016; pp. 478–487. [Google Scholar]
  45. Yang, J.; Parikh, D.; Batra, D. Joint unsupervised learning of deep representations and image clusters. In Proceedings of the IEEE Conference on Computer Vision and Pattern Recognition, Las Vegas, NV, USA, 27–30 June 2016; pp. 5147–5156. [Google Scholar]
  46. Ghasedi Dizaji, K.; Herandi, A.; Deng, C.; Cai, W.; Huang, H. Deep clustering via joint convolutional autoencoder embedding and relative entropy minimization. In Proceedings of the IEEE International Conference on Computer Vision, Venice, Italy, 22–29 October 2017; pp. 5736–5745. [Google Scholar]
  47. Chang, J.; Wang, L.; Meng, G.; Xiang, S.; Pan, C. Deep adaptive image clustering. In Proceedings of the IEEE International Conference on Computer Vision, Venice, Italy, 22–29 October 2017; pp. 5879–5887. [Google Scholar]
  48. Kingma, D.P.; Welling, M. Auto-encoding variational bayes. arXiv 2013, arXiv:1312.6114. [Google Scholar]
  49. Ji, X.; Henriques, J.F.; Vedaldi, A. Invariant information clustering for unsupervised image classification and segmentation. In Proceedings of the IEEE/CVF International Conference on Computer Vision, Seoul, Republic of Korea, 27 October–2 November 2019; pp. 9865–9874. [Google Scholar]
  50. Wu, J.; Long, K.; Wang, F.; Qian, C.; Li, C.; Lin, Z.; Zha, H. Deep comprehensive correlation mining for image clustering. In Proceedings of the IEEE/CVF International Conference on Computer Vision, Seoul, Republic of Korea, 27 October–2 November 2019; pp. 8150–8159. [Google Scholar]
  51. Zhao, J.; Lu, D.; Ma, K.; Zhang, Y.; Zheng, Y. Deep image clustering with category-style representation. In Proceedings of the Computer Vision–ECCV 2020: 16th European Conference, Glasgow, UK, 23–28 August 2020; Proceedings, Part XIV 16. Springer: Berlin/Heidelberg, Germany, 2020; pp. 54–70. [Google Scholar]
  52. Darlow, L.N.; Storkey, A. Dhog: Deep hierarchical object grouping. arXiv 2020, arXiv:2003.08821. [Google Scholar]
  53. Niu, C.; Zhang, J.; Wang, G.; Liang, J. Gatcluster: Self-supervised gaussian-attention network for image clustering. In Proceedings of the Computer Vision–ECCV 2020: 16th European Conference, Glasgow, UK, 23–28 August 2020; Proceedings, Part XXV 16. Springer: Berlin/Heidelberg, Germany, 2020; pp. 735–751. [Google Scholar]
  54. Zhong, H.; Chen, C.; Jin, Z.; Hua, X.S. Deep robust clustering by contrastive learning. arXiv 2020, arXiv:2008.03030. [Google Scholar]
  55. Huang, J.; Gong, S.; Zhu, X. Deep semantic clustering by partition confidence maximisation. In Proceedings of the IEEE/CVF Conference on Computer Vision and Pattern Recognition, Seattle, WA, USA, 13–19 June 2020; pp. 8849–8858. [Google Scholar]
Figure 1. The framework of the proposed BSC-IC model.
Electronics 12 04723 g001
Figure 2. The impact of batch size on accuracy in CIFAR-10 and CIFAR-100 datasets.
Electronics 12 04723 g002
Table 1. Brief description of datasets used in our experiments.
DatasetsSamples SizeClassesImage Size
MNIST70,0001028 × 28 × 1
Fashion-MNIST70,0001028 × 28 × 1
CIFAR-1060,0001032 × 32 × 3
CIFAR-10060,0002032 × 32 × 3
ImageNet-1013,0001096 × 96 × 3
Tiny-ImageNet100,00010064 × 64 × 3
Table 2. The recommended values of the parameters on different datasets.
ParameterMNIST, Fashion-MNIST CIFAR-10, CIFAR-100, ImageNet-10, Tiny-ImageNet
α s i 24
α m i 12
α c l u 11
Table 3. The number of hyperparameters on different methods.
MethodsNumber of Hyperparameters
BSC-IC3
DCCS4
DCCM4
GCC3
GatCluster4
Table 4. Clustering results of tested algorithms in term of ACC on six datasets.
MethodMNISTFashion-MNISTCIFAR-10ImageNet-10CIFAR-100Tiny-ImageNet
K-means [39]0.5720.4740.2290.2410.1300.025
SC [40]0.6960.5080.2470.2740.1360.022
AC [41]0.6950.5000.2280.2420.1380.027
NMF [42]0.5450.4340.1900.2300.1180.029
AE [43]0.8120.5630.3140.3170.1650.041
DEC [44]0.8430.5900.3010.3810.1850.037
JULE [45]0.9640.5630.2720.3000.1370.033
VAE [48]0.9450.5780.2910.3810.1520.036
DEPICT [46]0.9650.3920.2790.3630.137-
GAN [37]0.7360.5580.3150.3460.1510.039
DAC [47]0.9780.6150.5220.5270.2380.066
IIC [49]0.9920.6570.6170.7010.257-
BYOL [34]0.9850.7030.6580.8340.3340.053
DCCS [51]0.9890.7560.6560.7370.3150.106
DCCM [50]0.9820.7530.6230.7100.3270.108
DHOG [52]0.9540.6580.666-0.261-
GATCluster [53]0.9430.6180.6100.7390.281-
DRC [54]0.9610.6940.7270.8840.367-
PICA [55]0.9510.6830.6960.8700.3370.098
CC [31]0.9660.7080.7900.8930.4290.140
GCC [32]0.9870.7680.8560.9010.4720.138
C3  [33]0.9930.7730.8360.9430.4560.140
BSC-IC (ours)0.9960.7820.7530.9010.4030.157
Table 5. Clustering results of tested algorithms in term of NMI on six datasets.
MethodMNISTFashion-MNISTCIFAR-10ImageNet-10CIFAR-100Tiny-ImageNet
K-means [39]0.5000.5120.0870.1190.0840.065
SC [40]0.6630.5750.1030.1510.0900.063
AC [41]0.6090.5640.1050.1380.0980.069
NMF [42]0.6080.4250.0810.1320.0790.072
AE [43]0.7250.5610.2390.2100.1000.131
DEC [44]0.7720.6010.2570.2820.1360.115
JULE [45]0.9130.6080.1920.1750.1030.102
VAE [48]0.8760.6300.2450.2820.1080.113
DEPICT [46]0.9170.3920.2370.2420.094-
GAN [37]0.7630.5840.2650.2250.1200.127
DAC [47]0.9350.6320.3960.3940.1850.190
IIC [49]0.9790.6340.5130.5980.198-
BYOL [34]0.9680.6530.5480.7340.3050.103
DCCS [51]0.9700.7040.5690.6400.2780.219
DCCM [50]0.9510.6840.4960.6080.2850.224
DHOG [52]0.9210.6320.585-0.258-
GATCluster [53]0.8960.6140.4750.5940.215-
DRC [54]0.9230.6670.6210.8300.356-
PICA [55]0.8910.6530.5910.8020.3100.277
CC [31]0.9320.6750.7050.8590.4310.340
GCC  [32]0.9750.7090.7640.8420.4720.347
C3  [33]0.9780.7150.7430.9050.4350.335
BSC-IC (ours)0.9820.7230.6810.8610.3970.352
Table 6. Clustering results of tested algorithms in term of ARI on six datasets.
MethodMNISTFashion-MNISTCIFAR-10ImageNet-10CIFAR-100Tiny-ImageNet
K-means [39]0.3650.3480.0490.0570.0280.005
SC [40]0.5210.3820.0850.0760.0220.004
AC [41]0.4810.3710.0650.0670.0340.005
NMF [42]0.4300.3210.0340.0650.0260.005
AE [43]0.6130.3790.1690.1520.0480.007
DEC [44]0.7410.4460.1610.2030.0500.007
JULE [45]0.9270.4390.1380.1380.0330.006
VAE [48]0.8840.5420.1670.2030.0400.006
DEPICT [46]0.0940.3570.1710.1970.041-
GAN [37]0.8270.6310.1760.1570.0450.007
DAC [47]0.9490.5020.3060.3020.0880.017
IIC [49]0.9780.5240.4110.5490.096-
BYOL [34]0.9650.5850.4680.5540.1470.028
DCCS [51]0.9760.6230.4690.5600.1680.032
DCCM [50]0.9540.6020.4080.5550.1730.038
DHOG [52]0.9170.5340.492-0.118-
GATCluster [53]0.8870.5220.4020.5520.116-
DRC [54]0.9240.5510.5470.7980.208-
PICA [55]0.8540.5450.5120.7610.1710.040
CC [31]0.9310.5650.6370.8220.2660.071
GCC  [32]0.9670.6250.7280.8220.3050.075
C3  [33]0.9730.6290.7030.8600.2740.064
BSC-IC (ours)0.9790.6390.5920.8290.2320.085
Table 7. The results of the ablation study.
SI TermMI TermIL TermCL TermACC on MNISTACC on ImageNet-10
Baseline🗸🗸🗸🗸0.9960.901
🗸🗸×🗸0.9430.884
🗸🗸🗸×0.9950.853
🗸🗸××0.1120.104
×🗸🗸🗸0.9790.751
🗸×🗸🗸0.9650.745
× × 🗸🗸 0.105 0.103
Disclaimer/Publisher’s Note: The statements, opinions and data contained in all publications are solely those of the individual author(s) and contributor(s) and not of MDPI and/or the editor(s). MDPI and/or the editor(s) disclaim responsibility for any injury to people or property resulting from any ideas, methods, instructions or products referred to in the content.

