Article

Aircraft Behavior Recognition on Trajectory Data with a Multimodal Approach

1
Southwest China Institute of Electronic Technology, Chengdu 610036, China
2
School of Microelectronics and Communication Engineering, Chongqing University, Chongqing 400044, China
*
Author to whom correspondence should be addressed.
Electronics 2024, 13(2), 367; https://doi.org/10.3390/electronics13020367
Submission received: 20 December 2023 / Revised: 10 January 2024 / Accepted: 13 January 2024 / Published: 16 January 2024
(This article belongs to the Special Issue Advances in Data Science: Methods, Systems, and Applications)

Abstract

:
Moving traces are essential data for target detection and associated behavior recognition. Previous studies have used time–location sequences, route maps, or tracking videos to establish mathematical recognition models for behavior recognition. The multimodal approach has seldom been considered because of the limited modality of sensing data. With the rapid development of natural language processing and computer vision, the multimodal model has become a possible choice to process multisource data. In this study, we have proposed a mathematical model for aircraft behavior recognition with joint data manners. The feature abstraction, cross-modal fusion, and classification layers are included in the proposed model for obtaining multiscale features and analyzing multimanner information. Attention has been placed on providing self- and cross-relation assessments on the spatiotemporal and geographic data related to a moving object. We have adopted both a feedforward network and a softmax function to form the classifier. Moreover, we have enabled a modality-increasing phase, combining longitude and latitude sequences with related geographic maps to avoid monotonous data. We have collected an aircraft trajectory dataset of longitude and latitude sequences for experimental validation. We have demonstrated the excellent behavior recognition performance of the proposed model joint with the modality-increasing phase. As a result, our proposed methodology reached the highest accuracy of 95.8% among all the adopted methods, demonstrating the effectiveness and feasibility of trajectory-based behavior recognition.

1. Introduction

Behavior recognition, an essential task in target detection, is an analysis process to identify a target’s behaviors that appear within their actions. A moving vehicle (for example, an aircraft, ship, or automobile) is always assumed to be a target to be detected, and its moving paths have been widely used for abnormal detection [1], traffic management [2], and movement understanding [3].
Many researchers have worked on trajectory-based behavior recognition. A traditional behavior recognition process commonly includes two stages: data preprocessing and classification. The data preprocessing stage aims to transform irregular sequences into fixed-size features. Principal component analysis (PCA) [4], dynamic time warping (DTW) [5], and other linear projection methods [6] were adopted to process moving traces. Besides, curve approximation and reconstruction can realize length alignment effectively [7,8]. Moreover, trajectory segmentation was used to degenerate original trajectories to equal-length samples [9,10]. The second stage focuses on classification tasks. Nearest-neighbor (NN) methods combined with support vector machine (SVM) [11,12], fast NN [13], and Riemannian manifold [14] have been presented, introducing sample clustering to the classification models. Probability estimation by statistical models was introduced to behavior recognition [15,16]. The Dirichlet process and its variants have been highly concentrated [17,18]. Researchers have recently focused on a deep neural network as an end-to-end classifier. For one-dimensional time series, the recurrent neural network (RNN) [19] and long short-term memory (LSTM) [20,21] have been used to explore data correlation between different moments. For two-dimensional route maps, the convolutional neural network (CNN) structure has been adopted to extract image-level features [22,23,24] or assemble new feature vectors [25]. However, all the above methods were designed on single-modality data: one-dimensional series or two-dimensional images. These methods cannot conduct behavior identification on multimanner data from multiple sources.
In this study, we assume that the behavior recognition system can access the real-time position records of an airplane by ground-based radars and receive the public geo-map service via an internet connection. We attempt to establish a multimodal model for aircraft behavior recognition on both one-dimensional position sequences and two-dimensional geographic images. We have constructed a model with feature abstraction, cross-modal fusion, and classification layers to achieve this goal. In the feature abstraction layer, we have adopted the transformer and pyramid vision transformer (PVT) for multiscale feature abstraction. Then, we introduced the shuffle module and multiple attentions for heterogeneous feature merging in the cross-modal fusion layer. A fully connected multilayer network and a softmax sublayer were combined to form the classification layer. Meanwhile, we collected moving-trace sequences of aircraft behaviors with longitude and latitude coordinates and transformed these sequences into geographic images for multimodal data generation. Experimental results demonstrate the superiority of the proposed methodology (including the multimodal model and the modality-increasing phase) on time–position series. The academic contributions of this study are as follows:
(1)
Provide a sophisticated recognition model on two types of trajectory data.
(2)
Abstract multiscale sequence and image modality features in the proposed model.
(3)
Present a modality-increasing approach to longitude and latitude sequences.
The rest of this paper is organized as follows: Section 2 describes the details of our proposed methodology. Section 3 introduces the trajectory data we used. Experimental results and corresponding discussions are given in Section 4. Finally, we conclude this study in Section 5.

2. Methods

2.1. Motivation

Multimodal models have attracted academic communities’ attention in action and expression recognition [26,27,28], image and video classification [29,30], medical diagnosis [31,32,33], disease diagnosis [34], and clinical prediction [35]. Heterogeneous feature representation [36] and classification enhancement are two main objectives of multimodal models. On the other hand, the regular approaches to accessing plane trajectories depend on global positioning systems (GPS) and automatic dependent surveillance broadcasts (ADS-B) providing real-time longitude and latitude coordinates. Other sensing approaches (for example, images and videos via cameras) are difficult to apply because of the wide range of the moving area of a flying vehicle, which hinders the usage of multimodal models in aircraft behavior recognition. Therefore, proposing a behavior classification method utilizing multisource trajectory data and preparing multimodal data from coordinate sequences are necessary.

2.2. Notations

We assume the available trajectory data consist of two modalities: one is a time–position sequence with longitude and latitude, and the other one is a map image containing geographic information about the moving routes. Accordingly, the time–position sequences can be denoted as
s l o n = [ x l o n 1 , , x l o n N ]
s l a t = [ x l a t 1 , , x l a t N ]
where s l o n and s l a t are, respectively, the longitude and latitude sequences. N is the fixed sequence length. x l o n N and x l a t N are the coordinate values at the N-th moment, respectively. Then, we can combine s l o n and s l a t to
s = [ s l o n , s l a t ] T R 2 N
where s is a one-dimensional vector of the sequence modal. On the other hand, the route map image matrix IMG can be represented as
I M G = { i m g i , j } = { ( i m g i , j R , i m g i , j G , i m g i , j B ) i , j } R H × W × 3
where i m g i , j R , i m g i , j G , and i m g i , j B represent the pixel values of the red-, green-, and blue-channel images. H and W denote the images’ height and width, respectively. i m g i , j is the pixel value vector at the i-th row and j-th column ( i [ 1 , H ] and i [ 1 , W ] ).

2.3. The Proposed Methodology
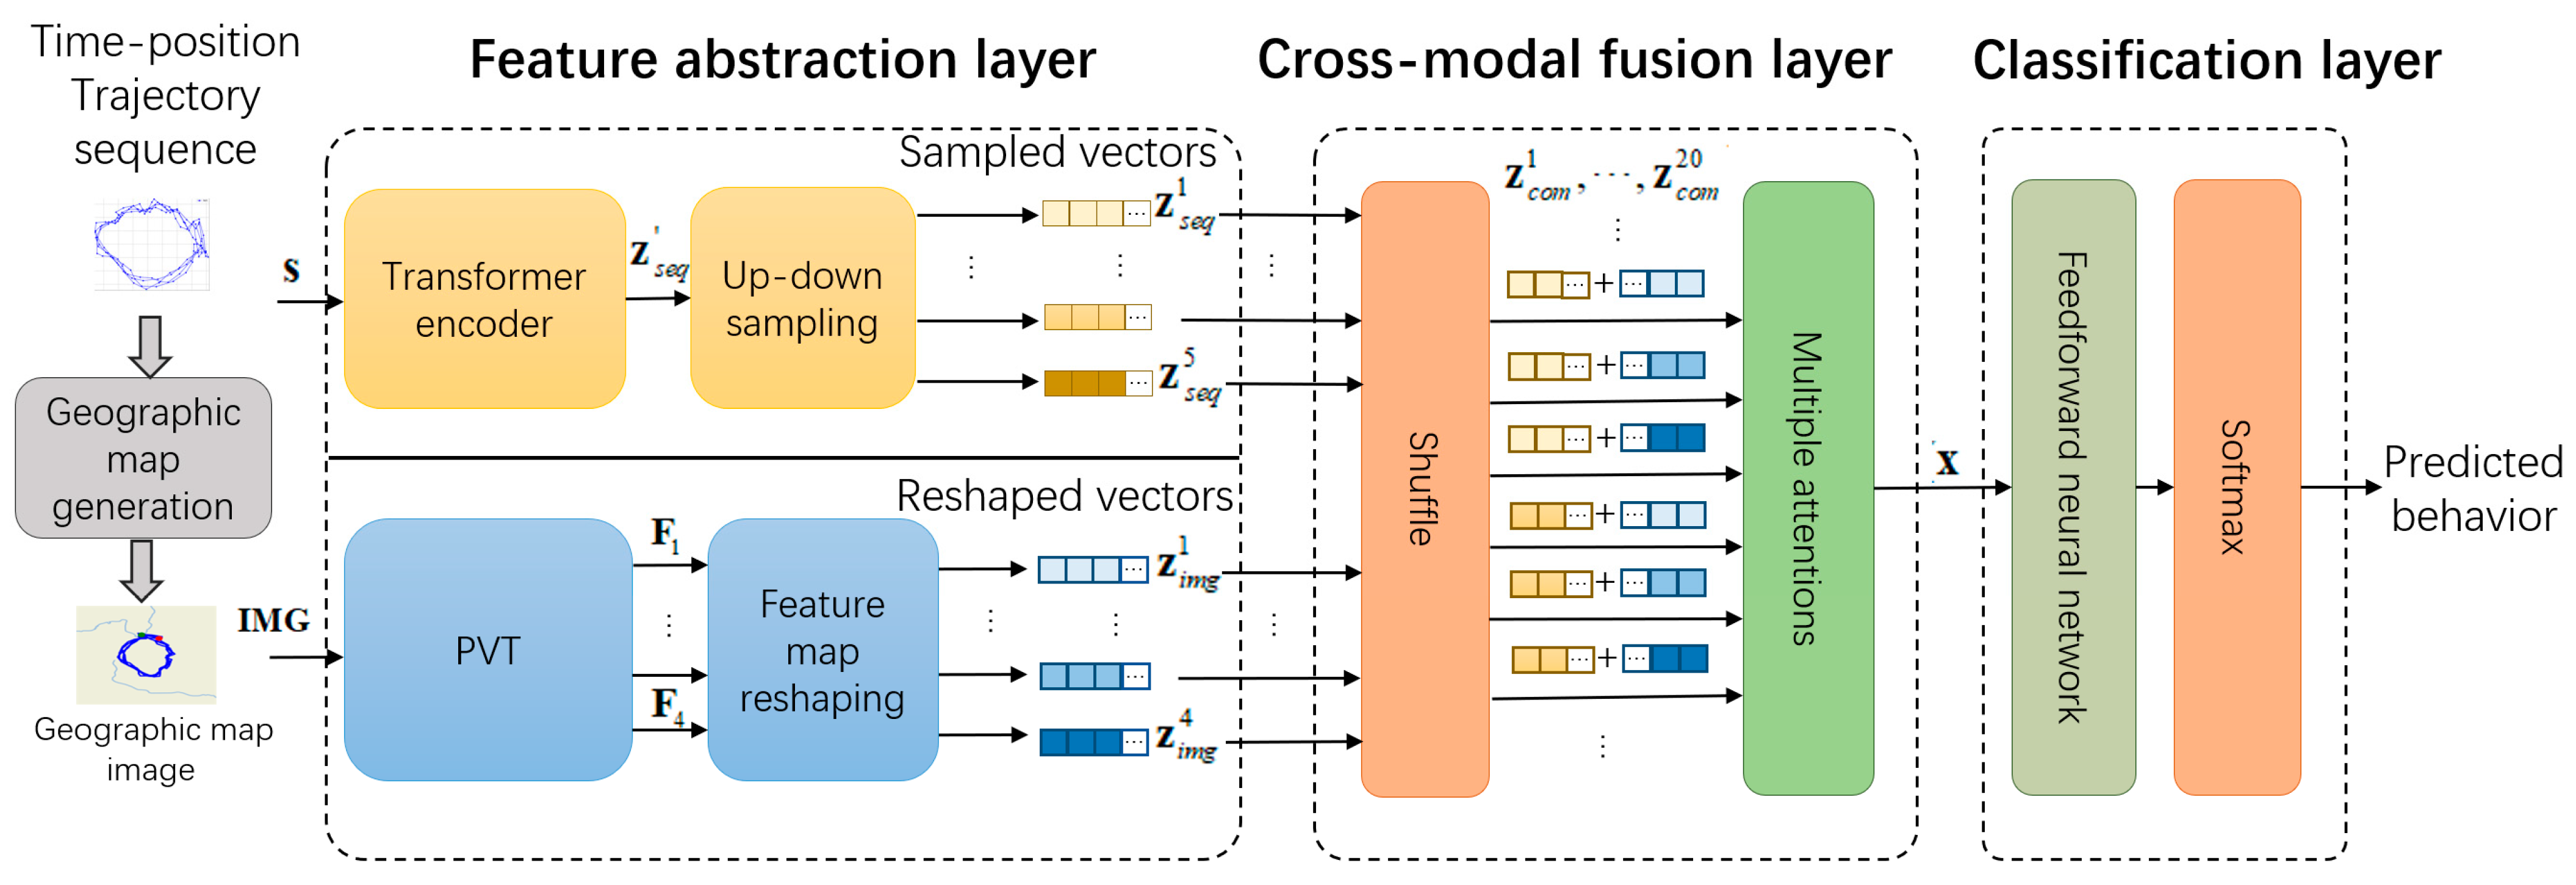
2.3.1. Framework

The framework of the proposed multimodal model on trajectory sequence (MMTS) (Supplementary Materials) is demonstrated in Figure 1. The MMTS model first generates images from the time–position trajectory sequence via the geographic map generation module, bringing geo-information around the airplane traces to the original data. We combined the sequence and image data as multimodal inputs to the proposed model. Furthermore, we customized the feature abstraction, cross-modal fusion, and classification layers to obtain multiscale features, joint-modality information, and predicted behaviors. We finally constructed a classification model on aircraft tracks with multisource data.

2.3.2. Geographic Map Generation

We practiced a modality increase approach from single-type data to binary-type ones, which allows the multimodal model to conduct behavior recognition. We intended to generate image-format samples based on latitude and longitude sequences and involve additional topographic information around the trajectory. The detailed procedure is as follows:
Step 1: Define the longitude sequence s l o n and latitude sequence s l a t as follows:
s l o n = { x l o n 1 , , x l o n i , , x l o n N } s l a t = { x l a t 1 , , x l a t i , , x l a t N }
where x l o n i and x l a t i are the longitude and latitude positions of a flying plane at the i-th moment. Then, we reconstruct a sequence containing paired positions as { ( x l a t 1 , x l o n 1 ) , , ( x l a t N , x l o n N ) } .
Step 2: Draw the positions on a blank image and connect the drawn points sequentially to show the trace shape.
Step 3: Replace the image background with an actual map according to the paired longitude and latitude coordinates.
Step 4: Save the image at a preset resolution.
All the steps can be directly programmed with open map interfaces and automatically implemented if network communication is available. This procedure makes a hybrid dataset with both sequence and image modalities.

2.3.3. Feature Abstraction Layer

The feature abstraction layer contains a transformer encoder, a PVT, up/downsampling, and feature map reshaping modules. The sequence and image data are processed parallelly in this layer.
  • Sequence processing
We utilized a transformer encoder [37] and an up/downsampling module to abstract multiscale time-sequence features. In the transformer encoder, the input position sequence will go through normalization, position embedding, attention, and feedforward network processing.
We assume each coordinate in the input latitude and longitude sequence is a token and perform input sequence normalization as follows:
s n o r = [ x l o n 1 x ¯ l o n s l o n x ¯ l o n , , x l o n N x ¯ l o n s l o n x ¯ l o n , x l a t 1 x ¯ l a t s l a t x ¯ l a t , , x l a t N x ¯ l a t s l a t x ¯ l a t ]
where s n o r denotes the normalized sequence input. x ¯ l o n and x ¯ l a t are the mean values of the latitude and longitude subsequences, respectively. We can achieve normalized subsequences, enhancing the directional information hidden in a moving trace. We then conducted position embedding for order information attachment. We defined the embedded vector length M satisfying N M and used the zero padding strategy for length alignment if N < M. Accordingly, we can guarantee to gain an M-length vector s p a d i n g R M . Subsequently, we conducted position encoding as follows:
c o d ( m ) = sin ( m M ) s e m b = s p a d d i n g + c o d
where cod is an M-dimensional position vector, m is an integer position index that satisfies 1 m M , and s e m b is the vector after position embedding. A multiattention structure with h channels was used in the attention part. We divided s e m b into h subsequences with equal lengths of M h and denoted the i-th subsequence as s e m b i . For the i-th channel, we defined the query, key, and value vectors as qi, ki, and vi, respectively. Three code weights, w i q , w i k , and w i v , were adopted for computing qi, ki, and vi as follows:
q i = s e m b i w i q k i = s e m b i w i k v i = s e m b i w i v
Then, the output of the i-th attention can be achieved by
Attention i =   softmax ( q i k i T ) v i
where softmax(•) is a function estimating the position weights. Accordingly, the outputs of h-head attention can be obtained as follows:
h e a d = [ attention 1 , , attention h ] z s e q = norm ( s e m b + h e a d )
where h e a d R M is the concatenated output of the h attentions, and norm(•) represents a normalization function transforming the vector variance to 1. z R M is the output of the attention part. In the feedforward network, we used a two-layer feedforward network with a Rectified Linear Unit (ReLU) activation function. The neuron numbers of the hidden and output layers are set to L and M, which leads to an output of the first transformer encoder with the same size as the embedded input sequence s e m b .
We stacked 6 identical transformer encoders and obtained a final encoding result of z s e q R M . Meanwhile, the up/downsampling module provides multiscale sequence features based on z s e q . We use bilinear interpolation and mean pooling for upsampling and downsampling, respectively. Accordingly, we abstracted 5 sequence feature vectors: z s e q 1 , z s e q 2 , z s e q 3 , z s e q 4 , and z s e q 5 with 4M, 2M, M, M/2, and M/4 lengths, respectively.
  • Image processing
We adopted the PVT [38] model to form 4 feature images, F1, F2, F3, and F4, with 4-, 8-, 16-, and 32-stride resolution shrinking, respectively. Patch embedding (PE) and spatial-reduction attention (SRA) were utilized in each resolution shrinking stage.
We firstly used 4-stride resolution shrinking, compressing the original image IGM to IMG1 with H 4 × W 4 size as follows:
I M G 1 = [ i m g 1 , 1 1 i m g 1 , j 1 i m g 1 , W / 4 1 i m g i , 1 1 i m g i , j 1 i m g i , W / 4 1 i m g H / 4 , 1 1 i m g H / 4 , j 1 i m g H / 4 , W / 4 1 ] R H 4 × W 4 × 12 i m g i , j 1 = [ i m g 4 × i 3 , 4 × j 3 , , i m g 4 × i 3 , 4 × j + 1 , , i m g 4 × i + 1 , 4 × j + 1 ] R 12
where i [ 1 , 2 , , H / 4 ] , j [ 1 , 2 , , W / 4 ] , and i m g i , j 1 denote the pixel value vector of the position (i,j) on IMG1. Each pixel value vector here is of 48 (=3 × 4 × 4) dimensions. Then, PE was conducted to reduce the dimensions of the pixel value vector i m g i , j 1 from 48 to a preset embedding dimension C by a projection matrix P 1 R 48 × C as follows:
I M G P E 1 = { i m g i , j 1 P 1 } R H 4 × W 4 × C
where I M G P E 1 is the feature image after PE in the first stage. I M G P E 1 is subsequently delivered to the input of the SRA-based transformer encoder, and the corresponding output is the feature image F 1 R H 4 × W 4 × C . We can repeat the above resolution shrinking process and assign the obtained feature image as the input. Accordingly, the other three feature images F 2 R H 8 × W 8 × C , F 3 R H 16 × W 16 × C , and F 4 R H 32 × W 32 × C can be gained by 8, 16, and 32 strides.
On the other hand, we used “feature map reshaping” to stretch the obtained tensors F1, F2, F3, and F4 to z i m g 1 R H W C / 16 , z i m g 2 R H W C / 64 , z i m g 3 R H W C / 256 , and z i m g 4 R H W C / 1024 , respectively, as multiscale image features.

2.3.4. Cross-Modal Fusion Layer

The cross-modal fusion layer comprises the shuffle module and multiple attention channels.
The shuffle module blends the sequence and image features to multiscale fused vectors as follows:
z c o m 4 × ( i 1 ) + j = { [ z s e q i T , z i m g j T ] T }
where i = { 1 , 2 , 3 , 4 , 5 } , j = { 1 , 2 , 3 , 4 } , and z c o m 4 × ( i 1 ) + j represent the [4 × (I − 1) + j]-th fused feature. We can gain 20 fused feature vectors { z c o m 1 , , z c o m 20 } with different i, j combinations.
We injected each fused feature vector into an associate attention encoder without word embedding. Then, each fused feature vector can be seen as a sequence. If we set z c o m 1 = s n o r , we can perform a computational process according to Formulas (7)–(10). We record the final output of Formula (10) as an encoded feature vector z e n c o d 1 with the same size of z c o m 1 . Following this manner, we can obtain 20 encoded feature vectors { z e n c o d 1 , , z e n c o d 20 } with the same length as 20 input vectors { z c o m 1 , , z c o m 20 } . Therefore, the self-relation information of fused feature vectors is involved in the encoded feature vectors for the classification layer.

2.3.5. Classification Layer
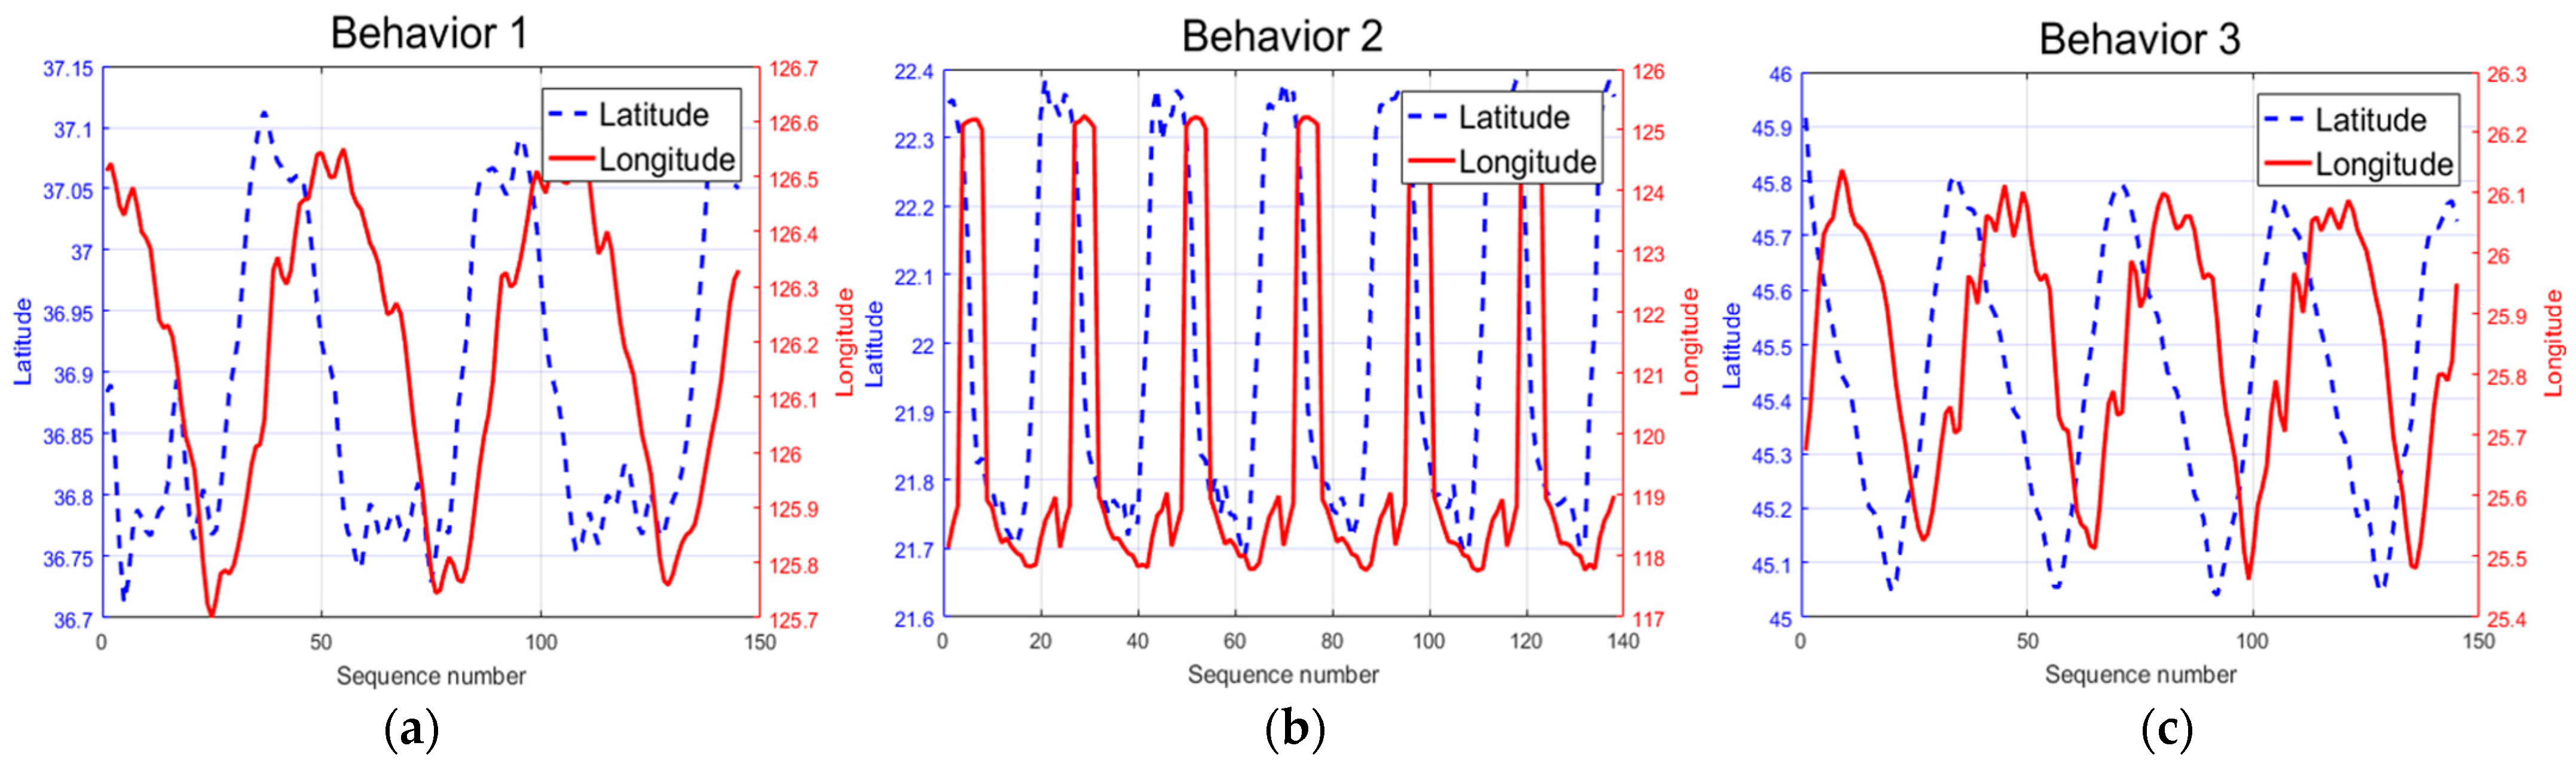
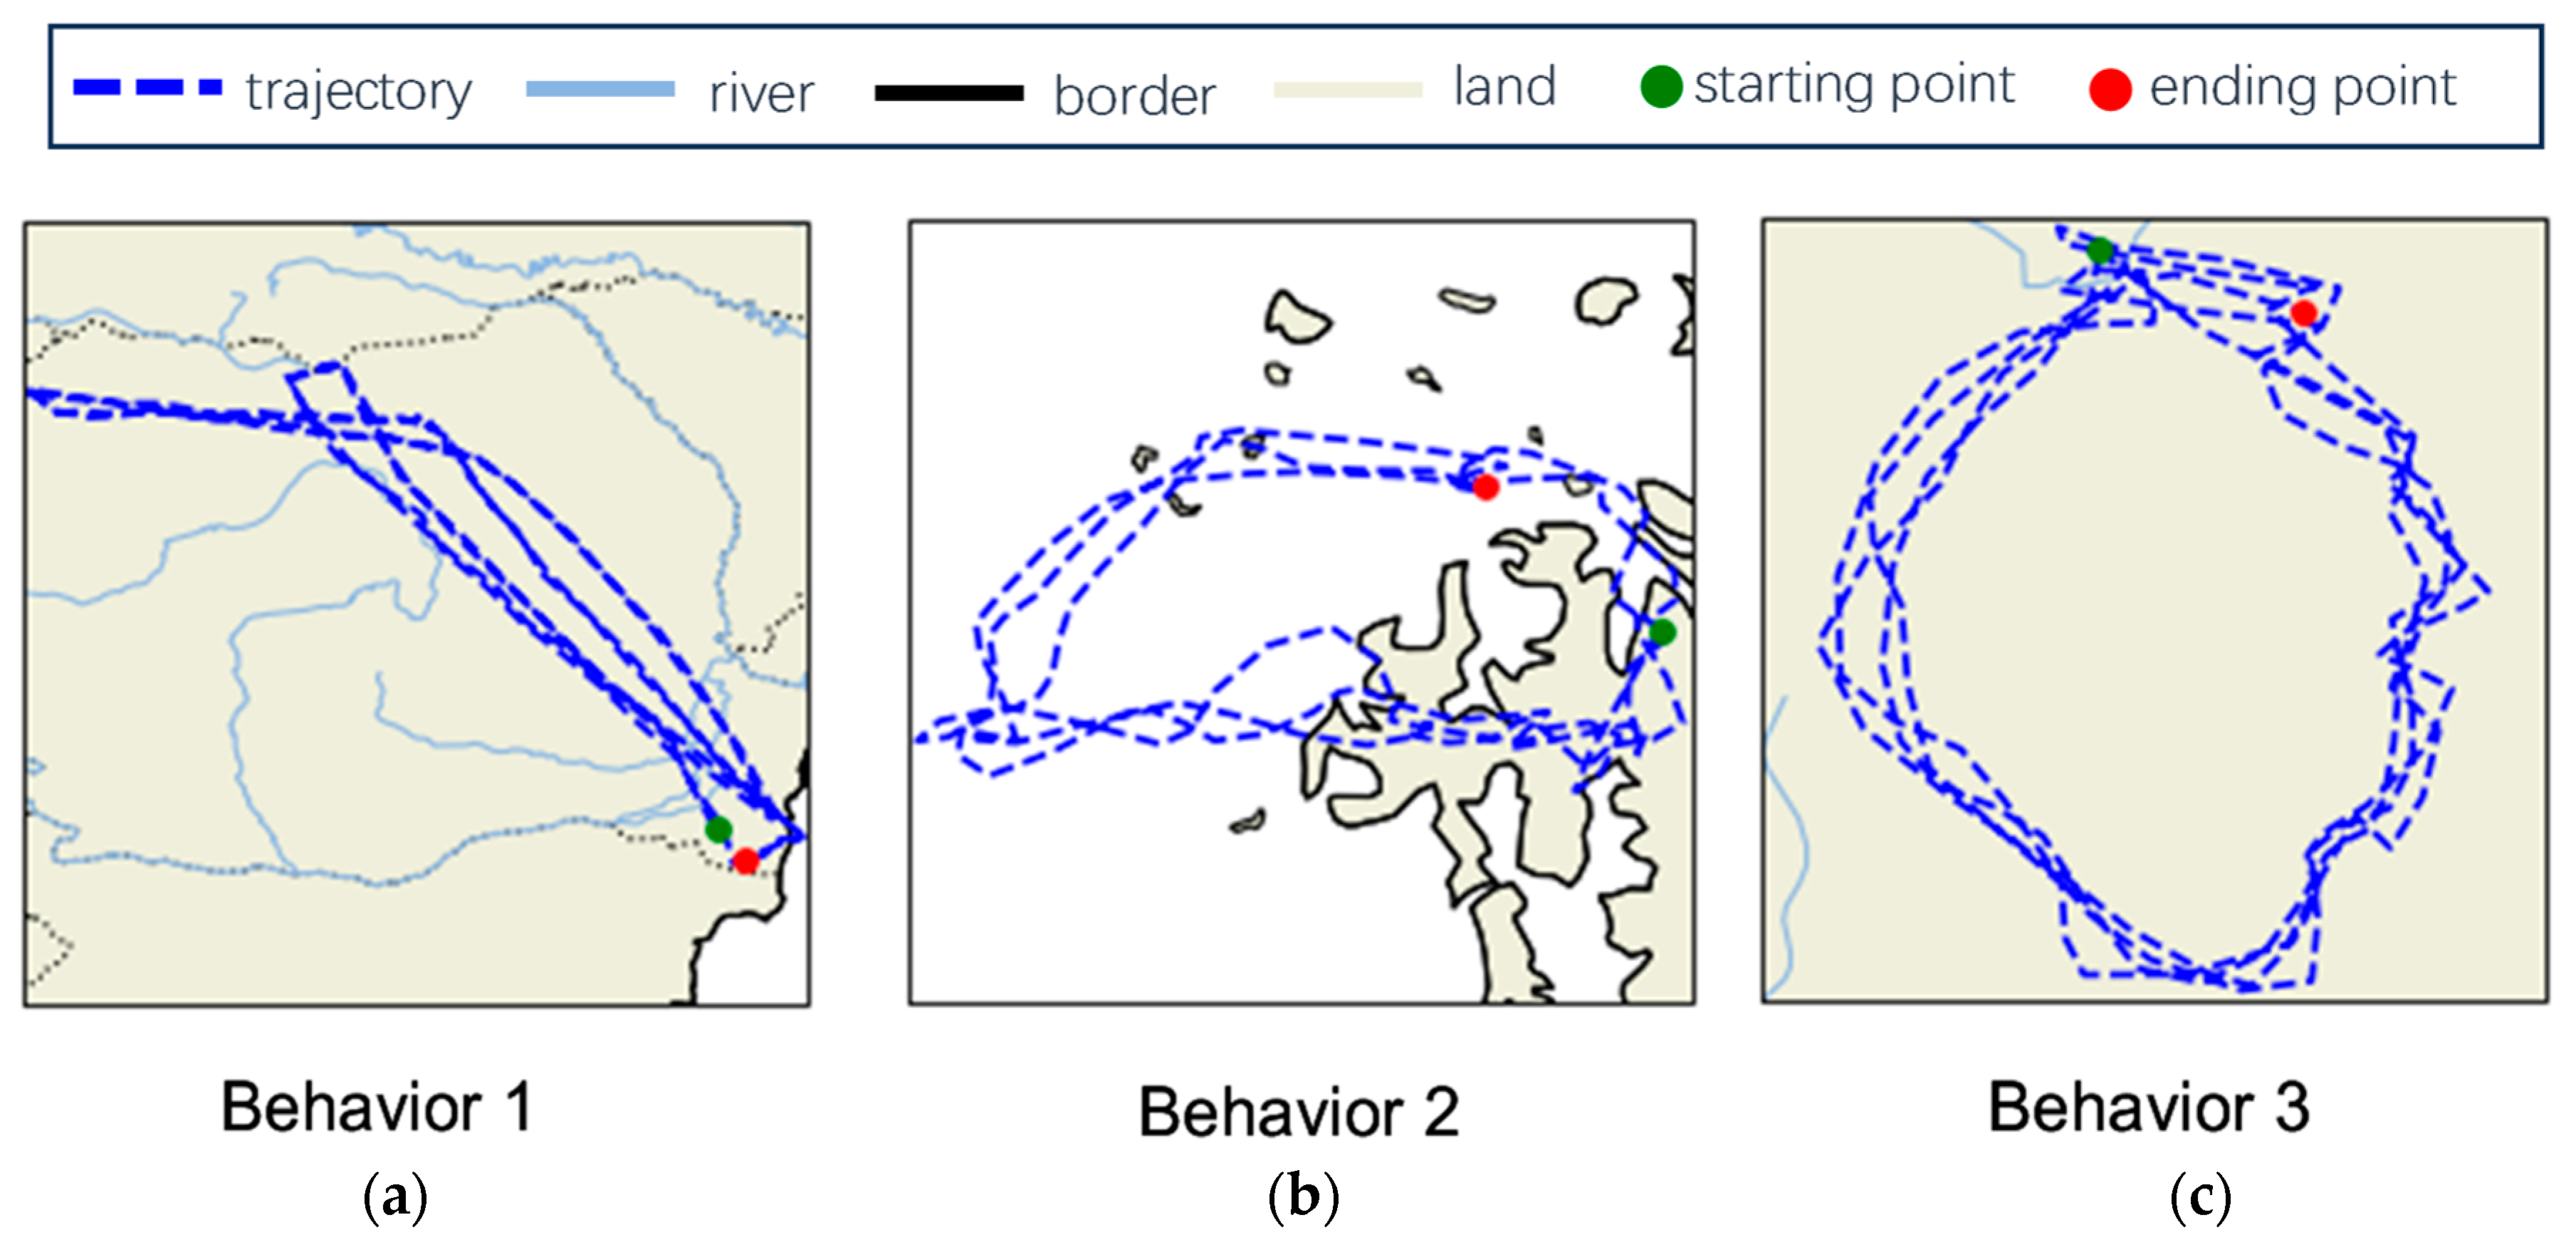
We used a three-layer feedforward network and a softmax function in the classification layer.
We primarily joined all 20 encoded features for the feedforward network as a vector x. We use the ReLU activation function for this network, and the network output o can be denoted as follows:
o = { o 1 , , o K } = ReLU ( x W 1 + b 1 ) W 2 + b 2
where ReLU ( · ) performs the ReLU function; W1 and W2 are the weight matrices between the first and second and the second and third network layers, respectively; b1 and b2 are the bias values of the second and third network layers, respectively; and K is the number of behaviors to be identified.
We adopted a softmax function to normalize the classification output o as follows:
σ i = e o i j = 1 K e o j
where σ i is the possibility of the i-th behavior, and the behavior with the highest possibility is the final result of our proposed methodology.

3. Dataset

We collected flight routes represented by a time series of longitude and latitude coordinates. All the data were exported from the GPS positioning records of several aircraft. We selected three typical aircraft behaviors as our identification objectives as follows:
  • Behavior 1: Direct flighting between fixed positions;
  • Behavior 2: Patrolling around a specific area;
  • Behavior 3: Hovering before landing.
We extracted specific paragraphs from the collected flight routes as samples related to the objective behaviors and set associated labels as Behavior 1–3 (K = 3). In total, we arranged 2880 trajectory samples in sequence modality and adjusted the sequence length of each sample to 512 by DTW [5]. This means that the model parameters N and M satisfy N = M = 512. Detailed information on the collected dataset is listed in Table 1. We selected a typical sequence sample from each behavior category and demonstrated the selected three series samples with Matlab 2018b in Figure 2a–c, respectively. We used red and blue lines to describe a moving aircraft’s longitude and latitude trace. Behavior 2 shows a distinguished moving trend considering the latitude and longitude lines compared with Behavior 1 and 3. On the contrary, Behaviors 2 and 3 exhibit similar periodic waves and changes, which may lead to misjudgment of classifiers. Therefore, the data of sequence modality cannot independently support high-performance behavior recognitions. More data-level information should be added for a behavior recognition task.
We attempted to visualize a flight trajectory on a map, representing supplemented geographic information in image modality. Figure 3a–c shows the generated maps with a Python map library named cartopy according to the coordinate sequences in Figure 2a–c, respectively. Rivers, land, borders, and other topographic information around moving traces are presented in the generated images. We labeled a moving trace’s start and end points with green and red points, respectively. Blue, baby blue, black, and cinereous were assigned to indicate the areas of trace, river, border, and land, respectively. Regarding image modality, Behaviors 2 and 3 can be clearly distinguished on geographic elements, although they have similar sequence data. Meanwhile, the geographic elements of Behavior 1 and 3 are close, which would harm behavior recognition. Intuitively, combining the sequence and image data for trajectory identification and further behavior discrimination is necessary. We uniformly adjusted the resolution size of all generated images to 224 × 224. Thus, both H and W of the proposed methodology are equal to 224.

4. Results and Discussion

4.1. Settings

We used 10-fold cross-validation to form the training and testing sets. We divided 2880 multimodal samples into 10 parts. We picked up 72, 72, and 144 samples of Behavior 1, 2, and 3, respectively, for each part without repetition. Thus, we can constitute 10 trials based on different training and testing data combinations. In each trial, we used nine and one parts for the training and testing, respectively.
We introduced four reference methods, including spectral clustering (SP) [39], transformer [37], clustering-GRU (CGRU) [40], and vision transformer (ViT) [41] to evaluate performance. Among these reference methods, SP is a traditional approach containing subtrajectory clustering and classification phases on time series. Both the transformer and CGRU are designed with deep network units for sequence processing. The difference between the transformer and CGRU is that the transformer was originally intended for natural language processing and mining long-range correlations in sentence sequences, while the CGRU is a trajectory recognition model that incorporates a clustering treatment. ViT is a variant of the transformer designed for image feature abstraction and recognition. We adopted ViT into the comparison as a behavior recognition model on image data.
We set the weight decay parameter and learning rate to 10−4 and 10−5, respectively, for the proposed MMTS model. We utilized the pretrained weights as the initial weights of the image encoder and time series encoder from the CLIP model. We employed a random initialization approach to initialize the proposed model: the truncated normal distribution was considered for all the linear sublayers to avoid the negative influence of outlier samples. We set the mean, standard deviation, and bias of the distribution to 0, 0.02, and 0, respectively. We adopt a two-stage training strategy to avoid underfitting or overfitting: (1) Module training phase: we freeze the weights of the transformer encoder and PVT parts of the feature abstraction layer and enable the training in the cross-modal fusion and classification layers. (2) End-to-end phase: we activate the weights of the transformer encoder and PVT parts of the feature abstraction layer and perform entire model training.
We assigned 8-head attention for the transformer and set the sequence vector dimension N = M = 512 in the feature extraction layer, Thus, the dimensions of the multiscale sequence features are 2048, 1024, 512, 256, and 128. We set the PVT embedding patch size C to 3 and the height H and width W of the original images’ size to 224. Accordingly, the sizes of the four feature maps F1–F4 are 56 × 56 × 3, 28 × 28 × 3, 14 × 14 × 3, and 7 × 7 × 3. In the cross-modal fusion layer, the dimensions of 20 fused and encoded features depend on the utilized sequence and image features. In the classification layer, the input vector dimension of the feedforward network in the classification layer becomes 78,347 according to the total dimension of all 20 encoded features. Considering three behaviors to be recognized (K = 3), the neuron numbers of the input, hidden, and output layers of the feedforward network are 78,347, 100, and 3, respectively.
In the following discussion, the behavior recognition accuracy is calculated by
A = N c o r r e c t N s a m p l e × 100 %
where N c o r r e c t and N s a m p l e are the correctly identified and total sample numbers, respectively.

4.2. Behavior Recognition Accuracy

We performed all the baseline methods and our proposed MMTS on the dataset illustrated in Section 3. The training and testing data arrangement complies with the schedule described in Section 4.1. We listed all the recognition accuracies, corresponding averages, and standard deviations in Table 2. We placed the collected standard deviations after the average values and separated them with “±” signs.
Regarding average accuracy, MMTS outperforms all adopted methods, achieving a top score of 95.1%, 9% higher than the second-ranking CGRU algorithm. The direct classification of trajectory data using the transformer yields the poorest result at 67.2%, as it solely relies on sequence modality features without any pretreatments. Both CGRU and SP are methods with clustering pretreatment, and their accuracies are 87.2% and 82.3%. CGRU’s accuracy is 4.9% higher than SP’s. We infer the reason is CGRU uses the GRU structure for deep feature extraction. In the utilized dataset, the valuable information contained in the sequence modality is significantly less than in the image modality. Consequently, ViT attains a higher recognition accuracy on image data at 84.8%, in contrast to the subpar performance of the transformer. The multimodal methods MMTS have proved more effective, extracting more helpful information on multisource data than the reference methods.
The standard deviations in Table 3 reflect the stability of the methods. Our proposed MMTS method maintained accuracy within the range of [87.6%, 99.4%] in 10 trials, obtaining a minor standard deviation among all adopted methods at 3.9%. This means the robustness of the proposed methodology is trustworthy.
Generally, the superiority of the proposed MMTS model is clearly demonstrated in this subsection. The multimodal manner would enhance the behavior recognition accuracy with satisfied stability.

4.3. Ablation Test

We designed four submodels from the MMTS model to validate the multimodal data, multiscale, and cross-modal fusion considerations behind the proposed MMTS model. The submodels are as follows:
Submodel 1: Conducted on sequence data and lets the output of PVT reach zero in the feature abstraction layer.
Submodel 2: Conducted on image data and lets the output of the transformer encoder reach zero in the feature abstraction layer.
Submodel 3: Excludes multiscale sequence generation by removing the up/downsampling module of the feature abstraction layer.
Submodel 4: Excludes classification on the abstracted sequence and image features by removing the cross-domain fusion layer.
We tested the four submodels in this subsection, demonstrating the correctness and effectiveness of our considerations in model construction. Accordingly, we just performed a comparison between the su-models and the full model, and no existing models were used as reference methods. We used Submodels 1 and 2 to validate the multimodal data consideration for trajectory-based behavior recognition. Submodels 3 and 4 were customized to test the effectiveness of the multiscale and cross-modal fusion considerations.
We calculated the average recognition accuracy from the recognition accuracy of the four submodels in 10 trials. The corresponding average values are recorded in Table 3. Lower average accuracy means a more significant influence of the removed part. Submodel 1 gains the lowest score of 80.8%, a 14.3% decrease compared with the full MMTS model. This implies the significant contribution of image modality to the model performance. The cross-modal fusion consideration is the second most important factor in multimodal classification owing to an 11.9% accuracy reduction caused by Submodel 4. Multiscale consideration leads to a 9.4% accuracy variation in Submodel 3, which is more effective than Submodel 2. Thus, the impact of considerations on model performance can be ranked as multimodal data consideration > cross-modal fusion consideration > multiscale consideration. Although the sequence modality has the weakest impact (a 7.6% performance decrease) on the MMTS model due to relatively less information for trajectory classification, it is still a fundamental factor in trajectory recognition tasks. It cannot be ignored in real applications. Hence, all considerations are meaningful and can support high-quality behavior recognition tasks.

5. Conclusions

In this paper, we assigned a feature abstraction layer, cross-modal fusion layer, and classification layer to form a multimodal model for behavior recognition of moving traces. Image data generation, multiscale feature abstraction, and cross-modal feature fusion are considered and integrated to enable multimodal classification based on single-series data and explore correlations and self-relations between different data manners. We presented the details of the designed model and increased modality method. The experimental results confirm the excellent performance of the proposed methodology in a 10-fold cross-validation. MMTS achieves better behavior recognition accuracy in validation than the single-modal methods. Moreover, an ablation test validated the effectiveness of the primary considerations of our proposed model. As a result, the proposed model is a suitable choice for trajectory-based tasks.
In the future, we should pay attention to automatic modality data alignment and deeper cross-modal fusion approaches. We also plan to study and analyze state-of-the-art (SOTA) models more to improve the precision and robustness of our multimodal models.

Supplementary Materials

The code of the proposed model can be accessed at https://github.com/kiiiko/MMTS on 12 January 2024.

Author Contributions

Conceptualization, M.Z. and T.L.; methodology, M.Z.; software, L.Z.; validation, L.Z. and M.Z.; formal analysis, M.Z.; investigation, L.Z.; resources, T.L.; data curation, M.Z.; writing—original draft preparation, M.Z.; writing—review and editing, T.L.; visualization, L.Z.; supervision, T.L.; project administration, T.L.; funding acquisition, T.L. All authors have read and agreed to the published version of the manuscript.

Funding

This research was funded by the General Project of Chongqing Natural Science Foundation, grant number cstc2021jcyj-msxmX0108.

Data Availability Statement

The data is unavailable due to some commercial issues.

Conflicts of Interest

The authors declare no conflicts of interest.

References

  1. Zhao, W.; Zhang, Z.; Huang, K. Gestalt Laws-Based Tracklets Analysis for Human Crowd Understanding. Pattern Recogn. 2018, 75, 112–127. [Google Scholar] [CrossRef]
  2. Gurung, S.; Lin, D.; Jiang, W.; Hurson, A.; Zhang, R. Traffic Information Publication with Privacy Preservation. ACM Trans. Intell. Syst. Technol. 2014, 5, 1–26. [Google Scholar] [CrossRef]
  3. Bashir, F.I.; Khokhar, A.A.; Schonfeld, D. Object Trajectory-Based Activity Classification and Recognition Using Hidden Markov Models. IEEE Trans. Image Proc. 2007, 16, 1912–1919. [Google Scholar] [CrossRef] [PubMed]
  4. Freedman, M.; Mumford, K.G.; Danko, A.; Hart, D.; Richardson, S.D. Demonstration of a Principal Component Analysis Trajectory Method to Assess Bioremediation Progress at a TCE-Impacted Site. Groundw. Monit. Remediat. 2023, 43, 90–97. [Google Scholar] [CrossRef]
  5. Bautista, M.A.; Hernández-Vela, A.; Escalera, S.; Igual, L.; Pujol, O.; Moya, J.; Violant, V.; Anguera, M.T. A Gesture Recognition System for Detecting Behavioral Patterns of ADHD. IEEE Trans. Cybernet. 2016, 46, 136–147. [Google Scholar] [CrossRef] [PubMed]
  6. Bashir, F.I.; Khokhar, A.A.; Schonfeld, D. Real-Time Motion Trajectory-Based Indexing and Retrieval of Video Sequences. IEEE Trans. Multimed. 2007, 9, 58–65. [Google Scholar] [CrossRef]
  7. Piotto, N.; Conci, N.; De Natale, F.G.B. Syntactic Matching of Trajectories for Ambient Intelligence Applications. IEEE Trans. Multimed. 2009, 11, 1266–1275. [Google Scholar] [CrossRef]
  8. Wang, H.; Ullah, M.M.; Klaser, A.; Laptev, I.; Schmid, C. Evaluation of Local Spatio-Temporal Features for Action Recognition. In British Machine Vision Conference (BMVC’09); BMVA Press: London, UK, 2009; pp. 124.1–124.11. [Google Scholar]
  9. Faria, D.R.; Dias, J. 3D Hand Trajectory Segmentation by Curvatures and Hand Orientation for Classification through a Probabilistic Approach. In Proceedings of the IEEE/RSJ International Conference on Intelligent Robots and Systems, St. Louis, MO, USA, 10–15 October 2009; IEEE: Piscataway, NJ, USA, 2009; pp. 1284–1289. [Google Scholar]
  10. Lee, J.-G.; Han, J.; Whang, K.-Y. Trajectory Clustering: A Partition-and-Group Framework. In Proceedings of the ACM SIGMOD International Conference on Management of Data, Beijing, China, 11–14 June 2007; ACM: New York, NY, USA, 2007; pp. 593–604. [Google Scholar]
  11. Krajňák, V.; Naik, S.; Wiggins, S. Predicting Trajectory Behaviour via Machine-Learned Invariant Manifolds. Chem. Phys. Lett. 2022, 789, 139290. [Google Scholar] [CrossRef]
  12. Ruan, Y.; Zou, Y.; Chen, M.; Shen, J. Monitoring the Spatiotemporal Trajectory of Urban Area Hotspots Using the SVM Regression Method Based on NPP-VIIRS Imagery. ISPRS Int. J. Geo-Inf. 2021, 10, 415. [Google Scholar] [CrossRef]
  13. Poularakis, S.; Katsavounidis, I. Low-Complexity Hand Gesture Recognition System for Continuous Streams of Digits and Letters. IEEE Trans. Cybernet. 2016, 46, 2094–2108. [Google Scholar] [CrossRef]
  14. Devanne, M.; Wannous, H.; Berretti, S.; Pala, P.; Daoudi, M.; Del Bimbo, A. 3D Human Action Recognition by Shape Analysis of Motion Trajectories on Riemannian Manifold. IEEE Trans. Cybernet. 2015, 45, 1340–1352. [Google Scholar] [CrossRef]
  15. Devanne, M.; Berretti, S.; Pala, P.; Wannous, H.; Daoudi, M.; Del Bimbo, A. Motion Segment Decomposition of RGB-D Sequences for Human Behavior Understanding. Pattern Recogn. 2017, 61, 222–233. [Google Scholar] [CrossRef]
  16. Yuan, Y.; Feng, Y.; Lu, X. Statistical Hypothesis Detector for Abnormal Event Detection in Crowded Scenes. IEEE Trans. Cybernet. 2017, 47, 3597–3608. [Google Scholar] [CrossRef] [PubMed]
  17. Hu, W.; Li, X.; Tian, G.; Maybank, S.; Zhang, Z. An Incremental DPMM-Based Method for Trajectory Clustering, Modeling, and Retrieval. IEEE Trans. Pattern Anal. Mach. Intell. 2013, 35, 1051–1065. [Google Scholar] [PubMed]
  18. Wang, H.; O’Sullivan, C. Globally Continuous and Non-Markovian Crowd Activity Analysis from Videos. In Proceedings of the European Conference on Computer Vision, Amsterdam, The Netherlands, 11–14 October 2016; Springer: Cham, Switzerland, 2016; pp. 527–544. [Google Scholar]
  19. Zhong, C.; Jiang, Z.; Chu, X.; Liu, L. Inland Ship Trajectory Restoration by Recurrent Neural Network. J. Nav. 2019, 72, 1359–1377. [Google Scholar] [CrossRef]
  20. Huang, Z.; Wang, J.; Pi, L.; Song, X.; Yang, L. LSTM Based Trajectory Prediction Model for Cyclist Utilizing Multiple Interactions with Environment. Pattern Recogn. 2021, 112, 107800. [Google Scholar] [CrossRef]
  21. Peng, Y.; Zhang, G.; Shi, J.; Xu, B.; Zheng, L. SRA-LSTM: Social Relationship Attention LSTM for Human Trajectory Prediction. Neurocomputing 2021, 490, 258–268. [Google Scholar] [CrossRef]
  22. Wang, Q.; Wu, B.; Zhu, P.; Li, P.; Zuo, W.; Hu, Q. Eca-Net: Efficient Channel Attention for Deep Convolutional Neural Networks. In Proceedings of the 2020 IEEE/CVF Conference on Computer Vision and Pattern Recognition (CVPR), Seattle, WA, USA, 13–19 June 2020; IEEE: Piscataway, NJ, USA, 2020; pp. 11531–11539. [Google Scholar]
  23. Chen, K.; Liu, P.; Li, Z.; Wang, Y.; Lu, Y. Modeling Anticipation and Relaxation of Lane Changing Behavior Using Deep Learning. Transport. Res. Rec. 2021, 2675, 186–200. [Google Scholar] [CrossRef]
  24. Gan, C.; Wang, N.; Yang, Y.; Yeung, D.-Y.; Hauptmann, A.G. Devnet: A Deep Event Network for Multimedia Event Detection and Evidence Recounting. In Proceedings of the IEEE Conference on Computer Vision and Pattern Recognition, Boston, MA, USA, 7–12 June 2015; IEEE: Piscataway, NJ, USA, 2015; pp. 2568–2577. [Google Scholar]
  25. Jiang, Y.-G.; Wu, Z.; Wang, J.; Xue, X.; Chang, S.-F. Exploiting Feature and Class Relationships in Video Categorization with Regularized Deep Neural Networks. IEEE Trans. Pattern Anal. Mach. Intell. 2018, 40, 352–364. [Google Scholar] [CrossRef]
  26. Li, H.; Sun, J.; Xu, Z.; Chen, L. Multimodal 2D+ 3D facial expression recognition with deep fusion convolutional neural network. IEEE Trans. Multimed. 2017, 19, 2816–2831. [Google Scholar] [CrossRef]
  27. Liu, Z.; Zhang, L.; Liu, Q.; Yin, Y.; Cheng, L.; Zimmermann, R. Fusion of magnetic and visual sensors for indoor localization: Infrastructure-free and more effective. IEEE Trans. Multimed. 2017, 19, 874–888. [Google Scholar] [CrossRef]
  28. Qiao, Z.; Wu, X.; Ge, S.; Fan, W. MNN: Multimodal attentional neural networks for diagnosis prediction. In Proceedings of the 28th International Joint Conference Artificial Intelligence, Macao, China, 10–16 August 2019; pp. 5937–5943. [Google Scholar]
  29. Guillaumin, M.; Verbeek, J.; Schmid, C. Multimodal semisupervised learning for image classification. In Proceedings of the 2010 IEEE Computer Society Conference on Computer Vision and Pattern Recognition, San Francisco, CA, USA, 13–18 June 2010; pp. 902–909. [Google Scholar]
  30. JGeng, J.; Miao, Z.; Zhang, X.-P. Efficient heuristic methods for multimodal fusion and concept fusion in video concept detection. IEEE Trans. Multimed. 2015, 17, 498–511. [Google Scholar]
  31. Xu, L.; Wu, X.; Chen, K.; Yao, L. Multi-modality sparse representation-based classification for Alzheimer’s disease and mild cognitive impairment. Comput. Methods Programs Biomed. 2015, 122, 182–190. [Google Scholar] [CrossRef] [PubMed]
  32. Bernal, E.A.; Yang, X.; Li, Q.; Kumar, J.; Madhvanath, S.; Ramesh, P.; Bala, R. Deep temporal multimodal fusion for medical procedure monitoring using wearable sensors. IEEE Trans. Multimed. 2018, 20, 107–118. [Google Scholar] [CrossRef]
  33. Tan, C.; Sun, F.; Zhang, W.; Chen, J.; Liu, C. Multimodal classification with deep convolutional-recurrent neural networks for electroencephalography. In Proceedings of the International Conference on Neural Information Processing, Guangzhou, China, 14–18 November 2017; pp. 767–776. [Google Scholar]
  34. Ma, F.; You, Q.; Xiao, H.; Chitta, R.; Zhou, J.; Gao, J. KAME: Knowledge-based attention model for diagnosis prediction in healthcare. In Proceedings of the 27th ACM International Conference on Information and Knowledge Management, Torino, Italy, 22–26 October 2018; pp. 743–752. [Google Scholar]
  35. Xu, Y.; Biswal, S.; Deshpande, S.R.; Maher, K.O.; Sun, J. RAIM: Recurrent attentive and intensive model of multimodal patient monitoring data. In Proceedings of the 24th ACM SIGKDD International Conference on Knowledge Discovery & Data Mining, London, UK, 19–23 August 2018; pp. 2565–2573. [Google Scholar]
  36. Kalimeri, K.; Saitis, C. Exploring multimodal biosignal features for stress detection during indoor mobility. In Proceedings of the 18th ACM International Conference on Multimodal Interaction, Tokyo, Japan, 12–16 November 2016; pp. 53–60. [Google Scholar]
  37. Vaswani, A.; Shazeer, N.; Parmar, N.; Uszkoreit, J.; Jones, L.; Gomez, A.N.; Kaiser, Ł.; Polosukhin, I. Attention Is All You Need. In Proceedings of the 31st International Conference on Neural Information Processing Systems, Long Beach, CA, USA, 4–9 December 2017; pp. 6000–6010. [Google Scholar]
  38. Wang, W.; Xie, E.; Li, X.; Fan, D.P.; Song, K.; Liang, D.; Shao, L. Pyramid vision transformer: A versatile backbone for dense prediction without convolutions. In Proceedings of the IEEE/CVF International Conference on Computer Vision, Montreal, QC, Canada, 10–17 October 2021; pp. 568–578. [Google Scholar]
  39. Gao, M.; Shi, G.Y. Ship-handling behavior pattern recognition using AIS sub-trajectory clustering analysis based on the T-SNE and spectral clustering algorithms. Ocean. Eng. 2020, 205, 117–132. [Google Scholar] [CrossRef]
  40. Chan, Z.; Collins, L.; Kasabov, N. An Efficient Greedy CGRU Algorithm for Global Gene Trajectory Clustering. Expert Syst. Appl. 2006, 30, 137–141. [Google Scholar] [CrossRef]
  41. Dosovitskiy, A.; Beyer, L.; Kolesnikov, A.; Weissenborn, D.; Zhai, X.; Unterthiner, T.; Dehghani, M.; Minderer, M.; Heigold, G.; Gelly, S.; et al. An Image Is Worth 16x16 Words: Transformers for Image Recognition at Scale. In Proceedings of the International Conference on Learning Representations, Virtual Event, 3–7 May 2021. [Google Scholar]
Figure 1. Framework of the proposed methodology.
Electronics 13 00367 g001
Figure 2. Typical time–position sequences of (a) Behavior 1, (b) Behavior 2, and (c) Behavior 3.
Electronics 13 00367 g002
Figure 3. Generated geographic images around flight trajectories of (a) Behavior 1, (b) Behavior 2, and (c) Behavior 3.
Electronics 13 00367 g003
Table 1. Category and modality information of original sequence data.
Category LabelNumber of SamplesLengthModality
Behavior 1720512Sequence
Behavior 2720512Sequence
Behavior 31440512Sequence
Total number2880
Table 2. Behavior recognition accuracy comparison (%).
MethodModalityTrialAverage
12345678910
Spectral clustering (SP) [39]Sequence 83.684.382.179.975.28578.977.379.986.982.3 ± 5.1
Transformer [37]Sequence80.171.356.260.564.865.576.664.864.880.167.2 ± 7.2
Clustering-GRU (CGRU) [40]Sequence87.981.489.985.287.585.88980.385.180.187.2 ± 4.4
Vision transformer (ViT) [41]Image87.691.284.680.680.786.278.490.383.587.684.8 ± 4.2
MMTS(Ours)Sequence and image98.199.490.697.696.887.698.191.696.598.195.1 ± 3.9
Table 3. Ablation test results (%).
MethodAverage AccuracyAccuracy Variation
Full MSM
Submodel 1 (without image features)
95.1
80.8
/
−14.3
Submodel 2 (without sequence features)87.5−7.6
Submodel 3 (without multiscale sequence feature extraction)85.7−9.4
Submodel 4 (without cross-modal fusion) 83.2−11.9
Disclaimer/Publisher’s Note: The statements, opinions and data contained in all publications are solely those of the individual author(s) and contributor(s) and not of MDPI and/or the editor(s). MDPI and/or the editor(s) disclaim responsibility for any injury to people or property resulting from any ideas, methods, instructions or products referred to in the content.

