Article

A Convolutional Block Base Architecture for Multiclass Brain Tumor Detection Using Magnetic Resonance Imaging

Department of Software, Sangmyung University, Cheonan 31066, Republic of Korea
*
Author to whom correspondence should be addressed.
Electronics 2024, 13(2), 364; https://doi.org/10.3390/electronics13020364
Submission received: 20 November 2023 / Revised: 10 January 2024 / Accepted: 11 January 2024 / Published: 15 January 2024
(This article belongs to the Special Issue Revolutionizing Medical Image Analysis with Deep Learning)

Abstract

:
In the domain of radiological diagnostics, accurately detecting and classifying brain tumors from magnetic resonance imaging (MRI) scans presents significant challenges, primarily due to the complex and diverse manifestations of tumors in these scans. In this paper, a convolutional-block-based architecture has been proposed for the detection of multiclass brain tumors using MRI scans. Leveraging the strengths of CNNs, our proposed framework demonstrates robustness and efficiency in distinguishing between different tumor types. Extensive evaluations on three diverse datasets underscore the model’s exceptional diagnostic accuracy, with an average accuracy rate of 97.52%, precision of 97.63%, recall of 97.18%, specificity of 98.32%, and F1-score of 97.36%. These results outperform contemporary methods, including state-of-the-art (SOTA) models such as VGG16, VGG19, MobileNet, EfficientNet, ResNet50, Xception, and DenseNet121. Furthermore, its adaptability across different MRI modalities underlines its potential for broad clinical application, offering a significant advancement in the field of radiological diagnostics and brain tumor detection.

1. Introduction

Brain tumors are caused by abnormal and uncontrolled growth of nerve cells, either originating in the brain or metastatic, stemming from cancer elsewhere in the body, which leads to masses in the brain. There are approximately 120 different types of brain tumors, which can vary in terms of location, growth rate, cellular composition, and whether they are non-cancerous (benign) or cancerous (malignant) [1]. Diagnosing brain tumors is a medically challenging task due to the symptoms often associated with brain tumors are generic and similar to those of less serious neurological conditions such as headaches, seizures, and cognitive or sensory impairments [2,3,4]. Furthermore, locality, growth rate, and influence of tumor on adjacent brain tissue require a tailored approach in both diagnosis and treatment [5].
Recent data underscore the prevalence of glioma, pituitary, and meningioma tumors, which comprise approximately 1.4% of cancer cases in the United States, which equates to 20,500 new cases and 12,500 deaths each year [6,7]. Gliomas, aggressive tumors of the brain glial cells, represent a significant health risk, with 14,000 diagnoses in the United States annually, often classified as grade IV by the World Health Organization due to their malignancy [8,9]. On the contrary, pituitary tumors, originating in the pituitary gland, are typically slower-progressing and less likely to metastasize [10]. Meningiomas, detected in six to eight out of every 100,000 individuals annually, arise from cerebral or spinal meninges and, although usually benign, can sometimes progress, leading to notable symptoms such as potential seizures, visual impairments, and persistent headaches [10,11,12,13,14]. In neurooncology, glioma, pituitary, and meningioma tumors are of vital significance due to their prevalence, location, and varied characteristics (as shown in Figure 1).
The current diagnostic approaches for brain tumors, including magnetic resonance imaging (MRI), computed tomography (CT) scans, and biopsies pose several challenges. Although MRI and CT scans provide detailed and high-resolution brain images, they require specialized expertise and are often time-consuming, prone to error and subjective to variability, leading to differences in diagnosis and treatment plans [15,16]. Moreover, a definitive diagnosis often requires a biopsy, involving microscopic examination of a tissue sample. However, biopsies carry risks due to the potential for sampling inaccuracies and the sensitive nature of brain tissue. These issues and challenges highlight the need for a non-invasive, efficient, and accurate diagnostic tool that can automate the diagnostic process and aid clinicians in their assessments.
The advent of convolutional neural networks (CNN) in medical imaging has ushered in a new era of computer-aided diagnostic (CAD) tools. Traditional imaging techniques, which were heavily reliant on manual interpretation, often suffered from subjective biases. The incorporation of deep learning (DL) models has shifted the diagnostic paradigm towards more objective and data-driven methods, bringing transformative changes across various medical domains [17,18,19]. Multiple research studies and frameworks have been designed and proposed to accurately classify and diagnose using medical images [20,21,22,23]. Integrating these DL frameworks into CAD systems offers potential advances in diagnostic capabilities assessment of intracranial abnormalities during the pre-operative phase. Moreover, they pave the way for more efficient post-operative monitoring processes, ensuring that patients receive timely and appropriate care based on objective image analysis [24,25].
In [26], a novel automated pipeline base approach is presented, which utilizes multiple models such as ResNet50, InceptionV3, EfficientNetB0, and NASNetMobile, to address data imbalance and improve CAD performance. In [27], the authors highlight and address the challenges of CNN-based segmentation, particularly the scarcity of labeled data, class imbalance, and high computational requirements. In a shift from traditional methods, vision transformers (ViTs) have emerged as a viable alternative to CNNs for medical classification [28,29].
In recent years, several studies have explored the application of machine learning and deep learning techniques for brain tumor detection using MRI images. In [30], a support vector machine (SVM) based model achieved an accuracy rate of 91.28% to detect glioma and pituitary tumors, while, SVM combined with the K-nearest neighbor (KNN) model is presented in [31] and achieve 85% accuracy. A hybrid approach of CNN model integrated with an extreme learning machine (ELM) is proposed in [32], achieved 93.68% accuracy rate, while in [33] employed a KNN model with normalized local binary patterns (nLBP) feature extraction, achieved an accuracy rate of 95.56%.
Despite these advancements, there is still a range of challenges that need to be addressed [34,35]. The diverse nature of brain tumors, characterized by their varying sizes, locality, and growth trajectories, highlights the need for efficient yet highly accurate models tailored for diagnosing brain tumors. Current state-of-the-art (SOTA) models such as VGG16, VGG19, MobileNetv2, and ResNet50 are effective in many situations, but they might not be optimized and trained specifically for the unique intricacies of brain tumor MRI scans. These models struggle with accurately differentiating between various brain tumor types. Such fine-grained differentiation granularity is essential, given the different treatment approaches associated with each type of tumor.
Recent studies have underscored the advantages of a more modular approach to CNN architecture, tailored specifically to detect multiclass brain tumors on MRI [36,37]. Such advancements can lead to a more reliable and precise detection and classification of brain tumors. By focusing on the intricate characteristics of brain tumor imaging, these models can assist clinicians in diagnosing brain tumors with greater accuracy and timely precision. Furthermore, they can substantially reduce the risk of misdiagnosis, thereby improving the diagnostic process and enhancing patient care. The main contributions are summarized as follows:
  • We introduce a convolutional-block-based architecture for the detection and classification of multiclass brain tumors using MRI scans. This modular approach is pivotal in addressing the complexities of brain tumor manifestations, especially in scenarios with subtle and nuanced visual distinctions.
  • To address the challenges of data heterogeneity, our study incorporates three distinct, publicly accessible multiclass datasets: Dataset 1 [38], Dataset 2 [39], and Dataset 3 [40]. The model demonstrates its adaptability and reliability across these datasets, with an average accuracy rate of 97.85%, thus showcasing its potential in various diagnostic scenarios.
  • Our research proposes an automated, data-driven approach to improve both the efficiency and accuracy of the diagnostic process. This method effectively addresses the limitations inherent in traditional diagnostic techniques, such as the invasive nature of biopsies and potential errors in manual MRI scan interpretation.
  • In a comparative analysis with state-of-the-art models such as VGG16, VGG19, MobileNetv2, and ResNet50, our proposed model outperforms in key performance metrics like accuracy, precision, and recall. It achieves a mean average precision (mAP) value of 99.03% on Dataset 1 [38], 99.93% on Dataset 2 [39], and 99.70% on Dataset 3 [40]. These high mAP scores further validate the model’s precision in detecting tumor instances across varied datasets, underscoring its effectiveness and reliability in brain tumor diagnostics.
This paper is structured as follows: In Section 2, we present a comprehensive review of the existing literature. Section 3 discusses the datasets, data preprocessing techniques, and the proposed methodology. In Section 4, we discuss the design and implementation of our proposed methods. The result and evaluation of our framework are presented in Section 5. Finally, Section 6 concludes the paper, summarizing the key findings and suggesting future research directions.

2. Related Work

The detection and classification of brain tumors using multi-modal MRI images have been the subject of extensive research in recent years. Several methodologies have been proposed, leveraging both traditional machine learning techniques and deep learning architectures. In this section, we provide an overview of recent studies that have contributed to brain tumor detection and classification using magnetic resonance imaging (MRI).
In [41], an automated brain tumor segmentation method is introduced, combining a fully convolutional neural network (FCN) with hand-designed texton features. Pixel-wise FCN predictions are used as a feature map for random forest-based voxel classification into normal and tumorous brain tissues. The proposed method achieved Dice overlap scores of 88%, 80%, and 73% for complete tumor, core, and enhancing tumor regions in the 2013 multimodal brain tumor segmentation dataset (BraTS). The authors of [42] proposed a novel training technique to enhance tumor segmentation by integrating an additional classification branch into the neural network. The proposed model achieved an average Dice score of 78.43% for enhancing tumor, 89.99% for whole tumor, and 84.22% for tumor core segmentation on the BraTS 2020 dataset.
In [43], the authors introduced two deep learning models, UNet and Deeplabv3, for glioblastoma brain tumor detection and segmentation using preprocessed MRI images. Both models demonstrated accurate detection and segmentation capabilities, with Deeplabv3 achieving an accuracy of 90%, although with a high computational cost. In [44], the authors employed various SOTA CNN architectures, including EfficientNetB0, ResNet50, Xception, MobileNetV2, and VGG16, for brain tumor detection and classification. Among these, the EfficientNetB0 architecture outperformed others, achieving an accuracy of 97.61%. The authors of [45], introduced a deep neural convolution network (DCNN) to autonomously detect brain tumors from MRI brain images. The proposed model achieved an overall classification accuracy of 96%, with a precision of 93% and an F1-score of 97%.
In [46], the authors investigate the effectiveness of various CNN architectures augmented with skip connections for the detection of brain tumors from MRI images. They experiment with multiple CNN architecture modifications, including widening and deepening techniques, along with varying the placement of skip connections. The results reveal that techniques such as deepening, widening, data augmentation, and strategic use of skip connection blocks consistently improve overall accuracy. The authors of [47] highlight the challenges of small medical image datasets, overconfident predictions, and silent failure when presented with out-of-distribution (OOD) test data. They proposed a multitask learning base method to improve prediction calibration and introduced a novel OOD detection method based on spectral analysis of CNN features. An overview of CNN and generative adversarial networks (GAN) is presented for the estimation of cross-modality medical images based on MRI, highlighting the potential of GANs in this domain [48].
In [49], the authors introduced a hybrid PCA-NGIST approach integrated with a regularized extreme learning machine (RELM) for brain tumor classification. The proposed methodology utilized min-max normalization contrast enhancement and PCA-NGIST for feature extraction, the method achieved an accuracy of 94.23%. In [50], the authors fine-tuned the pre-trained VGG19 model on contrast-enhanced MRI (CE-MRI) scans for brain tumor detection, achieving an accuracy of 94.82%. In [51], the authors opted to use the ResNet50 CNN model for brain tumor detection. They incorporated global average pooling to address the prevalent issue of overfitting and achieved a 97.48% accuracy.
Furthermore, an automated multistep methodology is proposed for accurate brain tumor detection and classification using MRI images [52]. The proposed approach comprises five distinct steps, including edge detection, a customized deep neural network for segmentation, feature extraction using the mobileNetV2 transfer learning base model, feature selection using an entropy-based method, and a multiclass support vector machine (M-SVM) for brain tumor classification. The proposed methodology achieved an accuracy of 97.47% and 98.92% on BraTS 2018 and Figshare datasets, respectively. In [53], an Enhanced CNN (ECNN) model is introduced for accurate classification and distinguishing between healthy and unhealthy patients using brain MRI images. The architecture of the ECNN model includes components for feature extraction and optimal classification, with hyperparameter optimization using the nonlinear Lévy chaotic moth flame Optimizer (NLCMFO). This approach significantly improved CNN optimization and classification with 97.4% accuracy and a 96.6% F1-score on both the BraTS 2015 and Harvard Medical School brain image datasets.

3. Methodology

In this section, we provide an in-depth discussion of the proposed model for the detection and classification of brain tumors. Our aim is to provide detailed insight and contribution of our model in the field of medical imaging.

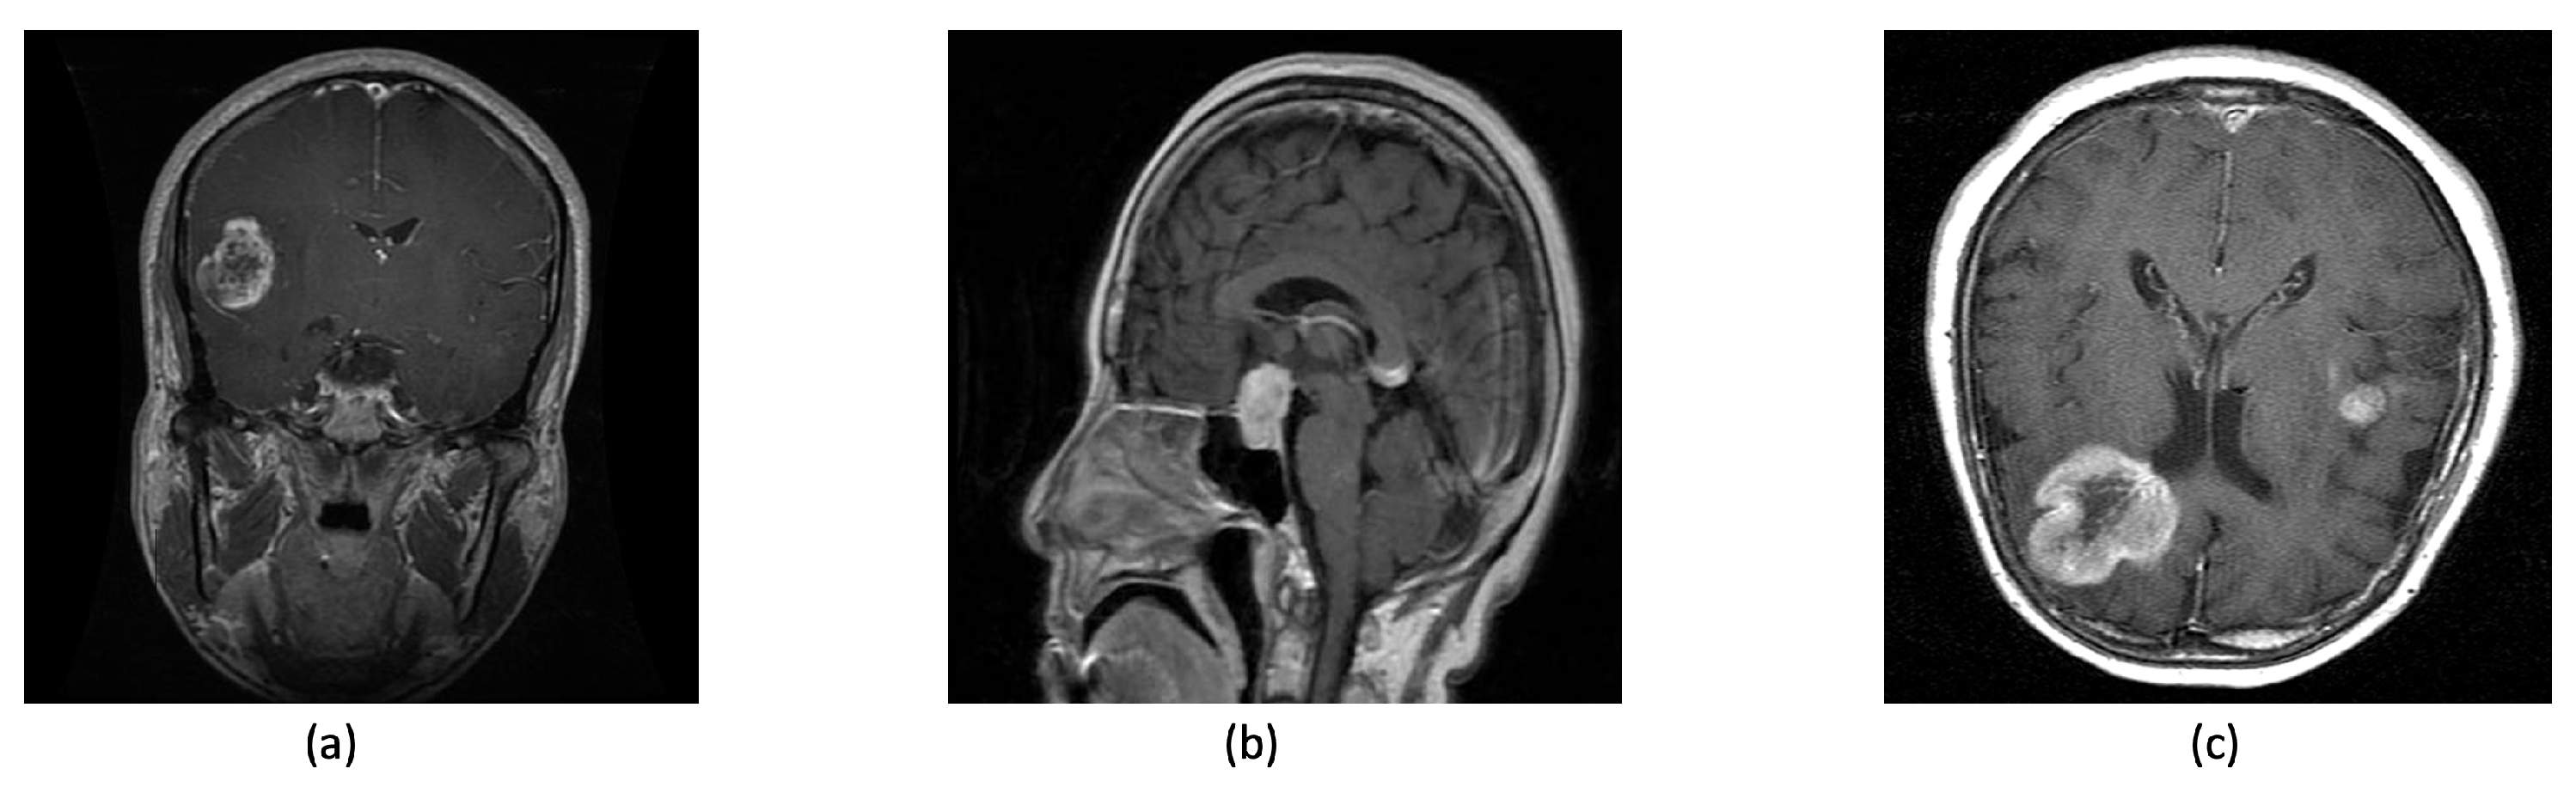
3.1. Dataset Collection

In this paper, we utilize publicly available MRI datasets from Kaggle. A comprehensive breakdown of these datasets is presented in Table 1. It comprises three distinct datasets, each focusing on glioma, pituitary, and meningioma tumors, three of the most prevalent brain tumors.
Dataset 1 [38] contains a total of 19,226 images, divided into 14,718 for training, 3680 for validation, and 828 for testing, with label distributions of 6587, 6418, and 6221 for glioma, pituitary, and meningioma, respectively. Dataset 2 [39] consists of 5023 images, with 3293 for training, 824 for validation, and 906 for testing. Meanwhile, Dataset 3 [40] comprises 19,226 images, with 13,686 for training and an equal distribution of 2770 images each for validation and testing. The collection of these datasets is the key to conducting robust investigations, improving the accuracy of the model, and optimizing predictive capabilities.

Image Rescaling and Normalization

The MRI datasets used in this study have diverse image sizes and aspect ratios. Ensuring consistency in image resolution is essential when leveraging convolutional neural networks (CNN) for tasks such as brain tumor detection and classification. Smaller resolutions minimize the computational overhead manifold but might miss out on important details. Conversely, large-resolution images increase computational costs without significantly improving diagnostic accuracy.
After employing a grid search method across various resolutions (as shown in Table 2), we concluded that the 100 × 100 pixel dimension is optimal as it strikes a balance between computational efficiency and maintaining diagnostic detail. Consequently, all MRI images in our datasets were resized to this dimension. We normalized the intensities of the MRI scan pixel to the [0, 1] range to ensure uniform brightness and contrast. This standardization of the input data improves the diagnostic accuracy and generalizability of the proposed model.

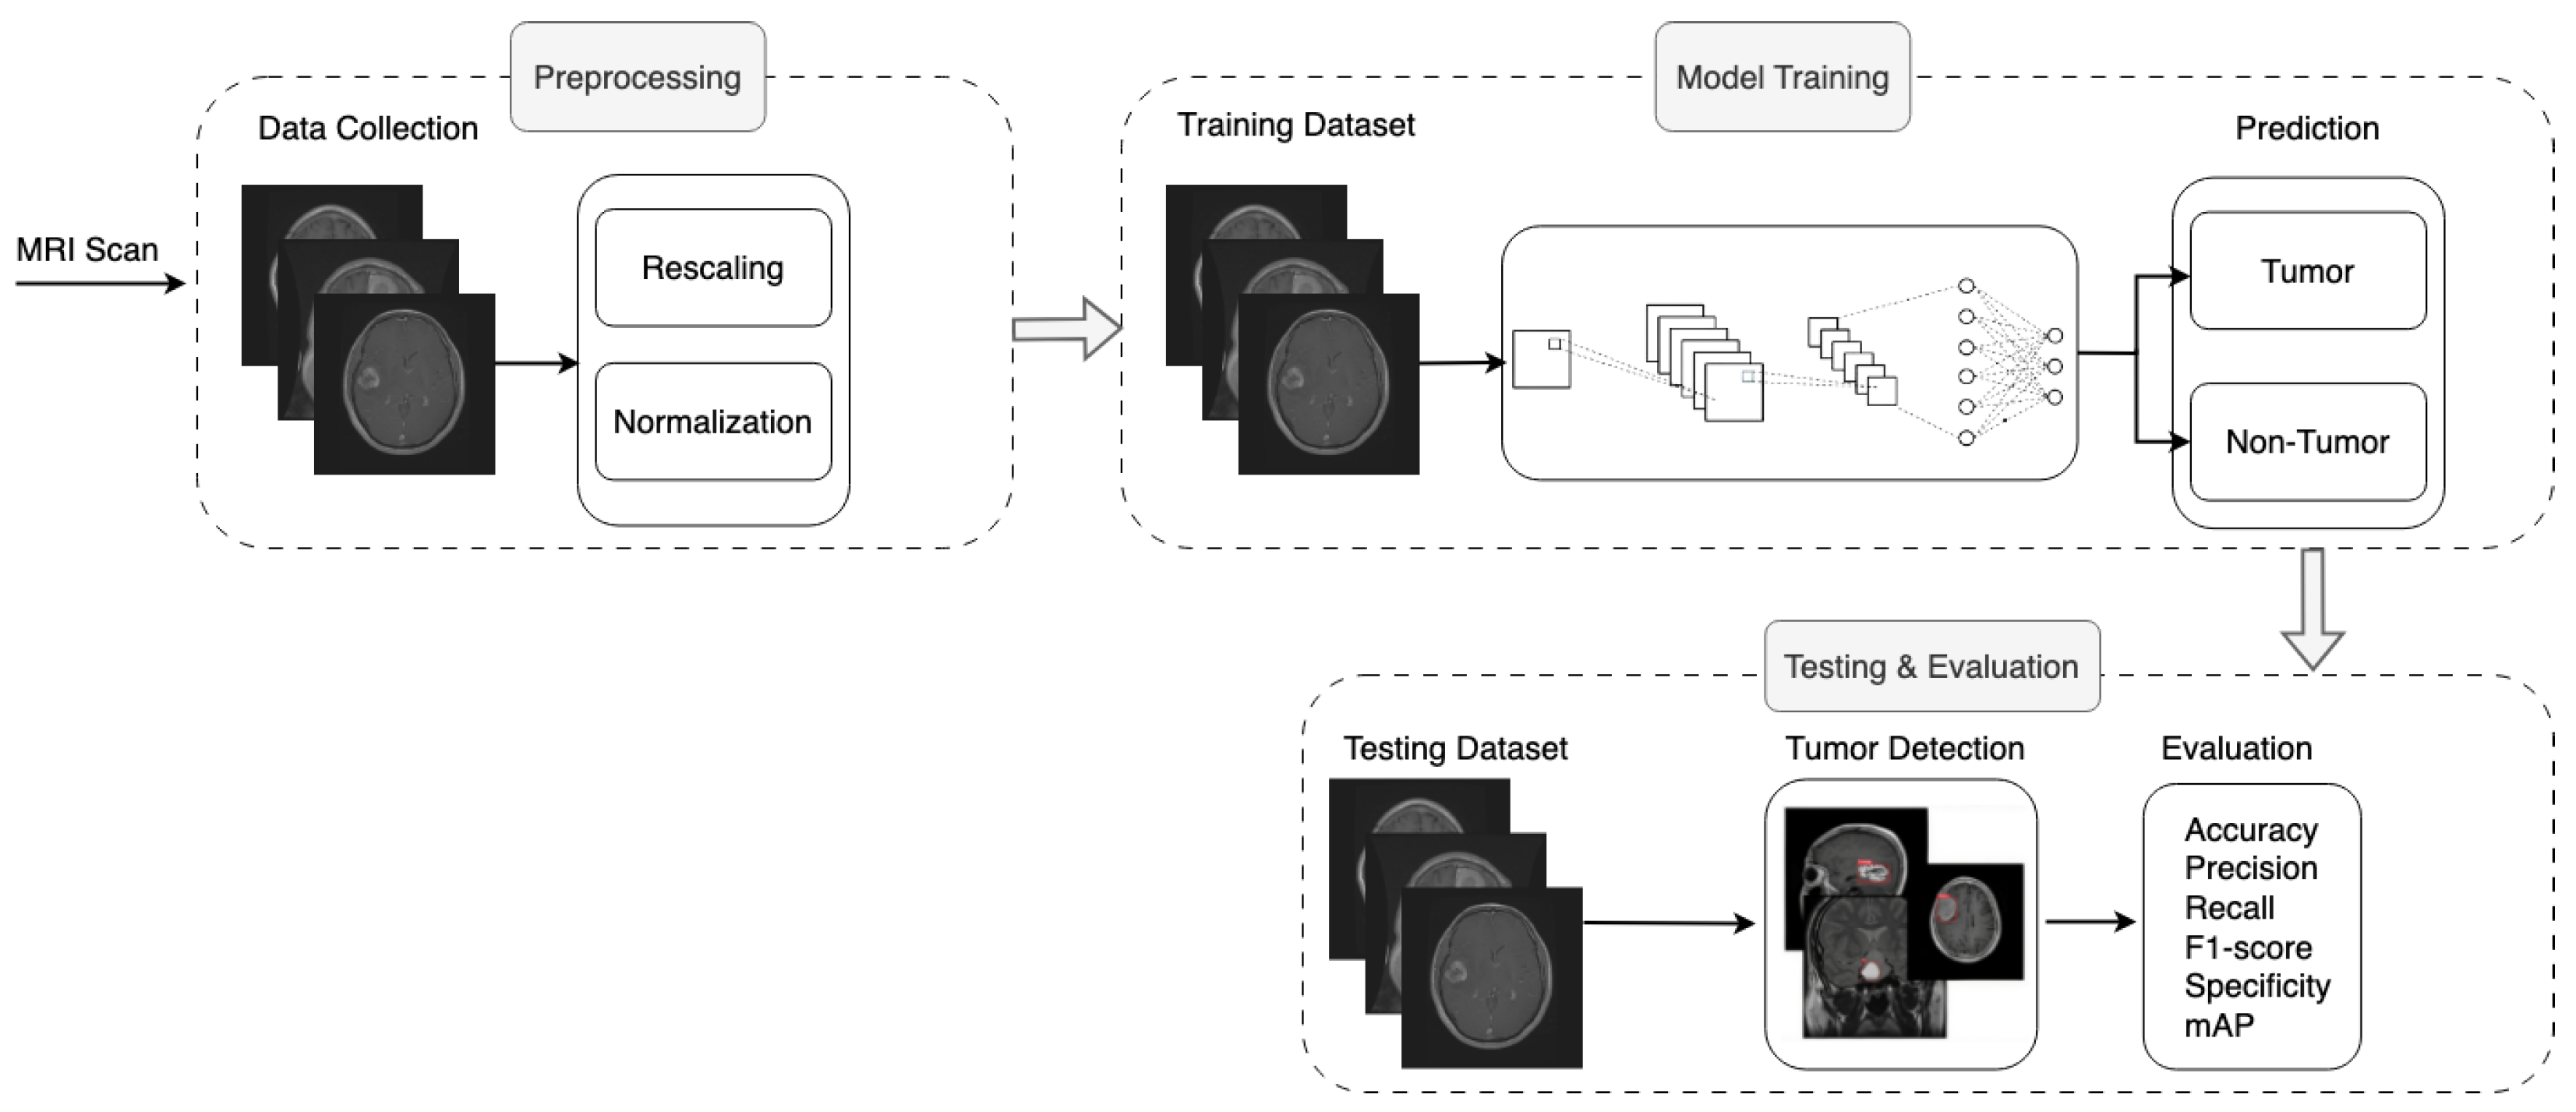
3.2. Proposed Methodology

In brain tumor detection and classification, deeper architectures do not always ensure better results. While deeper architectures, such as [54] with 23.8 million parameters and [55] with 143.6 million parameters, have emerged, it is evident that increased depth can sometimes compromise accuracy [56,57]. Henceforth, in this paper, we present a neural network, as illustrated in Figure 2 designed specifically for the challenging task of brain tumor detection and classification. Our primary goal is to attain high accuracy while minimizing the number of parameters and resource utilization.
Our model, as shown in Table 3, combines convolutional blocks, max-pooling, dropout, and  GlobalAveragePooling2D layers. It efficiently transforms raw pixel input data from brain imaging into structured tensors for feature extraction. By recognizing critical patterns of brain tumors, the model utilizes the GlobalAveragePooling2D layer to accurately detect and classify brain tumors. Furthermore, we optimize the parameters of the layers to minimize training errors and losses.
The proposed model is adeptly designed to handle input images ( I i n ) at 100 × 100 pixels, which encompass three color channels, reminiscent of the RGB color model. In the context of the proposed model for brain tumor detection, utilizing the RGB model offers distinct advantages. The three-channel structure of RGB captures unique features of tumors, providing a holistic view of the pathology. This multi-channel nature allows us to facilitate more robust feature extraction, diverse data augmentation techniques, and enhancing model generalization. Furthermore, the RGB format is consistent with certain medical imaging scans, promoting trust and ease of interpretation among medical professionals and clinicians. Additionally, the varying intensities across RGB channels enhance edge detection capabilities, which is a critical component in discerning tumor boundaries. The input configuration can be represented as:
I i n R 100 × 100 × 3
Convolutional layers, integral to neural network architectures, are specially designed to process structured grid data, such as medical images. They operate by convolving each input map ( n 1 ) with a two-dimensional filter ( F x n × F y n ), where x and y define the spatial dimensions of the filter. Each convolutional layer consists of neurons equipped with learnable biases and weights that enable these layers to iteratively extract salient features from the input data. During the feedforward process, the filter dimensions F x and F y are convolved throughout the range of the input maps. This map is derived through the dot product between the filter and distinct sections of the input. The output map of the n th layer is constructed by aggregating the convolutional responses of its preceding n 1  layers.
The weights, ω i j , establish a filter of dimensions ( F x n × F y n ). This filter establishes a connection between the input map i and the subsequent output maps j. The primary function of the convolutional layer is to extract distinct features from the input maps and merge diverse filter activations, resulting in intricate feature abstractions, which can be mathematically represented as:
I o u t = R e L U i = 1 n 1 I i n α i n 1 × ω i j n + β j n
where ∗ denotes the convolutional operation, α i n 1 represents the activations of the filter of previous layers, ω i j n is the weight that connects the input and output maps, β j n is the associated bias, and the spatial dimensions of I i n and I o u t remain consistent.
In the proposed model, significant emphasis is placed on convolutional blocks to extract a cascade of features from the input. Each of these blocks comprises layers that utilize filters, which incrementally vary in size from 32 to 512. This hierarchical structure ensures the extraction of features of increasing complexity, from basic edges and textures to more intricate patterns representative of potential tumor indications. Furthermore, to maintain stable learning and efficient processing, batch normalization is incorporated alongside convolutional operations, promoting improved convergence during model training. The mathematical representation of batch normalization is as follows:
B N ( x ) = γ x μ σ 2 + ϵ + b
where x represents the processed input, μ and σ 2 represent its mean and variance, respectively, and  γ and b represent scale and shift parameters, ensuring that the model can adjust the normalized values according to the desired data distribution.
Max-pooling layers play a pivotal role in the proposed model by reducing the spatial footprint of the feature map, minimizing computational costs, and ensuring the preservation of the salient features. This can be mathematically represented as:
P ( x ) = m a x i , j Ω ( x i , j )
where Ω represents the perceptive region.
Hypermeters such as kernel size and output size have been carefully selected to maximize both the model performance and computational efficiency. We employed a grid search to fine-tune the dimensionality and number of the convolutional layers to optimize the proposed model architecture. In summary, the proposed model effectively integrates convolutional blocks, max-pooling, and batch normalization. In addition to that, our model maintains a balance between depth and performance by utilizing the RGB multi-channel structure and neural network capabilities. The overall working of the proposed methodology is presented in Algorithm 1.
Algorithm 1 Pseudocode of the proposed model
Require:  ( X t r a i n , Y t r a i n ) , ( X v a l , Y v a l ) , ( X t e s t , Y t e s t )
1:Define Sequential model
2: i n p u t _ s h a p e ( W , H , 3 )
3:for i in [ 32 , 64 , 128 , 512 ]  do
4:     if  i = = 32  then
5:          Add Conv2D layer with i filters, kernel size ( 3 , 3 ) , and  i n p u t _ s h a p e
6:     else
7:          Add Conv2D layer with i filters, kernel size ( 3 , 3 )
8:     end if
9:     Add MaxPool2D layer with pool size ( 2 , 2 )
10:     Add BatchNormalization layer
11:end for
12:Add GlobalAveragePooling2D layer
13:Add Dense layer with 128 neurons and ReLU activation
14:Add Dense layer with “Number of Classes” neurons and Softmax activation
15:CompileAdam optimizer, loss and accuracy

3.3. Loss Function and Optimization Strategy

In this study, we employ categorical cross-entropy as the loss function, coupled with the Adam optimizer, set at a learning rate of 0.0001, for the training of our model. The Adam optimizer offers a significant advantage owing to its ability to compute adaptive learning rates for each parameter, unlike traditional gradient descent algorithms which apply a uniform learning rate for all weight updates. The Adam optimizer employs a moving average of past gradients, which makes our model converge faster and optimizes memory usage.
The categorical cross-entropy loss function is mathematically represented as follows:
L ( y , y ^ ) = i y i log ( y ^ i )
y is the true label, and y ^ is the predicted probability distribution.
However, the optimization of deep neural networks often faces challenges such as vanishing or exploding gradients, which can be exacerbated by setting improper learning rates. To address these challenges, we incorporate the ReduceLROnPlateau function into our training phase, which dynamically adapts the learning rate in response to validation loss stagnation over a period of 10 epochs.
The Adam optimizer is mathematically formulated as:
A d a m t + 1 = θ t η v ^ t + ϵ m ^ t
θ represents the parameters to be optimized, η is the learning rate, m ^ t and v ^ t are estimates of the first and second moments of the gradients, and ϵ is a small scalar used to prevent division by zero.
Moreover, the optimization strategy is further enhanced by incorporating the softmax function in the model’s final layer for classification tasks, defined as:
Softmax ( z ) i = e z i j = 1 K e z j
z stands for the model output, and K signifies the number of brain tumor classification classes.
This integrative approach, which combines the Adam optimizer and its adaptive learning rate capabilities, the precision of the categorical cross-entropy loss function, and dynamic learning rate adjustment through ReduceLROnPlateau, can effectively enhance the model’s ability to accurately detect and classify brain tumors and significantly reduces the risk of overfitting.

4. Results

4.1. Key Performance Indicators (KPIs)

In medical imaging, particularly within the challenging domain of brain tumor detection, a robust set of evaluation metrics is indispensable. These metrics furnish a quantitative insight into the model’s capability to discern between malignant growths and healthy tissue. For our proposed diagnostic model, we have chosen the following key performance indicators (KPIs) to ensure meticulous evaluation: accuracy, precision, recall, F1-score, average precision (mAP), and specificity.
Accuracy provides a general assessment of the model predictions. It computes the ratio of accurately identified samples to all samples analyzed, as shown in Equation (8). This metric provides an all-encompassing view of the model’s overarching correctness in tumor identification.
Accuracy ( A ) = T P + T N T P + T N + F P + F N
Precision evaluates the model’s precision in its assertions. Defined as the ratio of accurate tumor identifications to all the diagnoses tagged as tumors, precision is pivotal for ascertaining the model’s dependability in its positive identifications, as elucidated in Equation (9).
Precision ( P ) = T P T P + F P
Recall or sensitivity is a metric of the model’s completeness. It quantifies the model’s prowess in accurately identifying all samples harboring tumors, with an emphasis on minimizing false negatives, as defined in Equation (10).
Recall ( R ) = T P T P + F N
F1-score balances between precision and recall, ensuring that a model is adept in both exactness and thoroughness. Defined in Equation (11), an exemplary F1-score symbolizes a model that sustains an equilibrium between these two crucial KPIs.
F 1-score = 2 × P × R P + R
Specificity measures the model’s aptitude in correctly classifying non-tumorous instances. It is paramount for negating false positives, ensuring non-pathological regions are not erroneously marked as malignant. The formula for specificity, given in Equation (12), is:
Specificity = T N T N + F P
Average precision (mAP) is the mean of precision values at varying recall levels, offering a consolidated score that represents the model’s precision capabilities across different thresholds. It is especially pertinent when dealing with multiple classes or when assessing performance across different decision thresholds.
mAP = 1 | Q | q = 1 | Q | P ( q )
where Q is the set of recall levels.
Collectively, these KPIs provide the bedrock of our evaluation methodology, offering both a detailed and comprehensive perspective into the model’s diagnostic capabilities in the intricate sphere of brain tumor detection.

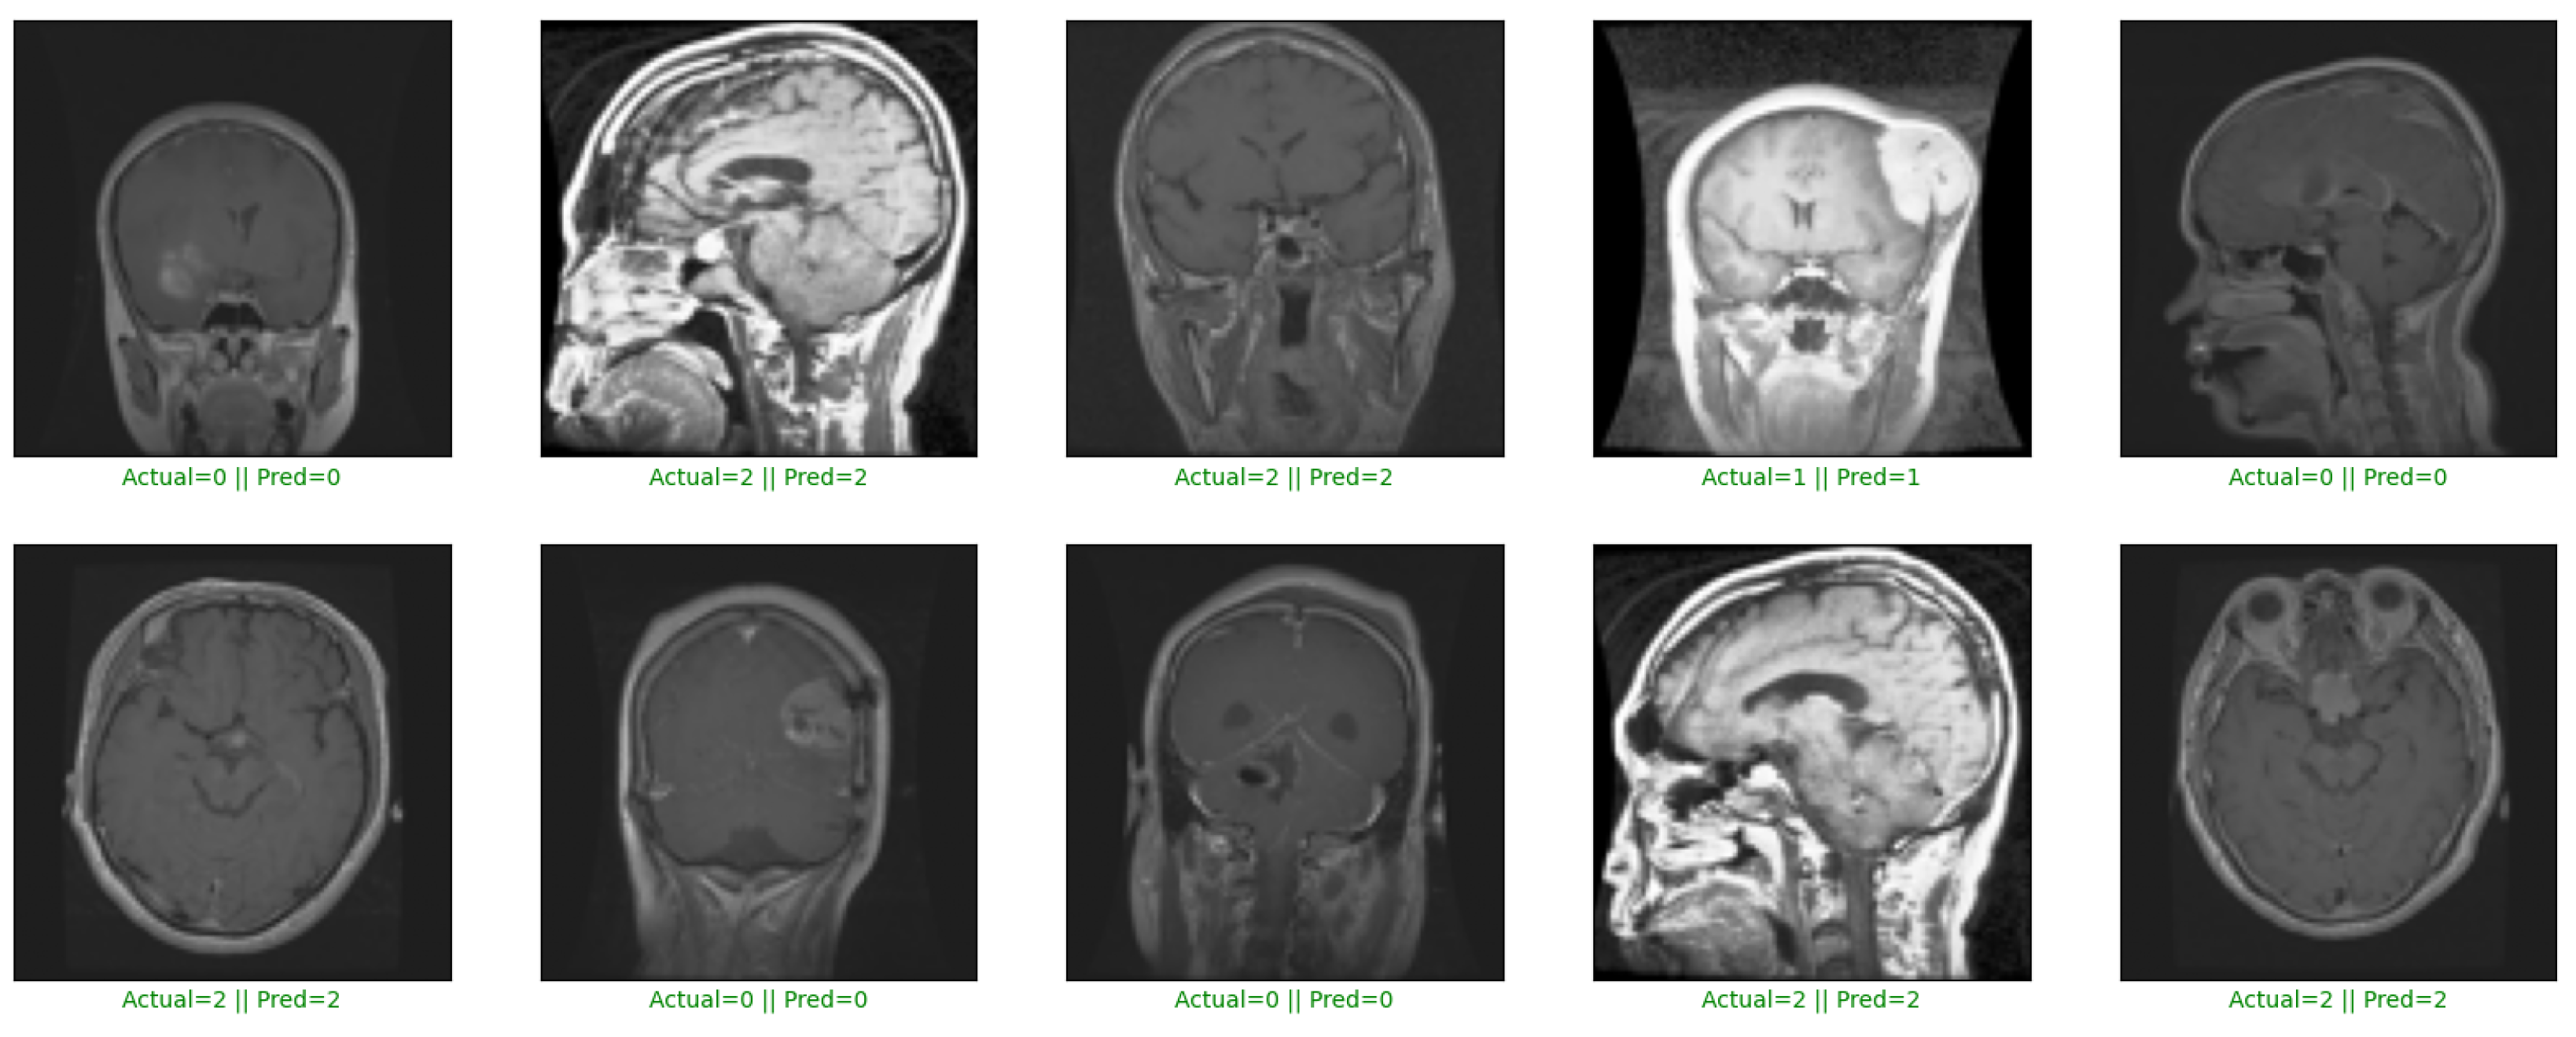
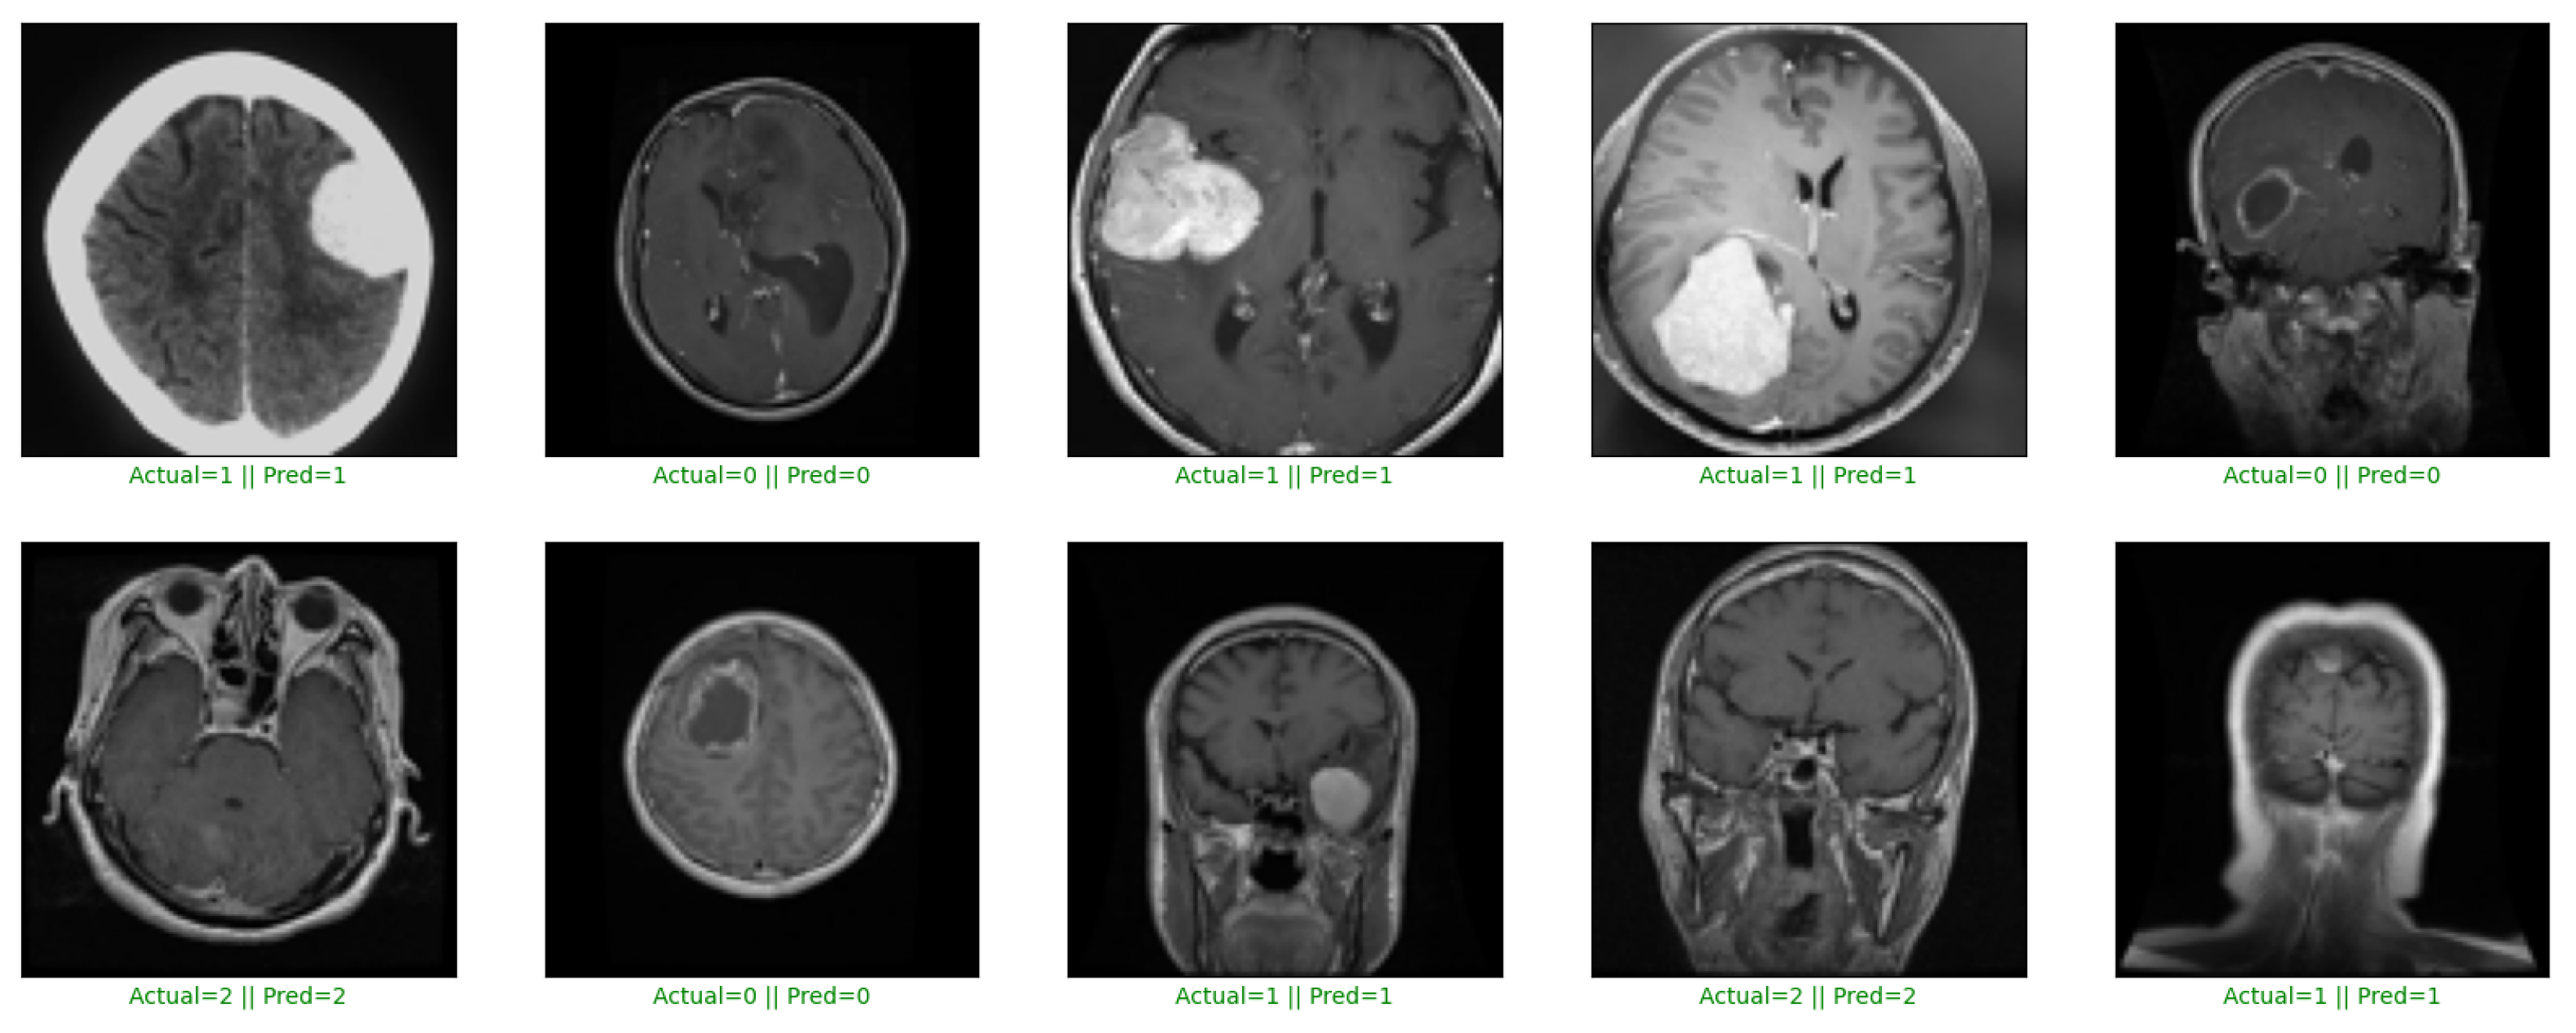
4.2. Experimental Result

4.2.1. Performance Results on Dataset 1

To examine the capability and reliability of our proposed CNN model for brain tumor detection, a thorough experiment was conducted on Dataset 1 [38]. To establish a benchmark, we compared our results with several SOTA techniques, including VGG16, VGG19, MobileNet, EfficientNet, ResNet50, Xception, and DenseNet121. The findings of our study depict that the proposed model displayed outstanding performance, strengthening its potential for deployment in real-time brain tumor detection systems. A detailed comparative analysis of our model against the benchmarks on Dataset 1 is presented in Table 4.
In terms of accuracy, the proposed model achieved 97.58% accuracy, which significantly outperformed other SOTA models such as VGG16 (96.74%), VGG19 (94.93%), MobileNet (96.14%), EfficientNet (58.57%), ResNet50 (96.50%), Xception (96.98%) and DenseNet121 (96.86%). In particular, the proposed model outperforms VGG16, VGG19, MobileNet, EfficientNet, ResNet50, Xception, and DenseNet121 by margins of 0.84, 2.65, 1.44, 39.01, 1.08, 0.60, and 0.72 percentage points, respectively.
In terms of precision, the proposed model has achieved a precision rate of 97.59%, which is significantly higher than other models such as VGG16, VGG19, MobileNet, EfficientNet, ResNet50, Xception, and DenseNet121, which scored 96.76%, 95.20%, 96.13%, 60.02%, 96.52%, 97.04%, and 96.86%, respectively. Precision measures the proportion of true positive predictions out of all positive predictions made by the model. The proposed model has superior precision as it asserts its reliability and minimizes false positive prediction nature. In particular, the proposed model outperforms VGG16, VGG19, MobileNet, EfficientNet, ResNet50, Xception and DenseNet121 by margins of 0.83%, 2.39%, 1.45%, 37.57%, 1.09%, 1.55%, and 0.73%, respectively, underscoring its effectiveness in correctly identifying positive cases.
The proposed model achieves a remarkable recall rate of 97.58%, outperforming VGG16 (96.74%), VGG19 (94.93%), MobileNet (96.14%), EfficientNet (58.57%), ResNet50 (96.50%), Xception (96.98%) and DenseNet121 (96.86%). In terms of F1-score, the proposed model achieves 97.58%, surpassing VGG16 (96.73%), VGG19 (94.90%), MobileNet (96.13%), EfficientNet (58.72%), ResNet50 (96.48%), Xception (96.99%) and DenseNet121 (96.85%). The proposed model outperforms VGG16, VGG19, MobileNet, EfficientNet, ResNet50, Xception, and DenseNet121 by margins of 0.85, 2.58, 1.45, 39.01, 1.08, 0.60, and 0.73 percentage points, respectively.
Furthermore, the model excels in specificity with a rate of 98.80%, compared to VGG16 (98.37%), VGG19 (97.44%), MobileNet (98.07%), EfficientNet (79.33%), ResNet50 (98.24%), Xception (99.70%) and DenseNet121 (98.50%). The specificity improvements range from 0.43% to 21.37%.

4.2.2. Performance Results on Dataset 2

Table 5 illustrates the performance of our proposed model with the SOTA models on Dataset 2 [39]. The proposed model achieved an accuracy of 98.79% on Dataset 2 [39] that significantly outperformed other SOTA models such as VGG16 (97.91%), VGG19 (96.42%), MobileNet (97.31%), EfficientNet (58.60%), ResNet50 (97.68%), Xception (97.91%) and DenseNet121 (96.84%). Specifically, our model outperformed VGG16, VGG19, MobileNet, EfficientNet, ResNet50, Xception, and DenseNet121 by 0.88, 2.37, 1.48, 40.19, 1.11, 0.88 and 1.95 percentage points, respectively. Furthermore, the proposed model has achieved a precision rate of 98.81% and outperforms VGG16, VGG19, MobileNet, EfficientNet, ResNet50, Xception, and DenseNet121, which scored 97.93%, 96.44%, 97.33%, 59.60%, 97.70%, 97.92% and 96.86%, respectively.
Our model achieved an impressive recall rate of 98.79%, outperforming VGG16 (97.91%), VGG19 (96.42%), MobileNet (97.31%), EfficientNet (58.58%), ResNet50 (97.67%), Xception (97.89%) and DenseNet121 (96.8%). In terms of the F1-score, our model showcased a result of 98.79%, exceeding VGG16 by 0.88, VGG19 by 2.37, MobileNet by 1.48, EfficientNet by 40.21, ResNet50 by 1.12, Xception by 0.90, and DenseNet121 by 1.96 percentage points.
Furthermore, our model showed superior specificity with a score of 99.39%, while VGG16 scored 98.52%, VGG19 97.23%, MobileNet 98.22%, EfficientNet 79.33%, ResNet50 98.39%, Xception 99.11%, and DenseNet121 98.25%. This underscores the improvements ranging from 0.86% to 20.06% compared to SOTA models.

4.2.3. Performance Results on Dataset 3

In the context of Dataset 3 [40], our proposed model achieved an accuracy rate of 97.18%, compared to SOTA models such as VGG16 (96.23%), VGG19 (94.72%), MobileNet (95.94%), EfficientNet (59.97%), ResNet50 (96.09%), Xception (96.30%) and DenseNet121 (95.95%). Our model outperforms VGG16, VGG19, MobileNet, EfficientNet, ResNet50, Xception, and DenseNet121, with a margin of 0.95%, 2.46%, 1.24%, 37.21%, 1.09%, 0.88%, and 1.23%, respectively. A detailed comparative analysis of the proposed model with the SOTA models is presented in Table 6.
Our model achieved an impressive precision score of 97.19% on Dataset 3 [40]. On the contrary, VGG16, VGG19, MobileNet, EfficientNet, ResNet50, Xception, and DenseNet121 achieved precision scores of 96.25%, 94.74%, 95.96%, 60.15%, 96.11%, 96.32%, and 95.97%, respectively. The proposed model is more precise than the SOTA models, with a margin of 0.94% over VGG16, 2.45% over VGG19, 1.23% over MobileNet, a remarkable 37.04% over EfficientNet, 1.08% over ResNet50, 0.87% over Xception, and 1.22% over DenseNet121.
Our model achieved a recall rate of 97.18% on Dataset 3, outperforming VGG16 (96.23%), VGG19 (94.72%), MobileNet (95.93%), EfficientNet (59.96%), ResNet50 (96.08%), Xception (96.29%) and DenseNet121 (95.94%). In terms of the F1 score, the proposed model achieved a 97.18%, surpassing VGG16, VGG19, MobileNet, EfficientNet, ResNet50, Xception, and DenseNet121 by 0.95, 2.46, 1.25, 37.22 1.10, 0.89, and 1.24 percentage points, respectively.
Our model performed impressively in specificity with a score of 98.59%, outperforming VGG16 (97.64%), VGG19 (96.03%), MobileNet (97.43%), EfficientNet (78.92%), ResNet50 (97.56%), Xception (98.01%) and DenseNet121 (97.40%). These results highlight improvements ranging from 0.58% to 19.67% compared to the SOTA models.

5. Discussion

In this section, we will present a comprehensive discussion of the results obtained from our proposed model designed for multimodal brain tumor detection and classification, as presented in the Result section. We will analyze and evaluate the strengths and weaknesses of our model based on its performance across three different datasets.
Our proposed model consistently exhibits remarkable accuracy across all three datasets. On Dataset 1, it achieves an impressive accuracy rate of 97.58%, outperforming SOTA models such as VGG16, VGG19, MobileNet, EfficientNet, ResNet50, Xception, and DenseNet121. This outstanding performance extends to Dataset 2 and Dataset 3, where our model maintains an accuracy rate of 98.79% and 97.18%, respectively. This exceptional accuracy firmly establishes our model as a robust candidate for precise and reliable brain tumor detection in clinical settings.
Furthermore, our model’s ability to efficiently and accurately distinguish between brain tumor and non-tumor images (as shown in Figure 3) is of paramount importance for clinicians, radiologists, and medical professionals. This high accuracy significantly reduces the risk of misdiagnosis, ensuring that patients receive the appropriate care and treatment. Furthermore, the adaptability of our model across diverse datasets improves its applicability in various clinical environments, making it a robust and reliable tool in the field of medical image analysis.
A salient feature of our model is its high precision, which measures its ability to make accurate positive predictions. Across all three datasets, our model consistently achieved precision rates that underline its ability to accurately identify brain tumors. For instance, on Dataset 2, our model attained a precision rate of 98.81% (as shown in Table 5), outperforming other models such as VGG16, VGG19, and MobileNet by margins of 0.88%, 2.37%, and 1.48% (as shown in Table 5). Precision is critical in medical diagnoses, ensuring reliable positive predictions and minimizing false positives (as shown in Figure 4), which can lead to unnecessary interventions and patient anxiety. The consistently high precision rate of our model across datasets underscores its suitability for clinical applications.
Our model demonstrated robust recall rates, demonstrating its ability to detect brain tumors effectively, even in challenging cases. Our model achieved a recall rate of 98.79% on Dataset 2, outperforming other models (as shown in Table 5). High recall is essential in medical applications to ensure comprehensive detection, as missing even a single positive case can have severe consequences for patients, causing delays in vital treatments or interventions. Therefore, our model’s ability to maintain a high recall rate reinforces its reliability in ensuring thorough and accurate detection of brain tumors, further enhancing its suitability for clinical use.
In terms of mAP, our model consistently achieves more than 99% results across all datasets. This reflects its robustness in tumor detection tasks. Additionally, our model consistently demonstrated robust specificity. On Dataset 3, our model achieved a specificity score of 98.59%, outperforming other models (as shown in Table 6). In the context of medical image analysis, this means correctly classifying images of healthy brain tissue as negative cases. The importance of specificity lies in its role in reducing false positive predictions. False positives occur when the model incorrectly identifies a healthy brain tissue image as containing a tumor.
The consistent and strong performance of our model highlights its reliability in accurately classifying images and minimizing false positive predictions. This attribute is crucial in clinical settings, where precision and confidence in the absence of false alarms are paramount to ensure patient well-being and minimize unnecessary medical interventions.

6. Conclusions

The accurate and precise detection and classification of brain tumors is a challenging task due to their complex and diverse manifestations. Current diagnostic techniques, including biopsies, magnetic resonance imaging (MRI), and computed tomography (CT) scans, face limitations such as invasiveness, time-consuming procedures, and potential sampling inaccuracies. Moreover, the variability in subjective evaluations by clinicians complicates tumor grading and impacts the decision-making process for treatment. To address these challenges, this study introduces a convolutional-block-based architecture, specifically designed for the precise detection and classification of multiclass brain tumors using MRI scans. Utilizing the advanced capabilities of convolutional neural networks (CNNs), the proposed model is evaluated on three publically available datasets and outperforms several state-of-the-art models such as VGG16, VGG19, MobileNet, EfficientNet, ResNet50, Xception, and DenseNet121 across a key performance metrics, such as accuracy, precision, recall, specificity, and mAP. Our model achieves an average accuracy of 97.85%, precision of 97.86%, recall of 97.85%, specificity of 98.89%, and a mean average precision (mAP) of 99.39%. The adaptability of our model to various MRI modalities significantly enhances its clinical applicability.
To ensure the robustness and accuracy of our proposed model, it is essential to perform further analysis using larger and more diverse datasets. Such validation will necessitate continuous model refinement, hyperparameter adjustments, and training with diverse datasets. Our future goal is to augment the proposed model’s ability to classify and detect different types of tumors, in addition to the overall number of tumors detected. Additionally, we plan to integrate Explainable AI to enhance the transparency and reliability of the model’s decision-making processes for clinical applications.

Author Contributions

Conceptualisation, M.A.K. and H.P.; methodology, M.A.K. and H.P.; software, M.A.K.; validation, M.A.K.; formal analysis, M.A.K. and H.P.; investigation, M.A.K. and H.P.; resources, H.P.; data curation, M.A.K. and H.P.; writing—original draft preparation, M.A.K.; writing—review and editing, M.A.K. and H.P.; visualisation, M.A.K. and H.P.; supervision, H.P.; project administration, H.P.; funding acquisition, H.P. All authors have read and agreed to the published version of the manuscript.

Funding

This research was funded by a 2022 Research Grant from Sangmyung University, Republic of Korea.

Institutional Review Board Statement

This study was conducted in accordance with the Declaration of Helsinki. It involved the analysis of anonymized medical imaging data, thereby ensuring participant confidentiality and data privacy. No direct patient interventions were performed, and the research posed minimal risk to participants. All procedures and ethical considerations aligned with the guidelines set by our Institutional Review Board (IRB).

Informed Consent Statement

Not applicable.

Data Availability Statement

The datasets utilized in this study, comprising Muhammadd’s Brain Tumor MRI Images https://www.kaggle.com/datasets/muhammadd7/brain-tumor-mri-images (accessed on 10 September 2023), Masoud Nickparvar’s Brain Tumor MRI Dataset https://www.kaggle.com/datasets/masoudnickparvar/brain-tumor-mri-dataset (accessed on 10 September 2023), and Eldakrory, S. Brain Tumors MRI images https://www.kaggle.com/datasets/shadyeldakrory/shadyfinal3 (accessed on 10 October 2023), are publicly accessible via Kaggle.

Conflicts of Interest

The authors declare no conflicts of interest.

References

  1. Gore, D.V.; Deshpande, V. Comparative study of various techniques using deep Learning for brain tumor detection. In Proceedings of the 2020 International Conference for Emerging Technology (INCET), Belgaum, India, 5–7 June 2020; IEEE: Piscataway, NJ, USA, 2020; pp. 1–4. [Google Scholar]
  2. Gliomas and Its Symptoms and Causes; Johns Hopkins Medicine: Baltimore, MD, USA, 2022; Available online: https://www.hopkinsmedicine.org/health/conditions-and-diseases/gliomas (accessed on 10 September 2023).
  3. Pituitary Tumors—Symptoms and Causes; Mayo Clinic: Rochester, MN, USA, 2022; Available online: https://www.hopkinsmedicine.org/health/conditions-and-diseases/pituitary-tumors (accessed on 10 September 2023).
  4. Meningioma, Risk Its Symptoms; Johns Hopkins Medicine: Baltimore, MD, USA, 2022; Available online: https://www.hopkinsmedicine.org/health/conditions-and-diseases/meningioma (accessed on 10 September 2023).
  5. Rasheed, Z.; Ma, Y.K.; Ullah, I.; Ghadi, Y.Y.; Khan, M.Z.; Khan, M.A.; Abdusalomov, A.; Alqahtani, F.; Shehata, A.M. Brain tumor classification from MRI using image enhancement and convolutional neural network techniques. Brain Sci. 2023, 13, 1320. [Google Scholar] [CrossRef] [PubMed]
  6. McFaline-Figueroa, J.R.; Lee, E.Q. Brain tumors. Am. J. Med. 2018, 131, 874–882. [Google Scholar] [CrossRef] [PubMed]
  7. Payne, L.S.; Huang, P.H. The pathobiology of collagens in glioma. Mol. Cancer Res. 2013, 11, 1129–1140. [Google Scholar] [CrossRef] [PubMed]
  8. Wen, P.Y.; Kesari, S. Malignant gliomas in adults. N. Engl. J. Med. 2008, 359, 492–507. [Google Scholar] [CrossRef] [PubMed]
  9. Gupta, A.; Dwivedi, T. A simplified overview of World Health Organization classification update of central nervous system tumors 2016. J. Neurosci. Rural Pract. 2017, 8, 629–641. [Google Scholar] [CrossRef]
  10. Melmed, S. Pathogenesis of pituitary tumors. Nat. Rev. Endocrinol. 2011, 7, 257–266. [Google Scholar] [CrossRef]
  11. Rogers, L.; Barani, I.; Chamberlain, M.; Kaley, T.J.; McDermott, M.; Raizer, J.; Schiff, D.; Weber, D.C.; Wen, P.Y.; Vogelbaum, M.A. Meningiomas: Knowledge base, treatment outcomes, and uncertainties. A RANO review. J. Neurosurg. 2015, 122, 4–23. [Google Scholar] [CrossRef]
  12. Zhao, L.; Zhao, W.; Hou, Y.; Wen, C.; Wang, J.; Wu, P.; Guo, Z. An overview of managements in meningiomas. Front. Oncol. 2020, 10, 1523. [Google Scholar] [CrossRef]
  13. Holleczek, B.; Zampella, D.; Urbschat, S.; Sahm, F.; von Deimling, A.; Oertel, J.; Ketter, R. Incidence, mortality and outcome of meningiomas: A population-based study from Germany. Cancer Epidemiol. 2019, 62, 101562. [Google Scholar] [CrossRef]
  14. Perry, A. Meningiomas. In Practical Surgical Neuropathology: A Diagnostic Approach; Elsevier: Amsterdam, The Netherlands, 2018; pp. 259–298. [Google Scholar]
  15. Komaki, K.; Sano, N.; Tangoku, A. Problems in histological grading of malignancy and its clinical significance in patients with operable breast cancer. Breast Cancer 2006, 13, 249–253. [Google Scholar] [CrossRef]
  16. Grant, R.; Dowswell, T.; Tomlinson, E.; Brennan, P.M.; Walter, F.M.; Ben-Shlomo, Y.; Hunt, D.W.; Bulbeck, H.; Kernohan, A.; Robinson, T.; et al. Interventions to reduce the time to diagnosis of brain tumours. Cochrane Database Syst. Rev. 2020, 2020, CD013564. [Google Scholar] [CrossRef]
  17. Shehab, M.; Abualigah, L.; Shambour, Q.; Abu-Hashem, M.A.; Shambour, M.K.Y.; Alsalibi, A.I.; Gandomi, A.H. Machine learning in medical applications: A review of state-of-the-art methods. Comput. Biol. Med. 2022, 145, 105458. [Google Scholar] [CrossRef] [PubMed]
  18. Fernando, T.; Gammulle, H.; Denman, S.; Sridharan, S.; Fookes, C. Deep learning for medical anomaly detection–a survey. ACM Comput. Surv. (CSUR) 2021, 54, 1–37. [Google Scholar] [CrossRef]
  19. Frid-Adar, M.; Diamant, I.; Klang, E.; Amitai, M.; Goldberger, J.; Greenspan, H. GAN-based synthetic medical image augmentation for increased CNN performance in liver lesion classification. Neurocomputing 2018, 321, 321–331. [Google Scholar] [CrossRef]
  20. Ge, C.; Gu, I.Y.H.; Jakola, A.S.; Yang, J. Deep learning and multi-sensor fusion for glioma classification using multistream 2D convolutional networks. In Proceedings of the 2018 40th Annual International Conference of the IEEE Engineering in Medicine and Biology Society (EMBC), Honolulu, HI, USA, 18–21 July 2018; IEEE: Piscataway, NJ, USA, 2018; pp. 5894–5897. [Google Scholar]
  21. Ge, C.; Gu, I.Y.H.; Jakola, A.S.; Yang, J. Enlarged training dataset by pairwise GANs for molecular-based brain tumor classification. IEEE Access 2020, 8, 22560–22570. [Google Scholar] [CrossRef]
  22. Mzoughi, H.; Njeh, I.; Wali, A.; Slima, M.B.; BenHamida, A.; Mhiri, C.; Mahfoudhe, K.B. Deep multi-scale 3D convolutional neural network (CNN) for MRI gliomas brain tumor classification. J. Digit. Imaging 2020, 33, 903–915. [Google Scholar] [CrossRef] [PubMed]
  23. Dixit, A.; Nanda, A. An improved whale optimization algorithm-based radial neural network for multi-grade brain tumor classification. Vis. Comput. 2021, 38, 3525–3540. [Google Scholar] [CrossRef]
  24. Chan, H.P.; Hadjiiski, L.M.; Samala, R.K. Computer-aided diagnosis in the era of deep learning. Med. Phys. 2020, 47, e218–e227. [Google Scholar] [CrossRef]
  25. Lynch, C.J.; Liston, C. New machine-learning technologies for computer-aided diagnosis. Nat. Med. 2018, 24, 1304–1305. [Google Scholar] [CrossRef]
  26. Tanvir Rouf Shawon, M.; Shahariar Shibli, G.; Ahmed, F.; Saha Joy, S.K. Explainable Cost-Sensitive Deep Neural Networks for Brain Tumor Detection from Brain MRI Images considering Data Imbalance. arXiv 2023, arXiv:2308.00608. [Google Scholar] [CrossRef]
  27. Kayalibay, B.; Jensen, G.; van der Smagt, P. CNN-based segmentation of medical imaging data. arXiv 2017, arXiv:1701.03056. [Google Scholar]
  28. Matsoukas, C.; Haslum, J.F.; Söderberg, M.; Smith, K. Pretrained ViTs Yield Versatile Representations For Medical Images. arXiv 2023, arXiv:2303.07034. [Google Scholar]
  29. Tajbakhsh, N.; Shin, J.Y.; Gurudu, S.R.; Hurst, R.T.; Kendall, C.B.; Gotway, M.B.; Liang, J. Convolutional neural networks for medical image analysis: Full training or fine tuning? IEEE Trans. Med. Imaging 2016, 35, 1299–1312. [Google Scholar] [CrossRef] [PubMed]
  30. Cheng, J.; Huang, W.; Cao, S.; Yang, R.; Yang, W.; Yun, Z.; Wang, Z.; Feng, Q. Enhanced performance of brain tumor classification via tumor region augmentation and partition. PLoS ONE 2015, 10, e0140381. [Google Scholar] [CrossRef] [PubMed]
  31. David, D.; Arun, L. Classification of brain tumor type and grade using MRI texture and shape in a machine learning scheme. Artech J. Eff. Res. Eng. Technol. 2020, 1, 57–63. [Google Scholar]
  32. Pashaei, A.; Sajedi, H.; Jazayeri, N. Brain tumor classification via convolutional neural network and extreme learning machines. In Proceedings of the 2018 8th International Conference on Computer and Knowledge Engineering (ICCKE), Virtual, 25–26 October 2018; IEEE: Piscataway, NJ, USA, 2018; pp. 314–319. [Google Scholar]
  33. Kaplan, K.; Kaya, Y.; Kuncan, M.; Ertunç, H.M. Brain tumor classification using modified local binary patterns (LBP) feature extraction methods. Med. Hypotheses 2020, 139, 109696. [Google Scholar] [CrossRef]
  34. Pinho, M.C.; Bera, K.; Beig, N.; Tiwari, P. MRI Morphometry in brain tumors: Challenges and opportunities in expert, radiomic, and deep-learning-based analyses. Brain Tumors 2021, 158, 323–368. [Google Scholar]
  35. Saeedi, S.; Rezayi, S.; Keshavarz, H.; R Niakan Kalhori, S. MRI-based brain tumor detection using convolutional deep learning methods and chosen machine learning techniques. BMC Med. Inform. Decis. Mak. 2023, 23, 16. [Google Scholar] [CrossRef]
  36. Abdusalomov, A.B.; Mukhiddinov, M.; Whangbo, T.K. Brain tumor detection based on deep learning approaches and magnetic resonance imaging. Cancers 2023, 15, 4172. [Google Scholar] [CrossRef]
  37. Ahuja, S.; Panigrahi, B.; Gandhi, T. Transfer learning based brain tumor detection and segmentation using superpixel technique. In Proceedings of the 2020 International Conference on Contemporary Computing and Applications (IC3A), Lucknow, India, 5–7 February 2020; IEEE: Piscataway, NJ, USA, 2020; pp. 244–249. [Google Scholar]
  38. Muhammadd. Brain Tumor MRI Images; Kaggle: San Francisco, CA, USA, 2023; Available online: https://www.kaggle.com/datasets/muhammadd7/brain-tumor-mri-images (accessed on 10 January 2023).
  39. Nickparvar, M. Brain Tumor MRI Dataset; Kaggle: San Francisco, CA, USA, 2021. [Google Scholar] [CrossRef]
  40. Eldakrory, S. Brain Tumors MRI Images; Kaggle: San Francisco, CA, USA, 2023; Available online: https://www.kaggle.com/datasets/shadyeldakrory/shadyfinal3 (accessed on 10 January 2023).
  41. Soltaninejad, M.; Zhang, L.; Lambrou, T.; Allinson, N.; Ye, X. Multimodal MRI brain tumor segmentation using random forests with features learned from fully convolutional neural network. arXiv 2017, arXiv:1704.08134. [Google Scholar]
  42. Nguyen, H.T.; Le, T.T.; Nguyen, T.V.; Nguyen, N.T. Enhancing MRI brain tumor segmentation with an additional classification network. In Proceedings of the International MICCAI Brainlesion Workshop, Lima, Peru, 4 October 2020; Springer: Berlin/Heidelberg, Germany, 2020; pp. 503–513. [Google Scholar]
  43. Maurya, U.; Kalyan, A.K.; Bohidar, S.; Sivakumar, D.S. Detection and Classification of Glioblastoma Brain Tumor. arXiv 2023, arXiv:2304.09133. [Google Scholar]
  44. Balaji, G.; Sen, R.; Kirty, H. Detection and Classification of Brain tumors Using Deep Convolutional Neural Networks. arXiv 2022, arXiv:2208.13264. [Google Scholar]
  45. Siddique, M.A.B.; Sakib, S.; Khan, M.M.R.; Tanzeem, A.K.; Chowdhury, M.; Yasmin, N. Deep convolutional neural networks model-based brain tumor detection in brain MRI images. In Proceedings of the 2020 Fourth International Conference on I-SMAC (IoT in Social, Mobile, Analytics and Cloud) (I-SMAC), Palladam, India, 7–9 October 2020; IEEE: Piscataway, NJ, USA, 2020; pp. 909–914. [Google Scholar]
  46. Hamran, A.; Vaeztourshizi, M.; Esmaili, A.; Pedram, M. Brain Tumor Detection using Convolutional Neural Networks with Skip Connections. arXiv 2023, arXiv:2307.07503. [Google Scholar]
  47. Karimi, D.; Gholipour, A. Improving calibration and out-of-distribution detection in deep models for medical image segmentation. IEEE Trans. Artif. Intell. 2022, 4, 383–397. [Google Scholar] [CrossRef] [PubMed]
  48. Fard, A.S.; Reutens, D.C.; Vegh, V. CNNs and GANs in MRI-based cross-modality medical image estimation. arXiv 2021, arXiv:2106.02198. [Google Scholar]
  49. Gumaei, A.; Hassan, M.M.; Hassan, M.R.; Alelaiwi, A.; Fortino, G. A hybrid feature extraction method with regularized extreme learning machine for brain tumor classification. IEEE Access 2019, 7, 36266–36273. [Google Scholar] [CrossRef]
  50. Swati, Z.N.K.; Zhao, Q.; Kabir, M.; Ali, F.; Ali, Z.; Ahmed, S.; Lu, J. Brain tumor classification for MR images using transfer learning and fine-tuning. Comput. Med. Imaging Graph. 2019, 75, 34–46. [Google Scholar] [CrossRef] [PubMed]
  51. Kumar, R.L.; Kakarla, J.; Isunuri, B.V.; Singh, M. Multi-class brain tumor classification using residual network and global average pooling. Multimed. Tools Appl. 2021, 80, 13429–13438. [Google Scholar] [CrossRef]
  52. Aamir, M.; Rahman, Z.; Dayo, Z.A.; Abro, W.A.; Uddin, M.I.; Khan, I.; Imran, A.S.; Ali, Z.; Ishfaq, M.; Guan, Y.; et al. A deep learning approach for brain tumor classification using MRI images. Comput. Electr. Eng. 2022, 101, 108105. [Google Scholar] [CrossRef]
  53. Dehkordi, A.A.; Hashemi, M.; Neshat, M.; Mirjalili, S.; Sadiq, A.S. Brain Tumor Detection and Classification Using a New Evolutionary Convolutional Neural Network. arXiv 2022, arXiv:2204.12297. [Google Scholar] [CrossRef]
  54. Szegedy, C.; Vanhoucke, V.; Ioffe, S.; Shlens, J.; Wojna, Z. Rethinking the inception architecture for computer vision. In Proceedings of the IEEE Conference on Computer Vision and Pattern Recognition, Las Vegas, NV, USA, 27–30 June 2016; pp. 2818–2826. [Google Scholar]
  55. Simonyan, K.; Zisserman, A. Very deep convolutional networks for large-scale image recognition. arXiv 2014, arXiv:1409.1556. [Google Scholar]
  56. Zou, Z.; Chen, K.; Shi, Z.; Guo, Y.; Ye, J. Object detection in 20 years: A survey. Proc. IEEE 2023, 111, 257–276. [Google Scholar] [CrossRef]
  57. Abd El Kader, I.; Xu, G.; Shuai, Z.; Saminu, S.; Javaid, I.; Salim Ahmad, I. Differential deep convolutional neural network model for brain tumor classification. Brain Sci. 2021, 11, 352. [Google Scholar] [CrossRef] [PubMed]
Figure 1. Brain tumor types: (a) glioma (b) pituitary (c) meningioma.
Electronics 13 00364 g001
Figure 2. Block diagram of the proposed framework architecture.
Electronics 13 00364 g002
Figure 3. Multi-modal brain tumor detection and classification on Dataset 1.
Electronics 13 00364 g003
Figure 4. Multi-modal brain tumor detection and classification on Dataset 2.
Electronics 13 00364 g004
Table 1. Detailed information for MRI image datasets.
NameTumor TypeTotal SizeTraining SizeValidation SizeTesting SizeLabel Distribution
Dataset 1 [38]Glioma19,22614,7183680828Glioma: 34.27%
PituitaryPituitary: 33.38%
MeningiomaMeningioma 32.35%
Dataset 2 [39]Glioma50233293824906Glioma: 32.29%
PituitaryPituitary: 34.97%
MeningiomaMeningioma 32.74%
Dataset 3 [40]Glioma19,22613,68627702770Glioma: 34.27%
PituitaryPituitary: 33.38%
MeningiomaMeningioma 32.35%
Total-43,47531,69772744504-
Table 2. Comparative analysis of performance on Dataset 1 [38].
Image Resolution
Size
Time
(in Seconds)
Resources Usage
(in MByte)
Accuracy (%)Precision (%)
32 × 321185.67.892.0292.29
50 × 501229.78.696.1396.17
80 × 801328.89.496.2596.37
100 × 1001874.417.297.5897.59
150 × 1502339.320.997.2297.36
Table 3. Detailed representation of the proposed framework architecture.
Layer NameOutput SizeKernel SizeStridesActivationNumber of Layers
Input100 × 100 × 3----
Conv2D98 × 98 × 323 × 31 × 1ReLU2
BatchNormalization----1
MaxPool2D49 × 49 × 322 × 22 × 2-1
Conv2D49 × 49 × 643 × 31 × 1ReLU3
BatchNormalization----1
MaxPool2D24 × 24 × 642 × 22 × 2-1
Conv2D24 × 24 × 1283 × 31 × 1ReLU3
BatchNormalization----1
MaxPool2D12 × 12 × 1282 × 22 × 2-1
Conv2D12 × 12 × 2563 × 31 × 1ReLU2
Conv2D12 × 12 × 5123 × 31 × 1ReLU2
GlobalAveragePooling----1
Dense128--ReLU1
Dropout----1
DenseNumber of Classes--Softmax1
Table 4. Comparing brain tumor detection and classification performance on Dataset 1.
ModelAccuracy (%)Precision (%)Recall (%)F1-Score (%)Specificity (%)mAP (%)Memory (MByte)
VGG1696.7496.7696.7496.7398.3799.2911.6
VGG1994.9395.2094.9394.9097.4499.1514.2
MobileNet96.1496.1396.1496.1398.0798.9614.2
EfficientNet58.5760.0258.5758.7279.3368.6914.2
ResNet5096.5096.5296.5096.4898.2499.4616.4
Xception96.9897.0496.9896.9999.7099.4317.2
DenseNet12196.8696.8696.8696.8598.5098.4311.9
Proposed Model97.5897.5997.5897.5898.8099.0317.2
Table 5. Comparing brain tumor detection and classification performance on Dataset 2.
ModelAccuracy (%)Precision (%)Recall (%)F1-Score (%)Specificity (%)mAP (%)Memory (MByte)
VGG1695.2595.5495.2595.2797.6399.525.9
VGG1997.3597.3997.3597.3598.6799.637.2
MobileNet97.3597.4097.3597.3598.6899.527.2
EfficientNet38.1924.8438.1929.0869.0945.237.2
ResNet5098.2398.2498.2398.2398.9599.768.2
Xception97.9097.9297.9097.9198.9599.868.6
DenseNet12197.1397.1497.1397.1298.5699.306.0
Proposed Model98.7998.8198.7998.7999.3999.938.9
Table 6. Comparing brain tumor detection and classification performance on Dataset 3.
ModelAccuracy (%)Precision (%)Recall (%)F1 Score (%)Specificity (%)mAP (%)Memory (MByte)
VGG1692.8593.1892.8592.8596.4098.4816.4
VGG1995.5295.5295.5295.5197.7699.2214.2
MobileNet96.6496.6596.6496.6398.3299.1510.9
EfficientNet70.6570.5670.6570.6085.3478.1013.4
ResNet5096.7596.7496.7596.7498.3899.4014.1
Xception96.6496.6696.6496.6598.3399.2714.9
DenseNet12196.7596.7696.7596.7598.3899.2516.4
Proposed Model97.1897.1997.1897.1898.5999.7010.5
Disclaimer/Publisher’s Note: The statements, opinions and data contained in all publications are solely those of the individual author(s) and contributor(s) and not of MDPI and/or the editor(s). MDPI and/or the editor(s) disclaim responsibility for any injury to people or property resulting from any ideas, methods, instructions or products referred to in the content.

