


Table Structure Recognition Method Based on Lightweight Network and Channel Attention

Abstract
:1. Introduction
- In this paper, we use a more lightweight network. The backbone network ResNet18 of the RCANet [19] model is replaced by a lightweight ShuffleNetv2 network, which greatly reduces the volume and parameters of the model;
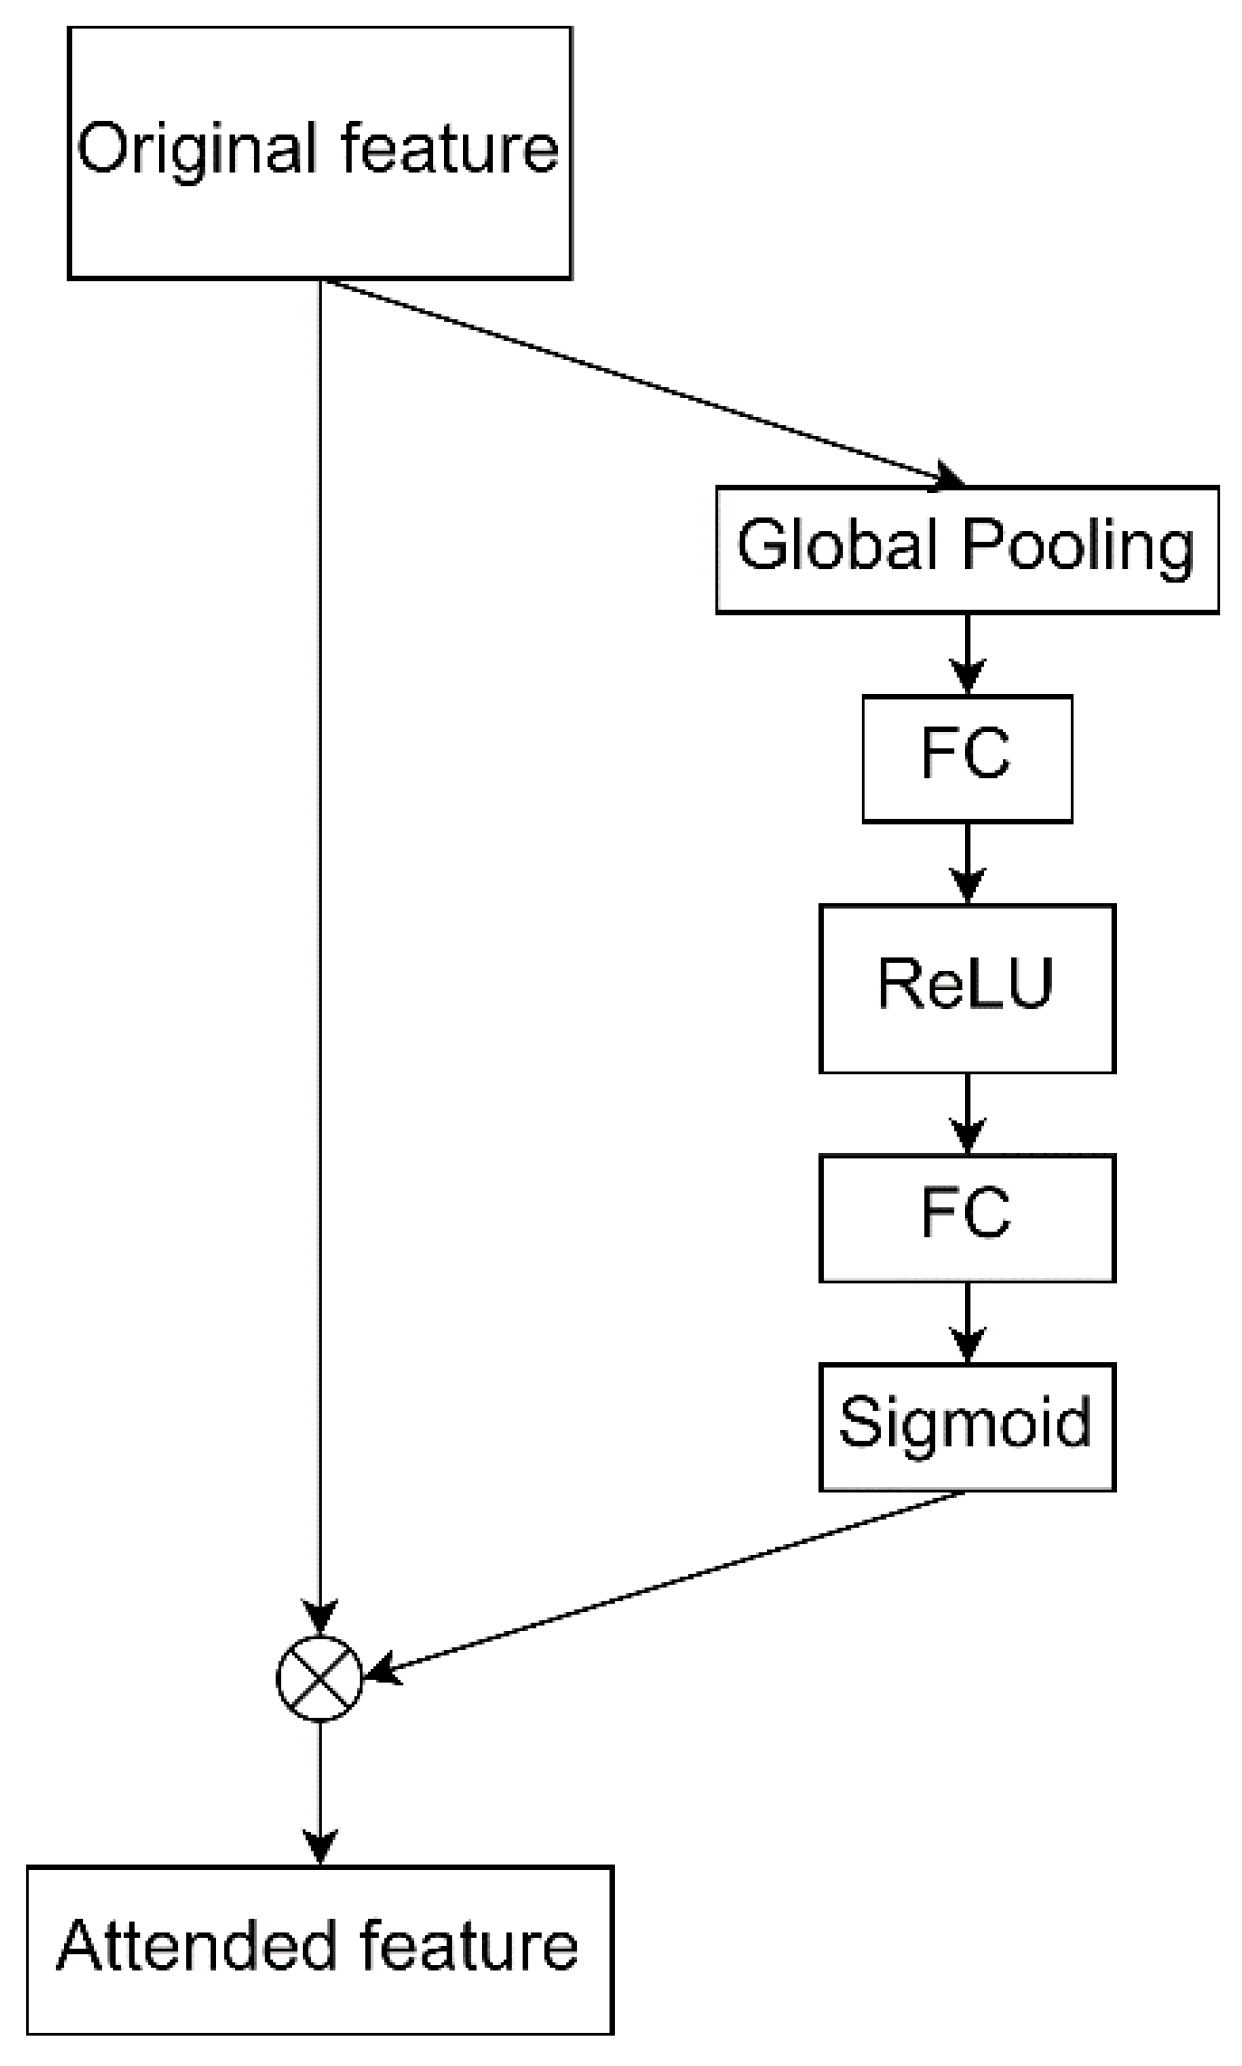
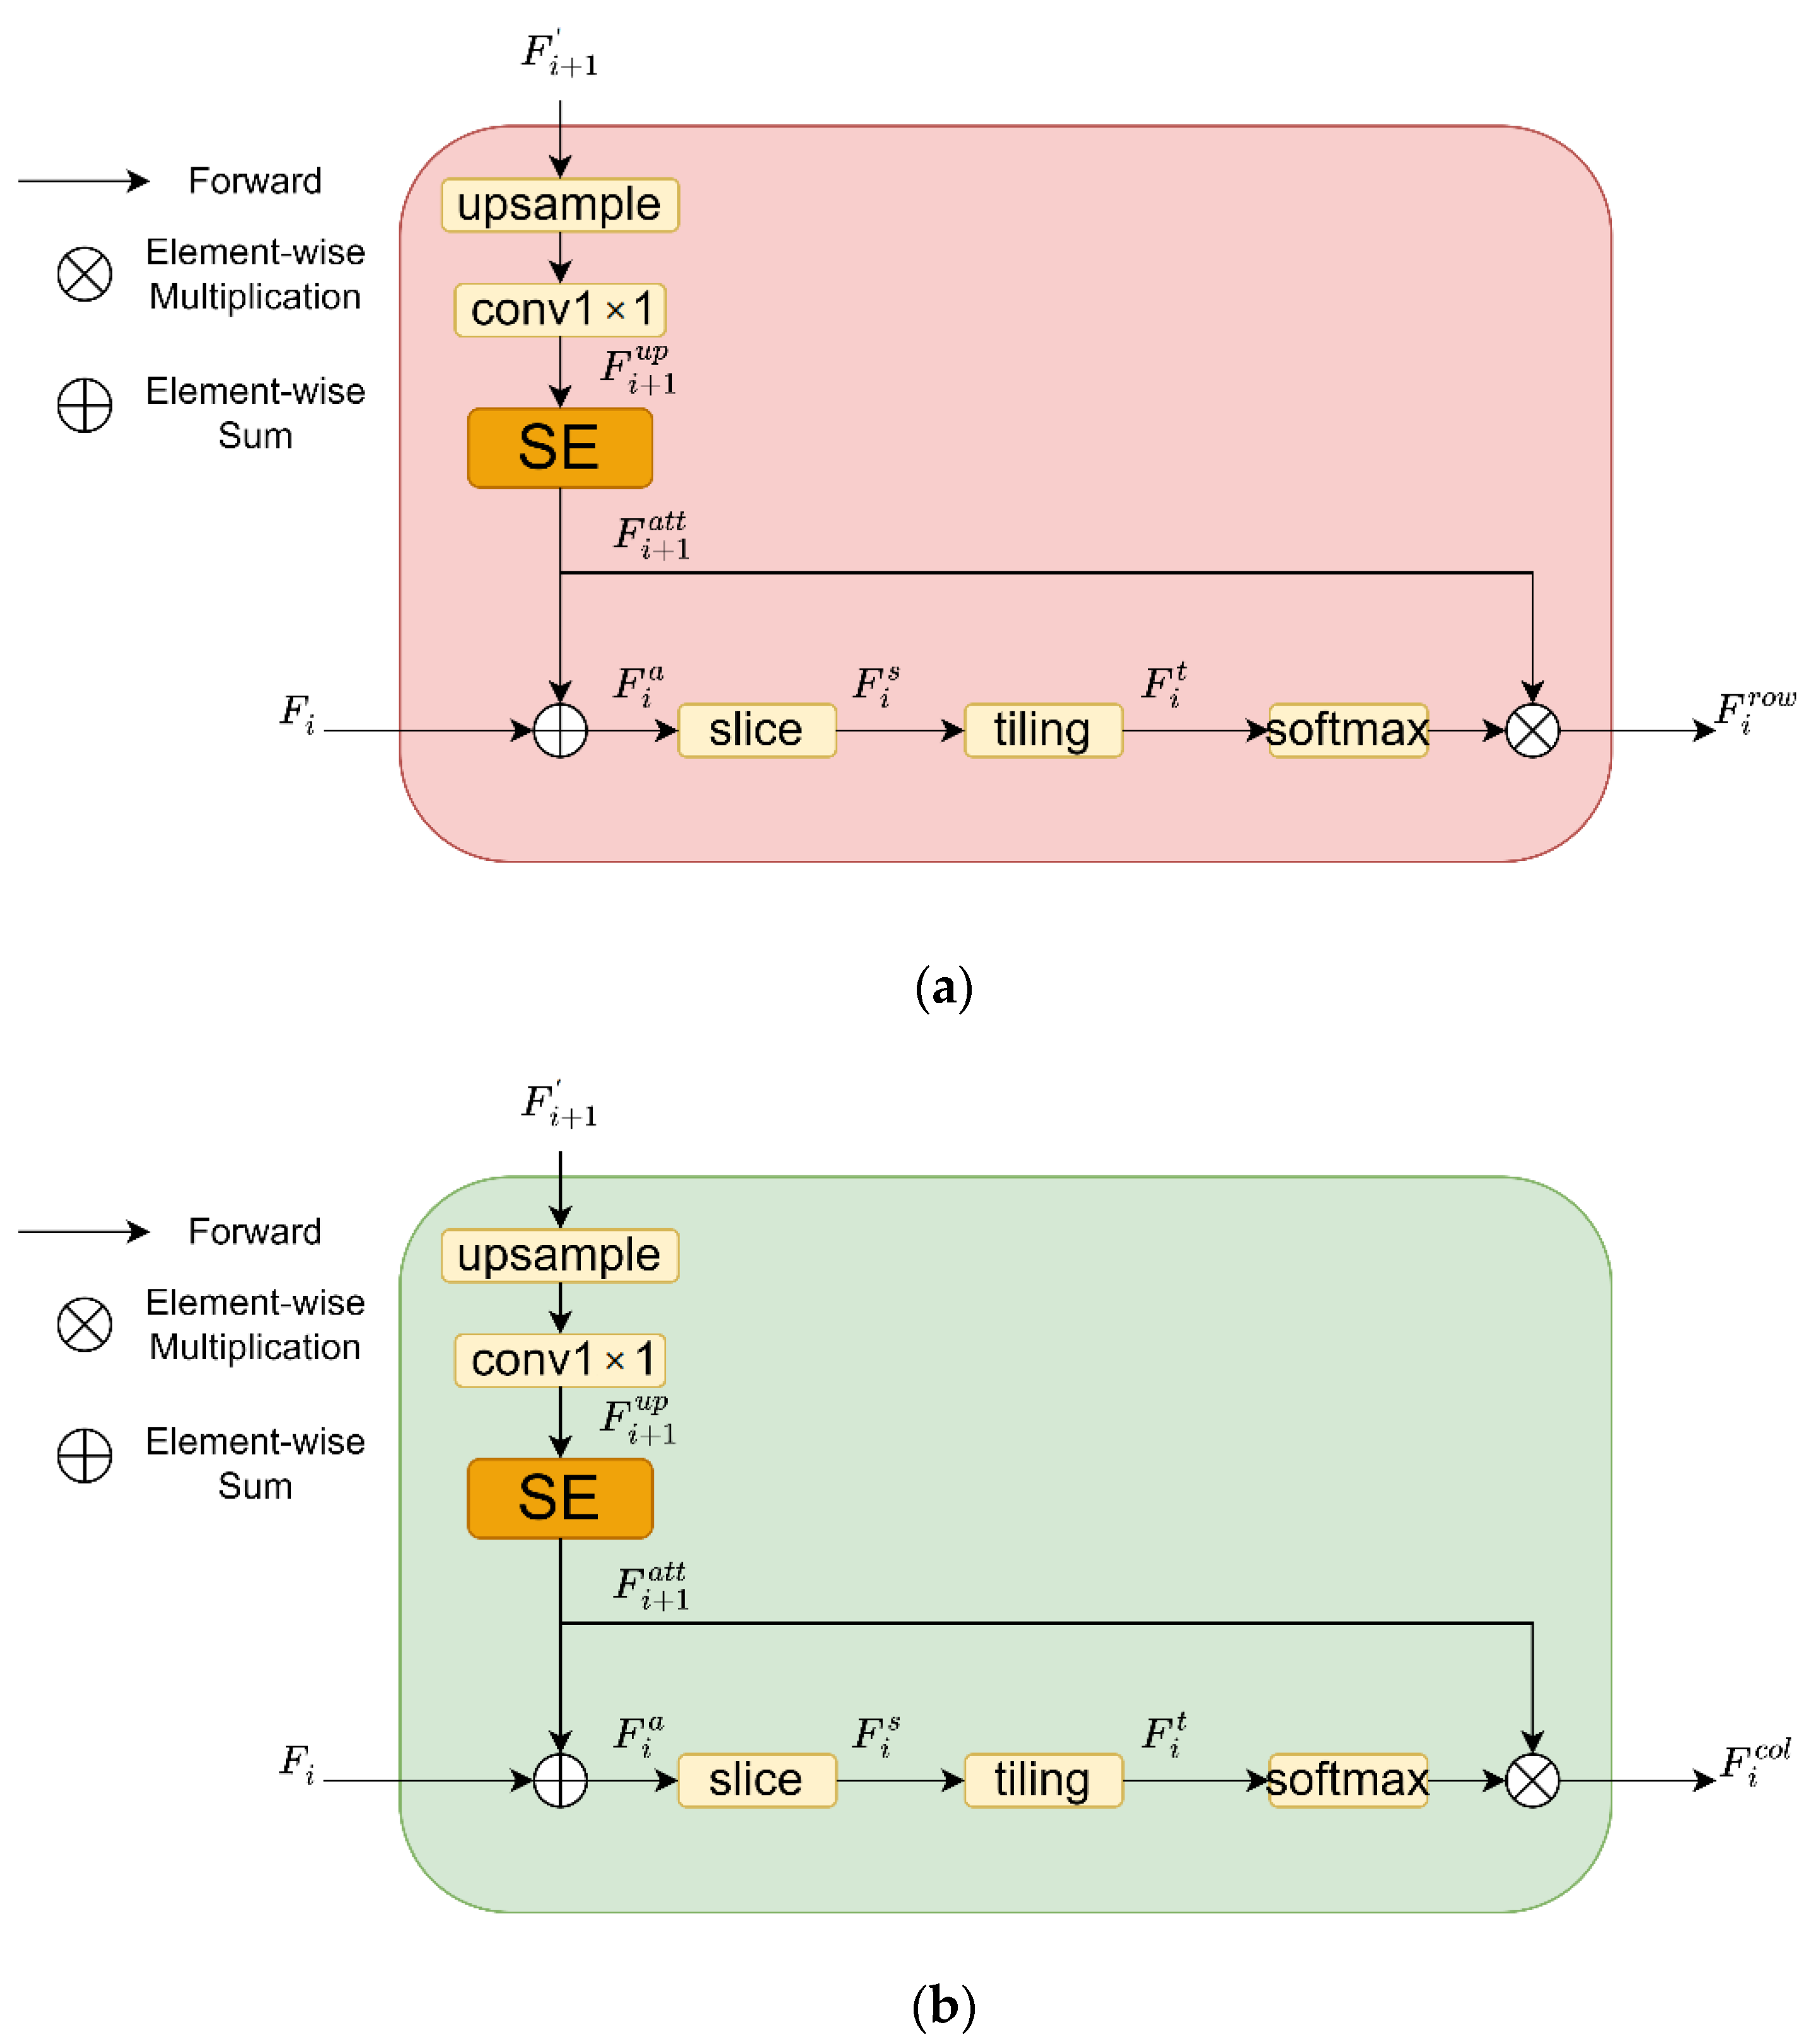
- In this paper, we add the squeeze and excitation (SE) [25] module to the rows and columns aggregated module of RCANet, so that the row–column feature information has channel attention and improves the performance of the lightweight model;
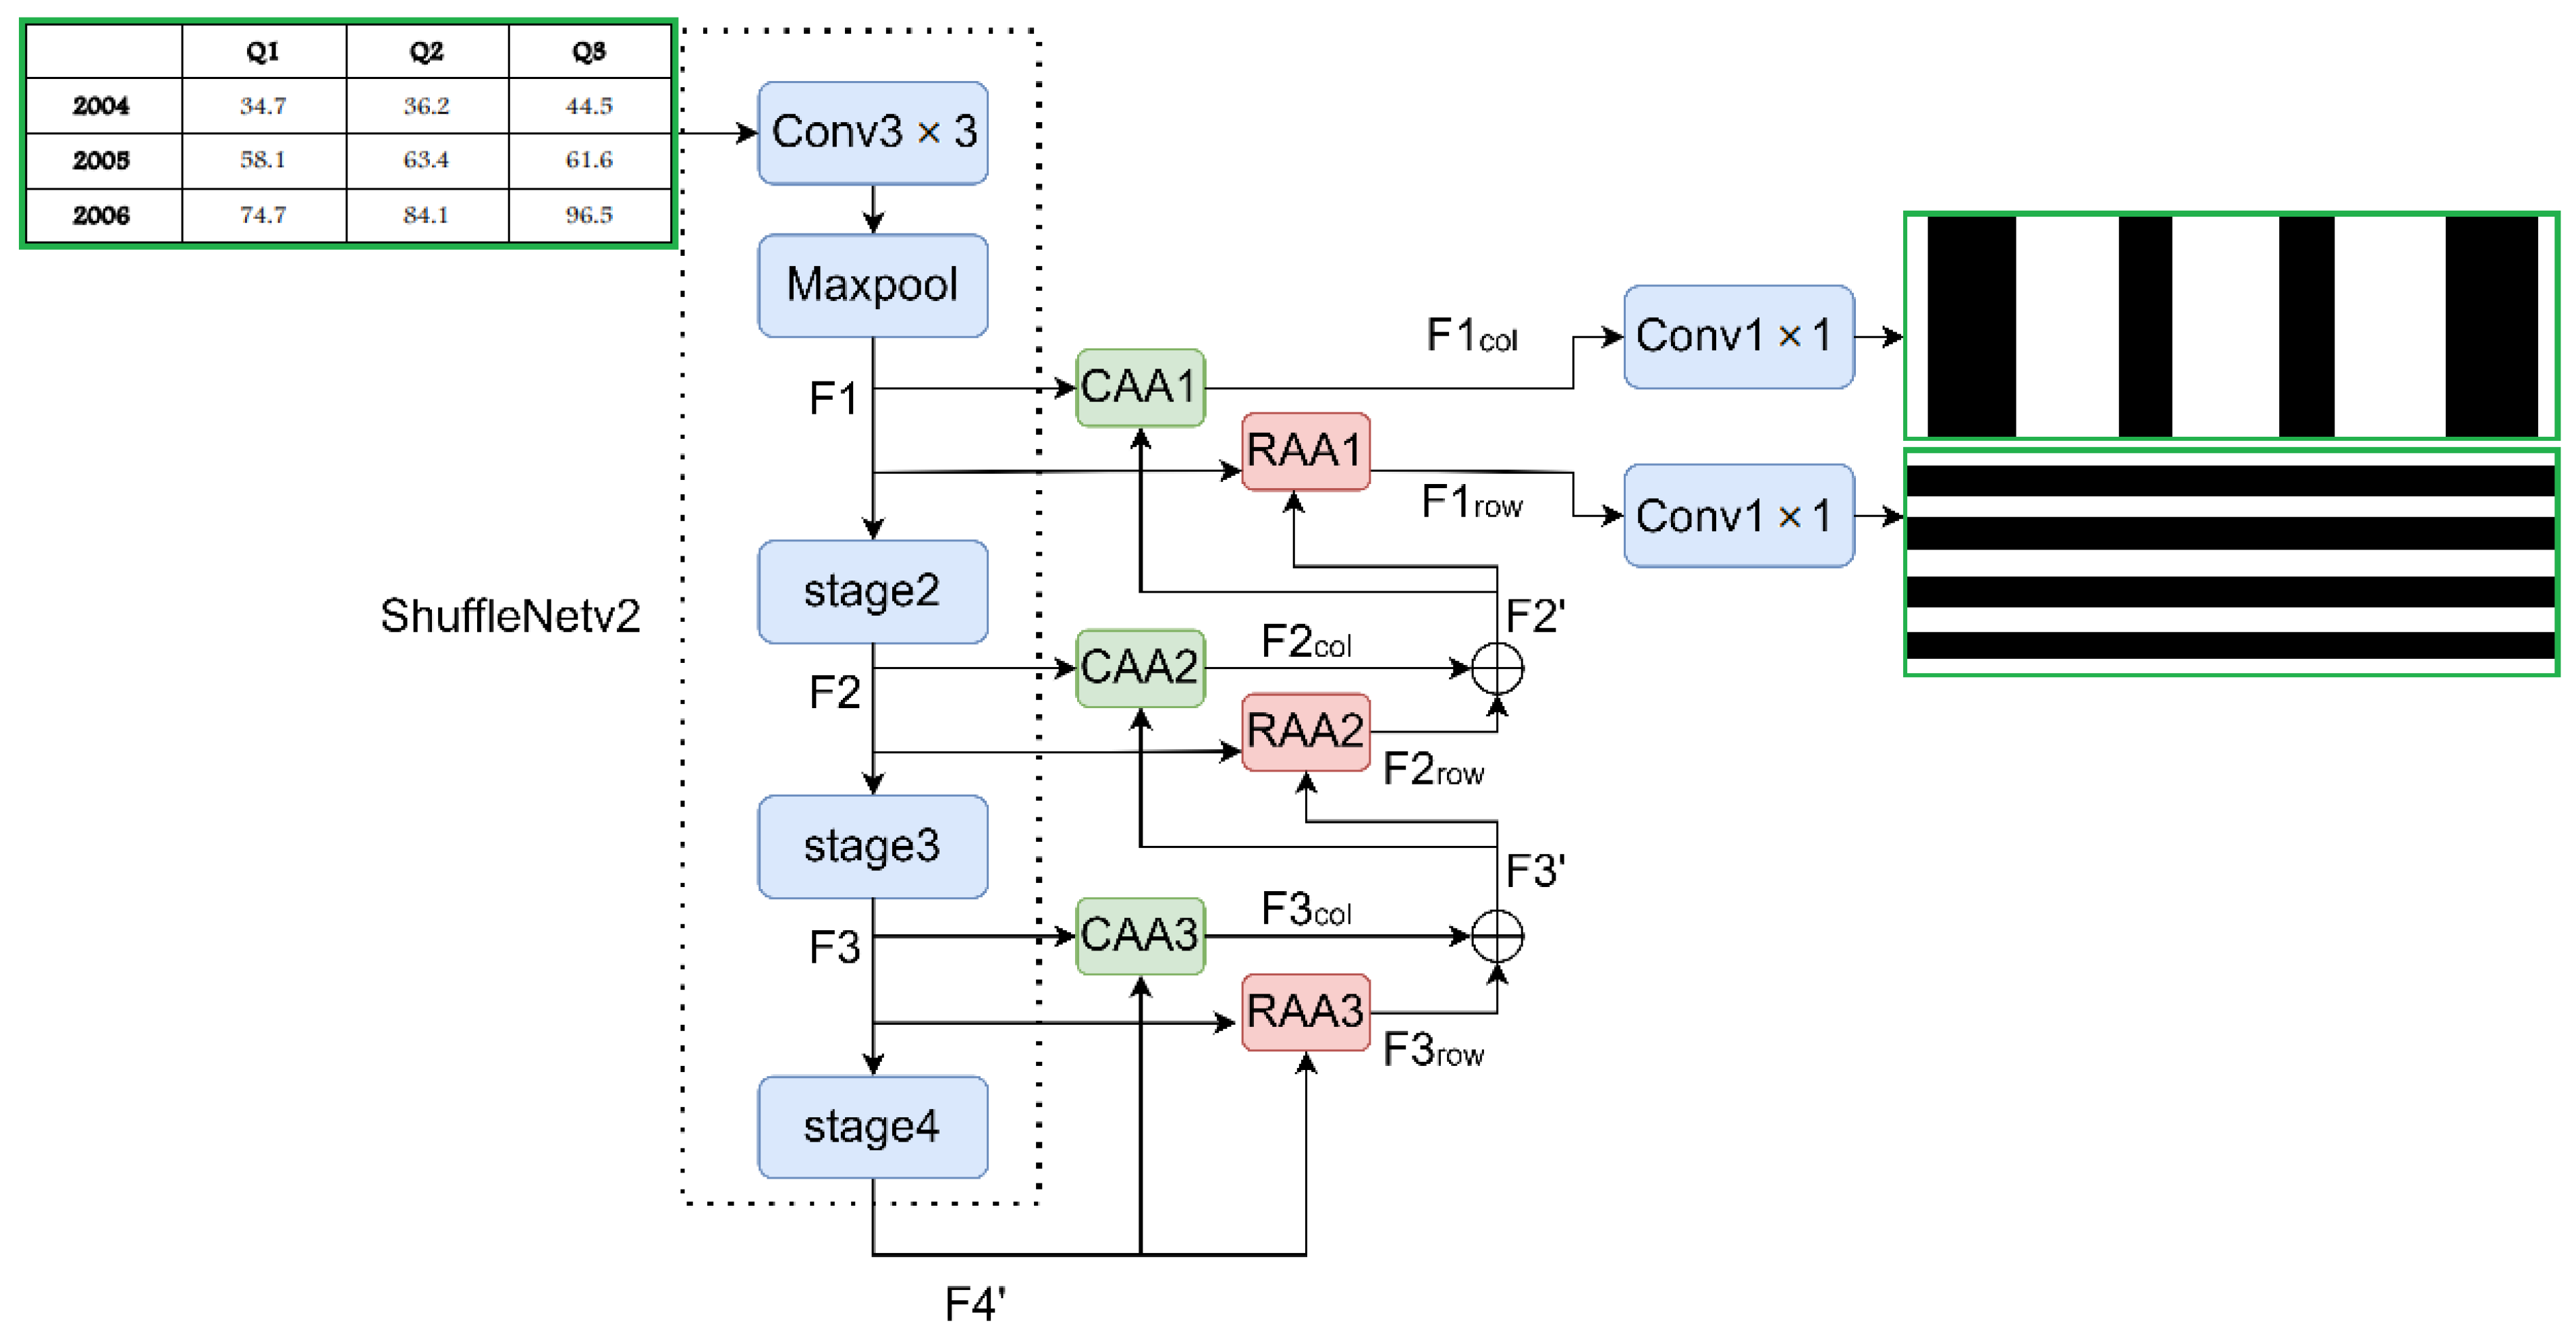
- Finally, we combine the lightweight backbone shufflenetv2 with RAA and CAA modules to propose the end-to-end lightweight table structure identification model LRCAANet.
2. Methods
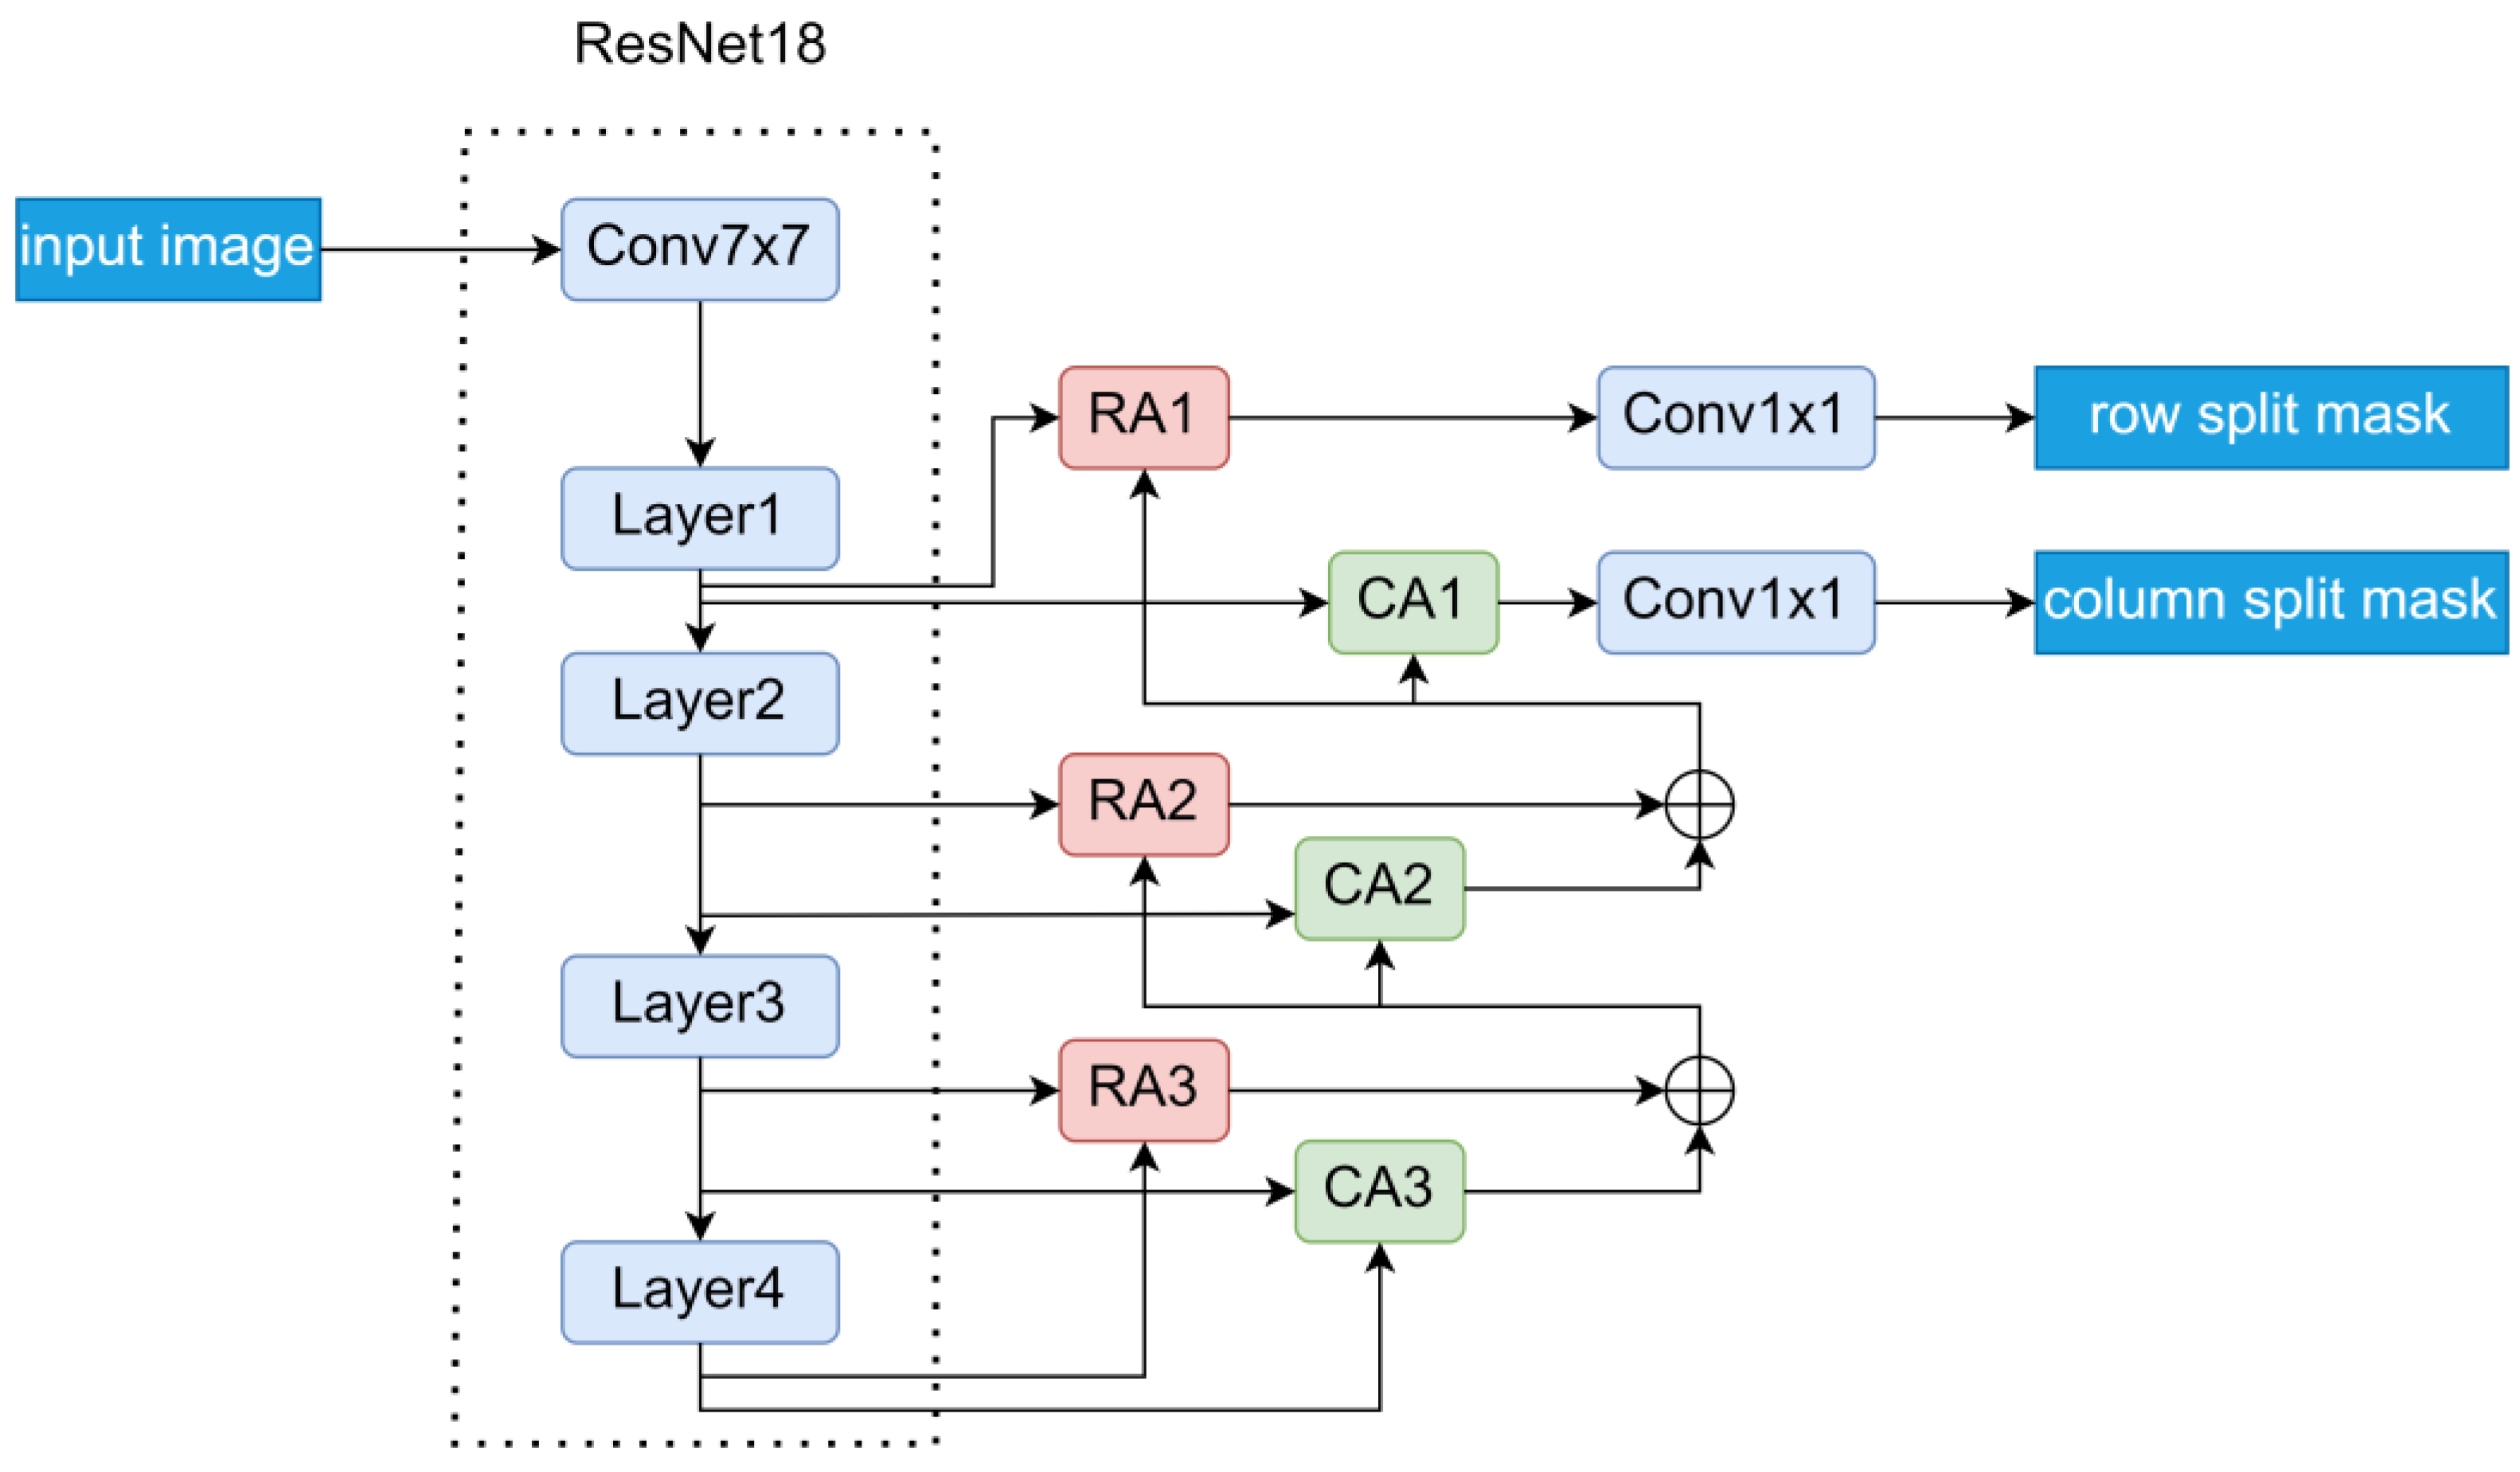
2.1. RCANet Model
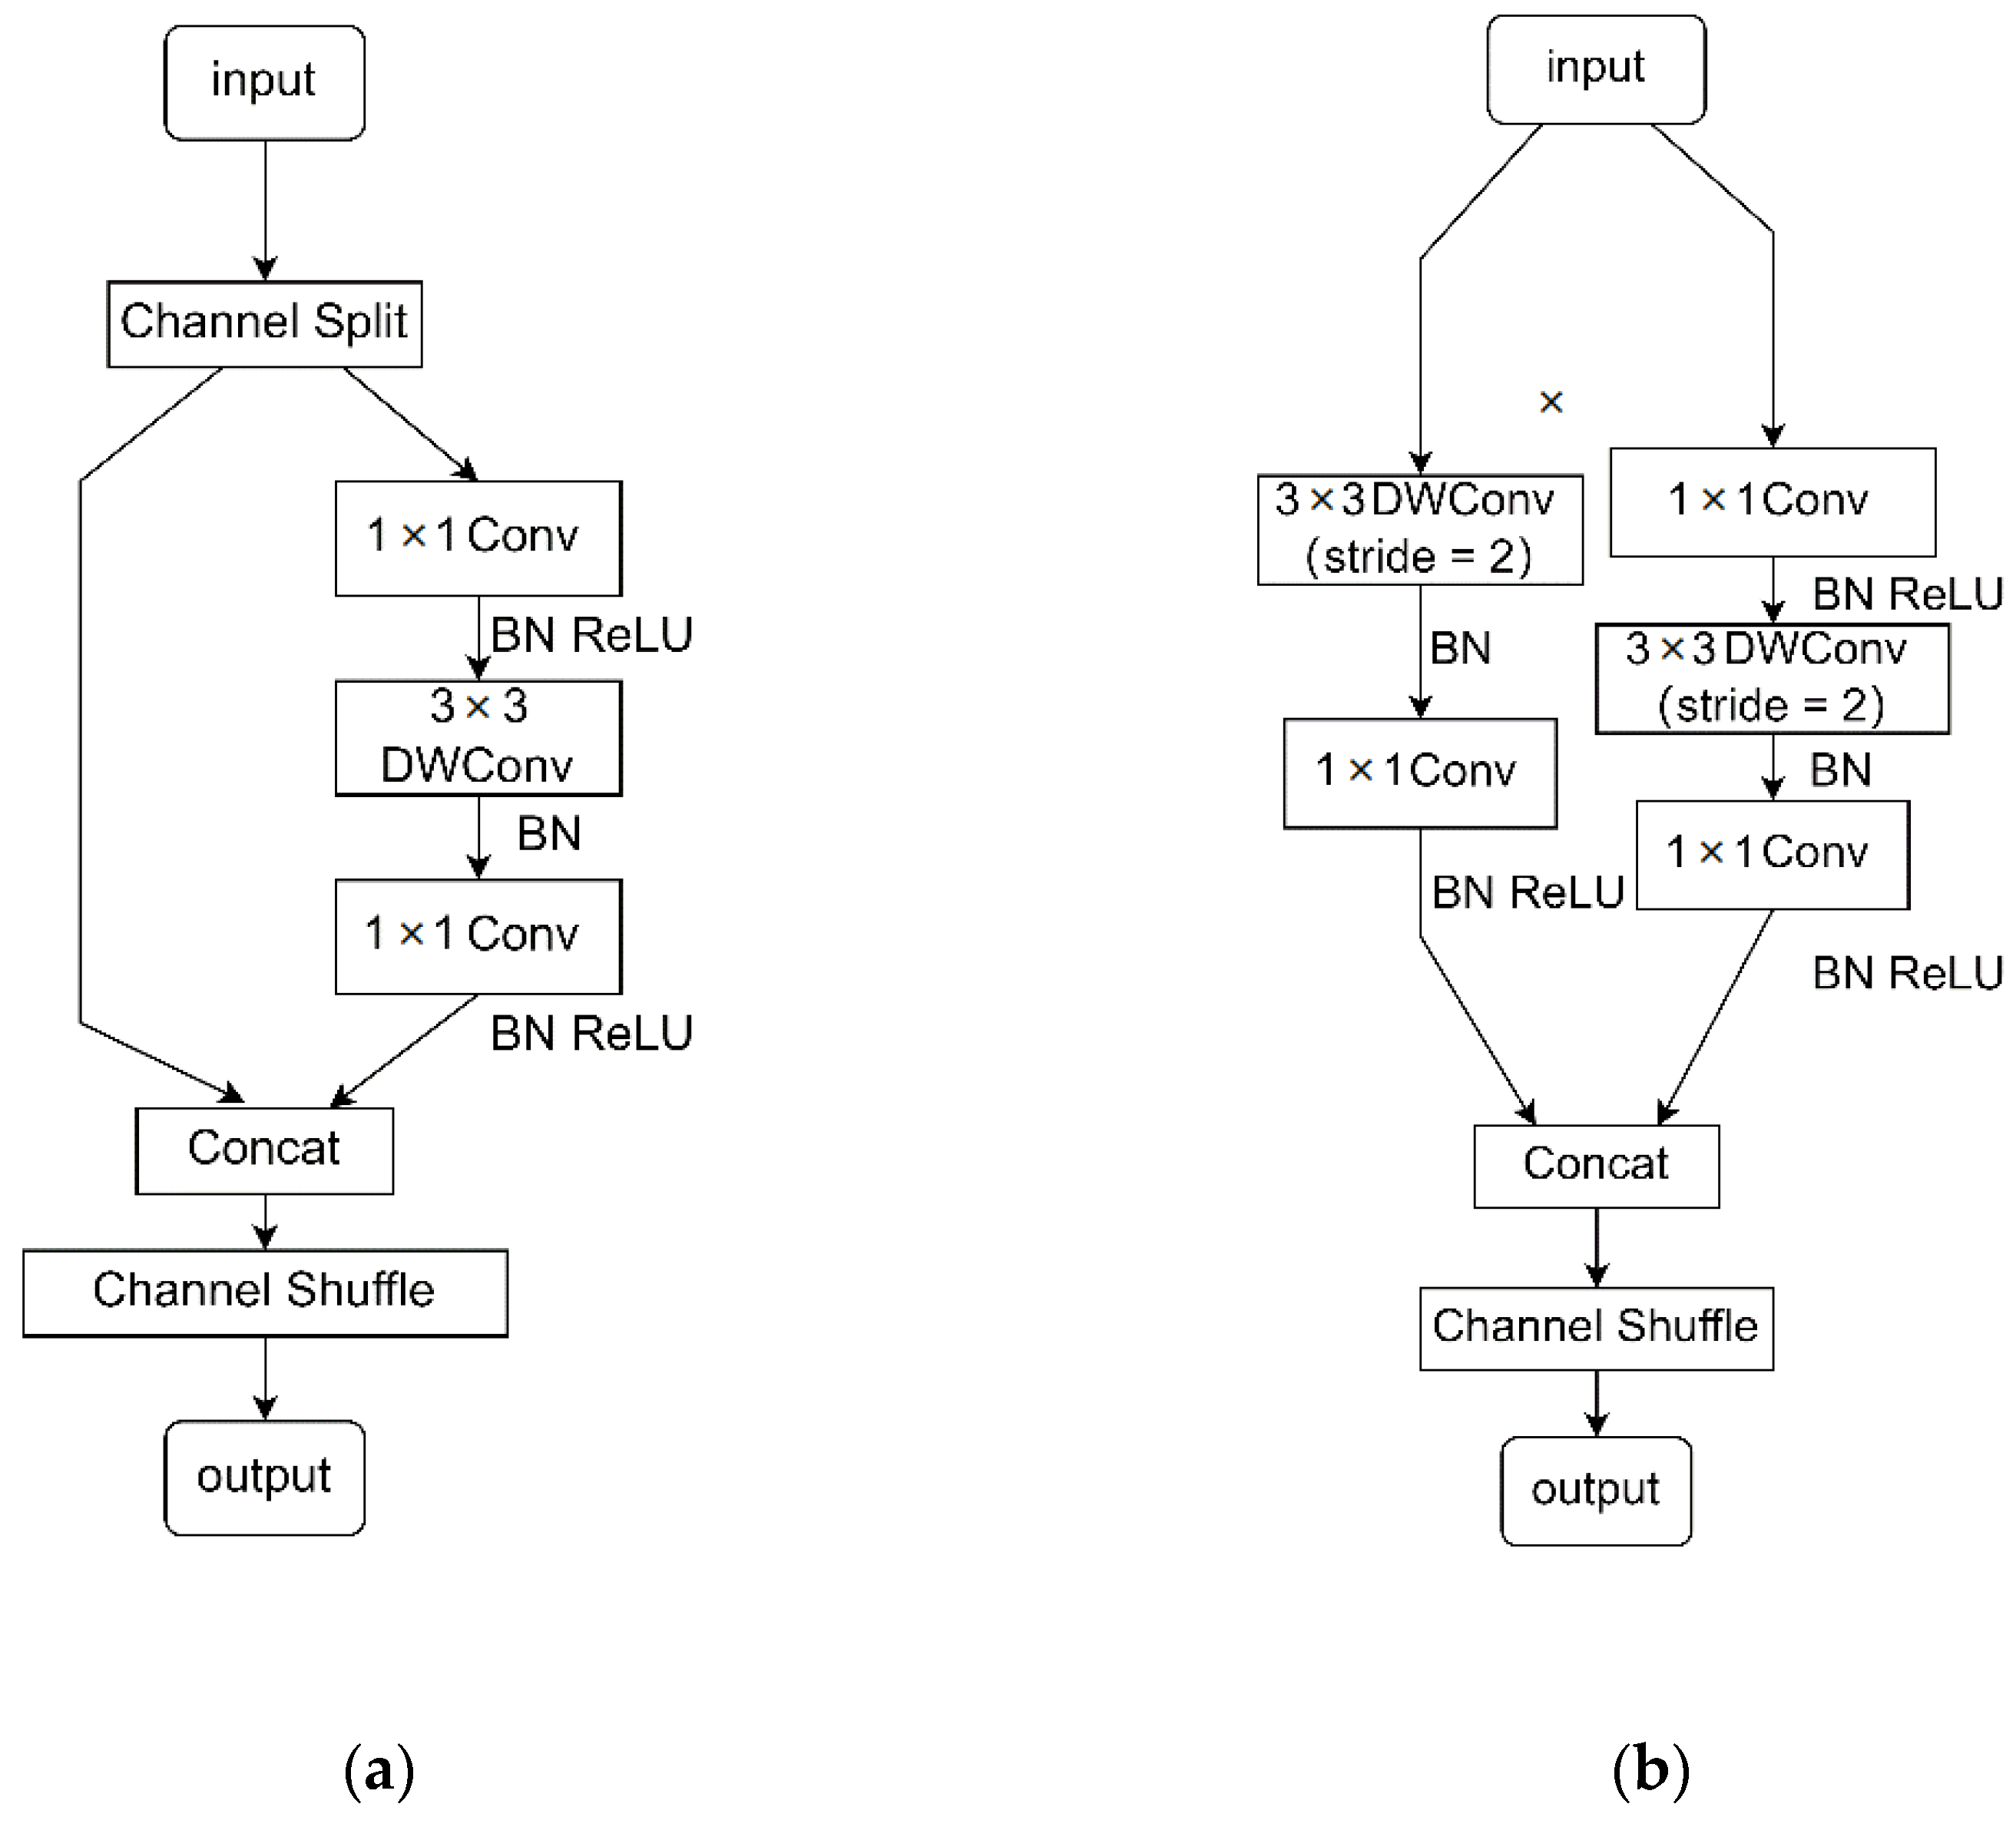
2.2. ShuffleNetv2 Model
2.3. Compression and Optimization Strategy
3. Experimental Results and Analysis
3.1. Experimental Environment and Parameter Setting
3.2. Datasets
3.3. Evaluation Indicators
3.4. Experimental Results and Analysis
4. Conclusions
Author Contributions
Funding
Institutional Review Board Statement
Informed Consent Statement
Data Availability Statement
Conflicts of Interest
References
- Kim, Y.-S.; Lee, K.-H. Extracting Logical Structures from Html Tables. Comput. Stand. Interfaces 2008, 30, 296–308. [Google Scholar] [CrossRef]
- Masuda, H.; Tsukamoto, S.; Yasutomi, S.; Nakagawa, H. Recognition of Html Table Structure. In Proceedings of the IJCNLP, Hainan Island, China, 22–24 March 2004. [Google Scholar]
- Fischer, P.; Smajic, A.; Abrami, G.; Mehler, A. Multi-Type-Td-Tsr–Extracting Tables from Document Images Using a Multi-Stage Pipeline for Table Detection and Table Structure Recognition: From Ocr to Structured Table Representations. In Proceedings of the German Conference on Artificial Intelligence (Künstliche Intelligenz), virtual, 27 September–1 October 2021. [Google Scholar]
- Qiao, L.; Li, Z.; Cheng, Z.; Zhang, P.; Pu, S.; Niu, Y.; Ren, W.; Tan, W.; Wu, F. Lgpma: Complicated Table Structure Recognition with Local and Global Pyramid Mask Alignment. In Proceedings of the International Conference on Document Analysis and Recognition, Lausanne, Switzerland, 5–10 September 2021. [Google Scholar]
- He, K.; Gkioxari, G.; Dollár, P.; Girshick, R. Mask R-Cnn. In Proceedings of the IEEE International Conference on Computer Vision, Venice, Italy, 22–29 October 2017. [Google Scholar]
- Qasim, S.R.; Mahmood, H.; Shafait, F. Rethinking Table Recognition Using Graph Neural Networks. In Proceedings of the 2019 International Conference on Document Analysis and Recognition (ICDAR), Sydney, NSW, Australia, 20–25 September 2019. [Google Scholar]
- Kim, P. Convolutional Neural Network. In MATLAB Deep Learning: With Machine Learning, Neural Networks and Artificial Intelligence; Spring: Berlin/Heidelberg, Germany, 2017; pp. 121–147. [Google Scholar]
- Scarselli, F.; Gori, M.; Tsoi, A.C.; Hagenbuchner, M.; Monfardini, G. The Graph Neural Network Model. IEEE Trans. Neural Netw. 2008, 20, 61–80. [Google Scholar] [CrossRef] [PubMed] [Green Version]
- Xue, W.; Yu, B.; Wang, W.; Tao, D.; Li, Q. Tgrnet: A Table Graph Reconstruction Network for Table Structure Recognition. In Proceedings of the IEEE/CVF International Conference on Computer Vision, Montreal, BC, Canada, 11–17 October 2021. [Google Scholar]
- He, K.; Zhang, X.; Ren, S.; Sun, J. Deep Residual Learning for Image Recognition. In Proceedings of the IEEE Conference on Computer Vision and Pattern Recognition, Las Vegas, NV, USA, 27–30 June 2016. [Google Scholar]
- Kipf, T.N.; Welling, M. Semi-Supervised Classification with Graph Convolutional Networks. arXiv 2016, arXiv:1609.02907. [Google Scholar]
- Khan, S.A.; Khalid, S.M.D.; Shahzad, M.A.; Shafait, F. Table Structure Extraction with Bi-Directional Gated Recurrent Unit Networks. In Proceedings of the 2019 International Conference on Document Analysis and Recognition (ICDAR), Sydney, NSW, Australia, 20–25 September 2019. [Google Scholar]
- Medsker, L.R.; Jain, L.C. Recurrent Neural Networks. Des. Appl. 2001, 5, 64–67. [Google Scholar]
- Mikolov, T.; Karafiát, M.; Burget, L.; Cernocký, J.; Khudanpur, S. Recurrent Neural Network Based Language Model. In Proceedings of the Interspeech 2010, Makuhari, Japan, 26–30 September 2010. [Google Scholar]
- Zaremba, W.; Sutskever, I.; Vinyals, O. Recurrent Neural Network Regularization. arXiv 2014, arXiv:1409.2329. [Google Scholar]
- Dey, R.; Salem, F.M. Gate-Variants of Gated Recurrent Unit (Gru) Neural Networks. In Proceedings of the 2017 IEEE 60th International Midwest Symposium on Circuits and Systems (MWSCAS), Boston, MA, USA, 6–9 August 2017. [Google Scholar]
- Yu, Y.; Si, X.; Hu, C.; Zhang, J. A Review of Recurrent Neural Networks: Lstm Cells and Network Architectures. Neural Comput. 2019, 31, 1235–1270. [Google Scholar] [CrossRef] [PubMed]
- Siddiqui, S.A.; Khan, P.I.; Dengel, A.; Ahmed, S. Rethinking Semantic Segmentation for Table Structure Recognition in Documents. In Proceedings of the 2019 International Conference on Document Analysis and Recognition (ICDAR), Sydney, Australia, 20–25 September 2019. [Google Scholar]
- Shen, X.K.; Bao, Y.L.; Zhou, Y.; Liu, W. Rcanet: A Rows and Columns Aggregated Network for Table Structure Recognition. In Proceedings of the 2022 3rd Information Communication Technologies Conference (ICTC), Nanjing, China, 6–8 May 2022; pp. 112–116. [Google Scholar]
- Nassar, A.; Livathinos, N.; Lysak, M.; Staar, P. Tableformer: Table Structure Understanding with Transformers. In Proceedings of the IEEE/CVF Conference on Computer Vision and Pattern Recognition, New Orleans, LO, USA, 18–24 June 2022. [Google Scholar]
- Ma, C.; Lin, W.; Sun, L.; Huo, Q. Robust Table Detection and Structure Recognition from Heterogeneous Document Images. Pattern Recognit. 2023, 133, 109006. [Google Scholar] [CrossRef]
- Raja, S.; Mondal, A.; Jawahar, C. Table Structure Recognition Using Top-Down and Bottom-up Cues. In Proceedings of the European Conference on Computer Vision, Glasgow, UK, 23–28 August 2020. [Google Scholar]
- Ye, J.; Qi, X.; He, Y.; Chen, Y.; Gu, D.; Gao, P.; Xiao, R. Pingan-Vcgroup’s Solution for Icdar 2021 Competition on Scientific Literature Parsing Task B: Table Recognition to Html. arXiv 2021, arXiv:2105.01848. [Google Scholar]
- Ma, N.; Zhang, X.; Zheng, H.-T.; Sun, J. Shufflenet V2: Practical Guidelines for Efficient Cnn Architecture Design. In Proceedings of the European Conference on Computer Vision (ECCV), Munich, Germany, 8–14 September 2018. [Google Scholar]
- Hu, J.; Shen, L.; Sun, G. Squeeze-and-Excitation Networks. In Proceedings of the IEEE Conference on Computer Vision and Pattern Recognition, Salt Lake City, UT, USA, 18–22 June 2018. [Google Scholar]
- Kingma, D.P.; Ba, J. Adam: A Method for Stochastic Optimization. arXiv 2014, arXiv:1412.6980. [Google Scholar]
- Göbel, M.; Hassan, T.; Oro, E.; Orsi, G. Icdar 2013 Table Competition. In Proceedings of the 2013 12th International Conference on Document Analysis and Recognition, Washington, DC, USA, 25–28 August 2013. [Google Scholar]
- Bradski, G. The Opencv Library. Dr. Dobb’s J. Softw. Tools Prof. Program. 2000, 25, 120–123. [Google Scholar]


| Model Name | Model Parameters (Million) |
|---|---|
| ResNet18 | 11.69 |
| ShuffleNetv2 | 1.37 |
| Layer | Output Size | Output Channels |
|---|---|---|
| Conv1 | W/2 × H/2 | 64 |
| Layer1 | W/4 × H/4 | 64 |
| Layer2 | W/8 × H/8 | 128 |
| Layer3 | W/16 × H/16 | 256 |
| Layer4 | W/32 × H/32 | 512 |
| Layer | Output Size | Output Channels |
|---|---|---|
| Conv1 | W/2 × H/2 | 24 |
| MaxPool | W/4 × H/4 | 24 |
| Stage2 | W/8 × H/8 | 48 |
| Stage3 | W/16 × H/16 | 96 |
| Stage4 | W/32 × H/32 | 192 |
| Category | Version |
|---|---|
| CPU | Intel Xeon W-2133 |
| GPU | NVIDIA GeForce GTX 3090 |
| RAM | 32 GB |
| CUDA | CUDA 11.1 |
| Operating system | Ubuntu 20.04.1 |
| Pytorch | torch 1.10.1 |
| Hard-disk | 1 TB SSD |
| Model | Row | Column | Average | ||||||
|---|---|---|---|---|---|---|---|---|---|
| P | R | F1 | P | R | F1 | P | R | F1 | |
| RCANet (Recurrence) | 0.9586 | 0.9534 | 0.9560 | 0.9654 | 0.9922 | 0.9786 | 0.9620 | 0.9728 | 0.9673 |
| LRCANet | 0.9066 | 0.9152 | 0.9109 | 0.9166 | 0.9818 | 0.9481 | 0.9116 | 0.9485 | 0.9295 |
| LRCAANet | 0.9300 | 0.9434 | 0.9366 | 0.9348 | 0.9922 | 0.9626 | 0.9324 | 0.9678 | 0.9496 |
| Model | SE Layers | Row | Column | Average | |||||||
|---|---|---|---|---|---|---|---|---|---|---|---|
| Row | Column | P | R | F1 | P | R | F1 | P | R | F1 | |
| LRCANet | 0 | 0 | 0.9066 | 0.9152 | 0.9109 | 0.9166 | 0.9818 | 0.9481 | 0.9116 | 0.9485 | 0.9295 |
| LRCANet | 1 | 1 | 0.9300 | 0.9434 | 0.9366 | 0.9348 | 0.9922 | 0.9626 | 0.9324 | 0.9678 | 0.9496 |
| LRCANet | 2 | 1 | 0.9253 | 0.9284 | 0.9268 | 0.9329 | 0.9766 | 0.9539 | 0.9291 | 0.9525 | 0.9404 |
| LRCANet | 2 | 2 | 0.8806 | 0.9075 | 0.8938 | 0.9382 | 0.9870 | 0.9620 | 0.9094 | 0.9473 | 0.9279 |
| Model Volume (MByte) | Model Parameters (Million) | Model Calculation Volume (GFLOPs) | |
|---|---|---|---|
| RCANet (Recurrence) | 45.5 | 11.35 | 16.62 |
| LRCAANet | 0.81 | 0.17 | 0.64 |
Disclaimer/Publisher’s Note: The statements, opinions and data contained in all publications are solely those of the individual author(s) and contributor(s) and not of MDPI and/or the editor(s). MDPI and/or the editor(s) disclaim responsibility for any injury to people or property resulting from any ideas, methods, instructions or products referred to in the content. |
© 2023 by the authors. Licensee MDPI, Basel, Switzerland. This article is an open access article distributed under the terms and conditions of the Creative Commons Attribution (CC BY) license (https://creativecommons.org/licenses/by/4.0/).
Share and Cite
Zhang, T.; Sui, Y.; Wu, S.; Shao, F.; Sun, R. Table Structure Recognition Method Based on Lightweight Network and Channel Attention. Electronics 2023, 12, 673. https://doi.org/10.3390/electronics12030673
Zhang T, Sui Y, Wu S, Shao F, Sun R. Table Structure Recognition Method Based on Lightweight Network and Channel Attention. Electronics. 2023; 12(3):673. https://doi.org/10.3390/electronics12030673
Chicago/Turabian StyleZhang, Tao, Yi Sui, Shunyao Wu, Fengjing Shao, and Rencheng Sun. 2023. "Table Structure Recognition Method Based on Lightweight Network and Channel Attention" Electronics 12, no. 3: 673. https://doi.org/10.3390/electronics12030673